Palo Alto Unified Elementary 2013-2014 Main Report · PDF filePalo Alto Unified Elementary...
28
Palo Alto Unified Elementary 2013-2014 Main Report
Transcript of Palo Alto Unified Elementary 2013-2014 Main Report · PDF filePalo Alto Unified Elementary...

Palo Alto UnifiedElementary2013-2014
Main Report
Palo Alto Unified2013-14
Page 1Main Report - Module A: Core
This report was prepared by WestEd, a research, development, and service agency, in collaboration withDuerr Evaluation Resources, under contract from the California Department of Education CoordinatedSchool Health and Safety Office. For contract information, contact:
Hilva ChanCalifornia Department of EducationCoordinated School Health and Safety Office1430 N StreetSacramento, CA [email protected]
Recommended citation:Palo Alto Unified School District. California Healthy Kids Survey, 2013-14: Main Report. San Fran-cisco: WestEd Health & Human Development Program for the California Department of Education.

PREFACE
This report provides the detailed results for each question from this school/district’s 2013–14 CaliforniaHealthy Kids Survey (CHKS), presented in tables organized by topic.
To help in understanding and interpreting these results, the CHKS Guidebook to survey content discussesthe significance of each question.1 Several other tools to help in data use are also available, as describedbelow. For additional information and resources, visit the survey website: chks.wested.org.
The CHKS, along with its two companion surveys — California School Climate Survey (CSCS) for staffand the California School Parent Survey (CSPS) is a service of the California Department of Education(CDE). These three surveys form the California School Climate, Health, and Learning Surveys (Cal-SCHLS), the largest, most comprehensive effort in the nation to assess students, staff, and parents atthe local level on a regular basis to provide key data on school climate, learning supports and barriers,stakeholder engagement; as well as overall youth development, health, and well-being.
The results of this student survey should be compared to those obtained from school, staff, and parentsurveys. It is important to determine how consistent are student, staff, and parent perceptions and expe-riences. Appendix 5 of Workbook for Improving School Climate provides a crosswalk between student,staff, and parent survey questions to facilitate this comparison.2
SURVEY PURPOSE
The California Department of Education (CDE) has funded the CHKS since 1997 to provide data thatwould assist schools in: (1) fostering positive school climates and engagement in learning; (2) preventingyouth health-risk behaviors and other barriers to academic achievement; and (3) promoting positive youthdevelopment, resilience, and well-being. A thorough understanding of the scope and nature of youthbehaviors, attitudes, and learning conditions is essential to guide school improvement efforts and to alsodevelop effective prevention, health, and youth development programs. These surveys grew out of CDE’scommitment to helping schools promote the successful cognitive, social, and emotional development ofall students and create more positive, engaging school environments for students, staff, and parents.
SURVEY CONTENT OVERVIEW
The CHKS consists of a required general set of questions. Districts may also add their own questionsof local interest. The survey consists of a broad range of key questions identified by an expert advi-sory committee considered most important for schools to administer to guide improvement of academic,health, and prevention programs and the promotion of student achievement, positive development, andwell-being.3 The primary focus of the survey is assessing student perceptions and experiences relatedto school climate and engagement, learning supports, and health-related, non-academic learning barriers(e.g., substance use, bullying and violence, and poor physical and mental health).
1Guidebook to the California Healthy Kids Survey, Part II: Survey Content (chks.wested.org/training support)2See californias3.wested.org/resources/schoolclimateworkbook-2ndedition final.pdf.3The CHKS Guidebook to Survey Administration contains detailed information about the content of the survey.
i

School-Related Core Content
To support school improvement efforts, the majority of questions on the CHKS assess school perfor-mance, engagement, climate, performance, and experiences. The survey provides self-report data on:
• School connectedness;
• The level of which students experience caring adult relationships, high expectations, and op-portunities for meaningful participation at school, three fundamental developmental supports(protective factors) that promote positive academic outcomes; and
• Perceived safety and frequency of, and reasons for, harassment and bullying at school.
SURVEY ADMINISTRATION AND SAMPLING
School staff administered the survey, following detailed instructions provided by CDE that were designedto assure the protection of all student and parental rights to privacy and to maintain confidentiality.Students were surveyed only with the consent of parents or guardians. Each student’s participation wasvoluntary, anonymous, and confidential. Table A1.1 gives the target sample of students and the finalnumber and percent of students who completed the survey (the participation response rate).
THE REPORT
The tables in the Main CHKS Report provide the percentages responding to each question responseoption by grade level, organized by topic. Because it is just as important to identify the positive behaviorsof youth as it is to identify the risks they face, the tables include the percentages of youth who do notengage in each risk behavior. Percentages are rounded off to the nearest whole number.
UNDERSTANDING AND USING THE DATA
Several guides, workshops, and other aids are available to help you understand and use the survey results.These are described and made available on the survey website. Three are particularly important:
• To help in understanding and interpreting these results, Guidebook to the California HealthyKids Survey, Part II: Survey Content (chks.wested.org/training support) provides a detailed ex-planation of each question and its significance (why it was asked) and the potential implicationsof the results for programs.
• The Guidebook to the California Healthy Kids Survey, Part III: Data Use and Dissemination(chks.wested.org/training support) provides a step-by-step process for reviewing, analyzing,and disseminating survey results as part of a data-driven decision-making process for programimprovement. Free call-in data use workshops are offered as well.
• The Workbook for Improving School Climate and Closing the Achievement Gap provides apractical guide to using the data in the framework of improving academic achievement andwell-being among all students and closing the achievement gap. It provides examples of how touse the data to improve practice and policy.4
Care must be particularly taken to understand the factors that can impact the quality, validity, and gen-eralizability of the results, such as changes that occur in survey content, administration, and/or sample
4The Guidebooks may be downloaded from chks.wested.org/training support, and the Workbook from chks.wested.org/about/ctag.
ii
characteristics between administrations. The following are a few of the key issues that should be kept inmind. A more detailed discussion of these topics can be found in the CHKS Data Use and DisseminationGuidebook.
Sample Characteristics
Among the most important factors affecting the quality of survey results is the level of student participa-tion. The validity and representativeness of the results will be adversely affected if the student responserate is lower than 60%. One indication of the survey’s representativeness is how accurately the samplereflects the gender and ethnic composition of the district’s student enrollment. Even if the response rateis low, the results provide an indication of what those students who did respond felt about the school andtheir experiences and behavior.
Changes Between Surveys
Many factors may account for changes in results from administration to administration besides realchanges in behavior, attitudes, or experiences among students. The change could be due to differencesover time in the characteristics or size of the sample of students who completed the survey, or changesin the questions themselves, or differences in the time period in which the survey was administered (e.g.,some risk behaviors tend to increase with age, and be higher after holidays or even a social event).
NEXT STEPS
Receiving this report is just a beginning step in a data-driven, decision-making process. The follow-ing describes actions you can take to analyze and use the results and provide additional information tosupport school- and program- improvement efforts.
Compare with Other Data Sources
CHKS results will be enriched if analyzed in the context of data from the California School ClimateSurvey and other sources, particularly in identifying consistent patterns. Other data typically collectedin effectiveness studies of school climate include number and kinds of discipline referrals, school demo-graphic information, school vandalism costs, and behavioral observations in classrooms.
Discuss with Students, Staff, and Parents
Discuss the results with both students and staff to explore the meaning of the results in more depthand to obtain their input into how the school might better meet the needs identified. This is especiallyimportant because it communicates to students that you value their input into how to improve the schooland gives them an opportunity for meaningful participation. This helps improve student perceptions ofthe developmental supports and opportunities that the school offers and enhances school connectedness.Cal-SCHLS staff can provide information on conducting structured group Listening to Students fishbowlsdesigned to explore with students, as staff observe, the meaning of survey results and obtain their inputon how to address the needs identified by the survey.
Equally important is communicating the results and your plans for making improvements to parents.This fosters parent involvement and collaboration in addressing the identified needs, and also supportfor the survey, important for improving student participation rates. The importance and value of this hasbeen made even greater by the parent involvement requirements of the Local Control and AccountabilityPlan.
iii
ACKNOWLEDGMENTS
The CHKS and this report were developed by WestEd, in collaboration with Duerr Evaluation Re-sources, under contract from the California Department of Education Coordinated School Health andSafety Office. For more information, call the toll-free helpline at 888.841.7536, or visit the website atchks.wested.org.
Gregory Austin, Ph.D.WestEd
Tom HermanAdministrator, Coordinated School Health and Safety Office
California Department of Education
iv

Sample Characteristics
Note: Tables 3.1 through 5.3 include results by gender.
Table 1.1Student Sample Characteristics
Grade 5Student Sample Size Target Sample 1009 Final Sample (Number of Respondents) 698Average Response Rate 69%
Palo Alto Unified Page 12013-2014 Main Report - Elementary

Table 2.1Age of Sample
Grade 5 %
7 years old, or younger than 7 08 years old 09 years old 210 years old 8411 years old 1312 years old 113 years old, or older than 13 0Question ES 2, 4: How old are you? What grade are you in?
Table 2.2Gender of Sample
Grade 5 %
Female 51Male 49Question ES 3: Are you female or male?
Palo Alto Unified Page 22013-2014 Main Report - Elementary

Table 2.3Number of Times Moved, Past Year
Grade 5 %
0 times 681 time 202 times or more times 12Question ES 5: During the past year, how many times have you moved (changed where you live)?
Table 2.4Perceived Ability with School Work
Grade 5 %
One of the best students 23Better than most students 30About the same as others 41Don't do as well as most others 6Question ES 16: How well do you do in your school work?
Table 2.5Military
Grade 5 %
No 92Yes 2Don't know 6Question ES 65: Is your father, mother, or caretaker currently in the military (Army, Navy, Marines,Air Force, National Guard, or Reserves)?
Palo Alto Unified Page 32013-2014 Main Report - Elementary

Alcohol and Other Drug (AOD) Use
Table 3.1
Ever Used Alcohol or Other Drugs, Lifetime
Grade 5
Female % Male % Total %
Alcohol, one or two sips na na naAlcohol, a full glass na na naInhalants (to get high) na na naMarijuana na na naNone of the above na na naAny of the above na na naQuestions ES 33-35: Have you ever drunk beer, wine, or other alcohol? Have you ever sniffed something throughyour nose to get "high"? Have you ever smoked any marijuana (pot, grass, weed)?
Table 3.2
Any Alcohol Use, Past Month
Grade 5
Female % Male % Total %
No na na naYes, I drank one or two sips na na naYes, I drank a full glass na na naQuestion ES 40: In the past month, did you drink any beer, wine or other alcohol?
Palo Alto Unified Page 42013-2014 Main Report - Elementary

Table 3.3
Any AOD Use Before/During School, Lifetime
Grade 5
Female % Male % Total %
No na na naYes na na naQuestion ES 36: Have you ever used alcohol or an illegal drug like marijuana before school or at school?
Table 3.4
Perception of Health Risk of Alcohol and Marijuana Use
Grade 5
Female % Male % Total %
Alcohol No, not bad na na na Yes, a little bad na na na Yes, very bad na na naMarijuana No, not bad na na na Yes, a little bad na na na Yes, very bad na na na I don't know what marijuana is na na naQuestion ES 38-39: Do you think drinking alcohol (beer, wine, liquor) is bad for a person's health? Do you think using marijuana (pot, grass, weed) is bad for a person's health?
Palo Alto Unified Page 52013-2014 Main Report - Elementary

Tobacco Use
Table 4.1
Lifetime and Current Use of Cigarettes and Smokeless Tobacco
Grade 5
Female % Male % Total %
Ever smoked a cigarette na na na Part of a cigarette, like one or two puffs na na na A whole cigarette na na naSmoked a cigarette in the past month na na naEver chewed tobacco or snuff na na naQuestions ES 31, 41, 32: Have you ever… In the past month, did you…
Table 4.2
Perception of Health Risk of Cigarette Smoking
Grade 5
Female % Male % Total %
No, not bad na na naYes, a little bad na na naYes, very bad na na naQuestion ES 37: Do you think smoking cigarettes is bad for a person's health?
Palo Alto Unified Page 62013-2014 Main Report - Elementary

Violence and Safety
Table 5.1
Perceived Feeling Safe At or Outside of School
Grade 5
Female % Male % Total %
Do you feel safe at school? No, never 1 2 1 Yes, some of the time 5 7 6 Yes, most of the time 24 30 27 Yes, all of the time 70 62 66Do you feel safe outside of school? No, never 1 3 2 Yes, some of the time 8 12 10 Yes, most of the time 51 50 50 Yes, all of the time 40 35 38Question ES 29, 30: Do you feel safe at school? Do you feel safe outside of school?
Palo Alto Unified Page 72013-2014 Main Report - Elementary

Table 5.2Frequency of Being Harassed on School Property
Grade 5 Female % Male % Total %
Been hit or pushed No, never 75 60 67 Yes, some of the time 23 36 29 Yes, most of the time 1 4 3 Yes, all of the time 1 0 1Mean rumors spread about you No, never 68 69 69 Yes, some of the time 28 28 28 Yes, most of the time 3 3 3 Yes, all of the time 1 0 1Question ES 23, 24: Do other kids hit or push you at school when they are not just playing around? Do other kids at school spread mean rumors or lies about you?
Table 5.3Frequency of Harassing on School Property, Past Year
Grade 5 Female % Male % Total %
Have hit or pushed other kids 0 times 84 68 76 1 time 12 19 15 2 times 2 9 5 3 or more times 3 4 3Have spread mean rumors about other kids 0 times 83 85 84 1 time 15 12 13 2 times 1 2 1 3 or more times 1 1 1Question ES 21, 22: During the past year, how many times have you...hit or pushed other kids at school when you were not playing around? …spread mean rumors or lies about other kids at school?
Palo Alto Unified Page 82013-2014 Main Report - Elementary

Table 5.4
Cyber BullyingGrade 5
%No, never 96Yes, some of the time 3Yes, most of the time 0Yes, all of the time 0Question ES 25: Do other kids at school spread mean rumors or lies about you on the internet (i.e. Facebook™, MySpace™, email, instant message)?
Table 5.5
Weapons (Gun or Knife) on School Property, Past YearGrade 5
%Brought weapon to school No na Yes naSaw another kid with a weapon at school No na Yes naQuestion ES 26,27: During the past year… did you ever bring a gun or knife to school? …have you everseen another kid with a gun or knife at school?
Table 5.6
Frequency of Being Home Without Adult SupervisionGrade 5
%No, never 57Yes, some of the time 36Yes, most of the time 6Yes, all of the time 1Question ES 28: Are you home alone after school?
Palo Alto Unified Page 92013-2014 Main Report - Elementary

Table 5.7
Frequency of Seat Belt and Helmet UseGrade 5
%
When you ride in a car do you wear a seat belt?
No, never 0 Yes, some of the time 1 Yes, most of the time 10 Yes, all of the time 89
When you ride a bicycle do you wear a helmet?
I do not ride a bicycle 5 No, never 0 Yes, some of the time 4 Yes, most of the time 8 Yes, all of the time 84Question ES 7, 8: When you ride in a car do you wear a seat belt? When you ride a bicycle do you wear a helmet?
Palo Alto Unified Page 102013-2014 Main Report - Elementary

Physical Health
Table 6.1
Breakfast ConsumptionGrade 5
%No 3Yes 97Question ES 6: Did you eat breakfast this morning?
Table 6.2
Exercise During WeekGrade 5
%0 days 21 day 32 days 83 days 134 days 165 days 196 or 7 days 40Question ES 51: How many days each week do you exercise, dance, or play sports?
Palo Alto Unified Page 112013-2014 Main Report - Elementary

Table 6.3Frequency of Daily Television Watching and Video Game Playing
Grade 5 %
None, I didn't watch TV yesterday 40Less than 1 hour 29About 1 hour 17About 2 hours 113 or more hours 5Question ES 54: Yesterday, how much time did you spend watching TV or playing video games?
Table 6.4
Body ImageGrade 5
%Do you think you are… Too skinny 9 About right 83 Too fat 8Are you doing anything to try to lose weight? No 71 Yes 29Ever been teased about your body at school? No 83 Yes 17Question ES 48-50: Do you think you are too skinny, about right, or too fat? Are you doing anything to tryto lose weight? Have other kids at school ever teased you about what your body looks like?
Palo Alto Unified Page 122013-2014 Main Report - Elementary

Table 6.5
Students with AsthmaGrade 5
%No naYes naQuestion ES 53: Has a parent or some other adult ever told you that you have asthma?
Table 6.6
Asthma Symptoms While Not ExercisingGrade 5
%No naYes naQuestion ES 52: When not exercising, do you ever have trouble breathing (for example, shortness-of-breath, wheezing, or a sense of tightness in your chest)?
Palo Alto Unified Page 132013-2014 Main Report - Elementary
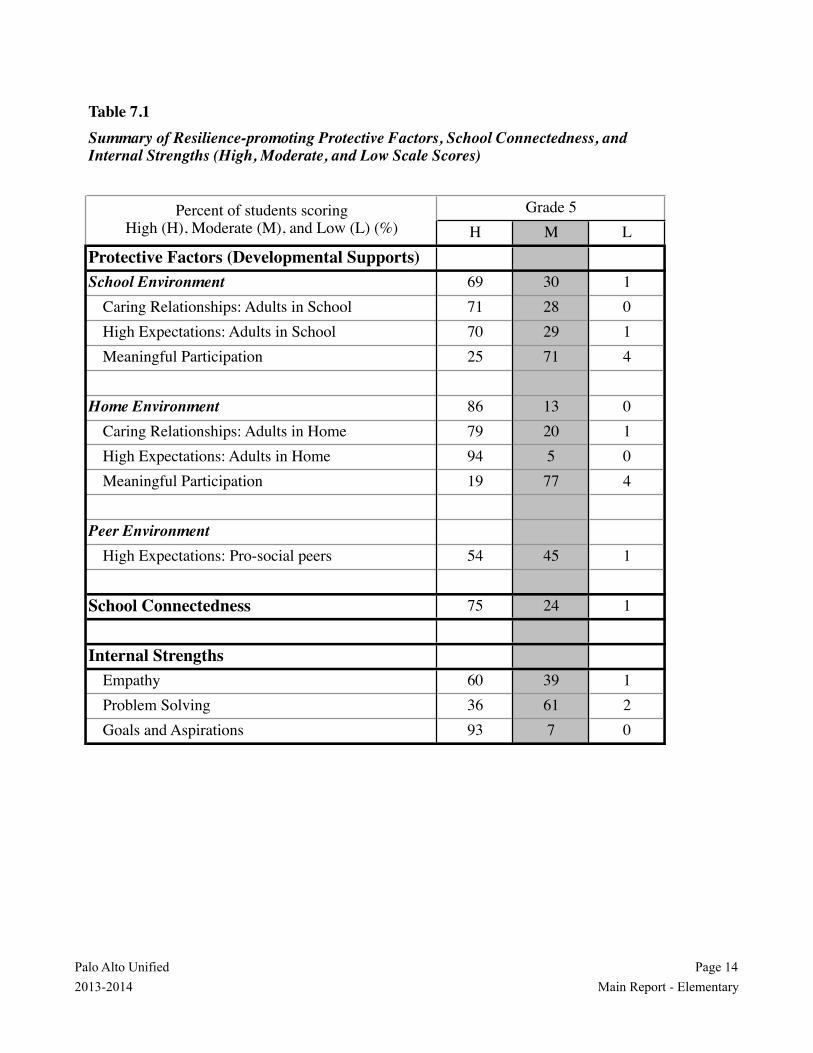
Table 7.1
H M LProtective Factors (Developmental Supports)School Environment 69 30 1
Caring Relationships: Adults in School 71 28 0High Expectations: Adults in School 70 29 1Meaningful Participation 25 71 4
Home Environment 86 13 0Caring Relationships: Adults in Home 79 20 1High Expectations: Adults in Home 94 5 0Meaningful Participation 19 77 4
Peer EnvironmentHigh Expectations: Pro-social peers 54 45 1
School Connectedness 75 24 1
Internal Strengths Empathy 60 39 1Problem Solving 36 61 2Goals and Aspirations 93 7 0
Palo Alto Unified Page 142013-2014 Main Report - Elementary
Summary of Resilience-promoting Protective Factors, School Connectedness, and Internal Strengths (High, Moderate, and Low Scale Scores)
Percent of students scoring High (H), Moderate (M), and Low (L) (%)
Grade 5

Table A7.2
School Connectedness Scale QuestionsGrade 5
%I feel close to people in this schoolNo, never 3Yes, some of the time 22Yes, most of the time 47Yes, all of the time 28I am happy to be at this schoolNo, never 1Yes, some of the time 11Yes, most of the time 41Yes, all of the time 48I feel like I am part of this schoolNo, never 2Yes, some of the time 10Yes, most of the time 27Yes, all of the time 61The teachers at this school treat students fairlyNo, never 1Yes, some of the time 4Yes, most of the time 32Yes, all of the time 63I feel safe in my schoolNo, never 1Yes, some of the time 6Yes, most of the time 27Yes, all of the time 66Questions E9-12,29: Do you feel close to people at school?, Are you happy to be at this school?, Do you feel like you arepart of this school?, Do teachers treat students fairly at school?, Do you feel safe at school?
Palo Alto Unified Page 152013-2014 Main Report - Elementary

Table A7.3
School Protective Factors (Developmental Supports)
At my school, there is a teacher or some other adult… Grade 5 %
who really cares about me (Caring Relationships)No, never 0Yes, some of the time 6Yes, most of the time 24Yes, all of the time 70who listens when I have something to say (Caring Relationships)No, never 0Yes, some of the time 11Yes, most of the time 44Yes, all of the time 45who tells me when I do a good job (High Expectations)No, never 1Yes, some of the time 14Yes, most of the time 46Yes, all of the time 39who believes that I can do a good job (High Expectations)No, never 0Yes, some of the time 4Yes, most of the time 23Yes, all of the time 73Questions E14, 17, 15, 18: Do the teacher and other grown-ups at school care about you?, Do the teachers and other grown-ups at school listen when you have something to say?, Do the teachers and other grown-ups at school tell you when you do a good job?, Do the teachers and other grown-ups at school believe that you can do a good job?
Palo Alto Unified Page 162013-2014 Main Report - Elementary

Table A7.3 - Continued
School Protective Factors (Developmental Supports)Grade 5
%I help make class rules or choose things to do (Opportunities for Meaningful Participation)No, never 11Yes, some of the time 43Yes, most of the time 32Yes, all of the time 14I do things to be helpful at school (Opportunities for Meaningful Participation)No, never 0Yes, some of the time 17Yes, most of the time 49Yes, all of the time 33Question E13, 19: Do you help make class rules or choose things to do at school?, Do you do things to be helpful at school?
Palo Alto Unified Page 172013-2014 Main Report - Elementary
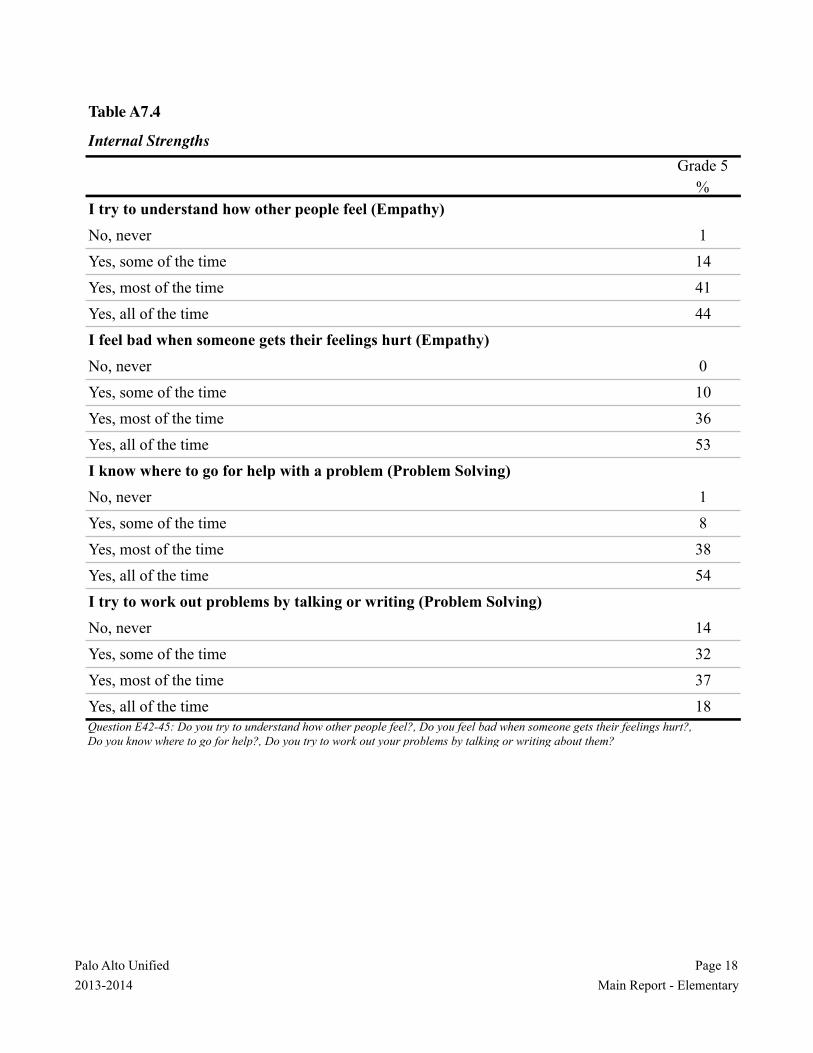
Table A7.4
Internal StrengthsGrade 5
%I try to understand how other people feel (Empathy)No, never 1Yes, some of the time 14Yes, most of the time 41Yes, all of the time 44I feel bad when someone gets their feelings hurt (Empathy)No, never 0Yes, some of the time 10Yes, most of the time 36Yes, all of the time 53I know where to go for help with a problem (Problem Solving)No, never 1Yes, some of the time 8Yes, most of the time 38Yes, all of the time 54I try to work out problems by talking or writing (Problem Solving)No, never 14Yes, some of the time 32Yes, most of the time 37Yes, all of the time 18Question E42-45: Do you try to understand how other people feel?, Do you feel bad when someone gets their feelings hurt?,Do you know where to go for help?, Do you try to work out your problems by talking or writing about them?
Palo Alto Unified Page 182013-2014 Main Report - Elementary

Table A7.4 - Continued
Internal StrengthsGrade 5
%I try to do my best (Goals and Aspirations)No, never 0Yes, some of the time 2Yes, most of the time 21Yes, all of the time 77I have goals and plans for the future (Goals and Aspirations)No 5Yes 95I plan to go to college or some other school after high school (Goals and Aspirations)No 2Yes 98Question E46-47, 20: Do you try to do your best?, Do you have goals and plans for the future?, Do you plan to go to collegeor some other school after high school?
Palo Alto Unified Page 192013-2014 Main Report - Elementary

Table A7.5
Home Protective Factors (Developmental Supports)
At home, there is a parent or some other adult… Grade 5 %
who cares about my schoolwork (Caring Relationships)No, never 1Yes, some of the time 3Yes, most of the time 17Yes, all of the time 80who listens when I have something to say (Caring Relationships)No, never 1Yes, some of the time 8Yes, most of the time 39Yes, all of the time 53who believes that I can do a good job (High Expectations)No, never 0Yes, some of the time 2Yes, most of the time 9Yes, all of the time 88who wants me to do my best (High Expectations)No, never 0Yes, some of the time 1Yes, most of the time 5Yes, all of the time 94Questions E57, 60, 58, 59: Does a parent or some other grown up at home care about your schoolwork? Does a parent or some other grown-up at home listen when you have something to say?, Does a parent or some other grown-up at home believe thatyou can do a good job?, Does a parent or some other grown-up at home want you to do your best?
Palo Alto Unified Page 202013-2014 Main Report - Elementary

Table A7.5 - Continued
Home Protective Factors (Developmental Supports)Grade 5
%I help at home (Opportunities for Meaningful Participation)No, never 1Yes, some of the time 20Yes, most of the time 51Yes, all of the time 28I get to make rules or choose things to do at home (Opportunities for Meaningful Participation)No, never 10Yes, some of the time 49Yes, most of the time 33Yes, all of the time 8Question E61- 62: Do you help at home?, Do you get to make rules or choose things to do at home?
Table A7.6
Peer Protective Factors (Developmental Supports)Grade 5
%My best friends get into trouble (High Expectations)No, never 35Yes, some of the time 61Yes, most of the time 3Yes, all of the time 1My best friends try to do the right thing (High Expectations)No, never 1Yes, some of the time 9Yes, most of the time 45Yes, all of the time 46Questions E55-56: Do your best friends get into trouble?, Do your best friends try to do the right thing?
Palo Alto Unified Page 212013-2014 Main Report - Elementary

Table 8.1Key Indicators Recommended by CDE
5th Grade %
na
na
66
71
70
25
75
Palo Alto Unified Page 222013-2014 Main Report - Elementary
The percentage of students that report high levels of caring relationships with a teacher or other adult at their school
Drug Use
Tobacco Use
Key Indicator
Safe Schools and Violence
**Excludes students who answered "I don't know what marijuana is"
The percentage of students that feel very safe at school***
The percentage of students that have ever used marijuana**
The percentage of students that have ever used cigarettes*
*Includes students who smoked part of a cigarette and those who smoked a whole cigarette.
***Elementary students are asked how often they feel safe at school rather than how safe they felt, as in the secondary survey. This table reports those students who responded, "Yes, all of the time."
School Protective Factors
The percentage of students that report high levels of high expectations from a teacher or other adult at their school
The percentage of students that report high levels of opportunities for meaningful participation at their school
The percentage of students that report high levels of personal school connectedness