PALMETTO ASSESSMENT OF STATE STANDARDS … · RESULTS OF SPRING 2010 ADMINISTRATION ... PALMETTO...
77
Department of Accountability and Academic Outcomes PALMETTO ASSESSMENT OF STATE STANDARDS (PASS) RESULTS OF SPRING 2010 ADMINISTRATION Report No. 11-375 June 2011
Transcript of PALMETTO ASSESSMENT OF STATE STANDARDS … · RESULTS OF SPRING 2010 ADMINISTRATION ... PALMETTO...

Department of Accountability and Academic Outcomes
PALMETTO ASSESSMENT OF STATE STANDARDS (PASS)
RESULTS OF SPRING 2010 ADMINISTRATION
Report No. 11-375 June 2011

PALMETTO ASSESSMENT OF STATE STANDARDS
(PASS)
RESULTS OF SPRING 2010 ADMINISTRATION
Charleston County School District Nancy J. McGinley, Ed.D.
Superintendent
Janet S. Rose, Ph.D. Executive Director
Department of Accountability and Academic Outcomes
Kathryn K. Rhodes, Ph.D. Supervisor, Testing Programs
Department of Accountability and Academic Outcomes
June 2011
Report No. 11-375

i
PALMETTO ASSESSMENT OF STATE STANDARDS (PASS) RESULTS OF SPRING 2010 ADMINISTRATION
TABLE OF CONTENTS
Page Executive Summary ................................................................................................................................ iii
Introduction ............................................................................................................................................. 1
Number of Students Tested in Charleston County .................................................................................. 2
Results ..................................................................................................................................................... 3
Writing Performance Levels ..................................................................................................................... 4 Demographics .............................................................................................................................. 5 Comparisons with South Carolina ............................................................................................... 8
English/Language Arts and Mathematics Performance Levels .................................................................................................................... 9 Demographics ............................................................................................................................. 10 Comparisons with South Carolina .............................................................................................. 13
Science and Social Studies Performance Levels ................................................................................................................... 14 Demographics ............................................................................................................................ 15 Comparisons with South Carolina ............................................................................................. 18
SC-Alt .............................................................................................................................................. 20
Conclusions ........................................................................................................................................... 20 Tables
Table 1: Number of Students Tested in Charleston County ............................................................. 3
Writing
Table 2: Percent of CCSD Students Scoring at Each Performance Level ....................................... 4 Table 3: Percent of CCSD Students Scoring Met and Exemplary By Demographics ..................... 5 Table 4: Percent of CCSD Students Scoring Exemplary By Demographics ................................... 6 Table 5: Percent of CCSD Students vs. Percent of SC Students Scoring at Each Performance
Level ................................................................................................................................... 8
English/Language Arts and Mathematics Tables
Table 6: Percent of CCSD Students Scoring at Each Performance Level ...................................... 9 Table 7: Percent of CCSD Students Scoring Met and Exemplary By Demographics .................... 10 Table 8: Percent of CCSD Students Scoring Exemplary By Demographics ……………………..11 Table 9: Percent of CCSD Students vs. Percent of SC Students Scoring at Each Performance
Level ……………………………………………………………………………………. 13

ii
PALMETTO ASSESSMENT OF STATE STANDARDS (PASS) RESULTS OF SPRING 2010 ADMINISTRATION
TABLE OF CONTENTS (CONTINUED)
Page
Science and Social Studies Tables
Table 10: Percent of CCSD Students Scoring at Each Performance Level ..................................... 14 Table 11: Percent of CCSD Students Scoring Met and Exemplary By Demographics ................... 15 Table 12: Percent of CCSD Students Scoring Exemplary By Demographics ................................. 16 Table 13: Percent of CCSD Students vs. Percent of SC Students Scoring Met and Exemplary and
Exemplary ........................................................................................................................ 18 Figures: Pages 22-46 removed, please refer to tables in the text.
Appendices – Individual Schools Performance Data
Appendix A: Percent at Each Performance Level in Individual Schools Writing ......................................................................................................................... 47 Appendix B: Percent at Each Performance Level in Individual Schools English Language Arts and Mathematics ...................................................................... 63 Appendix C: Percent at Each Performance Level in Individual Schools Science and Social Studies ............................................................................................. 80

iii
Executive Summary
Results of the Spring 2010 administration of the Palmetto Assessment of State Standards indicate that schools in the Charleston County School District have made some progress in accelerating the academic performance of students and closing the achievement gap. Gains of one percent or higher were made in each of the five subjects: Writing, English Language Arts, Math, Social Studies, and Science. Gains made from 2009 to 2010 in the Exemplary category: • In Writing, higher percentages of students scored Exemplary in grades 4, 5, 6, and 8 (see
Table 2). • In ELA, higher percentages of students scored Exemplary in grades 3, 5, 6, 7, and 8 (see
Table 6). • In Math, higher percentages of students scored Exemplary in grades 3, 4, 5, 6, and 8 (see
Table 6). • In Science, higher percentages of students scored Exemplary in grades 3, 5, 6, 7, and 8 (see
Table 10). • In Social Studies, higher percentages of students scored Exemplary in grades 4, 6, and 8 (see
Table 10).
Gains made from 2009 to 2010 in the Met and Exemplary category: • In Writing, higher percentages of students scored Met and Exemplary in grades 4, 5, 6, and 8
(see Table 2). • In ELA, higher percentages of students scored Met and Exemplary in grades 3, 4, and 6 (see
Table 6). • In Math, higher percentages of students scored Met and Exemplary in grades 4, 6, and 8 (see
Table 6). • In Science, higher percentages of students scored Met and Exemplary in grades 4 and 8 (see
Table 10).
In 2010, Charleston exceeded South Carolina's performance in every subject and every grade at the Exemplary level: • In Writing, CCSD students exceeded the performance of SC students at the Exemplary level
in every grade (See Table 5). • In ELA, CCSD students exceeded the performance of SC students at the Exemplary level in
every grade (see Table 9). • In Math, CCSD students exceeded the performance of SC students at the Exemplary level in
every grade (see Table 9). • In Science, CCSD students exceeded the performance of SC students at the Exemplary level
in every grade (see Table 13). • In Social Studies, CCSD students exceeded the performance of SC students at the Exemplary
level in every grade (see Table 13). In 2010, Charleston exceeded South Carolina’ performance in certain subjects at the Met and Exemplary category: • In Writing, CCSD students exceeded the performance of SC students at the Met and
Exemplary category in every grade (See Table 5). • In ELA, CCSD students exceeded the performance of SC students at the Met and Exemplary
category in all grades except third (See Table 9).

iv
• In Math, CCSD students exceeded the performance of SC students at the Met and Exemplary category in grades 4, 5, 6, and 8 (See Table 9).
• In Science, CCSD students exceeded the performance of SC students at the Met and Exemplary category in grade 5 (See Table 13).
• In Social Studies, CCSD students exceeded the performance of SC students at the Met and Exemplary category in grades 3, 4, 5, and 8 (See Table 13).
Results by gender for 2010: • In Writing, females significantly outperformed males at the Met and Exemplary, and
Exemplary categories at every grade level (see Tables 3 and 4). • In ELA, females significantly outperformed males at the Met and Exemplary category as
well as the Exemplary level, at every grade. (see Tables 7 and 8). • In Math, females outperformed males at the Met and Exemplary category in every grade. At
the Exemplary level, females outperformed males in grades 5 and 6, while males outperformed females in grades 3, 4, 7, and 8 (see Tables 7and 8).
• In Science, females outperformed males at the Met and Exemplary category in grades 5, 6, 7, and 8 while males outperformed females in grade 3. At the Exemplary level, males outperformed females in every grade except sixth (see Tables 11 and 12).
• In Social Studies, females outperformed males at the Met and Exemplary category in every grade. At the Exemplary level, males outperformed females in every grade. (see Tables 11 and 12).
Results by ethnicity for 2010: • In Writing, the achievement gap increased between percentages of white and African
American students performing at the Met and Exemplary category in grades 3, 6, and 8; the gap decreased in grades 4 and 5 (See Table 3). At the Exemplary level, the achievement gap increased at grades 6 and 8 and decreased in grades 4, 5 and 7 (See Table 4).
• In ELA, the achievement gap increased between percentages of white and African American students performing Met and Exemplary in grades 7 and 8; the gap decreased in grade 4 (See Table 7). At the Exemplary level, the achievement gap increased at grade 5, 6, 7, and 8. The achievement gap decreased at grade 4. (see Table 8).
• In Math, the achievement gap increased between percentages of white and African American students performing Met and Exemplary in grades 5 and 7; while decreasing at grades 3 and 4 (see Table 7). At the Exemplary level, the achievement gap between percentages of white and African American students increased in grades 3, 4, and 6. The Exemplary gap decreased in grade 5 (See Table 8).
• In Science, the achievement gap between percentages of white and African American students performing Met and Exemplary increased in grades 3 and 5; the achievement gap decreased in grades 4, 7, and 8 (See Table 11). At the Exemplary level, the achievement gap increased in grades 3, 5, 6, and 7. The achievement gap significantly decreased in grade 4 (see Table 12).
• In Social Studies, the achievement gap did not decrease between percentages of white and African American students performing Met and Exemplary, however it increased significantly (more than 1%) in grades 3, 4, 6, and 8. At the Exemplary level, the achievement gap increased in grades 3, 6, and 8 (See Table 12). In grades 4 and 5, the achievement gap decreased (see Tables 12).

v
Results by participation/non-participation in free/reduced meals program: • In all five subject areas, Writing, ELA, Math, Science, and Social Studies, higher percentages
of non-participating students scored Met and above as well as Exemplary at every grade level (see Tables 3, 4, 7, 8, 11, and 12).
Alternate Assessment (SC-Alt): • In ELA, 138 students were administered SC-Alt; 89.9% of students tested scored Basic and
above. • In Math, 137 students were administered SC-Alt; 82.5% of students tested scored Basic and
above. • In Science, 98 students were administered SC-Alt; 80.6% of students tested scored Basic and
above. • In Social Studies, 85 students were administered SC-Alt; 82.4% of students tested scored
Basic and above.
Further work is needed so more students can not only meet minimum expectations for their grade level but also perform at the Exemplary level on PASS. The Charleston County School District and individual schools will use the PASS results to identify areas that need more attention. The demographic differences in test performance for gender, ethnicity, and lunch program participation will be studied in order to continue to generate strategies for eliminating performance differences between groups of students.

1
PALMETTO ASSESSMENT OF STATE STANDARDS (PASS) RESULTS OF SPRING 2010 ADMINISTRATION
Students in grades 3 through 8 in Charleston County took the Palmetto Assessment of State Standards (PASS) in March and May of 2010. PASS was developed to replace the Palmetto Achievement Challenge Tests (PACT) which was administered from 1999 through 2008.
PASS is based on state curriculum standards and designed to measure the performance of public school students in five subject areas: Writing, English/Language Arts (ELA), Mathematics, Science and Social Studies. All students in grades three through eight take the PASS Writing, ELA, and Mathematics tests. All students in grades 4 and 7 take both the Science and Social Studies tests. Students in grades 3, 5, 6, and 8 take either the Science or the Social Studies test with approximately half of the students in each grade taking each test. The Writing test is administered in March; the remaining subjects are administered during May. Field test items, when feasible, are embedded within the operational forms of each test.
All PASS items are aligned with South Carolina’s academic standards for each subject and
grade level. Academic standards describe what schools are expected to teach and what students are expected to learn. Academic standards also include indicators which are statements of the specific cognitive processes and content knowledge and skills that students must demonstrate to meet the grade-level standards.
The PASS Writing tests for grades 3-8 were administered over two days in March of
2010. For each grade level, the test consisted of one extended-response item administered on Day 1 and multiple-choice items administered on Day 2. The 2008 Writing rubric was used to score the test.
The PASS English Language Arts (ELA), Mathematics, Social Studies and Science tests
were administered in May. The ELA exam assessed the reading and research standards of the 2008 South Carolina Academic Standards for English Language Arts for grades 3-8. The test consisted of multiple-choice items based on four broad standards: Literary Text, Vocabulary, Informational Text, and Research.
The PASS Mathematics tests for grades 3-8 measured the 2007 South Carolina Academic
Standards for Mathematics. Those standards covered: Mathematical Processes, Number and Operations, Algebra, Geometry, Measurement, and Data Analysis and Probability. For all grade levels, the PASS mathematics tests consisted of multiple-choice items only.
The PASS Science tests measured the 2005 South Carolina Science Academic Standards. There are five to six broad standards with detailed indicators at each grade level. The multiple choice test items are aligned to the broad standards, guided by the scope of the detailed indicators for each standard at each grade level. Every grade covers standards in scientific inquiry, earth science, physical science, and life science.

2
The Social Studies tests were based on the 2005 South Carolina Social Studies Academic
Standards. The tests were composed of multiple choice items. There are five to seven broad standards per grade level for social studies. The test items focus on history with applications in government, political science, geography, and economics.
Three performance levels were established to reflect the continuum of knowledge and skills exhibited by students on the PASS: Exemplary, Met, and Not Met. PASS performance levels are as follows:
Exemplary The student demonstrated exemplary performance in meeting the
grade level standard.
Met The student met the grade level standard. Not Met The student did not meet the grade level standards. For purposes of reporting “proficiency” as required by federal statute, the PASS
performance levels of Met and Exemplary are summed. Schools and parents receive individual score reports for each student. These reports
designate the performance level of each student for each test. Individual score reports for Charleston County School District students have been distributed.
Number of Students Tested in Charleston County
All students in grades 3 through 8 were administered PASS, with the exception of those
students who were: on official and/or medical homebound status and unable to take the test; administered the SC-Alt Assessments; medically unable to attend school; and those expelled students without an Individual Education Plan (IEP). Students in their first year in a United States school were exempt from the Writing, ELA and social studies portions of PASS. Numbers of students taking each part of the PASS are given below.

3
Table 1 Palmetto Assessment of State Standards
Number of Students Tested on PASS In Charleston County, Spring 2009 and Spring 2010
Grade Year Writing
English Language Arts Mathematics Science
Social Studies
3 2009 3,310 3,307 3,311 1,682 1,643
2010 3,327 3,323 3,328 1,667 1,665
4 2009 3,204 3,195 3,202 3,203 3,197 2010 3,296 3,307 3,310 3,310 3,310
5 2009 3,027 3,016 3,021 1,521 1,508 2010 3,143 3,141 3,145 1,587 1,565
6 2009 2,879 2,868 2,869 1,448 1,436 2010 3,020 3,021 3,023 1,514 1,509
7 2009 2,764 2,760 2,764 2,765 2,758 2010 2,836 2,819 2,822 2,820 2,819
8 2009 2,788 2,781 2,783 1,388 1,406 2010 2,799 2,796 2,799 1,412 1,400
Grand Totals
2009 17,972 17,927 17,950 12,007 11,948 2010 18,421 18,407 18,427 12,310 12,268
*Only 50% of the students were tested in science and social studies in grades 3, 5, 6, and 8; in grades 4 and 7 all students were tested in science and social studies pursuant to the Education Accountability Act, Chapter 18, Section 59-18-320(B).
RESULTS
The tables that follow present results for performance levels, performance groupings, and demographic groups. Within this report comparisons between 2009 and 2010 include only students tested on grade level.

4
Writing
Performance Levels Table 2 presents data on the percentages of students tested in Charleston County School District who performed at each of the three levels of performance in 2009 and 2010 in Writing Not Met, Met, and Exemplary.
Table 2
Palmetto Assessment of State Standards Percent of CCSD Students Scoring at Each Performance Level
Writing Spring 2009 and Spring 2010
Grade Year
Writing Not Met Met Exemplary
No. % No. % No. %
3 2009 846 25.6% 926 28.0% 1538 46.5% 2010 885 26.6% 1026 30.8% 1416 42.6%
4 2009 865 27.0% 1097 34.2% 1242 38.8% 2010 784 23.8% 1126 34.2% 1386 42.1%
5 2009 787 26.0% 996 32.9% 1244 41.1% 2010 716 22.8% 1022 32.5% 1405 44.7%
6 2009 791 27.5% 1109 38.5% 979 34.0% 2010 792 26.2% 1100 36.4% 1128 37.4%
7 2009 731 26.4% 1039 37.6% 994 36.0% 2010 776 27.4% 1119 39.5% 941 33.2%
8 2009 856 30.7% 1142 41.0% 790 28.3% 2010 738 26.4% 1061 37.9% 1000 35.7%
Grand Totals 2009 4876 27.1% 6309 35.1% 6787 37.8% 2010 4691 25.5% 6454 35.0% 7276 39.5%
In 2010, in Writing, a significantly lower (more than 1%) percentage of students in grades 4, 5, 6, and 8 scored Not Met than in 2009.

5
Writing Demographics
Tables 3 and 4 present data for demographic groupings of students in Charleston County. These groupings include gender (female, male), ethnicity (African American, Hispanic, and white), and lunch program participation (free/reduced price lunch, not free/reduced price lunch). Table 3 shows the percentages of students scoring Met and Exemplary while Table 4 presents percentages of students scoring at the Exemplary level.
Table 3 Palmetto Assessment of State Standards
Percent of CCSD Students Scoring Met and Exemplary By Demographics
Writing Spring 2009 and Spring 2010
Grade Year
Writing Gender Ethnicity Meal Programs
Female Male African
American Hispanic White F/R Lunch Not F/R Lunch
3 2009 81.2% 67.8% 62.5% 62.4% 88.6% 62.4% 89.1% 2010 79.3% 67.8% 60.5% 60.6% 88.9% 61.2% 91.1%
4 2009 79.7% 66.3% 57.2% 54.8% 90.8% 57.9% 90.1% 2010 80.8% 71.7% 63.5% 62.0% 91.1% 64.0% 91.5%
5 2009 81.0% 67.1% 58.2% 61.4% 91.5% 58.9% 90.0% 2010 82.7% 71.6% 64.3% 66.7% 90.7% 65.7% 90.5%
6 2009 78.8% 66.8% 57.6% 61.2% 90.1% 57.5% 88.2% 2010 81.1% 66.4% 57.4% 57.2% 91.9% 58.4% 90.6%
7 2009 81.3% 66.3% 57.8% 61.7% 90.7% 56.6% 89.1% 2010 78.4% 67.3% 56.8% 64.7% 89.6% 57.6% 88.2%
8 2009 75.9% 62.9% 54.8% 62.0% 86.0% 53.6% 83.6% 2010 81.5% 66.4% 55.9% 70.4% 91.1% 56.8% 89.6%
Grand Total
2009 79.7% 66.2% 58.1% 60.4% 89.7% 58.1% 88.4% 2010 80.6% 68.6% 59.9% 63.2% 90.6% 60.9% 90.3%

6
Table 4
Palmetto Assessment of State Standards Percent of CCSD Students Scoring Exemplary
By Demographics Writing
Spring 2009 and Spring 2010
Grade Year
Writing Gender Ethnicity Meal Program
Female Male African
American Hispanic White F/R Meals Not F/R Meals
3 2009 53.7% 39.3% 27.9% 29.9% 68.1% 28.5% 68.5% 2010 49.7% 35.7% 24.3% 25.7% 64.5% 25.1% 67.8%
4 2009 45.9% 31.6% 18.1% 19.2% 61.4% 18.3% 62.0% 2010 47.4% 36.8% 22.3% 25.0% 64.0% 23.1% 65.7%
5 2009 46.7% 35.6% 19.7% 22.2% 65.3% 20.7% 62.6% 2010 51.2% 38.1% 23.4% 33.9% 65.9% 25.4% 66.8%
6 2009 40.5% 28.1% 15.8% 21.1% 55.0% 15.5% 53.2% 2010 44.0% 30.7% 16.6% 21.4% 59.4% 17.3% 59.3%
7 2009 42.6% 29.8% 14.8% 26.6% 58.2% 14.0% 56.0% 2010 39.2% 27.6% 12.8% 25.9% 54.2% 12.1% 54.9%
8 2009 31.5% 25.3% 12.5% 13.0% 47.2% 11.3% 43.9% 2010 43.0% 28.9% 15.2% 27.2% 56.5% 15.1% 54.5%
Grand Total
2009 43.9% 31.8% 18.4% 22.6% 59.6% 18.6% 57.8% 2010 46.0% 33.2% 19.4% 26.5% 61.0% 20.2% 61.5%

7
Gender and Writing. Table 3 shows that significantly (more than 1%) higher percentages of females than males scored Met and Exemplary in Writing in 2010 with females outperforming males in every grade. Differences between female and male performance ranged from 9.1 to 15.1 percentage points across six grade levels tested. Females also outperformed males at the Exemplary level in Writing, from 10.6 to 14.1 percentage points, as shown in Table 4.
Ethnicity and Writing. As shown in Table 3, large achievement gaps exist between percentages of white and African American students and white and Hispanic students performing Met and Exemplary on PASS. In Writing, percentages of white students who performed at the Met and Exemplary levels in 2010 ranged from 88.9% to 91.9% across the six grades tested, compared to a range of 57.2% to 70.4% for Hispanic students and a range of 55.9% to 64.3% for African American students. A significant reduction (more than 1 percentage point) in the achievement gap between white and Hispanic students scoring Met and Exemplary was noted at grades 4, 5, 7 and 8 in Writing from 2009 to 2010. A significant reduction (more than 1 percentage point) in the achievement gap between white and African American in the Met and Exemplary category was noted in grades 4 and 5.
Lunch program participation and Writing. Students who did not participate in free or
reduced price lunch programs performed significantly better than participating students. As shown in Table 3 for Writing in 2010, between 88.2% and 91.5% of non-participating students across the six grade levels scored at the Met and Exemplary levels; the comparable figures for participating students were 56.8% to 65.7%. The differences between the two groups ranged from 24.8 to 32.8 percentage points, always in the direction of higher percentages for non-participating students. A significant reduction (more than 1 percentage point) in the achievement gap between non-participants and participating students in the Met and Exemplary category was noted in grades 4, 5, and 7.

8
Comparisons with South Carolina on Writing
Table 5 presents the percentages of students in Charleston County and South Carolina who scored at each performance level on the Writing test. Data are presented for 2009 and 2010.
10
Gr Year
Writing Not Met Met Exemplary Met & Exemplary
CCSD SC CCSD SC CCSD SC CCSD SC
3 2009 25.6% 31.1% 28.0% 29.4% 46.5% 39.5% 74.4% 68.9% 2010 26.6% 29.0% 30.8% 33.0% 42.6% 38.0% 73.4% 71.0%
4 2009 27.0% 29.9% 34.2% 39.5% 38.8% 30.6% 73.0% 70.1% 2010 23.8% 27.7% 34.2% 37.8% 42.1% 34.4% 76.2% 72.3%
5 2009 26.0% 26.8% 32.9% 38.2% 41.1% 35.0% 74.0% 73.2% 2010 22.8% 25.5% 32.5% 37.6% 44.7% 36.9% 77.2% 74.5%
6 2009 27.5% 29.7% 38.5% 40.7% 34.0% 29.6% 72.5% 70.3% 2010 26.2% 28.1% 36.4% 40.3% 37.4% 31.6% 73.8% 71.9%
7 2009 26.4% 29.9% 37.6% 40.3% 36.0% 29.8% 73.6% 70.1% 2010 27.4% 30.3% 39.5% 42.0% 33.2% 27.7% 72.6% 69.7%
8 2009 30.7% 31.8% 41.0% 42.2% 28.3% 25.9% 69.3% 68.2% 2010 26.4% 28.1% 37.9% 41.9% 35.7% 30.0% 73.6% 71.9%
Results from the 2010 administration show that between 72.6% and 77.2% of Charleston
students across the six grade levels tested scored Met and Exemplary in Writing (see Table 5). The corresponding range for South Carolina was between 69.7% and 74.5%.
In comparing students scoring Met and Exemplary, CCSD matched or exceeded SC’s performance in Writing at all grade levels. In 2010, Charleston students scored significantly higher than SC students in grades four (3.9 points), five (2.7 points), and seven (2.9 points).
The percentages of students scoring at the highest performance level were significantly
higher for students in Charleston than their peers statewide. In 2010, percentages of Charleston county students scoring at the Exemplary level ranged from 33.2% to 44.7% in Writing while SC students overall ranged from 27.7% to 38.0% in Writing.
Individual school data for Writing are included in the tables of results that are presented
in the appendices. They contain percentages of students within each school scoring at each of the three performance levels in Writing (Appendix A).
Table 5 Palmetto Assessment of State Standards
Percent of CCSD Students vs. Percent of SC Students Scoring at Each Performance Level
Writing Spring 2009 and Spring 2010

9
English/Language Arts and Mathematics
The tables that follow present results for performance levels, performance groupings, and demographic groups for English Language Arts and Mathematics.
Performance Levels
Table 6 presents data on the percentages of students tested in Charleston County School District who performed at each of the three levels of performance in 2009 and 2010 in ELA and Math: Not Met, Met, and Exemplary.
In 2010, a lower percentage of students in grades 3, 4, and 6 scored Not Met in ELA than in 2009. In 2010, in grades 4, 6, and 8, lower percentages of students scored Not Met in Math than in 2009 (see Table 6).
Table 6 Palmetto Assessment of State Standards
Percent of CCSD Students Scoring at Each Performance Level English/Language Arts and Mathematics
Spring 2009 and Spring 2010
Grade Year
English Language Arts Mathematics Not Met Met Exemplary Not Met Met Exemplary
No. % No. % No. % No. % No. % No. %
3 2009 693 21.0% 980 29.6% 1634 49.4% 986 29.8% 1060 32.0% 1265 38.2%
2010 633 19.0% 864 26.0% 1826 55.0% 993 29.8% 983 29.5% 1352 40.6%
4 2009 788 24.7% 1097 34.3% 1310 41.0% 692 21.6% 1323 41.3% 1187 37.1%
2010 703 21.3% 1226 37.1% 1378 41.7% 646 19.5% 1284 38.8% 1380 41.7%
5 2009 561 18.6% 1257 41.7% 1198 39.7% 745 24.7% 1275 42.2% 1001 33.1%
2010 643 20.5% 1171 37.3% 1327 42.2% 863 27.4% 1145 36.4% 1137 36.2%
6 2009 851 29.7% 1042 36.3% 975 34.0% 850 29.6% 1141 39.8% 878 30.6%
2010 802 26.5% 1013 33.5% 1206 39.9% 858 28.4% 1085 35.9% 1080 35.7%
7 2009 776 28.1% 1024 37.1% 960 34.8% 788 28.5% 1110 40.2% 866 31.3%
2010 795 28.2% 840 29.8% 1184 42.0% 934 33.1% 986 34.9% 902 32.0%
8 2009 832 29.9% 1010 36.3% 939 33.8% 1007 36.2% 1031 37.0% 745 26.8%
2010 953 34.1% 789 28.2% 1054 37.7% 977 34.9% 1044 37.3% 778 27.8%
Grand Total
2009 4501 25.1% 6410 35.8% 7016 39.1% 5068 28.2% 6940 38.7% 5942 33.1%
2010 4529 24.6% 5903 32.1% 7975 43.3% 5271 28.6% 6527 35.4% 6629 36.0%

10
Demographics and English/ Language Arts and Math
Tables 7 and 8 present data for demographic groupings of students in Charleston County. These groupings include gender (female, male), ethnicity (African American, Hispanic, and white), and lunch program participation (free/reduced price lunch, not free/reduced price lunch). Table 7 shows the percentages of students scoring Met and Exemplary. Comparable data for students scoring at the Exemplary level are presented in Table 8.
Table 7 Palmetto Assessment of State Standards
Percent of CCSD Students Scoring Met and Exemplary By Demographics
English/Language Arts and Mathematics Spring 2009 and Spring 2010
Grade Year
English/Language Arts Mathematics
Gender Ethnicity Meal Programs Gender Ethnicity Meal Programs
Female Male African American Hispanic White
F/R Lunch
Not F/R Lunch Female Male
African American Hispanic White
F/R Lunch
Not F/R Lunch
3 2009 82.6% 75.6% 68.1% 67.5% 92.1% 68.4% 91.9% 72.9% 67.6% 53.3% 61.5% 89.3% 56.2% 87.2% 2010 84.1% 78.0% 69.9% 72.3% 93.7% 71.5% 94.5% 71.4% 68.9% 53.8% 60.8% 88.6% 56.7% 89.6%
4 2009 78.6% 72.0% 58.9% 58.9% 93.6% 60.8% 91.7% 79.9% 76.9% 63.5% 72.1% 94.0% 65.4% 92.9% 2010 82.6% 75.0% 65.9% 64.9% 93.5% 67.2% 93.0% 81.7% 79.3% 67.7% 73.9% 94.3% 70.1% 93.4%
5 2009 84.3% 78.5% 68.7% 73.2% 95.2% 69.3% 94.1% 78.0% 72.7% 59.2% 69.5% 92.2% 61.3% 90.1% 2010 83.8% 75.2% 65.8% 75.9% 92.9% 68.1% 92.7% 74.1% 70.9% 54.7% 67.8% 89.9% 57.9% 89.5%
6 2009 74.3% 66.7% 53.8% 58.1% 90.0% 54.5% 86.8% 72.4% 68.5% 53.2% 65.1% 89.6% 54.5% 86.8% 2010 78.5% 68.3% 55.9% 61.0% 92.3% 57.7% 90.7% 75.7% 67.5% 53.8% 60.5% 90.6% 55.5% 89.3%
7 2009 77.4% 66.7% 54.5% 58.3% 90.7% 53.2% 88.9% 75.1% 68.1% 53.7% 64.3% 89.9% 53.6% 87.7% 2010 75.8% 68.1% 53.4% 63.0% 91.5% 54.8% 89.2% 68.6% 65.3% 46.2% 56.4% 88.7% 48.2% 86.0%
8 2009 73.9% 66.4% 53.5% 62.4% 88.9% 53.1% 85.5% 64.5% 63.1% 43.3% 57.7% 86.9% 43.3% 82.5% 2010 72.8% 59.6% 45.0% 63.7% 86.1% 46.8% 84.0% 67.5% 62.8% 43.1% 62.7% 86.6% 44.7% 84.4%
All Grades
2009 78.7% 71.2% 59.9% 63.3% 91.9% 60.5% 89.9% 74.0% 69.6% 54.5% 65.4% 90.4% 56.2% 87.9% 2010 79.9% 71.0% 59.8% 67.5% 91.8% 62.1% 90.7% 73.5% 69.4% 53.6% 64.1% 89.9% 56.3% 88.7%

11
Gender and ELA. Table 7 shows that higher percentages of females than males scored Met and Exemplary in English/Language Arts in 2010 with females outperforming males in every grade. Differences between female and male performance ranged from 6.1 to 13.2 percentage points across six grade levels tested. Females outperformed males at the Exemplary level in English/Language Arts, with differences from 5.0 to 10.0 percentage points in 2010, as shown in Table 8.
Gender and Math: Table 7 shows that higher percentages of females than males scored
Met and Exemplary in Math in 2010 with females outperforming males in every grade. Differences between female and male performance ranged from 2.4 to 8.2 percentage points across six grade levels tested. Females outperformed males at the Exemplary level in Math at two grade levels, fifth (1.1 percentage points) and sixth (3.6 percentage points) in 2010.
Ethnicity and ELA. As shown in Table 7, large achievement gaps exist between percentages of white and Hispanic and white and African American students performing Met and Exemplary on PASS. In English/Language Arts in 2010, percentages of white students who performed at the Met and Exemplary levels ranged from 86.1% to 93.7% across the six grades tested, compared to a range of 61.0% to 75.9% for Hispanic students and 45.0% to 69.9% for African American students. Table 8 shows significant differences in percentages of students scoring at the Exemplary level, with white students consistently outperforming Hispanic and African American students in ELA.
Table 8 Palmetto Assessment of State Standards
Percent of CCSD Students Scoring Exemplary By Demographics
English/Language Arts and Mathematics Spring 2009 and Spring 2010
English/Language Arts Mathematics
Grade Year
Gender Ethnicity Meal Programs Gender Ethnicity Meal Programs
Female Male African American Hispanic White
F/R Meals
Not F/R Meals Female Male
African American Hispanic White
F/R Meals
Not F/R Meals
3 2009 52.8% 46.1% 28.9% 35.0% 73.1% 30.1% 72.7% 38.8% 37.7% 18.0% 27.5% 60.9% 19.7% 60.5%
2010 57.6% 52.4% 34.5% 37.2% 79.5% 36.9% 80.9% 40.1% 41.1% 19.9% 29.0% 64.1% 23.4% 65.4%
4 2009 44.0% 38.0% 16.6% 22.9% 67.6% 19.3% 65.3% 38.0% 36.2% 15.1% 22.9% 60.2% 17.4% 59.2% 2010 44.2% 39.2% 20.7% 22.8% 65.3% 23.0% 64.8% 40.9% 42.5% 18.2% 33.5% 66.0% 22.0% 66.2%
5 2009 44.3% 35.2% 18.0% 25.5% 63.2% 20.3% 60.0% 33.2% 33.0% 11.7% 26.6% 55.5% 14.6% 52.6% 2010 45.5% 38.9% 19.0% 30.6% 65.5% 22.0% 65.6% 36.7% 35.6% 15.2% 28.1% 56.7% 18.5% 56.4%
6 2009 37.5% 30.8% 13.8% 20.3% 57.4% 13.5% 55.3% 31.3% 30.0% 10.2% 18.1% 53.9% 12.1% 49.8% 2010 43.2% 36.6% 17.3% 23.3% 64.2% 19.2% 62.6% 37.5% 33.9% 12.7% 21.1% 60.0% 14.8% 58.7%
7 2009 37.8% 32.0% 13.9% 24.4% 56.1% 14.7% 53.0% 30.5% 32.1% 8.8% 20.2% 54.6% 10.6% 50.1% 2010 45.0% 39.2% 18.1% 28.3% 68.0% 19.9% 64.5% 31.2% 32.6% 9.2% 23.6% 55.6% 10.8% 53.5%
8 2009 35.7% 31.9% 14.0% 21.1% 56.5% 13.8% 51.9% 24.7% 28.8% 7.9% 19.8% 48.3% 8.6% 43.3% 2010 42.9% 32.9% 13.9% 31.5% 61.4% 16.9% 57.4% 26.5% 29.0% 7.4% 17.5% 48.2% 9.4% 45.2%
Grand Total
2009 42.4% 35.9% 17.8% 25.5% 62.7% 19.2% 59.8% 33.1% 33.1% 12.1% 23.0% 55.8% 14.3% 52.7% 2010 46.6% 40.2% 20.9% 29.4% 67.4% 23.7% 65.8% 35.9% 36.1% 14.1% 26.5% 58.6% 17.2% 57.6%

12
Ethnicity and Math. In Mathematics in 2010, percentages of white students scoring Met and Exemplary ranged from 86.6% to 94.3%, compared to a range of only 56.4% to 73.9% for Hispanic students and 43.1% to 67.7% for African American students. Table 8 shows significant discrepancies in percentages of students scoring at the Exemplary level; white students consistently outperformed Hispanic and African American students in Math.
Reduction of the Achievement Gap in ELA. A significant (more than 1 percentage point) reduction in the achievement gap between white and Hispanic students scoring Met and Exemplary occurred in grades 3, 4, 5, 7, and 8 from 2009 to 2010. A significant reduction in the achievement gap (more than 1 point) between white and African American students scoring Met and Exemplary was noted at grade 4 in ELA.
Reduction of the Achievement Gap in Math. A significant reduction in the
achievement gap between white and Hispanic students scoring Met and Exemplary occurred in grades 4 (1.5 points) and 8 (5.3 points) in Mathematics between 2009 and 2010 (see Table 7). A significant reduction in the achievement gap between white and African American students scoring Met and Exemplary was noted in grade 3 (1.2 points) and grade 4 (3.9 points)
Lunch Program Participation and ELA. Students who did not participate in free or
reduced price lunch programs performed significantly better than participating students. As shown in Table 7 for English/Language Arts in 2010, between 84.0% to 94.5% of non-participating students across the six grade levels scored at the Met and Exemplary levels; the comparable figures for participating students were 46.8% to 71.5%. The differences between the two groups ranged from 23.0 to 37.2 percentage points, always in the direction of higher percentages for non-participating students.
Lunch Program Participation and Math. In Mathematics in 2010, Table 7 shows that only 44.7% to 70.1% of participating students across the six grades scored Met and Exemplary, compared to 84.4% to 93.4% of non-participating students. Discrepancies between the two groups ranged from 23.3 to 39.7 percentage points.
Lunch Program Participation in ELA and Math at the Exemplary level. Table 8
also reveals large performance differences between participating and non-participating students in the proportion of each who scored at the Exemplary level in both subject areas. In 2010, non-participating students outperformed participating students by 40.5 to 44.6 percentage points in ELA and by 35.8 to 44.2 percentage points in Mathematics.
Lunch Program Achievement Gap in ELA and Math. From 2009 to 2010, the Met
and Exemplary achievement gap in ELA decreased in grade 4 by 5.1 points. (see Table 7). In Math, the Met and Exemplary gap decreased in grade four by 4.2 points.

13
Comparisons with South Carolina in ELA and Math
Table 9 presents the percentages of students in Charleston County and South Carolina who scored at each performance level on the English/Language Arts and Mathematics tests. Data are presented for 2009 and 2010.
Results from the 2010 administration show that between 65.9% and 81.0% of Charleston
students across the six grade levels tested scored Met and Exemplary in ELA (see Table 9). The corresponding range for South Carolina is between 63.7% and 80.7%. In Mathematics, between 65.1% and 80.5% of Charleston students scored Met and Exemplary. The corresponding range for South Carolina is 63.4% to 76.7%.
In comparing students scoring Met and Exemplary, CCSD matched or exceeded SC’s performance in ELA at all grade levels (see Table 9). In comparing students scoring Met and Exemplary in Math, CCSD students matched or exceeded SC students’ performance in all grades.
Table 9 Palmetto Assessment of State Standards
Percent of CCSD Students vs. Percent of SC Students Scoring at Each Performance Level
English/Language Arts and Mathematics Spring 2009 and Spring 2010
Gr Year
English/Language Arts Mathematics
Not Met Met Exemplary Met & Exemplary Not Met Met Exemplary Met & Exemplary
CCSD SC CCSD SC CCSD SC CCSD SC CCSD SC CCSD SC CCSD SC CCSD SC
3
2009 21.0% 22.0% 29.6% 31.6% 49.4% 46.4% 79.0% 78.0% 29.8% 32.9% 32.0% 35.8% 38.2% 31.2% 70.2% 67.1%
2010 19.0% 19.3% 26.0% 26.8% 55.0% 53.9% 81.0% 80.7% 29.8% 30.0% 29.5% 31.2% 40.6% 38.8% 70.2% 70.0%
4
2009 24.7% 24.4% 34.3% 39.2% 41.0% 36.5% 75.3% 75.6% 21.6% 23.2% 41.3% 45.5% 37.1% 31.3% 78.4% 76.8%
2010 21.3% 23.5% 37.1% 38.8% 41.7% 37.7% 78.7% 76.5% 19.5% 23.3% 38.8% 41.8% 41.7% 34.9% 80.5% 76.7%
5
2009 18.6% 20.0% 41.7% 44.8% 39.7% 35.2% 81.4% 80.0% 24.7% 26.5% 42.2% 45.7% 33.1% 27.8% 75.3% 73.5%
2010 20.5% 21.9% 37.3% 41.4% 42.2% 36.7% 79.5% 78.1% 27.4% 28.7% 36.4% 40.1% 36.2% 31.2% 72.6% 71.3%
6
2009 29.7% 28.3% 36.3% 39.7% 34.0% 32.0% 70.3% 71.7% 29.6% 29.7% 39.8% 42.4% 30.6% 27.9% 70.4% 70.3%
2010 26.5% 27.8% 33.5% 36.9% 39.9% 35.3% 73.5% 72.2% 28.4% 29.7% 35.9% 39.8% 35.7% 30.5% 71.6% 70.3%
7
2009 28.1% 31.3% 37.1% 38.1% 34.8% 30.6% 71.9% 68.7% 28.5% 30.6% 40.2% 42.9% 31.3% 26.6% 71.5% 69.4%
2010 28.2% 30.8% 29.8% 32.5% 42.0% 36.6% 71.8% 69.2% 33.1% 33.0% 34.9% 38.6% 32.0% 28.4% 66.9% 67.0%
8
2009 29.9% 32.5% 36.3% 38.9% 33.8% 28.6% 70.1% 67.5% 36.2% 37.3% 37.0% 39.1% 26.8% 23.5% 63.8% 62.7%
2010 34.1% 36.3% 28.2% 30.4% 37.7% 33.3% 65.9% 63.7% 34.9% 36.6% 37.3% 40.4% 27.8% 23.0% 65.1% 63.4%

14
Science and Social Studies
Performance Levels Table 10 presents data on the percentages of students tested in Science and Social Studies in Charleston County School District who performed at each of the three levels of performance in 2009 and 2010: Not Met, Met, and Exemplary.
In 2010, a higher percentage of students scored Not Met in Science than in Social
Studies in all grades except the seventh (see Table 10). At the Exemplary level, students scored higher in Social Studies than in Science in all grades.
Table 10
Palmetto Assessment of State Standards
Percent of CCSD Students Scoring at Each Performance Level
Science and Social Studies
Spring 2009 and Spring 2010
Grade Year
Science Social Studies Not Met Met Exemplary Not Met Met Exemplary
No. % No. % No. % No. % No. % No. %
3 2009 606 36.0% 697 41.4% 379 22.5% 343 20.9% 631 38.4% 669 40.7%
2010 742 44.5% 495 29.7% 430 25.8% 396 23.8% 588 35.3% 681 40.9%
4 2009 1001 31.3% 1527 47.7% 675 21.1% 537 16.8% 1454 45.5% 1206 37.7%
2010 997 30.1% 1684 50.9% 629 19.0% 629 19.0% 1398 42.2% 1283 38.8%
5 2009 474 31.2% 795 52.3% 252 16.6% 397 26.3% 600 39.8% 511 33.9%
2010 505 31.8% 752 47.4% 330 20.8% 464 29.6% 577 36.9% 524 33.5%
6 2009 541 37.4% 682 47.1% 225 15.5% 291 20.3% 759 52.9% 386 26.9%
2010 585 38.6% 674 44.5% 255 16.8% 306 20.3% 658 43.6% 545 36.1%
7 2009 786 28.4% 1311 47.4% 668 24.2% 977 35.4% 837 30.3% 944 34.2%
2010 778 27.6% 1237 43.9% 805 28.5% 1055 37.4% 863 30.6% 901 32.0%
8 2009 524 37.8% 474 34.1% 390 28.1% 393 28.0% 554 39.4% 459 32.6%
2010 462 32.7% 444 31.4% 506 35.8% 391 27.9% 490 35.0% 519 37.1%
Grand Total
2009 3932 32.7% 5486 45.7% 2589 21.6% 2938 24.6% 4835 40.5% 4175 34.9%
2010 4069 33.1% 5286 42.9% 2955 24.0% 3241 26.4% 4574 37.3% 4453 36.3%

15
Demographics and Science and Social Studies Tables 11 and 12 present Science and Social Studies data for demographic groupings of
students in Charleston County. These groupings include gender (female, male), ethnicity (African American, Hispanic, and white), and lunch program participation (free/reduced price lunch, not free/reduced price lunch). Table 11 includes percentages of students scoring Met and Exemplary, while Table 12 presents percentages of students scoring at the Exemplary level.
Table 11 Palmetto Assessment of State Standards
Percent of CCSD Students Scoring Met and Exemplary By Demographics
Science and Social Studies Spring 2009 and Spring 2010
Grade Year
Science Social Studies
Gender Ethnicity Meal Programs Gender Ethnicity Meal Programs
Female Male African
American Hispanic White F/R
Lunch
Not F/R
Lunch Female Male African
American Hispanic White F/R
Lunch
Not F/R
Lunch
3 2009 63.5% 64.4% 44.6% 52.5% 86.0% 46.5% 85.9% 81.9% 76.4% 66.9% 67.7% 94.0% 67.6% 92.6% 2010 54.3% 56.6% 32.1% 37.1% 82.9% 36.0% 84.3% 77.9% 74.7% 62.4% 69.8% 92.0% 64.2% 93.2%
4 2009 69.9% 67.6% 47.6% 59.2% 91.0% 51.4% 88.2% 85.3% 81.1% 72.3% 76.1% 94.8% 73.2% 94.5% 2010 70.3% 69.5% 50.3% 63.5% 90.7% 53.9% 89.7% 81.7% 80.3% 69.2% 72.9% 94.1% 70.6% 94.0%
5 2009 69.1% 68.6% 49.9% 56.6% 89.4% 52.2% 86.0% 74.2% 73.2% 56.2% 71.0% 92.6% 56.9% 91.7% 2010 69.5% 66.9% 46.9% 61.4% 88.5% 50.6% 88.7% 71.7% 69.0% 53.1% 53.4% 89.4% 54.8% 88.0%
6 2009 63.7% 61.7% 40.3% 54.9% 87.6% 41.9% 83.5% 83.3% 76.6% 68.7% 81.8% 91.8% 70.2% 89.9% 2010 62.8% 59.9% 38.3% 53.6% 85.7% 40.4% 84.2% 81.0% 78.4% 66.4% 70.5% 93.7% 67.6% 93.2%
7 2009 74.2% 69.1% 52.9% 65.9% 90.9% 53.3% 88.2% 65.1% 64.1% 45.5% 59.8% 84.0% 46.4% 81.1% 2010 74.4% 70.5% 55.4% 66.4% 90.3% 57.0% 88.1% 63.8% 61.5% 44.0% 54.3% 82.4% 44.0% 81.5%
8 2009 60.9% 63.6% 38.4% 47.7% 89.0% 39.3% 83.1% 74.1% 70.1% 57.5% 73.3% 88.7% 57.5% 85.3% 2010 71.3% 63.6% 44.7% 54.7% 90.4% 45.5% 87.8% 73.9% 70.4% 55.1% 74.6% 87.8% 56.2% 87.2%
Grand Total
2009 68.1% 66.5% 46.7% 57.5% 89.5% 48.7% 86.4% 77.2% 73.6% 61.1% 71.0% 90.8% 62.4% 88.9% 2010 68.1% 65.8% 46.4% 57.5% 88.7% 48.9% 87.6% 74.9% 72.3% 58.4% 66.0% 89.7% 60.0% 89.1%

16
Gender and Science and Social Studies. In 2010, percentages of females scoring Met and Exemplary in Science were higher than percentages of males in grades 5, 6, 7, and 8 (See Table 11). Males outperformed females significantly (more than one percentage point) in grade 3 (see Table 11). The most striking difference in the Met and Exemplary category was noted in grade 8 where females outperformed males by 7.7 points. At the Exemplary level in Science in 2010, males matched or outperformed females in every grade. (see Table 12).
In Social Studies in 2010, females outperformed males in the Met and Exemplary category in all grades (see Table 11). At the Exemplary level in Social Studies, males outperformed females in every grade. (see Table 12).
Table 12 Palmetto Assessment of State Standards
Percent of CCSD Students Scoring Exemplary By Demographics
Science and Social Studies Spring 2009 and Spring 2010
Grade Year
Science Social Studies
Gender Ethnicity Meal Programs Gender Ethnicity Meal Programs
Female Male African
American Hispanic White F/R
Meals
Not F/R
Meals Female Male African
American Hispanic White F/R
Meals
Not F/R
Meals
3 2009 19.9% 25.1% 5.2% 13.1% 42.2% 6.6% 42.6% 42.1% 39.4% 19.0% 21.2% 66.3% 18.6% 66.5% 2010 24.9% 26.6% 5.7% 12.1% 49.2% 9.2% 50.3% 39.1% 42.5% 17.0% 24.0% 68.9% 20.3% 69.9%
4 2009 20.3% 21.8% 4.3% 11.7% 38.6% 6.3% 37.7% 36.9% 38.5% 15.1% 23.3% 62.0% 16.9% 61.1% 2010 16.4% 21.6% 3.5% 9.4% 35.5% 5.4% 35.9% 36.9% 40.6% 17.2% 27.1% 62.0% 18.8% 63.6%
5 2009 14.3% 18.8% 2.8% 6.0% 31.9% 4.3% 29.2% 31.1% 36.7% 12.3% 11.6% 59.1% 12.5% 56.8% 2010 19.7% 21.9% 3.5% 13.3% 37.7% 6.6% 37.4% 31.8% 35.2% 13.9% 15.9% 54.7% 14.0% 55.6%
6 2009 15.1% 15.9% 3.8% 7.3% 29.1% 3.4% 27.7% 26.6% 27.2% 10.0% 22.7% 45.9% 10.9% 43.9% 2010 17.3% 16.4% 2.5% 4.3% 32.4% 4.6% 30.2% 32.8% 39.5% 15.4% 25.6% 57.3% 16.0% 58.4%
7 2009 22.2% 26.0% 6.3% 16.3% 42.2% 6.1% 40.6% 30.8% 37.5% 13.8% 29.9% 54.5% 14.2% 52.4% 2010 26.9% 30.1% 7.5% 15.7% 51.1% 8.8% 48.7% 28.9% 34.8% 12.0% 21.4% 53.5% 13.0% 51.3%
8 2009 23.2% 33.0% 5.3% 15.4% 53.7% 6.8% 47.5% 29.9% 35.3% 13.9% 15.6% 55.3% 13.6% 50.1% 2010 33.6% 37.9% 11.1% 28.1% 60.4% 13.0% 57.3% 32.7% 41.1% 13.7% 33.3% 59.6% 17.2% 56.0%
Grand Total
2009 19.6% 23.4% 4.8% 11.9% 39.7% 5.7% 37.9% 33.5% 36.4% 14.2% 22.3% 57.8% 14.9% 55.7% 2010 22.4% 25.6% 5.5% 12.9% 43.7% 7.5% 42.9% 33.7% 38.8% 14.9% 24.4% 59.1% 16.6% 58.7%

17
Ethnicity and Science and Social Studies. Large achievement gaps exist between white and Hispanic students and white and African American students in Science and Social Studies PASS results. Whites outperformed Hispanic students in percentages scoring Met and Exemplary and those scoring Exemplary in both subjects. Whites outperformed African American students in Science and Social Studies in the Met and Exemplary and Exemplary categories in all grades.
Reduction of the Achievement Gap in Science and Social Studies. In 2010, the
achievement gap between whites and Hispanics in Science in the Met and Exemplary category lessened in grade 4 (4.6 points), 5 (5.7 points), 7 (1.1 points) and 8 (5.6 points). (see Table 11). The achievement gap between whites and Hispanics in the Met and Exemplary level in Social Studies lessened in grades 3 (4.1 points) and grade 8 (2.2 points). The achievement gap between whites and African Americans in Science at the Met and Exemplary level lessened in grade 4 (3.0 points), grade 7 (3.1 points) and grade 8 (4.9 points). The achievement gap between whites and African Americans in Social Studies increased in all grades except seventh (see Table 11).
The Science achievement gap between whites and Hispanics in the Exemplary category
decreased in grade 5 (1.5 points) and grade 8 (6.0 points). The Science achievement gap between whites and African Americans in the Exemplary category decreased in grade 4 (2.3 points). In Social Studies, the achievement gap between whites and Hispanics in the Exemplary category decreased 3.8 points in grade 4, 8.7 points in grade 5, and 13.4 points in grade 8. For African Americans, the Exemplary achievement gap decreased in grade 4 by 2.1 points and in grade 5 by 6.0 points.
Lunch Program Participation and Science. Students who participate in free or reduced price lunch programs perform significantly poorer than non-participating students in Science. In Science in 2010, 84.2% to 89.7% of non-participating students scored Met and Exemplary, while 36.0% to 57.0% of participating students scored Met and Exemplary (see Table 11). Differences were also large for percentages of students scoring at the Exemplary level. Non-participating students outperformed participating students by 25.6% to 44.3% in Science (Table 12).
Lunch Program Participation and Achievement Gap in Science. The Met and
Exemplary achievement gap in 2010 decreased in grades 4 (1.0 points), 7 (3.8 points), and 8 (1.5 points) in Science (see Table 11). As seen in Table 12, the Exemplary achievement gap increased from 2009 to 2010 in Science in grade 3 (5.1 points), grade 5 (5.9 points), grade 6 (1.3 points), grade 7 (5.4 points), and grade 8 (3.6 points).
Lunch Program Participation and Social Studies Students who participate in free or
reduced price lunch programs performed significantly poorer than participating students in Social Studies. In Social Studies in 2010, 81.5% to 94.0% of non-participating students scored Met and Exemplary, while 44.0% to 70.6% of participating students scored Met and Exemplary.
Lunch Program Participation and Achievement Gap in Social Studies. As seen in
Table 11, the Met and Exemplary achievement gap in Social Studies decreased in 2010 in grade 5 by 1.6 points and increased in grade 3 (4.0 points), grade 4 (2.1 points), grade 6 (5.9 points), grade 7 (2.8 points) and grade 8 (3.2 points). As seen in Table 12, the Exemplary achievement gap decreased in grade 5 by 2.7 points. It increased significantly (more than 1 point) in grades 3, 6, and 8, while in grades 4 and 7 it remained essentially the same.

18
Comparisons with South Carolina
Table 13 presents percentages of students in Charleston County and South Carolina who
scored at each performance level on the Science and Social Studies tests. Data are shown for 2009 and 2010.
In 2010, percentages of students in Charleston County scoring Met and Exemplary range
from 55.5% to 72.4% in Science and from 62.6% to 81.0% in Social Studies for the grades tested (Table 13). Charleston students scored higher than South Carolina students by 2.2 points in fifth grade Science. South Carolina students outperformed Charleston students in seventh grade by one point. Both Charleston and South Carolina students performed similarly in all other grades in Science in the Met and Exemplary category. In Social Studies in 2010, Charleston students outperformed SC students in the Met and Exemplary category in four grades: 3, 4, 5, and 8. In all other grades they performed essentially the same.
One notable finding was that Charleston students outperformed SC students at every
grade level in both Science and Social Studies in the Exemplary category (Table 13). The differences ranged from 1.7 to 4.4 percentage points in Science and 3.3 to 11.6 percentage points in Social Studies.
Table 13 Palmetto Assessment of State Standards
Percent of CCSD Students vs. Percent of SC Students Scoring at Each Performance Level
Science and Social Studies Spring 2009 and Spring 2010
Gr Year
Science Social Studies
Not Met Met Exemplary Met & Exemplary Not Met Met Exemplary Met & Exemplary
CCSD SC CCSD SC CCSD SC CCSD SC CCSD SC CCSD SC CCSD SC CCSD SC
3
2009 36.1% 38.4% 41.4% 43.1% 22.5% 18.4% 64.0% 61.6% 20.9% 25.6% 38.4% 43.2% 40.7% 31.2% 79.1% 74.4%
2010 44.5% 44.3% 29.7% 33.0% 25.8% 22.7% 55.5% 55.7% 23.8% 26.8% 35.3% 41.6% 40.9% 31.6% 76.2% 73.2%
4
2009 31.3% 31.3% 47.7% 53.1% 21.1% 15.6% 68.7% 68.7% 16.8% 20.2% 45.5% 52.1% 37.7% 27.7% 83.2% 79.8%
2010 30.1% 30.7% 50.9% 54.0% 19.0% 15.2% 69.9% 69.3% 19.0% 23.8% 42.2% 48.9% 38.8% 27.2% 81.0% 76.2%
5
2009 31.2% 31.7% 52.3% 54.1% 16.6% 14.2% 68.8% 68.3% 26.3% 30.0% 39.8% 42.4% 33.9% 27.6% 73.7% 70.0%
2010 31.8% 34.0% 47.4% 49.6% 20.8% 16.4% 68.2% 66.0% 29.6% 33.9% 36.9% 41.7% 33.5% 24.4% 70.4% 66.1%
6
2009 37.4% 36.0% 47.1% 49.7% 15.5% 14.2% 62.6% 64.0% 20.3% 20.4% 52.9% 55.7% 26.9% 23.9% 79.7% 79.6%
2010 38.6% 39.1% 44.5% 46.7% 16.8% 14.2% 61.4% 60.9% 20.3% 20.6% 43.6% 51.0% 36.1% 28.4% 79.7% 79.4%
7
2009 28.4% 28.9% 47.4% 48.9% 24.2% 22.3% 71.6% 71.1% 35.4% 39.8% 30.3% 32.5% 34.2% 27.8% 64.6% 60.2%
2010 27.6% 26.6% 43.9% 46.5% 28.5% 26.8% 72.4% 73.4% 37.4% 38.0% 30.6% 33.3% 32.0% 28.7% 62.6% 62.0%
8
2009 37.8% 37.7% 34.1% 40.0% 28.1% 22.3% 62.2% 62.3% 28.0% 30.4% 39.4% 40.3% 32.6% 29.3% 72.0% 69.6%
2010 32.7% 32.3% 31.4% 36.0% 35.8% 31.7% 67.3% 67.7% 27.9% 31.2% 35.0% 35.7% 37.1% 33.1% 72.1% 68.8%

19
Individual school data for Writing, ELA, Math, Science, and Social Studies are included in the tables of results that are presented in the appendices. They contain percentages of students within each school scoring at each of the three performance levels in Writing (Appendix A), ELA and Math (Appendix B) and in Science and Social Studies (Appendix C). In addition, the tables provide data on the percentages of students within each school who scored Met and Exemplary.
20
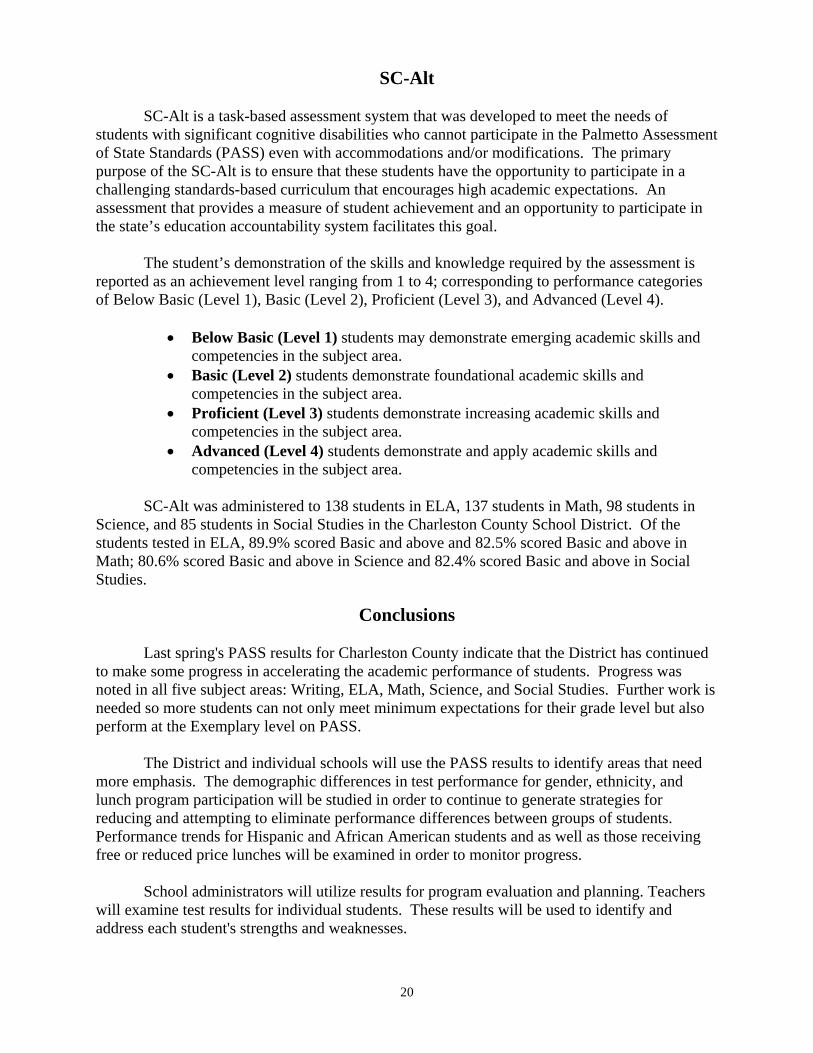
SC-Alt SC-Alt is a task-based assessment system that was developed to meet the needs of
students with significant cognitive disabilities who cannot participate in the Palmetto Assessment of State Standards (PASS) even with accommodations and/or modifications. The primary purpose of the SC-Alt is to ensure that these students have the opportunity to participate in a challenging standards-based curriculum that encourages high academic expectations. An assessment that provides a measure of student achievement and an opportunity to participate in the state’s education accountability system facilitates this goal.
The student’s demonstration of the skills and knowledge required by the assessment is
reported as an achievement level ranging from 1 to 4; corresponding to performance categories of Below Basic (Level 1), Basic (Level 2), Proficient (Level 3), and Advanced (Level 4).
• Below Basic (Level 1) students may demonstrate emerging academic skills and
competencies in the subject area. • Basic (Level 2) students demonstrate foundational academic skills and
competencies in the subject area. • Proficient (Level 3) students demonstrate increasing academic skills and
competencies in the subject area. • Advanced (Level 4) students demonstrate and apply academic skills and
competencies in the subject area. SC-Alt was administered to 138 students in ELA, 137 students in Math, 98 students in
Science, and 85 students in Social Studies in the Charleston County School District. Of the students tested in ELA, 89.9% scored Basic and above and 82.5% scored Basic and above in Math; 80.6% scored Basic and above in Science and 82.4% scored Basic and above in Social Studies.
Conclusions
Last spring's PASS results for Charleston County indicate that the District has continued
to make some progress in accelerating the academic performance of students. Progress was noted in all five subject areas: Writing, ELA, Math, Science, and Social Studies. Further work is needed so more students can not only meet minimum expectations for their grade level but also perform at the Exemplary level on PASS.
The District and individual schools will use the PASS results to identify areas that need
more emphasis. The demographic differences in test performance for gender, ethnicity, and lunch program participation will be studied in order to continue to generate strategies for reducing and attempting to eliminate performance differences between groups of students. Performance trends for Hispanic and African American students and as well as those receiving free or reduced price lunches will be examined in order to monitor progress.
School administrators will utilize results for program evaluation and planning. Teachers
will examine test results for individual students. These results will be used to identify and address each student's strengths and weaknesses.

21
FIGURES
Pages 22-46 have been removed, please refer to tables in the text.

47
APPENDIX A
PALMETTO ASSESSMENT OF STATE STANDARDS (PASS)
Percent at Each Performance Level in Individual Schools
Writing
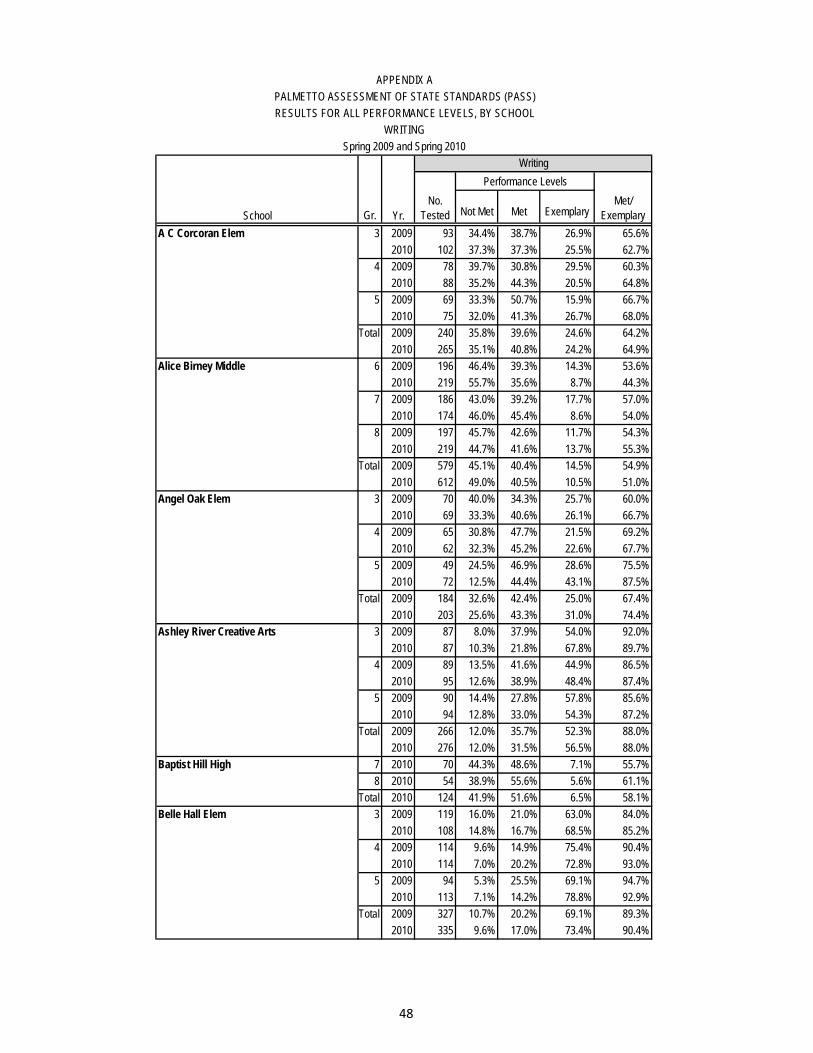
Not Met Met Exemplary
A C Corcoran Elem 3 2009 93 34.4% 38.7% 26.9% 65.6% 2010 102 37.3% 37.3% 25.5% 62.7%
4 2009 78 39.7% 30.8% 29.5% 60.3% 2010 88 35.2% 44.3% 20.5% 64.8%
5 2009 69 33.3% 50.7% 15.9% 66.7% 2010 75 32.0% 41.3% 26.7% 68.0%
Total 2009 240 35.8% 39.6% 24.6% 64.2% 2010 265 35.1% 40.8% 24.2% 64.9%
Alice Birney Middle 6 2009 196 46.4% 39.3% 14.3% 53.6% 2010 219 55.7% 35.6% 8.7% 44.3%
7 2009 186 43.0% 39.2% 17.7% 57.0% 2010 174 46.0% 45.4% 8.6% 54.0%
8 2009 197 45.7% 42.6% 11.7% 54.3% 2010 219 44.7% 41.6% 13.7% 55.3%
Total 2009 579 45.1% 40.4% 14.5% 54.9% 2010 612 49.0% 40.5% 10.5% 51.0%
Angel Oak Elem 3 2009 70 40.0% 34.3% 25.7% 60.0% 2010 69 33.3% 40.6% 26.1% 66.7%
4 2009 65 30.8% 47.7% 21.5% 69.2% 2010 62 32.3% 45.2% 22.6% 67.7%
5 2009 49 24.5% 46.9% 28.6% 75.5% 2010 72 12.5% 44.4% 43.1% 87.5%
Total 2009 184 32.6% 42.4% 25.0% 67.4% 2010 203 25.6% 43.3% 31.0% 74.4%
Ashley River Creative Arts 3 2009 87 8.0% 37.9% 54.0% 92.0% 2010 87 10.3% 21.8% 67.8% 89.7%
4 2009 89 13.5% 41.6% 44.9% 86.5% 2010 95 12.6% 38.9% 48.4% 87.4%
5 2009 90 14.4% 27.8% 57.8% 85.6% 2010 94 12.8% 33.0% 54.3% 87.2%
Total 2009 266 12.0% 35.7% 52.3% 88.0% 2010 276 12.0% 31.5% 56.5% 88.0%
Baptist Hill High 7 2010 70 44.3% 48.6% 7.1% 55.7%8 2010 54 38.9% 55.6% 5.6% 61.1%
Total 2010 124 41.9% 51.6% 6.5% 58.1%Belle Hall Elem 3 2009 119 16.0% 21.0% 63.0% 84.0%
2010 108 14.8% 16.7% 68.5% 85.2%4 2009 114 9.6% 14.9% 75.4% 90.4% 2010 114 7.0% 20.2% 72.8% 93.0%
5 2009 94 5.3% 25.5% 69.1% 94.7% 2010 113 7.1% 14.2% 78.8% 92.9%
Total 2009 327 10.7% 20.2% 69.1% 89.3% 2010 335 9.6% 17.0% 73.4% 90.4%
School
Performance LevelsWriting
No. TestedYr.Gr.
Met/ Exemplary
APPENDIX APALMETTO ASSESSMENT OF STATE STANDARDS (PASS)RESULTS FOR ALL PERFORMANCE LEVELS, BY SCHOOL
WRITINGSpring 2009 and Spring 2010
48

Not Met Met ExemplarySchool
Performance LevelsWriting
No. TestedYr.Gr.
Met/ Exemplary
Blaney Elem 3 2009 20 55.0% 20.0% 25.0% 45.0% 2010 29 20.7% 37.9% 41.4% 79.3%
4 2009 29 34.5% 27.6% 37.9% 65.5% 2010 18 27.8% 50.0% 22.2% 72.2%
5 2009 28 32.1% 57.1% 10.7% 67.9% 2010 28 32.1% 35.7% 32.1% 67.9%
6 2010 19 31.6% 52.6% 15.8% 68.4%Total 2009 77 39.0% 36.4% 24.7% 61.0%
2010 94 27.7% 42.6% 29.8% 72.3%Brentwood Middle 6 2009 114 73.7% 24.6% 1.8% 26.3%
7 2009 121 55.4% 40.5% 4.1% 44.6%8 2009 105 74.3% 23.8% 1.9% 25.7%
Total 2009 340 67.4% 30.0% 2.6% 32.6%Buist Academy 3 2009 39 5.1% 15.4% 79.5% 94.9%
2010 40 0.0% 5.0% 95.0% 100.0%4 2009 51 3.9% 7.8% 88.2% 96.1% 2010 49 0.0% 12.2% 87.8% 100.0%
5 2009 50 0.0% 22.0% 78.0% 100.0% 2010 49 0.0% 12.2% 87.8% 100.0%
6 2009 48 2.1% 22.9% 75.0% 97.9% 2010 47 0.0% 10.6% 89.4% 100.0%
7 2009 49 4.1% 8.2% 87.8% 95.9% 2010 46 2.2% 8.7% 89.1% 97.8%
8 2009 48 0.0% 14.6% 85.4% 100.0% 2010 47 0.0% 10.6% 89.4% 100.0%
Total 2009 285 2.5% 15.1% 82.5% 97.5% 2010 278 0.4% 10.1% 89.6% 99.6%
Burke High 7 2009 78 60.3% 34.6% 5.1% 39.7% 2010 63 50.8% 47.6% 1.6% 49.2%
8 2009 69 55.1% 33.3% 11.6% 44.9% 2010 83 66.3% 26.5% 7.2% 33.7%
Total 2009 147 57.8% 34.0% 8.2% 42.2% 2010 146 59.6% 35.6% 4.8% 40.4%
C E Williams Middle 6 2009 228 24.1% 50.9% 25.0% 75.9% 2010 197 19.8% 40.1% 40.1% 80.2%
7 2009 260 22.3% 42.7% 35.0% 77.7% 2010 231 26.8% 39.8% 33.3% 73.2%
8 2009 187 19.8% 51.3% 28.9% 80.2% 2010 239 19.7% 44.4% 36.0% 80.3%
Total 2009 675 22.2% 47.9% 29.9% 77.8% 2010 667 22.2% 41.5% 36.3% 77.8%
49

Not Met Met ExemplarySchool
Performance LevelsWriting
No. TestedYr.Gr.
Met/ Exemplary
Charles Pinckney Elem 3 2009 302 5.3% 13.9% 80.8% 94.7% 2010 304 6.3% 15.1% 78.6% 93.8%
4 2009 334 9.6% 22.2% 68.3% 90.4% 2010 334 4.2% 26.0% 69.8% 95.8%
5 2009 308 5.5% 26.0% 68.5% 94.5% 2010 341 6.5% 22.9% 70.7% 93.5%
Total 2009 944 6.9% 20.8% 72.4% 93.1% 2010 979 5.6% 21.6% 72.8% 94.4%
Charleston Progressive 3 2009 27 7.4% 33.3% 59.3% 92.6% 2010 24 20.8% 45.8% 33.3% 79.2%
4 2009 24 8.3% 33.3% 58.3% 91.7% 2010 32 21.9% 53.1% 25.0% 78.1%
5 2009 24 33.3% 29.2% 37.5% 66.7% 2010 34 29.4% 26.5% 44.1% 70.6%
6 2009 24 25.0% 41.7% 33.3% 75.0% 2010 25 32.0% 40.0% 28.0% 68.0%
7 2009 38 34.2% 44.7% 21.1% 65.8%8 2009 42 45.2% 31.0% 23.8% 54.8%
Total 2009 179 27.9% 35.8% 36.3% 72.1% 2010 115 26.1% 40.9% 33.0% 73.9%
Charleston School Of The Arts 6 2009 155 3.2% 28.4% 68.4% 96.8% 2010 160 2.5% 23.8% 73.8% 97.5%
7 2009 154 3.2% 22.1% 74.7% 96.8% 2010 162 4.9% 24.1% 71.0% 95.1%
8 2009 153 2.6% 43.1% 54.2% 97.4% 2010 162 3.1% 22.8% 74.1% 96.9%
Total 2009 462 3.0% 31.2% 65.8% 97.0% 2010 484 3.5% 23.6% 72.9% 96.5%
Charlestowne Academy 3 2009 14 14.3% 42.9% 42.9% 85.7%4 2009 21 38.1% 52.4% 9.5% 61.9%5 2009 20 55.0% 45.0% 0.0% 45.0%6 2009 46 37.0% 50.0% 13.0% 63.0%7 2009 43 25.6% 60.5% 14.0% 74.4%8 2009 40 27.5% 45.0% 27.5% 72.5%
Total 2009 184 32.6% 50.5% 16.8% 67.4%Chicora Elem 3 2009 48 58.3% 31.3% 10.4% 41.7%
2010 65 60.0% 30.8% 9.2% 40.0%4 2009 47 61.7% 34.0% 4.3% 38.3% 2010 58 29.3% 55.2% 15.5% 70.7%
5 2009 39 35.9% 53.8% 10.3% 64.1% 2010 45 57.8% 35.6% 6.7% 42.2%
Total 2009 134 53.0% 38.8% 8.2% 47.0% 2010 168 48.8% 40.5% 10.7% 51.2%
50

Not Met Met ExemplarySchool
Performance LevelsWriting
No. TestedYr.Gr.
Met/ Exemplary
Daniel Jenkins Academy 6 2009 39 59.0% 38.5% 2.6% 41.0% 2010 36 80.6% 19.4% 0.0% 19.4%
7 2009 44 65.9% 29.5% 4.5% 34.1% 2010 55 74.5% 25.5% 0.0% 25.5%
8 2009 54 74.1% 24.1% 1.9% 25.9% 2010 46 76.1% 21.7% 2.2% 23.9%
Total 2009 137 67.2% 29.9% 2.9% 32.8% 2010 137 76.6% 22.6% 0.7% 23.4%
Drayton Hall Elem 3 2009 140 13.6% 27.9% 58.6% 86.4% 2010 122 25.4% 34.4% 40.2% 74.6%
4 2009 112 21.4% 37.5% 41.1% 78.6% 2010 135 20.7% 39.3% 40.0% 79.3%
5 2009 89 12.4% 44.9% 42.7% 87.6% 2010 109 17.4% 28.4% 54.1% 82.6%
Total 2009 341 15.8% 35.5% 48.7% 84.2% 2010 366 21.3% 34.4% 44.3% 78.7%
Edith L Frierson Elem 3 2009 20 15.0% 40.0% 45.0% 85.0% 2010 13 38.5% 15.4% 46.2% 61.5%
4 2009 10 20.0% 20.0% 60.0% 80.0% 2010 15 6.7% 40.0% 53.3% 93.3%
5 2009 12 16.7% 33.3% 50.0% 83.3% 2010 13 30.8% 38.5% 30.8% 69.2%
6 2009 10 0.0% 40.0% 60.0% 100.0% 2010 11 9.1% 45.5% 45.5% 90.9%
Total 2009 52 13.5% 34.6% 51.9% 86.5% 2010 52 21.2% 34.6% 44.2% 78.8%
Edmund A Burns Elem 3 2009 55 54.5% 32.7% 12.7% 45.5% 2010 45 55.6% 44.4% 0.0% 44.4%
4 2009 67 53.7% 40.3% 6.0% 46.3% 2010 53 56.6% 32.1% 11.3% 43.4%
5 2009 73 65.8% 27.4% 6.8% 34.2% 2010 62 53.2% 29.0% 17.7% 46.8%
Total 2009 195 58.5% 33.3% 8.2% 41.5% 2010 160 55.0% 34.4% 10.6% 45.0%
Ellington Elem 3 2009 29 27.6% 44.8% 27.6% 72.4% 2010 37 35.1% 32.4% 32.4% 64.9%
4 2009 28 32.1% 35.7% 32.1% 67.9% 2010 24 41.7% 41.7% 16.7% 58.3%
5 2009 42 21.4% 54.8% 23.8% 78.6% 2010 23 34.8% 34.8% 30.4% 65.2%
6 2010 30 16.7% 50.0% 33.3% 83.3%Total 2009 99 26.3% 46.5% 27.3% 73.7%
2010 114 31.6% 39.5% 28.9% 68.4%
51

Not Met Met ExemplarySchool
Performance LevelsWriting
No. TestedYr.Gr.
Met/ Exemplary
Fort Johnson Middle 6 2009 177 14.7% 34.5% 50.8% 85.3% 2010 184 19.0% 34.8% 46.2% 81.0%
7 2009 180 16.1% 38.3% 45.6% 83.9% 2010 182 13.7% 36.3% 50.0% 86.3%
8 2009 156 17.3% 39.1% 43.6% 82.7% 2010 178 11.8% 35.4% 52.8% 88.2%
Total 2009 513 16.0% 37.2% 46.8% 84.0% 2010 544 14.9% 35.5% 49.6% 85.1%
Fraser Elem 3 2009 23 43.5% 39.1% 17.4% 56.5%4 2009 36 66.7% 30.6% 2.8% 33.3%5 2009 19 52.6% 42.1% 5.3% 47.4%6 2009 17 23.5% 64.7% 11.8% 76.5%
Total 2009 95 50.5% 41.1% 8.4% 49.5%Harbor View Elem 3 2009 89 10.1% 24.7% 65.2% 89.9%
2010 99 7.1% 30.3% 62.6% 92.9%4 2009 89 7.9% 40.4% 51.7% 92.1% 2010 93 10.8% 34.4% 54.8% 89.2%
5 2009 77 14.3% 33.8% 51.9% 85.7% 2010 84 14.3% 29.8% 56.0% 85.7%
Total 2009 255 10.6% 32.9% 56.5% 89.4% 2010 276 10.5% 31.5% 58.0% 89.5%
Haut Gap Middle 6 2009 71 29.6% 54.9% 15.5% 70.4% 2010 103 36.9% 35.9% 27.2% 63.1%
7 2009 63 46.0% 34.9% 19.0% 54.0% 2010 80 41.3% 50.0% 8.8% 58.8%
8 2009 73 35.6% 54.8% 9.6% 64.4% 2010 60 50.0% 43.3% 6.7% 50.0%
Total 2009 207 36.7% 48.8% 14.5% 63.3% 2010 243 41.6% 42.4% 16.0% 58.4%
Hunley Park Elem 3 2009 68 33.8% 35.3% 30.9% 66.2% 2010 71 33.8% 35.2% 31.0% 66.2%
4 2009 76 40.8% 38.2% 21.1% 59.2% 2010 65 41.5% 40.0% 18.5% 58.5%
5 2009 47 21.3% 59.6% 19.1% 78.7% 2010 58 29.3% 39.7% 31.0% 70.7%
Total 2009 191 33.5% 42.4% 24.1% 66.5% 2010 194 35.1% 38.1% 26.8% 64.9%
James B Edwards Elem 3 2009 106 19.8% 22.6% 57.5% 80.2% 2010 84 14.3% 28.6% 57.1% 85.7%
4 2009 104 11.5% 23.1% 65.4% 88.5% 2010 99 19.2% 33.3% 47.5% 80.8%
5 2009 120 7.5% 25.8% 66.7% 92.5% 2010 113 12.4% 22.1% 65.5% 87.6%
Total 2009 330 12.7% 23.9% 63.3% 87.3% 2010 296 15.2% 27.7% 57.1% 84.8%
52

Not Met Met ExemplarySchool
Performance LevelsWriting
No. TestedYr.Gr.
Met/ Exemplary
James Island Elem 3 2009 78 9.0% 29.5% 61.5% 91.0% 2010 84 17.9% 36.9% 45.2% 82.1%
4 2009 76 21.1% 44.7% 34.2% 78.9% 2010 76 13.2% 32.9% 53.9% 86.8%
5 2009 84 29.8% 36.9% 33.3% 70.2% 2010 74 33.8% 39.2% 27.0% 66.2%
Total 2009 238 20.2% 37.0% 42.9% 79.8% 2010 234 21.4% 36.3% 42.3% 78.6%
James Island Middle 6 2009 138 23.2% 45.7% 31.2% 76.8% 2010 105 17.1% 46.7% 36.2% 82.9%
7 2009 144 25.0% 43.1% 31.9% 75.0% 2010 139 31.7% 42.4% 25.9% 68.3%
8 2009 150 36.0% 35.3% 28.7% 64.0% 2010 138 25.4% 41.3% 33.3% 74.6%
Total 2009 432 28.2% 41.2% 30.6% 71.8% 2010 382 25.4% 43.2% 31.4% 74.6%
James Simons Elem 3 2009 44 40.9% 38.6% 20.5% 59.1% 2010 30 43.3% 46.7% 10.0% 56.7%
4 2009 41 53.7% 36.6% 9.8% 46.3% 2010 26 42.3% 50.0% 7.7% 57.7%
5 2009 41 73.2% 24.4% 2.4% 26.8% 2010 34 17.6% 44.1% 38.2% 82.4%
6 2009 31 35.5% 64.5% 0.0% 64.5% 2010 22 36.4% 50.0% 13.6% 63.6%
Total 2009 157 51.6% 39.5% 8.9% 48.4% 2010 112 33.9% 47.3% 18.8% 66.1%
Jane Edwards Elem 3 2009 13 61.5% 23.1% 15.4% 38.5% 2010 14 50.0% 50.0% 0.0% 50.0%
4 2009 11 54.5% 18.2% 27.3% 45.5% 2010 15 46.7% 33.3% 20.0% 53.3%
5 2009 13 53.8% 38.5% 7.7% 46.2% 2010 11 45.5% 18.2% 36.4% 54.5%
6 2009 13 46.2% 30.8% 23.1% 53.8% 2010 14 57.1% 35.7% 7.1% 42.9%
7 2009 11 27.3% 72.7% 0.0% 72.7%8 2009 9 55.6% 44.4% 0.0% 44.4%
Total 2009 70 50.0% 37.1% 12.9% 50.0% 2010 54 50.0% 35.2% 14.8% 50.0%
Jennie Moore Elem 3 2009 116 16.4% 19.8% 63.8% 83.6% 2010 117 15.4% 24.8% 59.8% 84.6%
4 2009 106 8.5% 41.5% 50.0% 91.5% 2010 103 13.6% 26.2% 60.2% 86.4%
5 2009 103 13.6% 22.3% 64.1% 86.4% 2010 115 6.1% 43.5% 50.4% 93.9%
Total 2009 325 12.9% 27.7% 59.4% 87.1% 2010 335 11.6% 31.6% 56.7% 88.4%
53

Not Met Met ExemplarySchool
Performance LevelsWriting
No. TestedYr.Gr.
Met/ Exemplary
Jerry Zucker Middle 6 2010 125 27.2% 44.8% 28.0% 72.8%7 2010 147 37.4% 43.5% 19.0% 62.6%8 2010 118 43.2% 46.6% 10.2% 56.8%
Total 2010 390 35.9% 44.9% 19.2% 64.1%Ladson Elem 3 2009 94 45.7% 29.8% 24.5% 54.3%
2010 83 43.4% 33.7% 22.9% 56.6%4 2009 86 25.6% 48.8% 25.6% 74.4% 2010 87 25.3% 31.0% 43.7% 74.7%
5 2009 84 39.3% 38.1% 22.6% 60.7% 2010 77 24.7% 44.2% 31.2% 75.3%
Total 2009 264 37.1% 38.6% 24.2% 62.9% 2010 247 31.2% 36.0% 32.8% 68.8%
Laing Middle 6 2009 120 10.8% 47.5% 41.7% 89.2% 2010 165 15.2% 36.4% 48.5% 84.8%
7 2009 131 16.8% 23.7% 59.5% 83.2% 2010 129 14.7% 41.1% 44.2% 85.3%
8 2009 157 24.8% 40.8% 34.4% 75.2% 2010 138 13.8% 39.9% 46.4% 86.2%
Total 2009 408 18.1% 37.3% 44.6% 81.9% 2010 432 14.6% 38.9% 46.5% 85.4%
Lambs Elem 3 2009 62 50.0% 29.0% 21.0% 50.0% 2010 57 42.1% 33.3% 24.6% 57.9%
4 2009 59 35.6% 37.3% 27.1% 64.4% 2010 61 41.0% 42.6% 16.4% 59.0%
5 2009 37 27.0% 32.4% 40.5% 73.0% 2010 54 27.8% 37.0% 35.2% 72.2%
Total 2009 158 39.2% 32.9% 27.8% 60.8% 2010 172 37.2% 37.8% 25.0% 62.8%
Liberty Hill Academy 3 2009 3 * * * * 2010 3 * * * *
4 2009 4 * * * * 2010 7 85.7% 0.0% 14.3% 14.3%
5 2009 7 100.0% 0.0% 0.0% 0.0% 2010 4 * * * *
6 2009 16 100.0% 0.0% 0.0% 0.0% 2010 9 100.0% 0.0% 0.0% 0.0%
7 2009 14 100.0% 0.0% 0.0% 0.0% 2010 14 100.0% 0.0% 0.0% 0.0%
8 2009 8 75.0% 25.0% 0.0% 25.0% 2010 20 90.0% 10.0% 0.0% 10.0%
Total 2009 52 96.2% 3.8% 0.0% 3.8% 2010 57 93.0% 5.3% 1.8% 7.0%
Lincoln High 7 2010 23 26.1% 60.9% 13.0% 73.9%8 2010 20 30.0% 50.0% 20.0% 70.0%
Total 2010 43 27.9% 55.8% 16.3% 72.1%*Scores not reported for any category in which there are fewer than six students.
54

Not Met Met ExemplarySchool
Performance LevelsWriting
No. TestedYr.Gr.
Met/ Exemplary
Malcolm C Hursey Elem 3 2009 41 48.8% 36.6% 14.6% 51.2% 2010 50 60.0% 32.0% 8.0% 40.0%
4 2009 31 48.4% 38.7% 12.9% 51.6% 2010 44 50.0% 38.6% 11.4% 50.0%
5 2009 35 57.1% 34.3% 8.6% 42.9% 2010 32 50.0% 43.8% 6.3% 50.0%
Total 2009 107 51.4% 36.4% 12.1% 48.6% 2010 126 54.0% 37.3% 8.7% 46.0%
Mamie Whitesides Elem 3 2009 111 15.3% 23.4% 61.3% 84.7% 2010 90 11.1% 30.0% 58.9% 88.9%
4 2009 92 9.8% 33.7% 56.5% 90.2% 2010 117 16.2% 29.1% 54.7% 83.8%
5 2009 94 13.8% 22.3% 63.8% 86.2% 2010 98 8.2% 28.6% 63.3% 91.8%
Total 2009 297 13.1% 26.3% 60.6% 86.9% 2010 305 12.1% 29.2% 58.7% 87.9%
Mary Ford Elem 3 2009 50 46.0% 30.0% 24.0% 54.0% 2010 75 57.3% 29.3% 13.3% 42.7%
4 2009 48 68.8% 25.0% 6.3% 31.3% 2010 43 37.2% 48.8% 14.0% 62.8%
5 2009 41 51.2% 24.4% 24.4% 48.8% 2010 44 34.1% 45.5% 20.5% 65.9%
Total 2009 139 55.4% 26.6% 18.0% 44.6% 2010 162 45.7% 38.9% 15.4% 54.3%
Matilda Dunston Elem 3 2009 39 33.3% 28.2% 38.5% 66.7% 2010 48 41.7% 18.8% 39.6% 58.3%
Total 2009 39 33.3% 28.2% 38.5% 66.7% 2010 48 41.7% 18.8% 39.6% 58.3%
McClellanville Middle 6 2009 24 33.3% 41.7% 25.0% 66.7%7 2009 25 40.0% 48.0% 12.0% 60.0%8 2009 28 46.4% 39.3% 14.3% 53.6%
Total 2009 77 40.3% 42.9% 16.9% 59.7%Memminger Elem 3 2009 38 23.7% 42.1% 34.2% 76.3%
2010 53 54.7% 26.4% 18.9% 45.3%4 2009 31 41.9% 48.4% 9.7% 58.1% 2010 40 32.5% 42.5% 25.0% 67.5%
5 2009 30 43.3% 46.7% 10.0% 56.7% 2010 36 61.1% 36.1% 2.8% 38.9%
6 2009 25 64.0% 28.0% 8.0% 36.0% 2010 33 48.5% 51.5% 0.0% 51.5%
Total 2009 124 41.1% 41.9% 16.9% 58.9% 2010 162 49.4% 37.7% 13.0% 50.6%
55

Not Met Met ExemplarySchool
Performance LevelsWriting
No. TestedYr.Gr.
Met/ Exemplary
Midland Park Elem 3 2009 95 48.4% 27.4% 24.2% 51.6% 2010 105 38.1% 42.9% 19.0% 61.9%
4 2009 92 53.3% 38.0% 8.7% 46.7% 2010 93 40.9% 44.1% 15.1% 59.1%
5 2009 100 61.0% 29.0% 10.0% 39.0% 2010 89 53.9% 31.5% 14.6% 46.1%
Total 2009 287 54.4% 31.4% 14.3% 45.6% 2010 287 43.9% 39.7% 16.4% 56.1%
Military Magnet Academy 6 2009 99 39.4% 41.4% 19.2% 60.6% 2010 80 46.3% 35.0% 18.8% 53.8%
7 2009 63 38.1% 55.6% 6.3% 61.9% 2010 100 41.0% 48.0% 11.0% 59.0%
8 2009 83 41.0% 48.2% 10.8% 59.0% 2010 61 23.0% 65.6% 11.5% 77.0%
Total 2009 245 39.6% 47.3% 13.1% 60.4% 2010 241 38.2% 48.1% 13.7% 61.8%
Minnie Hughes Elem 3 2009 27 14.8% 55.6% 29.6% 85.2% 2010 25 16.0% 40.0% 44.0% 84.0%
4 2009 19 26.3% 63.2% 10.5% 73.7% 2010 27 37.0% 40.7% 22.2% 63.0%
5 2009 27 22.2% 63.0% 14.8% 77.8% 2010 19 21.1% 63.2% 15.8% 78.9%
6 2010 24 25.0% 50.0% 25.0% 75.0%Total 2009 73 20.5% 60.3% 19.2% 79.5%
2010 95 25.3% 47.4% 27.4% 74.7%Mitchell Elem 3 2009 47 63.8% 19.1% 17.0% 36.2%
2010 50 26.0% 42.0% 32.0% 74.0%4 2009 37 48.6% 43.2% 8.1% 51.4% 2010 46 56.5% 34.8% 8.7% 43.5%
5 2009 30 50.0% 36.7% 13.3% 50.0% 2010 45 53.3% 28.9% 17.8% 46.7%
6 2009 39 51.3% 38.5% 10.3% 48.7% 2010 39 48.7% 41.0% 10.3% 51.3%
Total 2009 153 54.2% 33.3% 12.4% 45.8% 2010 180 45.6% 36.7% 17.8% 54.4%
Montessori Community School 3 2009 11 9.1% 9.1% 81.8% 90.9% 2010 14 7.1% 35.7% 57.1% 92.9%
4 2009 16 0.0% 43.8% 56.3% 100.0% 2010 16 6.3% 31.3% 62.5% 93.8%
5 2009 17 0.0% 23.5% 76.5% 100.0% 2010 17 5.9% 52.9% 41.2% 94.1%
6 2009 7 28.6% 28.6% 42.9% 71.4% 2010 10 10.0% 30.0% 60.0% 90.0%
Total 2009 51 5.9% 27.5% 66.7% 94.1% 2010 57 7.0% 38.6% 54.4% 93.0%
56

Not Met Met ExemplarySchool
Performance LevelsWriting
No. TestedYr.Gr.
Met/ Exemplary
Morningside ARMS 6 2010 41 63.4% 29.3% 7.3% 36.6%7 2010 64 76.6% 15.6% 7.8% 23.4%8 2010 97 79.4% 17.5% 3.1% 20.6%
Total 2010 202 75.2% 19.3% 5.4% 24.8%Morningside EXCEL 6 2010 49 36.7% 49.0% 14.3% 63.3%
7 2010 66 68.2% 30.3% 1.5% 31.8%8 2010 56 44.6% 44.6% 10.7% 55.4%
Total 2010 171 51.5% 40.4% 8.2% 48.5%Morningside Middle 6 2009 123 63.4% 30.9% 5.7% 36.6%
7 2009 128 59.4% 28.1% 12.5% 40.6%8 2009 125 57.6% 36.8% 5.6% 42.4%
Total 2009 376 60.1% 31.9% 8.0% 39.9%Moultrie Middle 6 2009 287 7.7% 28.9% 63.4% 92.3%
2010 291 8.9% 30.6% 60.5% 91.1%7 2009 234 10.3% 28.6% 61.1% 89.7% 2010 306 8.5% 37.6% 53.9% 91.5%
8 2009 254 15.0% 37.8% 47.2% 85.0% 2010 247 13.0% 25.5% 61.5% 87.0%
Total 2009 775 10.8% 31.7% 57.4% 89.2% 2010 844 10.0% 31.6% 58.4% 90.0%
Mt Pleasant Academy 3 2009 73 6.8% 11.0% 82.2% 93.2% 2010 76 14.5% 22.4% 63.2% 85.5%
4 2009 78 1.3% 23.1% 75.6% 98.7% 2010 74 2.7% 21.6% 75.7% 97.3%
5 2009 61 9.8% 14.8% 75.4% 90.2% 2010 78 7.7% 20.5% 71.8% 92.3%
Total 2009 212 5.7% 16.5% 77.8% 94.3% 2010 228 8.3% 21.5% 70.2% 91.7%
Mt Zion Elem 3 2009 35 17.1% 45.7% 37.1% 82.9% 2010 27 29.6% 29.6% 40.7% 70.4%
4 2009 27 66.7% 29.6% 3.7% 33.3% 2010 37 27.0% 40.5% 32.4% 73.0%
5 2009 32 18.8% 59.4% 21.9% 81.3% 2010 25 28.0% 52.0% 20.0% 72.0%
Total 2009 94 31.9% 45.7% 22.3% 68.1% 2010 89 28.1% 40.4% 31.5% 71.9%
Murray Lasaine Elem 3 2009 32 28.1% 53.1% 18.8% 71.9% 2010 18 16.7% 33.3% 50.0% 83.3%
4 2009 26 53.8% 34.6% 11.5% 46.2% 2010 31 38.7% 29.0% 32.3% 61.3%
5 2009 33 54.5% 33.3% 12.1% 45.5% 2010 21 42.9% 38.1% 19.0% 57.1%
Total 2009 91 45.1% 40.7% 14.3% 54.9% 2010 70 34.3% 32.9% 32.9% 65.7%
57

Not Met Met ExemplarySchool
Performance LevelsWriting
No. TestedYr.Gr.
Met/ Exemplary
North Charleston Elem 3 2009 49 57.1% 30.6% 12.2% 42.9% 2010 69 66.7% 29.0% 4.3% 33.3%
4 2009 96 63.5% 28.1% 8.3% 36.5% 2010 91 40.7% 40.7% 18.7% 59.3%
5 2009 83 55.4% 34.9% 9.6% 44.6% 2010 89 40.4% 44.9% 14.6% 59.6%
Total 2009 228 59.2% 31.1% 9.6% 40.8% 2010 249 47.8% 39.0% 13.3% 52.2%
Oakland Elem 3 2009 79 41.8% 25.3% 32.9% 58.2% 2010 77 32.5% 49.4% 18.2% 67.5%
4 2009 73 45.2% 34.2% 20.5% 54.8% 2010 76 39.5% 27.6% 32.9% 60.5%
5 2009 55 30.9% 47.3% 21.8% 69.1% 2010 72 30.6% 38.9% 30.6% 69.4%
Total 2009 207 40.1% 34.3% 25.6% 59.9% 2010 225 34.2% 38.7% 27.1% 65.8%
Pepperhill Elem 3 2009 85 47.1% 36.5% 16.5% 52.9% 2010 98 43.9% 36.7% 19.4% 56.1%
4 2009 96 45.8% 38.5% 15.6% 54.2% 2010 92 48.9% 31.5% 19.6% 51.1%
5 2009 78 37.2% 35.9% 26.9% 62.8% 2010 104 35.6% 39.4% 25.0% 64.4%
Total 2009 259 43.6% 37.1% 19.3% 56.4% 2010 294 42.5% 36.1% 21.4% 57.5%
R D Schroder Middle 6 2009 67 40.3% 46.3% 13.4% 59.7%7 2009 59 30.5% 59.3% 10.2% 69.5%8 2009 84 50.0% 41.7% 8.3% 50.0%
Total 2009 210 41.4% 48.1% 10.5% 58.6%Sanders-Clyde Elem 3 2009 31 71.0% 19.4% 9.7% 29.0%
2010 51 49.0% 41.2% 9.8% 51.0%4 2009 45 68.9% 17.8% 13.3% 31.1% 2010 37 45.9% 43.2% 10.8% 54.1%
5 2009 33 60.6% 33.3% 6.1% 39.4% 2010 42 47.6% 35.7% 16.7% 52.4%
6 2009 20 40.0% 50.0% 10.0% 60.0% 2010 33 39.4% 39.4% 21.2% 60.6%
7 2009 20 50.0% 45.0% 5.0% 50.0% 2010 27 51.9% 44.4% 3.7% 48.1%
8 2009 19 52.6% 47.4% 0.0% 47.4% 2010 18 38.9% 44.4% 16.7% 61.1%
Total 2009 168 60.1% 31.5% 8.3% 39.9% 2010 208 46.2% 40.9% 13.0% 53.8%
Sixth Grade Academy 6 2010 130 55.4% 37.7% 6.9% 44.6%at McNair Total 2010 130 55.4% 37.7% 6.9% 44.6%
58

Not Met Met ExemplarySchool
Performance LevelsWriting
No. TestedYr.Gr.
Met/ Exemplary
Springfield Elem 3 2009 71 19.7% 38.0% 42.3% 80.3% 2010 76 32.9% 28.9% 38.2% 67.1%
4 2009 67 13.4% 49.3% 37.3% 86.6% 2010 81 23.5% 35.8% 40.7% 76.5%
5 2009 70 30.0% 27.1% 42.9% 70.0% 2010 74 23.0% 43.2% 33.8% 77.0%
Total 2009 208 21.2% 38.0% 40.9% 78.8% 2010 231 26.4% 35.9% 37.7% 73.6%
St Andrews Math And Science 3 2009 118 18.6% 24.6% 56.8% 81.4% 2010 116 6.9% 31.0% 62.1% 93.1%
4 2009 125 14.4% 42.4% 43.2% 85.6% 2010 125 24.0% 33.6% 42.4% 76.0%
5 2009 127 14.2% 27.6% 58.3% 85.8% 2010 125 11.2% 33.6% 55.2% 88.8%
Total 2009 370 15.7% 31.6% 52.7% 84.3% 2010 366 14.2% 32.8% 53.0% 85.8%
St James-Santee Elem 3 2009 35 31.4% 37.1% 31.4% 68.6% 2010 17 47.1% 23.5% 29.4% 52.9%
4 2009 16 37.5% 37.5% 25.0% 62.5% 2010 31 35.5% 45.2% 19.4% 64.5%
5 2009 23 56.5% 26.1% 17.4% 43.5% 2010 18 27.8% 27.8% 44.4% 72.2%
6 2010 23 78.3% 8.7% 13.0% 21.7%Total 2009 74 40.5% 33.8% 25.7% 59.5%
2010 89 47.2% 28.1% 24.7% 52.8%St. Andrews Middle 6 2009 152 27.6% 39.5% 32.9% 72.4%
2010 185 19.5% 45.9% 34.6% 80.5%7 2009 130 23.1% 47.7% 29.2% 76.9% 2010 159 21.4% 50.3% 28.3% 78.6%
8 2009 150 29.3% 48.7% 22.0% 70.7% 2010 137 24.1% 49.6% 26.3% 75.9%
Total 2009 432 26.9% 45.1% 28.0% 73.1% 2010 481 21.4% 48.4% 30.1% 78.6%
Stiles Point Elem 3 2009 116 8.6% 18.1% 73.3% 91.4% 2010 102 7.8% 34.3% 57.8% 92.2%
4 2009 103 7.8% 32.0% 60.2% 92.2% 2010 114 6.1% 29.8% 64.0% 93.9%
5 2009 86 12.8% 22.1% 65.1% 87.2% 2010 104 5.8% 22.1% 72.1% 94.2%
Total 2009 305 9.5% 23.9% 66.6% 90.5% 2010 320 6.6% 28.8% 64.7% 93.4%
59
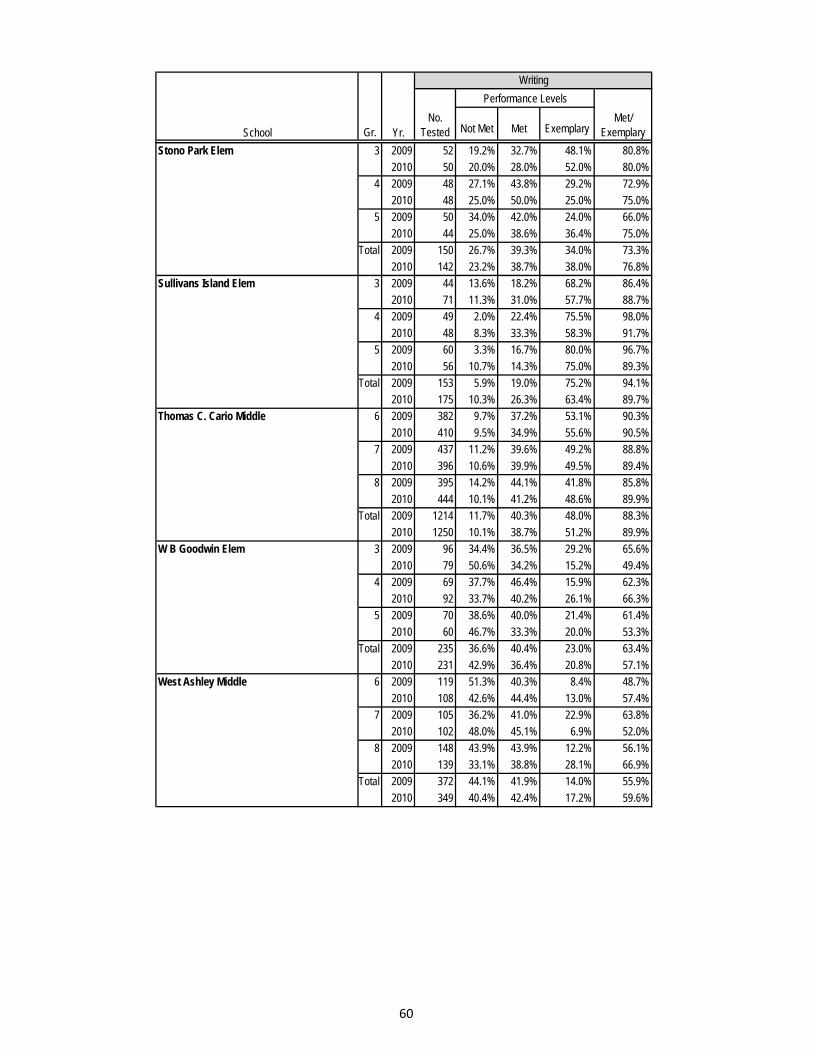
Not Met Met ExemplarySchool
Performance LevelsWriting
No. TestedYr.Gr.
Met/ Exemplary
Stono Park Elem 3 2009 52 19.2% 32.7% 48.1% 80.8% 2010 50 20.0% 28.0% 52.0% 80.0%
4 2009 48 27.1% 43.8% 29.2% 72.9% 2010 48 25.0% 50.0% 25.0% 75.0%
5 2009 50 34.0% 42.0% 24.0% 66.0% 2010 44 25.0% 38.6% 36.4% 75.0%
Total 2009 150 26.7% 39.3% 34.0% 73.3% 2010 142 23.2% 38.7% 38.0% 76.8%
Sullivans Island Elem 3 2009 44 13.6% 18.2% 68.2% 86.4% 2010 71 11.3% 31.0% 57.7% 88.7%
4 2009 49 2.0% 22.4% 75.5% 98.0% 2010 48 8.3% 33.3% 58.3% 91.7%
5 2009 60 3.3% 16.7% 80.0% 96.7% 2010 56 10.7% 14.3% 75.0% 89.3%
Total 2009 153 5.9% 19.0% 75.2% 94.1% 2010 175 10.3% 26.3% 63.4% 89.7%
Thomas C. Cario Middle 6 2009 382 9.7% 37.2% 53.1% 90.3% 2010 410 9.5% 34.9% 55.6% 90.5%
7 2009 437 11.2% 39.6% 49.2% 88.8% 2010 396 10.6% 39.9% 49.5% 89.4%
8 2009 395 14.2% 44.1% 41.8% 85.8% 2010 444 10.1% 41.2% 48.6% 89.9%
Total 2009 1214 11.7% 40.3% 48.0% 88.3% 2010 1250 10.1% 38.7% 51.2% 89.9%
W B Goodwin Elem 3 2009 96 34.4% 36.5% 29.2% 65.6% 2010 79 50.6% 34.2% 15.2% 49.4%
4 2009 69 37.7% 46.4% 15.9% 62.3% 2010 92 33.7% 40.2% 26.1% 66.3%
5 2009 70 38.6% 40.0% 21.4% 61.4% 2010 60 46.7% 33.3% 20.0% 53.3%
Total 2009 235 36.6% 40.4% 23.0% 63.4% 2010 231 42.9% 36.4% 20.8% 57.1%
West Ashley Middle 6 2009 119 51.3% 40.3% 8.4% 48.7% 2010 108 42.6% 44.4% 13.0% 57.4%
7 2009 105 36.2% 41.0% 22.9% 63.8% 2010 102 48.0% 45.1% 6.9% 52.0%
8 2009 148 43.9% 43.9% 12.2% 56.1% 2010 139 33.1% 38.8% 28.1% 66.9%
Total 2009 372 44.1% 41.9% 14.0% 55.9% 2010 349 40.4% 42.4% 17.2% 59.6%
60

Not Met Met ExemplarySchool
Performance LevelsWriting
No. TestedYr.Gr.
Met/ Exemplary
CHARTER SCHOOLSCharleston Charter Math/Science 6 2009 44 11.4% 47.7% 40.9% 88.6%
2010 37 16.2% 45.9% 37.8% 83.8%7 2009 39 17.9% 48.7% 33.3% 82.1% 2010 66 15.2% 45.5% 39.4% 84.8%
8 2009 42 16.7% 50.0% 33.3% 83.3% 2010 60 8.3% 56.7% 35.0% 91.7%
Total 2009 125 15.2% 48.8% 36.0% 84.8% 2010 163 12.9% 49.7% 37.4% 87.1%
Charleston Develop. Charter 3 2009 21 9.5% 42.9% 47.6% 90.5% 2010 22 4.5% 40.9% 54.5% 95.5%
4 2009 18 22.2% 38.9% 38.9% 77.8% 2010 20 25.0% 50.0% 25.0% 75.0%
5 2009 11 0.0% 54.5% 45.5% 100.0% 2010 18 33.3% 22.2% 44.4% 66.7%
6 2009 8 25.0% 50.0% 25.0% 75.0% 2010 12 0.0% 50.0% 50.0% 100.0%
7 2010 10 30.0% 50.0% 20.0% 70.0%Total 2009 58 13.8% 44.8% 41.4% 86.2%
2010 82 18.3% 41.5% 40.2% 81.7%East Cooper Montessori Charter 3 2009 29 0.0% 24.1% 75.9% 100.0%
2010 32 6.3% 37.5% 56.3% 93.8%4 2009 26 11.5% 38.5% 50.0% 88.5% 2010 29 3.4% 17.2% 79.3% 96.6%
5 2009 24 20.8% 25.0% 54.2% 79.2% 2010 26 7.7% 30.8% 61.5% 92.3%
6 2009 16 0.0% 50.0% 50.0% 100.0% 2010 15 20.0% 13.3% 66.7% 80.0%
7 2009 8 0.0% 25.0% 75.0% 100.0% 2010 14 7.1% 50.0% 42.9% 92.9%
8 2009 12 8.3% 25.0% 66.7% 91.7% 2010 5 * * * *
Total 2009 115 7.8% 31.3% 60.9% 92.2% 2010 121 7.4% 28.1% 64.5% 92.6%
Greg Mathis Charter High 8 2010 1 * * * *Total 2010 1 * * * *
Orange Grove Charter 3 2009 99 19.2% 37.4% 43.4% 80.8% 2010 121 15.7% 38.8% 45.5% 84.3%
4 2009 104 23.1% 40.4% 36.5% 76.9% 2010 107 12.1% 24.3% 63.6% 87.9%
5 2009 115 17.4% 40.0% 42.6% 82.6% 2010 99 20.2% 45.5% 34.3% 79.8%
Total 2009 318 19.8% 39.3% 40.9% 80.2% 2010 327 15.9% 36.1% 48.0% 84.1%
*Scores not reported for any category in which there are fewer than six students.
61

Not Met Met ExemplarySchool
Performance LevelsWriting
No. TestedYr.Gr.
Met/ Exemplary
Susan G. Boykin Charter 3 2009 27 51.9% 25.9% 22.2% 48.1% 2010 19 42.1% 36.8% 21.1% 57.9%
4 2009 15 46.7% 46.7% 6.7% 53.3% 2010 22 59.1% 27.3% 13.6% 40.9%
5 2009 23 60.9% 21.7% 17.4% 39.1% 2010 17 58.8% 29.4% 11.8% 41.2%
6 2009 24 54.2% 25.0% 20.8% 45.8% 2010 17 52.9% 29.4% 17.6% 47.1%
Total 2009 89 53.9% 28.1% 18.0% 46.1% 2010 75 53.3% 30.7% 16.0% 46.7%
62

63
APPENDIX B
PALMETTO ASSESSMENT OF STATE STANDARDS (PASS)
Percent at Each Performance Level in Individual Schools
English/Language Arts and Mathematics

School Gr. YearNo.
Tested Not Met Met ExemplaryNo.
Tested Not Met Met ExemplaryMet/
Exemplary
A C Corcoran Elem 3 2009 94 36.2% 31.9% 31.9% 63.8% 94 34.0% 36.2% 29.8% 66.0%2010 101 15.8% 43.6% 40.6% 84.2% 101 37.6% 35.6% 26.7% 62.4%
4 2009 75 32.0% 40.0% 28.0% 68.0% 75 24.0% 57.3% 18.7% 76.0%2010 87 31.0% 46.0% 23.0% 69.0% 88 30.7% 44.3% 25.0% 69.3%
5 2009 67 17.9% 59.7% 22.4% 82.1% 67 25.4% 56.7% 17.9% 74.6%2010 76 34.2% 46.1% 19.7% 65.8% 76 48.7% 40.8% 10.5% 51.3%
Total 2009 236 29.7% 42.4% 28.0% 70.3% 236 28.4% 48.7% 22.9% 71.6%2010 264 26.1% 45.1% 28.8% 73.9% 265 38.5% 40.0% 21.5% 61.5%
Alice Birney Middle 6 2009 200 54.0% 34.5% 11.5% 46.0% 200 47.0% 43.0% 10.0% 53.0%2010 214 61.7% 29.0% 9.3% 38.3% 214 61.7% 32.2% 6.1% 38.3%
7 2009 186 45.2% 39.2% 15.6% 54.8% 188 47.9% 42.6% 9.6% 52.1%2010 171 54.4% 31.0% 14.6% 45.6% 172 68.6% 27.3% 4.1% 31.4%
8 2009 192 51.0% 39.6% 9.4% 49.0% 193 63.2% 31.1% 5.7% 36.8%2010 213 56.3% 27.7% 16.0% 43.7% 214 67.3% 28.0% 4.7% 32.7%
Total 2009 578 50.2% 37.7% 12.1% 49.8% 581 52.7% 38.9% 8.4% 47.3%2010 598 57.7% 29.1% 13.2% 42.3% 600 65.7% 29.3% 5.0% 34.3%
Angel Oak Elem 3 2009 71 46.5% 26.8% 26.8% 53.5% 71 46.5% 35.2% 18.3% 53.5%2010 69 34.8% 40.6% 24.6% 65.2% 69 52.2% 34.8% 13.0% 47.8%
4 2009 65 29.2% 40.0% 30.8% 70.8% 65 15.4% 64.6% 20.0% 84.6%2010 61 27.9% 41.0% 31.1% 72.1% 61 26.2% 52.5% 21.3% 73.8%
5 2009 49 20.4% 46.9% 32.7% 79.6% 49 30.6% 57.1% 12.2% 69.4%2010 72 13.9% 48.6% 37.5% 86.1% 72 23.6% 44.4% 31.9% 76.4%
Total 2009 185 33.5% 36.8% 29.7% 66.5% 185 31.4% 51.4% 17.3% 68.6%2010 202 25.2% 43.6% 31.2% 74.8% 202 34.2% 43.6% 22.3% 65.8%
Ashley River 3 2009 87 6.9% 35.6% 57.5% 93.1% 87 13.8% 52.9% 33.3% 86.2%Creative Arts 2010 87 4.6% 16.1% 79.3% 95.4% 87 13.8% 36.8% 49.4% 86.2%
4 2009 89 7.9% 36.0% 56.2% 92.1% 89 9.0% 44.9% 46.1% 91.0%2010 94 7.4% 42.6% 50.0% 92.6% 94 5.3% 45.7% 48.9% 94.7%
5 2009 90 3.3% 40.0% 56.7% 96.7% 90 13.3% 36.7% 50.0% 86.7%2010 93 8.6% 35.5% 55.9% 91.4% 93 8.6% 41.9% 49.5% 91.4%
Total 2009 266 6.0% 37.2% 56.8% 94.0% 266 12.0% 44.7% 43.2% 88.0%2010 274 6.9% 31.8% 61.3% 93.1% 274 9.1% 41.6% 49.3% 90.9%
Baptist Hill High 7 2010 68 48.5% 41.2% 10.3% 51.5% 68 36.8% 52.9% 10.3% 63.2%8 2010 55 45.5% 41.8% 12.7% 54.5% 55 41.8% 47.3% 10.9% 58.2%
Total 2010 123 47.2% 41.5% 11.4% 52.8% 123 39.0% 50.4% 10.6% 61.0%
APPENDIX BPALMETTO ASSESSMENT OF STATE STANDARDS (PASS)RESULTS FOR ALL PERFORMANCE LEVELS, BY SCHOOL
ENGLISH/LANGUAGE ARTS AND MATHEMATICSSpring 2009 and Spring 2010
English/Language Arts MathematicsPerformance Levels
Met/ Exemplary
Performance Levels
64

School Gr. YearNo.
Tested Not Met Met ExemplaryNo.
Tested Not Met Met ExemplaryMet/
Exemplary
English/Language Arts MathematicsPerformance Levels
Met/ Exemplary
Performance Levels
Belle Hall Elem 3 2009 119 11.8% 15.1% 73.1% 88.2% 119 20.2% 31.1% 48.7% 79.8%2010 108 10.2% 13.9% 75.9% 89.8% 108 18.5% 25.0% 56.5% 81.5%
4 2009 114 7.9% 25.4% 66.7% 92.1% 115 8.7% 28.7% 62.6% 91.3%2010 118 8.5% 30.5% 61.0% 91.5% 118 9.3% 30.5% 60.2% 90.7%
5 2009 95 4.2% 27.4% 68.4% 95.8% 95 5.3% 30.5% 64.2% 94.7%2010 113 5.3% 25.7% 69.0% 94.7% 113 3.5% 19.5% 77.0% 96.5%
Total 2009 328 8.2% 22.3% 69.5% 91.8% 329 11.9% 30.1% 58.1% 88.1%2010 339 8.0% 23.6% 68.4% 92.0% 339 10.3% 25.1% 64.6% 89.7%
Blaney Elem 3 2009 20 30.0% 35.0% 35.0% 70.0% 20 45.0% 35.0% 20.0% 55.0%2010 28 14.3% 46.4% 39.3% 85.7% 28 28.6% 39.3% 32.1% 71.4%
4 2009 29 37.9% 37.9% 24.1% 62.1% 29 27.6% 58.6% 13.8% 72.4%2010 18 22.2% 55.6% 22.2% 77.8% 18 33.3% 50.0% 16.7% 66.7%
5 2009 28 21.4% 53.6% 25.0% 78.6% 28 21.4% 64.3% 14.3% 78.6%2010 28 17.9% 50.0% 32.1% 82.1% 28 39.3% 50.0% 10.7% 60.7%
6 2010 19 47.4% 47.4% 5.3% 52.6% 19 52.6% 47.4% 0.0% 47.4%Total 2009 77 29.9% 42.9% 27.3% 70.1% 77 29.9% 54.5% 15.6% 70.1%
2010 93 23.7% 49.5% 26.9% 76.3% 93 37.6% 46.2% 16.1% 62.4%Brentwood Middle 6 2009 115 70.4% 26.1% 3.5% 29.6% 115 70.4% 28.7% 0.9% 29.6%
7 2009 114 62.3% 34.2% 3.5% 37.7% 114 51.8% 44.7% 3.5% 48.2%8 2009 104 75.0% 21.2% 3.8% 25.0% 105 73.3% 23.8% 2.9% 26.7%
Total 2009 333 69.1% 27.3% 3.6% 30.9% 334 65.0% 32.6% 2.4% 35.0%Buist Academy 3 2009 39 0.0% 17.9% 82.1% 100.0% 39 5.1% 28.2% 66.7% 94.9%
2010 40 0.0% 0.0% 100.0% 100.0% 40 0.0% 10.0% 90.0% 100.0%4 2009 51 3.9% 15.7% 80.4% 96.1% 51 3.9% 11.8% 84.3% 96.1%
2010 49 4.1% 20.4% 75.5% 95.9% 49 4.1% 14.3% 81.6% 95.9%5 2009 50 2.0% 16.0% 82.0% 98.0% 50 4.0% 32.0% 64.0% 96.0%
2010 50 2.0% 16.0% 82.0% 98.0% 50 2.0% 38.0% 60.0% 98.0%6 2009 48 0.0% 8.3% 91.7% 100.0% 48 0.0% 25.0% 75.0% 100.0%
2010 46 0.0% 8.7% 91.3% 100.0% 46 0.0% 17.4% 82.6% 100.0%7 2009 49 0.0% 16.3% 83.7% 100.0% 49 0.0% 14.3% 85.7% 100.0%
2010 45 0.0% 6.7% 93.3% 100.0% 45 0.0% 15.6% 84.4% 100.0%8 2009 48 0.0% 18.8% 81.3% 100.0% 48 0.0% 20.8% 79.2% 100.0%
2010 47 0.0% 10.6% 89.4% 100.0% 47 2.1% 19.1% 78.7% 97.9%Total 2009 285 1.1% 15.4% 83.5% 98.9% 285 2.1% 21.8% 76.1% 97.9%
2010 277 1.1% 10.8% 88.1% 98.9% 277 1.4% 19.5% 79.1% 98.6%Burke High 7 2009 75 70.7% 24.0% 5.3% 29.3% 75 72.0% 24.0% 4.0% 28.0%
2010 65 60.0% 27.7% 12.3% 40.0% 65 64.6% 32.3% 3.1% 35.4%8 2009 68 63.2% 27.9% 8.8% 36.8% 68 54.4% 39.7% 5.9% 45.6%
2010 84 71.4% 22.6% 6.0% 28.6% 84 76.2% 20.2% 3.6% 23.8%Total 2009 143 67.1% 25.9% 7.0% 32.9% 143 63.6% 31.5% 4.9% 36.4%
2010 149 66.4% 24.8% 8.7% 33.6% 149 71.1% 25.5% 3.4% 28.9%
65

School Gr. YearNo.
Tested Not Met Met ExemplaryNo.
Tested Not Met Met ExemplaryMet/
Exemplary
English/Language Arts MathematicsPerformance Levels
Met/ Exemplary
Performance Levels
6 2009 228 23.2% 50.0% 26.8% 76.8% 228 28.5% 50.0% 21.5% 71.5%2010 196 17.9% 36.7% 45.4% 82.1% 196 18.9% 37.8% 43.4% 81.1%
7 2009 260 22.7% 48.5% 28.8% 77.3% 260 28.8% 51.5% 19.6% 71.2%2010 232 26.7% 33.6% 39.7% 73.3% 232 31.0% 40.1% 28.9% 69.0%
8 2009 188 16.0% 46.3% 37.8% 84.0% 188 19.7% 58.0% 22.3% 80.3%2010 239 25.9% 42.3% 31.8% 74.1% 239 29.7% 54.0% 16.3% 70.3%
Total 2009 676 21.0% 48.4% 30.6% 79.0% 676 26.2% 52.8% 21.0% 73.8%2010 667 23.8% 37.6% 38.5% 76.2% 667 27.0% 44.4% 28.6% 73.0%
Charles Pinckney Elem 3 2009 305 3.6% 13.1% 83.3% 96.4% 306 7.2% 22.9% 69.9% 92.8%2010 307 4.9% 13.4% 81.8% 95.1% 307 9.8% 26.7% 63.5% 90.2%
4 2009 333 5.7% 22.8% 71.5% 94.3% 334 6.6% 25.1% 68.3% 93.4%2010 340 5.6% 24.7% 69.7% 94.4% 340 4.7% 22.9% 72.4% 95.3%
5 2009 309 5.5% 32.7% 61.8% 94.5% 310 3.9% 36.1% 60.0% 96.1%2010 344 6.1% 24.7% 69.2% 93.9% 344 6.7% 29.4% 64.0% 93.3%
Total 2009 947 5.0% 22.9% 72.1% 95.0% 950 5.9% 28.0% 66.1% 94.1%2010 991 5.5% 21.2% 73.3% 94.5% 991 7.0% 26.3% 66.7% 93.0%
Charleston Progressive 3 2009 27 14.8% 44.4% 40.7% 85.2% 27 29.6% 40.7% 29.6% 70.4%2010 24 16.7% 45.8% 37.5% 83.3% 24 33.3% 45.8% 20.8% 66.7%
4 2009 24 16.7% 45.8% 37.5% 83.3% 24 16.7% 54.2% 29.2% 83.3%2010 32 18.8% 59.4% 21.9% 81.3% 32 18.8% 56.3% 25.0% 81.3%
5 2009 22 18.2% 50.0% 31.8% 81.8% 22 45.5% 36.4% 18.2% 54.5%2010 34 23.5% 41.2% 35.3% 76.5% 34 41.2% 38.2% 20.6% 58.8%
6 2009 24 25.0% 50.0% 25.0% 75.0% 24 41.7% 41.7% 16.7% 58.3%2010 25 28.0% 48.0% 24.0% 72.0% 25 40.0% 52.0% 8.0% 60.0%
7 2009 37 37.8% 43.2% 18.9% 62.2% 37 56.8% 37.8% 5.4% 43.2%8 2009 42 38.1% 52.4% 9.5% 61.9% 42 64.3% 23.8% 11.9% 35.7%
Total 2009 176 27.3% 47.7% 25.0% 72.7% 176 45.5% 37.5% 17.0% 54.5%2010 115 21.7% 48.7% 29.6% 78.3% 115 33.0% 47.8% 19.1% 67.0%
6 2009 155 2.6% 20.6% 76.8% 97.4% 155 4.5% 32.3% 63.2% 95.5%2010 160 1.9% 21.3% 76.9% 98.1% 160 3.1% 25.0% 71.9% 96.9%
7 2009 154 1.3% 29.9% 68.8% 98.7% 154 1.9% 33.1% 64.9% 98.1%2010 162 4.3% 11.7% 84.0% 95.7% 162 5.6% 23.5% 71.0% 94.4%
8 2009 153 1.3% 22.2% 76.5% 98.7% 153 3.9% 44.4% 51.6% 96.1%2010 162 3.1% 14.2% 82.7% 96.9% 162 7.4% 43.8% 48.8% 92.6%
Total 2009 462 1.7% 24.2% 74.0% 98.3% 462 3.5% 36.6% 60.0% 96.5%2010 484 3.1% 15.7% 81.2% 96.9% 484 5.4% 30.8% 63.8% 94.6%
Charlestowne Academy 3 2009 13 23.1% 53.8% 23.1% 76.9% 13 46.2% 38.5% 15.4% 53.8%4 2009 20 55.0% 30.0% 15.0% 45.0% 20 45.0% 40.0% 15.0% 55.0%5 2009 20 50.0% 45.0% 5.0% 50.0% 20 70.0% 30.0% 0.0% 30.0%6 2009 45 33.3% 46.7% 20.0% 66.7% 45 40.0% 48.9% 11.1% 60.0%7 2009 43 27.9% 51.2% 20.9% 72.1% 43 37.2% 51.2% 11.6% 62.8%8 2009 40 25.0% 40.0% 35.0% 75.0% 40 35.0% 57.5% 7.5% 65.0%
Total 2009 181 33.7% 44.8% 21.5% 66.3% 181 42.5% 47.5% 9.9% 57.5%
C E Williams Middle
Charleston School Of The Arts
66

School Gr. YearNo.
Tested Not Met Met ExemplaryNo.
Tested Not Met Met ExemplaryMet/
Exemplary
English/Language Arts MathematicsPerformance Levels
Met/ Exemplary
Performance Levels
Chicora Elem 3 2009 46 41.3% 52.2% 6.5% 58.7% 46 65.2% 32.6% 2.2% 34.8%2010 65 44.6% 33.8% 21.5% 55.4% 65 47.7% 35.4% 16.9% 52.3%
4 2009 44 56.8% 34.1% 9.1% 43.2% 44 38.6% 50.0% 11.4% 61.4%2010 59 44.1% 40.7% 15.3% 55.9% 59 32.2% 66.1% 1.7% 67.8%
5 2009 38 31.6% 52.6% 15.8% 68.4% 38 18.4% 71.1% 10.5% 81.6%2010 44 56.8% 31.8% 11.4% 43.2% 44 54.5% 38.6% 6.8% 45.5%
Total 2009 128 43.8% 46.1% 10.2% 56.3% 128 42.2% 50.0% 7.8% 57.8%2010 168 47.6% 35.7% 16.7% 52.4% 168 44.0% 47.0% 8.9% 56.0%
Daniel Jenkins Academy 6 2009 39 74.4% 23.1% 2.6% 25.6% 39 76.9% 20.5% 2.6% 23.1%2010 52 73.1% 21.2% 5.8% 26.9% 52 80.8% 19.2% 0.0% 19.2%
7 2009 51 74.5% 25.5% 0.0% 25.5% 51 70.6% 29.4% 0.0% 29.4%2010 63 79.4% 17.5% 3.2% 20.6% 62 90.3% 9.7% 0.0% 9.7%
8 2009 56 69.6% 23.2% 7.1% 30.4% 55 80.0% 18.2% 1.8% 20.0%2010 48 93.8% 6.3% 0.0% 6.3% 48 93.8% 6.3% 0.0% 6.3%
Total 2009 146 72.6% 24.0% 3.4% 27.4% 145 75.9% 22.8% 1.4% 24.1%2010 163 81.6% 15.3% 3.1% 18.4% 162 88.3% 11.7% 0.0% 11.7%
Drayton Hall Elem 3 2009 138 10.1% 34.1% 55.8% 89.9% 138 17.4% 35.5% 47.1% 82.6%2010 121 14.9% 24.8% 60.3% 85.1% 122 15.6% 24.6% 59.8% 84.4%
4 2009 110 20.0% 39.1% 40.9% 80.0% 110 10.0% 47.3% 42.7% 90.0%2010 133 15.0% 39.1% 45.9% 85.0% 133 13.5% 33.1% 53.4% 86.5%
5 2009 88 12.5% 52.3% 35.2% 87.5% 88 17.0% 51.1% 31.8% 83.0%2010 108 16.7% 37.0% 46.3% 83.3% 108 15.7% 50.9% 33.3% 84.3%
Total 2009 336 14.0% 40.5% 45.5% 86.0% 336 14.9% 43.5% 41.7% 85.1%2010 362 15.5% 33.7% 50.8% 84.5% 363 14.9% 35.5% 49.6% 85.1%
Edith L Frierson Elem 3 2009 20 25.0% 25.0% 50.0% 75.0% 20 25.0% 55.0% 20.0% 75.0%2010 13 15.4% 23.1% 61.5% 84.6% 13 30.8% 15.4% 53.8% 69.2%
4 2009 10 20.0% 30.0% 50.0% 80.0% 10 20.0% 50.0% 30.0% 80.0%2010 15 6.7% 46.7% 46.7% 93.3% 15 6.7% 53.3% 40.0% 93.3%
5 2009 12 25.0% 41.7% 33.3% 75.0% 12 16.7% 50.0% 33.3% 83.3%2010 12 41.7% 33.3% 25.0% 58.3% 12 41.7% 41.7% 16.7% 58.3%
6 2009 10 40.0% 30.0% 30.0% 60.0% 10 10.0% 70.0% 20.0% 90.0%2010 11 0.0% 54.5% 45.5% 100.0% 11 9.1% 45.5% 45.5% 90.9%
Total 2009 52 26.9% 30.8% 42.3% 73.1% 52 19.2% 55.8% 25.0% 80.8%2010 51 15.7% 39.2% 45.1% 84.3% 51 21.6% 39.2% 39.2% 78.4%
Edmund A Burns Elem 3 2009 56 48.2% 44.6% 7.1% 51.8% 56 76.8% 19.6% 3.6% 23.2%2010 48 54.2% 31.3% 14.6% 45.8% 48 60.4% 35.4% 4.2% 39.6%
4 2009 67 52.2% 40.3% 7.5% 47.8% 67 55.2% 31.3% 13.4% 44.8%2010 54 57.4% 35.2% 7.4% 42.6% 54 59.3% 38.9% 1.9% 40.7%
5 2009 72 51.4% 44.4% 4.2% 48.6% 72 72.2% 26.4% 1.4% 27.8%2010 62 46.8% 38.7% 14.5% 53.2% 62 54.8% 35.5% 9.7% 45.2%
Total 2009 195 50.8% 43.1% 6.2% 49.2% 195 67.7% 26.2% 6.2% 32.3%2010 164 52.4% 35.4% 12.2% 47.6% 164 57.9% 36.6% 5.5% 42.1%
67

School Gr. YearNo.
Tested Not Met Met ExemplaryNo.
Tested Not Met Met ExemplaryMet/
Exemplary
English/Language Arts MathematicsPerformance Levels
Met/ Exemplary
Performance Levels
Ellington Elem 3 2009 26 15.4% 50.0% 34.6% 84.6% 26 50.0% 38.5% 11.5% 50.0%2010 36 22.2% 33.3% 44.4% 77.8% 36 50.0% 44.4% 5.6% 50.0%
4 2009 28 32.1% 53.6% 14.3% 67.9% 28 28.6% 60.7% 10.7% 71.4%2010 27 29.6% 48.1% 22.2% 70.4% 27 29.6% 55.6% 14.8% 70.4%
5 2009 42 26.2% 57.1% 16.7% 73.8% 42 38.1% 47.6% 14.3% 61.9%2010 24 29.2% 50.0% 20.8% 70.8% 24 29.2% 50.0% 20.8% 70.8%
6 2010 30 30.0% 50.0% 20.0% 70.0% 30 40.0% 46.7% 13.3% 60.0%Total 2009 96 25.0% 54.2% 20.8% 75.0% 96 38.5% 49.0% 12.5% 61.5%
2010 117 27.4% 44.4% 28.2% 72.6% 117 38.5% 48.7% 12.8% 61.5%Fort Johnson Middle 6 2009 178 14.0% 36.0% 50.0% 86.0% 177 14.7% 36.7% 48.6% 85.3%
2010 184 20.7% 37.5% 41.8% 79.3% 184 19.6% 33.7% 46.7% 80.4%7 2009 179 19.6% 41.9% 38.5% 80.4% 179 15.1% 34.1% 50.8% 84.9%
2010 180 13.9% 28.3% 57.8% 86.1% 180 16.7% 35.6% 47.8% 83.3%8 2009 155 11.6% 41.9% 46.5% 88.4% 155 11.6% 41.3% 47.1% 88.4%
2010 178 20.8% 29.2% 50.0% 79.2% 178 15.7% 37.1% 47.2% 84.3%Total 2009 512 15.2% 39.8% 44.9% 84.8% 511 13.9% 37.2% 48.9% 86.1%
2010 542 18.5% 31.7% 49.8% 81.5% 542 17.3% 35.4% 47.2% 82.7%Fraser Elem 3 2009 23 30.4% 43.5% 26.1% 69.6% 23 47.8% 34.8% 17.4% 52.2%
4 2009 36 61.1% 33.3% 5.6% 38.9% 36 66.7% 27.8% 5.6% 33.3%5 2009 19 52.6% 42.1% 5.3% 47.4% 19 73.7% 26.3% 0.0% 26.3%6 2009 18 72.2% 22.2% 5.6% 27.8% 18 72.2% 27.8% 0.0% 27.8%
Total 2009 96 54.2% 35.4% 10.4% 45.8% 96 64.6% 29.2% 6.3% 35.4%Harbor View Elem 3 2009 88 8.0% 27.3% 64.8% 92.0% 88 12.5% 34.1% 53.4% 87.5%
2010 99 3.0% 17.2% 79.8% 97.0% 100 12.0% 24.0% 64.0% 88.0%4 2009 91 8.8% 26.4% 64.8% 91.2% 91 2.2% 34.1% 63.7% 97.8%
2010 93 9.7% 37.6% 52.7% 90.3% 93 8.6% 34.4% 57.0% 91.4%5 2009 78 9.0% 32.1% 59.0% 91.0% 78 11.5% 41.0% 47.4% 88.5%
2010 82 9.8% 32.9% 57.3% 90.2% 83 7.2% 34.9% 57.8% 92.8%Total 2009 257 8.6% 28.4% 63.0% 91.4% 257 8.6% 36.2% 55.3% 91.4%
2010 274 7.3% 28.8% 63.9% 92.7% 276 9.4% 30.8% 59.8% 90.6%Haut Gap Middle 6 2009 71 35.2% 49.3% 15.5% 64.8% 71 40.8% 49.3% 9.9% 59.2%
2010 104 29.8% 34.6% 35.6% 70.2% 104 37.5% 41.3% 21.2% 62.5%7 2009 63 49.2% 39.7% 11.1% 50.8% 63 46.0% 50.8% 3.2% 54.0%
2010 79 32.9% 46.8% 20.3% 67.1% 79 54.4% 41.8% 3.8% 45.6%8 2009 73 45.2% 39.7% 15.1% 54.8% 73 57.5% 37.0% 5.5% 42.5%
2010 60 55.0% 35.0% 10.0% 45.0% 60 56.7% 40.0% 3.3% 43.3%Total 2009 207 43.0% 43.0% 14.0% 57.0% 207 48.3% 45.4% 6.3% 51.7%
2010 243 37.0% 38.7% 24.3% 63.0% 243 47.7% 41.2% 11.1% 52.3%
68

School Gr. YearNo.
Tested Not Met Met ExemplaryNo.
Tested Not Met Met ExemplaryMet/
Exemplary
English/Language Arts MathematicsPerformance Levels
Met/ Exemplary
Performance Levels
Hunley Park Elem 3 2009 69 23.2% 37.7% 39.1% 76.8% 69 36.2% 43.5% 20.3% 63.8%2010 70 18.6% 38.6% 42.9% 81.4% 70 37.1% 37.1% 25.7% 62.9%
4 2009 75 41.3% 37.3% 21.3% 58.7% 75 37.3% 48.0% 14.7% 62.7%2010 65 33.8% 47.7% 18.5% 66.2% 65 32.3% 49.2% 18.5% 67.7%
5 2009 47 14.9% 48.9% 36.2% 85.1% 47 36.2% 46.8% 17.0% 63.8%2010 60 16.7% 58.3% 25.0% 83.3% 60 31.7% 45.0% 23.3% 68.3%
Total 2009 191 28.3% 40.3% 31.4% 71.7% 191 36.6% 46.1% 17.3% 63.4%2010 195 23.1% 47.7% 29.2% 76.9% 195 33.8% 43.6% 22.6% 66.2%
James B Edwards Elem 3 2009 105 18.1% 20.0% 61.9% 81.9% 105 22.9% 24.8% 52.4% 77.1%2010 85 10.6% 16.5% 72.9% 89.4% 85 12.9% 32.9% 54.1% 87.1%
4 2009 104 11.5% 25.0% 63.5% 88.5% 105 10.5% 40.0% 49.5% 89.5%2010 99 9.1% 32.3% 58.6% 90.9% 99 9.1% 32.3% 58.6% 90.9%
5 2009 119 6.7% 33.6% 59.7% 93.3% 120 12.5% 42.5% 45.0% 87.5%2010 112 9.8% 28.6% 61.6% 90.2% 113 14.2% 40.7% 45.1% 85.8%
Total 2009 328 11.9% 26.5% 61.6% 88.1% 330 15.2% 36.1% 48.8% 84.8%2010 296 9.8% 26.4% 63.9% 90.2% 297 12.1% 35.7% 52.2% 87.9%
James Island Elem 3 2009 80 8.8% 25.0% 66.3% 91.3% 80 11.3% 38.8% 50.0% 88.8%2010 82 15.9% 22.0% 62.2% 84.1% 82 24.4% 42.7% 32.9% 75.6%
4 2009 77 26.0% 41.6% 32.5% 74.0% 77 31.2% 53.2% 15.6% 68.8%2010 78 16.7% 34.6% 48.7% 83.3% 78 14.1% 43.6% 42.3% 85.9%
5 2009 84 17.9% 52.4% 29.8% 82.1% 83 33.7% 42.2% 24.1% 66.3%2010 75 25.3% 54.7% 20.0% 74.7% 75 40.0% 32.0% 28.0% 60.0%
Total 2009 241 17.4% 39.8% 42.7% 82.6% 240 25.4% 44.6% 30.0% 74.6%2010 235 19.1% 36.6% 44.3% 80.9% 235 26.0% 39.6% 34.5% 74.0%
James Island Middle 6 2009 140 35.7% 37.1% 27.1% 64.3% 140 32.9% 37.9% 29.3% 67.1%2010 106 12.3% 44.3% 43.4% 87.7% 106 17.0% 36.8% 46.2% 83.0%
7 2009 146 26.0% 41.1% 32.9% 74.0% 146 33.6% 43.8% 22.6% 66.4%2010 138 31.2% 28.3% 40.6% 68.8% 138 41.3% 39.1% 19.6% 58.7%
8 2009 150 34.0% 34.7% 31.3% 66.0% 150 47.3% 36.7% 16.0% 52.7%2010 136 38.2% 25.7% 36.0% 61.8% 136 44.1% 44.1% 11.8% 55.9%
Total 2009 436 31.9% 37.6% 30.5% 68.1% 436 38.1% 39.4% 22.5% 61.9%2010 380 28.4% 31.8% 39.7% 71.6% 380 35.5% 40.3% 24.2% 64.5%
James Simons Elem 3 2009 42 31.0% 47.6% 21.4% 69.0% 42 69.0% 19.0% 11.9% 31.0%2010 29 24.1% 37.9% 37.9% 75.9% 29 41.4% 48.3% 10.3% 58.6%
4 2009 40 40.0% 55.0% 5.0% 60.0% 40 50.0% 45.0% 5.0% 50.0%2010 27 37.0% 51.9% 11.1% 63.0% 27 55.6% 40.7% 3.7% 44.4%
5 2009 40 60.0% 35.0% 5.0% 40.0% 40 72.5% 27.5% 0.0% 27.5%2010 33 42.4% 54.5% 3.0% 57.6% 33 72.7% 24.2% 3.0% 27.3%
6 2009 30 30.0% 56.7% 13.3% 70.0% 30 30.0% 63.3% 6.7% 70.0%2010 22 59.1% 40.9% 0.0% 40.9% 22 68.2% 22.7% 9.1% 31.8%
Total 2009 152 40.8% 48.0% 11.2% 59.2% 152 57.2% 36.8% 5.9% 42.8%2010 111 39.6% 46.8% 13.5% 60.4% 111 59.5% 34.2% 6.3% 40.5%
69

School Gr. YearNo.
Tested Not Met Met ExemplaryNo.
Tested Not Met Met ExemplaryMet/
Exemplary
English/Language Arts MathematicsPerformance Levels
Met/ Exemplary
Performance Levels
Jane Edwards Elem 3 2009 13 46.2% 30.8% 23.1% 53.8% 13 38.5% 30.8% 30.8% 61.5%2010 14 35.7% 57.1% 7.1% 64.3% 14 64.3% 21.4% 14.3% 35.7%
4 2009 11 36.4% 45.5% 18.2% 63.6% 11 45.5% 45.5% 9.1% 54.5%2010 16 18.8% 56.3% 25.0% 81.3% 16 31.3% 62.5% 6.3% 68.8%
5 2009 13 38.5% 53.8% 7.7% 61.5% 13 23.1% 76.9% 0.0% 76.9%2010 11 36.4% 27.3% 36.4% 63.6% 11 45.5% 45.5% 9.1% 54.5%
6 2009 13 30.8% 53.8% 15.4% 69.2% 13 15.4% 61.5% 23.1% 84.6%2010 14 28.6% 57.1% 14.3% 71.4% 14 28.6% 42.9% 28.6% 71.4%
7 2009 11 45.5% 54.5% 0.0% 54.5% 11 27.3% 72.7% 0.0% 72.7%8 2009 10 30.0% 40.0% 30.0% 70.0% 10 20.0% 60.0% 20.0% 80.0%
Total 2009 71 38.0% 46.5% 15.5% 62.0% 71 28.2% 57.7% 14.1% 71.8%2010 55 29.1% 50.9% 20.0% 70.9% 55 41.8% 43.6% 14.5% 58.2%
Jennie Moore Elem 3 2009 116 12.1% 17.2% 70.7% 87.9% 116 17.2% 24.1% 58.6% 82.8%2010 119 11.8% 19.3% 68.9% 88.2% 118 16.1% 29.7% 54.2% 83.9%
4 2009 107 9.3% 34.6% 56.1% 90.7% 107 8.4% 32.7% 58.9% 91.6%2010 103 7.8% 28.2% 64.1% 92.2% 103 4.9% 27.2% 68.0% 95.1%
5 2009 104 4.8% 32.7% 62.5% 95.2% 104 4.8% 42.3% 52.9% 95.2%2010 114 9.6% 35.1% 55.3% 90.4% 114 12.3% 36.8% 50.9% 87.7%
Total 2009 327 8.9% 27.8% 63.3% 91.1% 327 10.4% 32.7% 56.9% 89.6%2010 336 9.8% 27.4% 62.8% 90.2% 335 11.3% 31.3% 57.3% 88.7%
Jerry Zucker Middle 6 2010 126 31.0% 35.7% 33.3% 69.0% 126 38.9% 41.3% 19.8% 61.1%7 2010 148 41.2% 45.3% 13.5% 58.8% 149 46.3% 47.0% 6.7% 53.7%8 2010 118 54.2% 31.4% 14.4% 45.8% 119 54.6% 36.1% 9.2% 45.4%
Total 2010 392 41.8% 38.0% 20.2% 58.2% 394 46.4% 41.9% 11.7% 53.6%Ladson Elem 3 2009 95 38.9% 38.9% 22.1% 61.1% 95 48.4% 31.6% 20.0% 51.6%
2010 84 34.5% 25.0% 40.5% 65.5% 84 51.2% 28.6% 20.2% 48.8%4 2009 85 30.6% 48.2% 21.2% 69.4% 86 20.9% 46.5% 32.6% 79.1%
2010 85 20.0% 43.5% 36.5% 80.0% 85 11.8% 52.9% 35.3% 88.2%5 2009 86 30.2% 45.3% 24.4% 69.8% 86 36.0% 50.0% 14.0% 64.0%
2010 76 31.6% 44.7% 23.7% 68.4% 76 27.6% 43.4% 28.9% 72.4%Total 2009 266 33.5% 44.0% 22.6% 66.5% 267 35.6% 42.3% 22.1% 64.4%
2010 245 28.6% 37.6% 33.9% 71.4% 245 30.2% 41.6% 28.2% 69.8%Laing Middle 6 2009 121 16.5% 39.7% 43.8% 83.5% 121 13.2% 43.0% 43.8% 86.8%
2010 168 20.2% 31.5% 48.2% 79.8% 168 17.9% 35.1% 47.0% 82.1%7 2009 130 16.9% 33.8% 49.2% 83.1% 130 16.9% 35.4% 47.7% 83.1%
2010 126 11.9% 34.9% 53.2% 88.1% 126 24.6% 39.7% 35.7% 75.4%8 2009 160 23.8% 32.5% 43.8% 76.3% 160 24.4% 36.3% 39.4% 75.6%
2010 138 19.6% 25.4% 55.1% 80.4% 138 18.8% 35.5% 45.7% 81.2%Total 2009 411 19.5% 35.0% 45.5% 80.5% 411 18.7% 38.0% 43.3% 81.3%
2010 432 17.6% 30.6% 51.9% 82.4% 432 20.1% 36.6% 43.3% 79.9%
70

School Gr. YearNo.
Tested Not Met Met ExemplaryNo.
Tested Not Met Met ExemplaryMet/
Exemplary
English/Language Arts MathematicsPerformance Levels
Met/ Exemplary
Performance Levels
Lambs Elem 3 2009 60 46.7% 33.3% 20.0% 53.3% 60 46.7% 31.7% 21.7% 53.3%2010 57 19.3% 35.1% 45.6% 80.7% 57 38.6% 33.3% 28.1% 61.4%
4 2009 59 27.1% 40.7% 32.2% 72.9% 59 23.7% 49.2% 27.1% 76.3%2010 60 38.3% 38.3% 23.3% 61.7% 60 35.0% 31.7% 33.3% 65.0%
5 2009 38 21.1% 42.1% 36.8% 78.9% 38 26.3% 42.1% 31.6% 73.7%2010 55 21.8% 47.3% 30.9% 78.2% 55 32.7% 27.3% 40.0% 67.3%
Total 2009 157 33.1% 38.2% 28.7% 66.9% 157 33.1% 40.8% 26.1% 66.9%2010 172 26.7% 40.1% 33.1% 73.3% 172 35.5% 30.8% 33.7% 64.5%
Liberty Hill Academy 3 2009 3 * * * * 3 * * * *2010 3 * * * * 4 * * * *
4 2009 4 * * * * 4 * * * *2010 8 50.0% 37.5% 12.5% 50.0% 8 62.5% 37.5% 0.0% 37.5%
5 2009 4 * * * * 4 * * * *2010 5 * * * * 5 * * * *
6 2009 10 70.0% 20.0% 10.0% 30.0% 10 100.0% 0.0% 0.0% 0.0%2010 9 100.0% 0.0% 0.0% 0.0% 9 100.0% 0.0% 0.0% 0.0%
7 2009 9 88.9% 11.1% 0.0% 11.1% 12 100.0% 0.0% 0.0% 0.0%2010 12 91.7% 8.3% 0.0% 8.3% 8 100.0% 0.0% 0.0% 0.0%
8 2009 6 100.0% 0.0% 0.0% 0.0% 6 100.0% 0.0% 0.0% 0.0%2010 27 100.0% 0.0% 0.0% 0.0% 27 88.9% 11.1% 0.0% 11.1%
Total 2009 36 83.3% 13.9% 2.8% 16.7% 39 97.4% 2.6% 0.0% 2.6%2010 64 87.5% 9.4% 3.1% 12.5% 61 88.5% 11.5% 0.0% 11.5%
Lincoln High 7 2010 23 34.8% 34.8% 30.4% 65.2% 23 34.8% 52.2% 13.0% 65.2%8 2010 20 45.0% 50.0% 5.0% 55.0% 20 50.0% 40.0% 10.0% 50.0%
Total 2010 43 39.5% 41.9% 18.6% 60.5% 43 41.9% 46.5% 11.6% 58.1%Malcolm C Hursey Elem 3 2009 41 51.2% 26.8% 22.0% 48.8% 41 73.2% 22.0% 4.9% 26.8%
2010 49 59.2% 28.6% 12.2% 40.8% 49 81.6% 14.3% 4.1% 18.4%4 2009 31 51.6% 38.7% 9.7% 48.4% 31 48.4% 45.2% 6.5% 51.6%
2010 45 46.7% 46.7% 6.7% 53.3% 45 62.2% 28.9% 8.9% 37.8%5 2009 31 38.7% 45.2% 16.1% 61.3% 30 40.0% 56.7% 3.3% 60.0%
2010 34 50.0% 44.1% 5.9% 50.0% 34 50.0% 38.2% 11.8% 50.0%Total 2009 103 47.6% 35.9% 16.5% 52.4% 102 55.9% 39.2% 4.9% 44.1%
2010 128 52.3% 39.1% 8.6% 47.7% 128 66.4% 25.8% 7.8% 33.6%Mamie Whitesides Elem 3 2009 111 8.1% 24.3% 67.6% 91.9% 111 14.4% 30.6% 55.0% 85.6%
2010 90 10.0% 11.1% 78.9% 90.0% 91 13.2% 27.5% 59.3% 86.8%4 2009 91 7.7% 25.3% 67.0% 92.3% 91 9.9% 40.7% 49.5% 90.1%
2010 117 11.1% 26.5% 62.4% 88.9% 117 14.5% 35.9% 49.6% 85.5%5 2009 96 6.3% 39.6% 54.2% 93.8% 97 8.2% 49.5% 42.3% 91.8%
2010 98 12.2% 21.4% 66.3% 87.8% 98 13.3% 36.7% 50.0% 86.7%Total 2009 298 7.4% 29.5% 63.1% 92.6% 299 11.0% 39.8% 49.2% 89.0%
2010 305 11.1% 20.3% 68.5% 88.9% 306 13.7% 33.7% 52.6% 86.3%*Scores not reported for any category in which there are fewer than six students.
71

School Gr. YearNo.
Tested Not Met Met ExemplaryNo.
Tested Not Met Met ExemplaryMet/
Exemplary
English/Language Arts MathematicsPerformance Levels
Met/ Exemplary
Performance Levels
Mary Ford Elem 3 2009 50 36.0% 40.0% 24.0% 64.0% 50 56.0% 38.0% 6.0% 44.0%2010 72 38.9% 43.1% 18.1% 61.1% 72 62.5% 27.8% 9.7% 37.5%
4 2009 49 65.3% 26.5% 8.2% 34.7% 49 59.2% 38.8% 2.0% 40.8%2010 43 48.8% 41.9% 9.3% 51.2% 43 39.5% 53.5% 7.0% 60.5%
5 2009 42 47.6% 33.3% 19.0% 52.4% 42 57.1% 40.5% 2.4% 42.9%2010 41 43.9% 36.6% 19.5% 56.1% 41 58.5% 29.3% 12.2% 41.5%
Total 2009 141 49.6% 33.3% 17.0% 50.4% 141 57.4% 39.0% 3.5% 42.6%2010 156 42.9% 41.0% 16.0% 57.1% 156 55.1% 35.3% 9.6% 44.9%
Matilda Dunston Elem 3 2009 41 29.3% 43.9% 26.8% 70.7% 41 29.3% 43.9% 26.8% 70.7%2010 49 28.6% 38.8% 32.7% 71.4% 49 28.6% 36.7% 34.7% 71.4%
Total 2009 41 29.3% 43.9% 26.8% 70.7% 41 29.3% 43.9% 26.8% 70.7%2010 49 28.6% 38.8% 32.7% 71.4% 49 28.6% 36.7% 34.7% 71.4%
McClellanville Middle 6 2009 24 29.2% 45.8% 25.0% 70.8% 24 16.7% 45.8% 37.5% 83.3%7 2009 28 46.4% 35.7% 17.9% 53.6% 28 46.4% 46.4% 7.1% 53.6%8 2009 28 53.6% 32.1% 14.3% 46.4% 28 64.3% 25.0% 10.7% 35.7%
Total 2009 80 43.8% 37.5% 18.8% 56.3% 80 43.8% 38.8% 17.5% 56.3%Memminger Elem 3 2009 38 31.6% 28.9% 39.5% 68.4% 38 39.5% 31.6% 28.9% 60.5%
2010 53 41.5% 39.6% 18.9% 58.5% 53 50.9% 35.8% 13.2% 49.1%4 2009 31 35.5% 64.5% 0.0% 64.5% 31 58.1% 38.7% 3.2% 41.9%
2010 40 50.0% 35.0% 15.0% 50.0% 41 41.5% 43.9% 14.6% 58.5%5 2009 30 36.7% 53.3% 10.0% 63.3% 30 46.7% 53.3% 0.0% 53.3%
2010 34 50.0% 44.1% 5.9% 50.0% 34 64.7% 32.4% 2.9% 35.3%6 2009 25 68.0% 28.0% 4.0% 32.0% 25 56.0% 44.0% 0.0% 44.0%
2010 33 45.5% 42.4% 12.1% 54.5% 33 51.5% 36.4% 12.1% 48.5%Total 2009 124 41.1% 43.5% 15.3% 58.9% 124 49.2% 41.1% 9.7% 50.8%
2010 160 46.3% 40.0% 13.8% 53.8% 161 51.6% 37.3% 11.2% 48.4%Midland Park Elem 3 2009 99 36.4% 40.4% 23.2% 63.6% 100 48.0% 28.0% 24.0% 52.0%
2010 108 25.9% 38.0% 36.1% 74.1% 111 35.1% 34.2% 30.6% 64.9%4 2009 93 62.4% 26.9% 10.8% 37.6% 94 38.3% 43.6% 18.1% 61.7%
2010 95 35.8% 54.7% 9.5% 64.2% 95 30.5% 41.1% 28.4% 69.5%5 2009 99 45.5% 40.4% 14.1% 54.5% 101 39.6% 41.6% 18.8% 60.4%
2010 95 48.4% 41.1% 10.5% 51.6% 96 63.5% 29.2% 7.3% 36.5%Total 2009 291 47.8% 36.1% 16.2% 52.2% 295 42.0% 37.6% 20.3% 58.0%
2010 298 36.2% 44.3% 19.5% 63.8% 302 42.7% 34.8% 22.5% 57.3%6 2009 99 44.4% 41.4% 14.1% 55.6% 99 44.4% 49.5% 6.1% 55.6%
2010 80 33.8% 46.3% 20.0% 66.3% 80 46.3% 43.8% 10.0% 53.8%7 2009 63 39.7% 49.2% 11.1% 60.3% 64 40.6% 51.6% 7.8% 59.4%
2010 100 38.0% 45.0% 17.0% 62.0% 100 46.0% 48.0% 6.0% 54.0%8 2009 83 36.1% 56.6% 7.2% 63.9% 83 50.6% 41.0% 8.4% 49.4%
2010 61 41.0% 41.0% 18.0% 59.0% 61 42.6% 49.2% 8.2% 57.4%Total 2009 245 40.4% 48.6% 11.0% 59.6% 246 45.5% 47.2% 7.3% 54.5%
2010 241 37.3% 44.4% 18.3% 62.7% 241 45.2% 46.9% 7.9% 54.8%
Military Magnet Academy
72

School Gr. YearNo.
Tested Not Met Met ExemplaryNo.
Tested Not Met Met ExemplaryMet/
Exemplary
English/Language Arts MathematicsPerformance Levels
Met/ Exemplary
Performance Levels
Minnie Hughes Elem 3 2009 28 7.1% 35.7% 57.1% 92.9% 28 14.3% 21.4% 64.3% 85.7%2010 25 12.0% 24.0% 64.0% 88.0% 25 12.0% 20.0% 68.0% 88.0%
4 2009 20 25.0% 45.0% 30.0% 75.0% 20 10.0% 50.0% 40.0% 90.0%2010 28 28.6% 42.9% 28.6% 71.4% 28 17.9% 42.9% 39.3% 82.1%
5 2009 27 11.1% 59.3% 29.6% 88.9% 27 37.0% 48.1% 14.8% 63.0%2010 19 26.3% 68.4% 5.3% 73.7% 19 15.8% 57.9% 26.3% 84.2%
6 2010 23 34.8% 47.8% 17.4% 65.2% 23 39.1% 39.1% 21.7% 60.9%Total 2009 75 13.3% 46.7% 40.0% 86.7% 75 21.3% 38.7% 40.0% 78.7%
2010 95 25.3% 44.2% 30.5% 74.7% 95 21.1% 38.9% 40.0% 78.9%Mitchell Elem 3 2009 46 47.8% 28.3% 23.9% 52.2% 46 56.5% 26.1% 17.4% 43.5%
2010 49 24.5% 32.7% 42.9% 75.5% 49 32.7% 36.7% 30.6% 67.3%4 2009 37 45.9% 43.2% 10.8% 54.1% 37 40.5% 40.5% 18.9% 59.5%
2010 45 44.4% 35.6% 20.0% 55.6% 45 31.1% 42.2% 26.7% 68.9%5 2009 29 37.9% 55.2% 6.9% 62.1% 29 41.4% 44.8% 13.8% 58.6%
2010 46 43.5% 47.8% 8.7% 56.5% 46 58.7% 28.3% 13.0% 41.3%6 2009 39 64.1% 23.1% 12.8% 35.9% 39 53.8% 41.0% 5.1% 46.2%
2010 39 51.3% 38.5% 10.3% 48.7% 39 46.2% 46.2% 7.7% 53.8%Total 2009 151 49.7% 35.8% 14.6% 50.3% 151 49.0% 37.1% 13.9% 51.0%
2010 179 40.2% 38.5% 21.2% 59.8% 179 41.9% 38.0% 20.1% 58.1%Montessori Community 3 2009 11 0.0% 18.2% 81.8% 100.0% 11 9.1% 36.4% 54.5% 90.9%School 2010 14 0.0% 21.4% 78.6% 100.0% 14 21.4% 21.4% 57.1% 78.6%
4 2009 16 6.3% 18.8% 75.0% 93.8% 16 0.0% 62.5% 37.5% 100.0%2010 16 6.3% 43.8% 50.0% 93.8% 16 6.3% 31.3% 62.5% 93.8%
5 2009 17 0.0% 11.8% 88.2% 100.0% 17 0.0% 41.2% 58.8% 100.0%2010 17 0.0% 17.6% 82.4% 100.0% 17 0.0% 47.1% 52.9% 100.0%
6 2009 7 14.3% 42.9% 42.9% 85.7% 7 14.3% 42.9% 42.9% 85.7%2010 10 10.0% 30.0% 60.0% 90.0% 10 10.0% 30.0% 60.0% 90.0%
Total 2009 51 3.9% 19.6% 76.5% 96.1% 51 3.9% 47.1% 49.0% 96.1%2010 57 3.5% 28.1% 68.4% 96.5% 57 8.8% 33.3% 57.9% 91.2%
6 2010 41 46.3% 36.6% 17.1% 53.7% 42 64.3% 26.2% 9.5% 35.7%7 2010 60 75.0% 16.7% 8.3% 25.0% 60 68.3% 23.3% 8.3% 31.7%8 2010 86 89.5% 7.0% 3.5% 10.5% 86 77.9% 20.9% 1.2% 22.1%
Total 2010 187 75.4% 16.6% 8.0% 24.6% 188 71.8% 22.9% 5.3% 28.2%6 2010 51 49.0% 37.3% 13.7% 51.0% 51 43.1% 49.0% 7.8% 56.9%7 2010 64 57.8% 31.3% 10.9% 42.2% 64 59.4% 37.5% 3.1% 40.6%8 2010 65 50.8% 32.3% 16.9% 49.2% 65 63.1% 29.2% 7.7% 36.9%
Total 2010 180 52.8% 33.3% 13.9% 47.2% 180 56.1% 37.8% 6.1% 43.9%6 2009 120 57.5% 35.8% 6.7% 42.5% 120 55.8% 41.7% 2.5% 44.2%7 2009 130 53.1% 37.7% 9.2% 46.9% 130 58.5% 36.9% 4.6% 41.5%8 2009 124 61.3% 29.8% 8.9% 38.7% 124 79.0% 17.7% 3.2% 21.0%
Total 2009 374 57.2% 34.5% 8.3% 42.8% 374 64.4% 32.1% 3.5% 35.6%
Morningside Middle
Morningside Middle Excel
Morningside Middle ARMS
73

School Gr. YearNo.
Tested Not Met Met ExemplaryNo.
Tested Not Met Met ExemplaryMet/
Exemplary
English/Language Arts MathematicsPerformance Levels
Met/ Exemplary
Performance Levels
Moultrie Middle 6 2009 288 11.5% 31.6% 56.9% 88.5% 289 11.4% 37.0% 51.6% 88.6%2010 288 10.1% 24.0% 66.0% 89.9% 288 11.8% 33.7% 54.5% 88.2%
7 2009 236 10.6% 23.7% 65.7% 89.4% 236 12.3% 33.1% 54.7% 87.7%2010 304 5.9% 22.7% 71.4% 94.1% 305 14.8% 32.8% 52.5% 85.2%
8 2009 258 10.1% 36.8% 53.1% 89.9% 258 16.7% 38.4% 45.0% 83.3%2010 245 15.9% 24.5% 59.6% 84.1% 245 16.3% 35.5% 48.2% 83.7%
Total 2009 782 10.7% 30.9% 58.3% 89.3% 783 13.4% 36.3% 50.3% 86.6%2010 837 10.3% 23.7% 66.1% 89.7% 838 14.2% 33.9% 51.9% 85.8%
Mt Pleasant Academy 3 2009 70 7.1% 12.9% 80.0% 92.9% 70 7.1% 24.3% 68.6% 92.9%2010 77 3.9% 16.9% 79.2% 96.1% 77 15.6% 26.0% 58.4% 84.4%
4 2009 78 1.3% 17.9% 80.8% 98.7% 78 1.3% 21.8% 76.9% 98.7%2010 73 4.1% 16.4% 79.5% 95.9% 73 2.7% 20.5% 76.7% 97.3%
5 2009 61 6.6% 27.9% 65.6% 93.4% 61 8.2% 24.6% 67.2% 91.8%2010 77 5.2% 14.3% 80.5% 94.8% 78 9.0% 34.6% 56.4% 91.0%
Total 2009 209 4.8% 19.1% 76.1% 95.2% 209 5.3% 23.4% 71.3% 94.7%2010 227 4.4% 15.9% 79.7% 95.6% 228 9.2% 27.2% 63.6% 90.8%
Mt Zion Elem 3 2009 34 17.6% 44.1% 38.2% 82.4% 35 42.9% 31.4% 25.7% 57.1%2010 27 22.2% 40.7% 37.0% 77.8% 27 40.7% 44.4% 14.8% 59.3%
4 2009 25 44.0% 48.0% 8.0% 56.0% 25 40.0% 60.0% 0.0% 60.0%2010 37 27.0% 48.6% 24.3% 73.0% 37 16.2% 54.1% 29.7% 83.8%
5 2009 32 12.5% 53.1% 34.4% 87.5% 33 27.3% 51.5% 21.2% 72.7%2010 24 29.2% 62.5% 8.3% 70.8% 24 29.2% 58.3% 12.5% 70.8%
Total 2009 91 23.1% 48.4% 28.6% 76.9% 93 36.6% 46.2% 17.2% 63.4%2010 88 26.1% 50.0% 23.9% 73.9% 88 27.3% 52.3% 20.5% 72.7%
Murray Lasaine Elem 3 2009 32 21.9% 46.9% 31.3% 78.1% 32 43.8% 34.4% 21.9% 56.3%2010 18 16.7% 38.9% 44.4% 83.3% 18 22.2% 33.3% 44.4% 77.8%
4 2009 26 38.5% 46.2% 15.4% 61.5% 26 26.9% 57.7% 15.4% 73.1%2010 31 6.5% 58.1% 35.5% 93.5% 31 9.7% 64.5% 25.8% 90.3%
5 2009 33 21.2% 63.6% 15.2% 78.8% 33 33.3% 39.4% 27.3% 66.7%2010 20 40.0% 35.0% 25.0% 60.0% 20 40.0% 25.0% 35.0% 60.0%
Total 2009 91 26.4% 52.7% 20.9% 73.6% 91 35.2% 42.9% 22.0% 64.8%2010 69 18.8% 46.4% 34.8% 81.2% 69 21.7% 44.9% 33.3% 78.3%
North Charleston Elem 3 2009 47 29.8% 34.0% 36.2% 70.2% 47 40.4% 42.6% 17.0% 59.6%2010 71 52.1% 31.0% 16.9% 47.9% 71 77.5% 21.1% 1.4% 22.5%
4 2009 96 50.0% 39.6% 10.4% 50.0% 96 43.8% 51.0% 5.2% 56.3%2010 89 38.2% 43.8% 18.0% 61.8% 90 32.2% 45.6% 22.2% 67.8%
5 2009 81 42.0% 49.4% 8.6% 58.0% 81 61.7% 35.8% 2.5% 38.3%2010 91 34.1% 50.5% 15.4% 65.9% 91 58.2% 31.9% 9.9% 41.8%
Total 2009 224 42.9% 42.0% 15.2% 57.1% 224 49.6% 43.8% 6.7% 50.4%2010 251 40.6% 42.6% 16.7% 59.4% 252 54.4% 33.7% 11.9% 45.6%
74

School Gr. YearNo.
Tested Not Met Met ExemplaryNo.
Tested Not Met Met ExemplaryMet/
Exemplary
English/Language Arts MathematicsPerformance Levels
Met/ Exemplary
Performance Levels
Oakland Elem 3 2009 80 36.3% 36.3% 27.5% 63.8% 80 40.0% 35.0% 25.0% 60.0%2010 78 16.7% 39.7% 43.6% 83.3% 78 43.6% 32.1% 24.4% 56.4%
4 2009 72 30.6% 47.2% 22.2% 69.4% 72 47.2% 38.9% 13.9% 52.8%2010 77 26.0% 42.9% 31.2% 74.0% 77 22.1% 49.4% 28.6% 77.9%
5 2009 56 21.4% 58.9% 19.6% 78.6% 56 32.1% 60.7% 7.1% 67.9%2010 73 34.2% 41.1% 24.7% 65.8% 73 53.4% 30.1% 16.4% 46.6%
Total 2009 208 30.3% 46.2% 23.6% 69.7% 208 40.4% 43.3% 16.3% 59.6%2010 228 25.4% 41.2% 33.3% 74.6% 228 39.5% 37.3% 23.2% 60.5%
Pepperhill Elem 3 2009 84 51.2% 31.0% 17.9% 48.8% 84 63.1% 28.6% 8.3% 36.9%2010 95 31.6% 33.7% 34.7% 68.4% 95 51.6% 36.8% 11.6% 48.4%
4 2009 96 29.2% 37.5% 33.3% 70.8% 96 29.2% 40.6% 30.2% 70.8%2010 92 39.1% 44.6% 16.3% 60.9% 92 41.3% 40.2% 18.5% 58.7%
5 2009 74 27.0% 48.6% 24.3% 73.0% 75 34.7% 49.3% 16.0% 65.3%2010 102 29.4% 39.2% 31.4% 70.6% 102 45.1% 37.3% 17.6% 54.9%
Total 2009 254 35.8% 38.6% 25.6% 64.2% 255 42.0% 39.2% 18.8% 58.0%2010 289 33.2% 39.1% 27.7% 66.8% 289 46.0% 38.1% 15.9% 54.0%
R D Schroder Middle 6 2009 66 62.1% 31.8% 6.1% 37.9% 66 57.6% 37.9% 4.5% 42.4%7 2009 60 43.3% 45.0% 11.7% 56.7% 60 43.3% 53.3% 3.3% 56.7%8 2009 83 61.4% 33.7% 4.8% 38.6% 83 69.9% 25.3% 4.8% 30.1%
Total 2009 209 56.5% 36.4% 7.2% 43.5% 209 58.4% 37.3% 4.3% 41.6%Sanders-Clyde Elem 3 2009 31 41.9% 45.2% 12.9% 58.1% 31 64.5% 25.8% 9.7% 35.5%
2010 50 48.0% 38.0% 14.0% 52.0% 50 66.0% 30.0% 4.0% 34.0%4 2009 46 60.9% 32.6% 6.5% 39.1% 46 50.0% 37.0% 13.0% 50.0%
2010 39 41.0% 48.7% 10.3% 59.0% 39 51.3% 46.2% 2.6% 48.7%5 2009 35 40.0% 51.4% 8.6% 60.0% 35 45.7% 45.7% 8.6% 54.3%
2010 42 54.8% 35.7% 9.5% 45.2% 42 69.0% 28.6% 2.4% 31.0%6 2009 20 45.0% 55.0% 0.0% 55.0% 20 45.0% 50.0% 5.0% 55.0%
2010 33 48.5% 48.5% 3.0% 51.5% 33 54.5% 39.4% 6.1% 45.5%7 2009 21 52.4% 42.9% 4.8% 47.6% 21 42.9% 57.1% 0.0% 57.1%
2010 27 59.3% 33.3% 7.4% 40.7% 27 70.4% 29.6% 0.0% 29.6%8 2009 19 57.9% 26.3% 15.8% 42.1% 19 57.9% 42.1% 0.0% 42.1%
2010 16 56.3% 37.5% 6.3% 43.8% 16 62.5% 37.5% 0.0% 37.5%Total 2009 172 50.0% 41.9% 8.1% 50.0% 172 51.2% 41.3% 7.6% 48.8%
2010 207 50.2% 40.6% 9.2% 49.8% 207 62.3% 34.8% 2.9% 37.7%Sixth Grade Academy 6 2010 128 60.9% 36.7% 2.3% 39.1% 128 46.9% 47.7% 5.5% 53.1%at McNair Total 2010 128 60.9% 36.7% 2.3% 39.1% 128 46.9% 47.7% 5.5% 53.1%Springfield Elem 3 2009 74 13.5% 48.6% 37.8% 86.5% 74 31.1% 32.4% 36.5% 68.9%
2010 79 21.5% 22.8% 55.7% 78.5% 79 30.4% 15.2% 54.4% 69.6%4 2009 69 18.8% 33.3% 47.8% 81.2% 69 10.1% 50.7% 39.1% 89.9%
2010 83 19.3% 47.0% 33.7% 80.7% 83 18.1% 41.0% 41.0% 81.9%5 2009 71 14.1% 47.9% 38.0% 85.9% 71 29.6% 40.8% 29.6% 70.4%
2010 77 11.7% 44.2% 44.2% 88.3% 78 32.1% 43.6% 24.4% 67.9%Total 2009 214 15.4% 43.5% 41.1% 84.6% 214 23.8% 41.1% 35.0% 76.2%
2010 239 17.6% 38.1% 44.4% 82.4% 240 26.7% 33.3% 40.0% 73.3%
75

School Gr. YearNo.
Tested Not Met Met ExemplaryNo.
Tested Not Met Met ExemplaryMet/
Exemplary
English/Language Arts MathematicsPerformance Levels
Met/ Exemplary
Performance Levels
3 2009 118 8.5% 22.9% 68.6% 91.5% 118 16.9% 29.7% 53.4% 83.1%2010 117 8.5% 17.1% 74.4% 91.5% 117 16.2% 21.4% 62.4% 83.8%
4 2009 123 16.3% 34.1% 49.6% 83.7% 123 12.2% 48.0% 39.8% 87.8%2010 124 21.8% 26.6% 51.6% 78.2% 124 13.7% 40.3% 46.0% 86.3%
5 2009 127 12.6% 33.1% 54.3% 87.4% 127 11.8% 51.2% 37.0% 88.2%2010 123 8.9% 43.9% 47.2% 91.1% 123 21.1% 42.3% 36.6% 78.9%
Total 2009 368 12.5% 30.2% 57.3% 87.5% 368 13.6% 43.2% 43.2% 86.4%2010 364 13.2% 29.4% 57.4% 86.8% 364 17.0% 34.9% 48.1% 83.0%
St James-Santee Elem 3 2009 35 34.3% 48.6% 17.1% 65.7% 35 48.6% 40.0% 11.4% 51.4%2010 17 29.4% 35.3% 35.3% 70.6% 17 41.2% 29.4% 29.4% 58.8%
4 2009 16 18.8% 56.3% 25.0% 81.3% 16 37.5% 31.3% 31.3% 62.5%2010 29 31.0% 51.7% 17.2% 69.0% 29 34.5% 48.3% 17.2% 65.5%
5 2009 24 45.8% 37.5% 16.7% 54.2% 24 45.8% 37.5% 16.7% 54.2%2010 18 27.8% 33.3% 38.9% 72.2% 18 44.4% 22.2% 33.3% 55.6%
6 2010 24 75.0% 16.7% 8.3% 25.0% 24 70.8% 16.7% 12.5% 29.2%Total 2009 75 34.7% 46.7% 18.7% 65.3% 75 45.3% 37.3% 17.3% 54.7%
2010 88 42.0% 35.2% 22.7% 58.0% 88 47.7% 30.7% 21.6% 52.3%St. Andrews Middle 6 2009 148 24.3% 47.3% 28.4% 75.7% 148 22.3% 41.9% 35.8% 77.7%
2010 183 18.0% 41.0% 41.0% 82.0% 184 16.3% 43.5% 40.2% 83.7%7 2009 130 31.5% 48.5% 20.0% 68.5% 131 24.4% 44.3% 31.3% 75.6%
2010 160 29.4% 33.8% 36.9% 70.6% 161 34.2% 38.5% 27.3% 65.8%8 2009 150 33.3% 48.0% 18.7% 66.7% 151 41.1% 41.7% 17.2% 58.9%
2010 139 33.1% 37.4% 29.5% 66.9% 139 25.9% 49.6% 24.5% 74.1%Total 2009 428 29.7% 47.9% 22.4% 70.3% 430 29.5% 42.6% 27.9% 70.5%
2010 482 26.1% 37.6% 36.3% 73.9% 484 25.0% 43.6% 31.4% 75.0%Stiles Point Elem 3 2009 114 4.4% 27.2% 68.4% 95.6% 114 9.6% 25.4% 64.9% 90.4%
2010 103 9.7% 12.6% 77.7% 90.3% 103 9.7% 20.4% 69.9% 90.3%4 2009 103 7.8% 30.1% 62.1% 92.2% 103 3.9% 38.8% 57.3% 96.1%
2010 115 7.0% 28.7% 64.3% 93.0% 115 8.7% 29.6% 61.7% 91.3%5 2009 87 12.6% 42.5% 44.8% 87.4% 87 16.1% 34.5% 49.4% 83.9%
2010 104 9.6% 28.8% 61.5% 90.4% 104 8.7% 40.4% 51.0% 91.3%Total 2009 304 7.9% 32.6% 59.5% 92.1% 304 9.5% 32.6% 57.9% 90.5%
2010 322 8.7% 23.6% 67.7% 91.3% 322 9.0% 30.1% 60.9% 91.0%Stono Park Elem 3 2009 53 18.9% 35.8% 45.3% 81.1% 53 26.4% 39.6% 34.0% 73.6%
2010 50 18.0% 26.0% 56.0% 82.0% 50 22.0% 20.0% 58.0% 78.0%4 2009 48 27.1% 52.1% 20.8% 72.9% 48 14.6% 52.1% 33.3% 85.4%
2010 49 28.6% 40.8% 30.6% 71.4% 49 16.3% 51.0% 32.7% 83.7%5 2009 49 16.3% 59.2% 24.5% 83.7% 49 16.3% 53.1% 30.6% 83.7%
2010 46 23.9% 56.5% 19.6% 76.1% 46 32.6% 37.0% 30.4% 67.4%Total 2009 150 20.7% 48.7% 30.7% 79.3% 150 19.3% 48.0% 32.7% 80.7%
2010 145 23.4% 40.7% 35.9% 76.6% 145 23.4% 35.9% 40.7% 76.6%
St Andrews Math And Science
76

School Gr. YearNo.
Tested Not Met Met ExemplaryNo.
Tested Not Met Met ExemplaryMet/
Exemplary
English/Language Arts MathematicsPerformance Levels
Met/ Exemplary
Performance Levels
Sullivans Island Elem 3 2009 44 9.1% 13.6% 77.3% 90.9% 44 11.4% 29.5% 59.1% 88.6%2010 74 5.4% 14.9% 79.7% 94.6% 74 12.2% 21.6% 66.2% 87.8%
4 2009 49 0.0% 16.3% 83.7% 100.0% 49 2.0% 26.5% 71.4% 98.0%2010 49 12.2% 26.5% 61.2% 87.8% 49 2.0% 38.8% 59.2% 98.0%
5 2009 61 0.0% 13.1% 86.9% 100.0% 61 1.6% 26.2% 72.1% 98.4%2010 56 5.4% 21.4% 73.2% 94.6% 55 9.1% 49.1% 41.8% 90.9%
Total 2009 154 2.6% 14.3% 83.1% 97.4% 154 4.5% 27.3% 68.2% 95.5%2010 179 7.3% 20.1% 72.6% 92.7% 178 8.4% 34.8% 56.7% 91.6%
Thomas C. Cario Middle 6 2009 380 10.0% 34.5% 55.5% 90.0% 381 10.0% 37.0% 53.0% 90.0%2010 409 9.3% 31.5% 59.2% 90.7% 409 10.3% 32.3% 57.5% 89.7%
7 2009 435 11.0% 33.6% 55.4% 89.0% 436 9.4% 37.2% 53.4% 90.6%2010 398 11.6% 30.4% 58.0% 88.4% 398 10.1% 29.4% 60.6% 89.9%
8 2009 391 12.5% 34.5% 52.9% 87.5% 392 13.5% 38.5% 48.0% 86.5%2010 450 17.3% 26.4% 56.2% 82.7% 449 13.6% 35.9% 50.6% 86.4%
Total 2009 1206 11.2% 34.2% 54.6% 88.8% 1209 10.9% 37.6% 51.5% 89.1%2010 1257 12.9% 29.4% 57.8% 87.1% 1256 11.4% 32.6% 56.0% 88.6%
W B Goodwin Elem 3 2009 95 26.3% 33.7% 40.0% 73.7% 95 33.7% 37.9% 28.4% 66.3%2010 77 31.2% 36.4% 32.5% 68.8% 77 42.9% 36.4% 20.8% 57.1%
4 2009 69 46.4% 33.3% 20.3% 53.6% 70 32.9% 47.1% 20.0% 67.1%2010 93 36.6% 39.8% 23.7% 63.4% 93 32.3% 38.7% 29.0% 67.7%
5 2009 69 23.2% 62.3% 14.5% 76.8% 69 43.5% 43.5% 13.0% 56.5%2010 60 35.0% 46.7% 18.3% 65.0% 60 41.7% 28.3% 30.0% 58.3%
Total 2009 233 31.3% 42.1% 26.6% 68.7% 234 36.3% 42.3% 21.4% 63.7%2010 230 34.3% 40.4% 25.2% 65.7% 230 38.3% 35.2% 26.5% 61.7%
West Ashley Middle 6 2009 117 45.3% 41.0% 13.7% 54.7% 117 43.6% 40.2% 16.2% 56.4%2010 110 36.4% 30.9% 32.7% 63.6% 110 44.5% 35.5% 20.0% 55.5%
7 2009 104 37.5% 37.5% 25.0% 62.5% 104 34.6% 42.3% 23.1% 65.4%2010 104 49.0% 32.7% 18.3% 51.0% 104 44.2% 43.3% 12.5% 55.8%
8 2009 146 36.3% 41.8% 21.9% 63.7% 145 45.5% 36.6% 17.9% 54.5%2010 140 44.3% 34.3% 21.4% 55.7% 141 45.4% 34.0% 20.6% 54.6%
Total 2009 367 39.5% 40.3% 20.2% 60.5% 366 41.8% 39.3% 18.9% 58.2%2010 354 43.2% 32.8% 24.0% 56.8% 355 44.8% 37.2% 18.0% 55.2%
77

School Gr. YearNo.
Tested Not Met Met ExemplaryNo.
Tested Not Met Met ExemplaryMet/
Exemplary
English/Language Arts MathematicsPerformance Levels
Met/ Exemplary
Performance Levels
CHARTER SCHOOLS6 2009 43 20.9% 32.6% 46.5% 79.1% 43 34.9% 34.9% 30.2% 65.1%
2010 38 15.8% 44.7% 39.5% 84.2% 38 28.9% 50.0% 21.1% 71.1%7 2009 38 18.4% 52.6% 28.9% 81.6% 38 21.1% 63.2% 15.8% 78.9%
2010 66 30.3% 18.2% 51.5% 69.7% 66 36.4% 43.9% 19.7% 63.6%8 2009 42 11.9% 42.9% 45.2% 88.1% 42 26.2% 45.2% 28.6% 73.8%
2010 61 26.2% 44.3% 29.5% 73.8% 61 36.1% 59.0% 4.9% 63.9%Total 2009 123 17.1% 42.3% 40.7% 82.9% 123 27.6% 47.2% 25.2% 72.4%
2010 165 25.5% 33.9% 40.6% 74.5% 165 34.5% 50.9% 14.5% 65.5%3 2009 21 4.8% 38.1% 57.1% 95.2% 21 14.3% 42.9% 42.9% 85.7%
2010 22 9.1% 40.9% 50.0% 90.9% 22 31.8% 40.9% 27.3% 68.2%4 2009 18 16.7% 44.4% 38.9% 83.3% 18 22.2% 33.3% 44.4% 77.8%
2010 20 30.0% 45.0% 25.0% 70.0% 20 30.0% 55.0% 15.0% 70.0%5 2009 12 0.0% 33.3% 66.7% 100.0% 12 8.3% 33.3% 58.3% 91.7%
2010 18 11.1% 66.7% 22.2% 88.9% 18 11.1% 55.6% 33.3% 88.9%6 2009 8 0.0% 50.0% 50.0% 100.0% 8 37.5% 25.0% 37.5% 62.5%
2010 12 16.7% 50.0% 33.3% 83.3% 12 25.0% 50.0% 25.0% 75.0%7 2010 10 30.0% 50.0% 20.0% 70.0% 10 50.0% 30.0% 20.0% 50.0%
Total 2009 59 6.8% 40.7% 52.5% 93.2% 59 18.6% 35.6% 45.8% 81.4%2010 82 18.3% 50.0% 31.7% 81.7% 82 28.0% 47.6% 24.4% 72.0%
3 2009 29 0.0% 17.2% 82.8% 100.0% 29 13.8% 41.4% 44.8% 86.2%2010 32 6.3% 18.8% 75.0% 93.8% 32 18.8% 25.0% 56.3% 81.3%
4 2009 26 11.5% 19.2% 69.2% 88.5% 26 7.7% 53.8% 38.5% 92.3%2010 29 0.0% 37.9% 62.1% 100.0% 29 6.9% 44.8% 48.3% 93.1%
5 2009 23 8.7% 34.8% 56.5% 91.3% 23 26.1% 34.8% 39.1% 73.9%2010 26 7.7% 30.8% 61.5% 92.3% 26 11.5% 34.6% 53.8% 88.5%
6 2009 16 12.5% 50.0% 37.5% 87.5% 16 37.5% 37.5% 25.0% 62.5%2010 15 20.0% 20.0% 60.0% 80.0% 15 26.7% 33.3% 40.0% 73.3%
7 2009 8 0.0% 25.0% 75.0% 100.0% 8 0.0% 37.5% 62.5% 100.0%2010 14 7.1% 28.6% 64.3% 92.9% 14 21.4% 35.7% 42.9% 78.6%
8 2009 12 8.3% 25.0% 66.7% 91.7% 12 25.0% 16.7% 58.3% 75.0%2010 5 * * * * 5 * * * *
Total 2009 114 7.0% 27.2% 65.8% 93.0% 114 18.4% 39.5% 42.1% 81.6%2010 121 6.6% 27.3% 66.1% 93.4% 121 14.9% 33.9% 51.2% 85.1%
8 2010 3 * * * * 4 * * * *Total 2010 3 * * * * 4 * * * *
Orange Grove Charter 3 2009 99 17.2% 27.3% 55.6% 82.8% 100 29.0% 43.0% 28.0% 71.0%2010 120 10.0% 27.5% 62.5% 90.0% 119 22.7% 33.6% 43.7% 77.3%
4 2009 104 22.1% 48.1% 29.8% 77.9% 105 21.0% 55.2% 23.8% 79.0%2010 106 13.2% 35.8% 50.9% 86.8% 106 15.1% 39.6% 45.3% 84.9%
5 2009 113 10.6% 43.4% 46.0% 89.4% 113 15.9% 38.1% 46.0% 84.1%2010 100 10.0% 45.0% 45.0% 90.0% 100 19.0% 38.0% 43.0% 81.0%
Total 2009 316 16.5% 39.9% 43.7% 83.5% 318 21.7% 45.3% 33.0% 78.3%2010 326 11.0% 35.6% 53.4% 89.0% 325 19.1% 36.9% 44.0% 80.9%
*Scores not reported for any category in which there are fewer than six students.
East Cooper Montessori Charter
Charleston Charter Math/Science
Charleston Develop. Charter
Greg Mathis Charter High
78

School Gr. YearNo.
Tested Not Met Met ExemplaryNo.
Tested Not Met Met ExemplaryMet/
Exemplary
English/Language Arts MathematicsPerformance Levels
Met/ Exemplary
Performance Levels
3 2009 27 51.9% 29.6% 18.5% 48.1% 27 63.0% 22.2% 14.8% 37.0%2010 18 55.6% 22.2% 22.2% 44.4% 18 66.7% 27.8% 5.6% 33.3%
4 2009 15 53.3% 46.7% 0.0% 46.7% 15 46.7% 46.7% 6.7% 53.3%2010 22 63.6% 36.4% 0.0% 36.4% 22 50.0% 50.0% 0.0% 50.0%
5 2009 23 52.2% 43.5% 4.3% 47.8% 23 65.2% 30.4% 4.3% 34.8%2010 17 64.7% 23.5% 11.8% 35.3% 17 64.7% 23.5% 11.8% 35.3%
6 2009 23 60.9% 30.4% 8.7% 39.1% 23 69.6% 30.4% 0.0% 30.4%2010 18 55.6% 38.9% 5.6% 44.4% 18 55.6% 44.4% 0.0% 44.4%
Total 2009 88 54.5% 36.4% 9.1% 45.5% 88 62.5% 30.7% 6.8% 37.5%2010 75 60.0% 30.7% 9.3% 40.0% 75 58.7% 37.3% 4.0% 41.3%
Susan G. Boykin Charter
79

63
APPENDIX C
PALMETTO ASSESSMENT OF STATE STANDARDS (PASS)
Percent at Each Performance Level in Individual Schools
Science and Social Studies
80

School Gr. YearNo.
Tested Not Met Met ExemplaryMet/
ExemplaryNo.
Tested Not Met Met ExemplaryMet/
Exemplary
A C Corcoran Elem 3 2009 49 44.9% 53.1% 2.0% 55.1% 45 40.0% 42.2% 17.8% 60.0%2010 49 69.4% 22.4% 8.2% 30.6% 52 32.7% 44.2% 23.1% 67.3%
4 2009 75 50.7% 44.0% 5.3% 49.3% 75 17.3% 64.0% 18.7% 82.7%2010 88 42.0% 54.5% 3.4% 58.0% 88 26.1% 61.4% 12.5% 73.9%
5 2009 33 42.4% 51.5% 6.1% 57.6% 34 41.2% 47.1% 11.8% 58.8%2010 39 56.4% 38.5% 5.1% 43.6% 37 56.8% 29.7% 13.5% 43.2%
Total 2009 157 47.1% 48.4% 4.5% 52.9% 154 29.2% 53.9% 16.9% 70.8%2010 176 52.8% 42.0% 5.1% 47.2% 177 34.5% 49.7% 15.8% 65.5%
Alice Birney Middle 6 2009 99 60.6% 33.3% 6.1% 39.4% 100 39.0% 55.0% 6.0% 61.0%2010 108 71.3% 26.9% 1.9% 28.7% 106 44.3% 50.0% 5.7% 55.7%
7 2009 188 41.0% 50.0% 9.0% 59.0% 185 54.1% 28.6% 17.3% 45.9%2010 172 46.5% 44.2% 9.3% 53.5% 172 69.2% 23.3% 7.6% 30.8%
8 2009 97 74.2% 20.6% 5.2% 25.8% 97 39.2% 49.5% 11.3% 60.8%2010 104 54.8% 31.7% 13.5% 45.2% 110 50.0% 40.9% 9.1% 50.0%
Total 2009 384 54.4% 38.3% 7.3% 45.6% 382 46.3% 40.8% 12.8% 53.7%2010 384 55.7% 35.9% 8.3% 44.3% 388 57.0% 35.6% 7.5% 43.0%
Angel Oak Elem 3 2009 37 51.4% 37.8% 10.8% 48.6% 35 31.4% 48.6% 20.0% 68.6%2010 35 77.1% 20.0% 2.9% 22.9% 34 38.2% 38.2% 23.5% 61.8%
4 2009 65 32.3% 58.5% 9.2% 67.7% 65 15.4% 61.5% 23.1% 84.6%2010 61 42.6% 55.7% 1.6% 57.4% 61 19.7% 63.9% 16.4% 80.3%
5 2009 25 16.0% 76.0% 8.0% 84.0% 24 29.2% 62.5% 8.3% 70.8%2010 37 29.7% 51.4% 18.9% 70.3% 35 17.1% 57.1% 25.7% 82.9%
Total 2009 127 34.6% 55.9% 9.4% 65.4% 124 22.6% 58.1% 19.4% 77.4%2010 133 48.1% 45.1% 6.8% 51.9% 130 23.8% 55.4% 20.8% 76.2%
3 2009 45 17.8% 64.4% 17.8% 82.2% 43 2.3% 48.8% 48.8% 97.7%2010 44 15.9% 36.4% 47.7% 84.1% 44 4.5% 22.7% 72.7% 95.5%
4 2009 89 19.1% 58.4% 22.5% 80.9% 89 4.5% 30.3% 65.2% 95.5%2010 94 11.7% 63.8% 24.5% 88.3% 94 6.4% 35.1% 58.5% 93.6%
5 2009 45 13.3% 64.4% 22.2% 86.7% 45 11.1% 31.1% 57.8% 88.9%2010 47 8.5% 57.4% 34.0% 91.5% 46 13.0% 30.4% 56.5% 87.0%
Total 2009 179 17.3% 61.5% 21.2% 82.7% 177 5.6% 35.0% 59.3% 94.4%2010 185 11.9% 55.7% 32.4% 88.1% 184 7.6% 31.0% 61.4% 92.4%
Baptist Hill High 7 2010 68 39.7% 51.5% 8.8% 60.3% 68 61.8% 30.9% 7.4% 38.2%8 2010 29 44.8% 48.3% 6.9% 55.2% 28 32.1% 57.1% 10.7% 67.9%
Total 2010 97 41.2% 50.5% 8.2% 58.8% 96 53.1% 38.5% 8.3% 46.9%
APPENDIX C
PALMETTO ASSESSMENT OF STATE STANDARDS (PASS)RESULTS FOR ALL PERFORMANCE LEVELS, BY SCHOOL
SCIENCE AND SOCIAL STUDIESSpring 2009 and Spring 2010
Science Social StudiesPerformance Levels Performance Levels, %
Ashley River Creative Arts
81

School Gr. YearNo.
Tested Not Met Met ExemplaryMet/
ExemplaryNo.
Tested Not Met Met ExemplaryMet/
Exemplary
Science Social StudiesPerformance Levels Performance Levels, %
Belle Hall Elem 3 2009 59 11.9% 50.8% 37.3% 88.1% 60 16.7% 25.0% 58.3% 83.3%2010 53 20.8% 39.6% 39.6% 79.2% 55 12.7% 25.5% 61.8% 87.3%
4 2009 115 12.2% 39.1% 48.7% 87.8% 114 7.0% 17.5% 75.4% 93.0%2010 118 14.4% 55.9% 29.7% 85.6% 118 8.5% 24.6% 66.9% 91.5%
5 2009 48 4.2% 52.1% 43.8% 95.8% 47 2.1% 25.5% 72.3% 97.9%2010 57 7.0% 54.4% 38.6% 93.0% 56 7.1% 14.3% 78.6% 92.9%
Total 2009 222 10.4% 45.0% 44.6% 89.6% 221 8.6% 21.3% 70.1% 91.4%2010 228 14.0% 51.8% 34.2% 86.0% 229 9.2% 22.3% 68.6% 90.8%
Blaney Elem 3 2009 10 50.0% 50.0% 0.0% 50.0% 10 20.0% 50.0% 30.0% 80.0%2010 14 50.0% 28.6% 21.4% 50.0% 14 21.4% 42.9% 35.7% 78.6%
4 2009 29 44.8% 44.8% 10.3% 55.2% 29 17.2% 69.0% 13.8% 82.8%2010 18 72.2% 27.8% 0.0% 27.8% 18 44.4% 50.0% 5.6% 55.6%
5 2009 15 46.7% 53.3% 0.0% 53.3% 14 28.6% 64.3% 7.1% 71.4%2010 15 60.0% 33.3% 6.7% 40.0% 13 30.8% 46.2% 23.1% 69.2%
6 2010 9 66.7% 33.3% 0.0% 33.3% 10 70.0% 30.0% 0.0% 30.0%Total 2009 54 46.3% 48.1% 5.6% 53.7% 53 20.8% 64.2% 15.1% 79.2%
2010 56 62.5% 30.4% 7.1% 37.5% 55 40.0% 43.6% 16.4% 60.0%Brentwood Middle 6 2009 59 89.8% 10.2% 0.0% 10.2% 57 54.4% 43.9% 1.8% 45.6%
7 2009 114 57.9% 40.4% 1.8% 42.1% 114 89.5% 9.6% 0.9% 10.5%8 2009 49 93.9% 6.1% 0.0% 6.1% 54 74.1% 18.5% 7.4% 25.9%
Total 2009 222 74.3% 24.8% 0.9% 25.7% 225 76.9% 20.4% 2.7% 23.1%Buist Academy 3 2009 19 10.5% 47.4% 42.1% 89.5% 20 0.0% 20.0% 80.0% 100.0%
2010 20 5.0% 15.0% 80.0% 95.0% 20 0.0% 10.0% 90.0% 100.0%4 2009 51 3.9% 41.2% 54.9% 96.1% 51 2.0% 17.6% 80.4% 98.0%
2010 49 8.2% 26.5% 65.3% 91.8% 49 6.1% 16.3% 77.6% 93.9%5 2009 25 0.0% 56.0% 44.0% 100.0% 25 0.0% 12.0% 88.0% 100.0%
2010 25 12.0% 56.0% 32.0% 88.0% 26 7.7% 34.6% 57.7% 92.3%6 2009 24 0.0% 37.5% 62.5% 100.0% 24 0.0% 25.0% 75.0% 100.0%
2010 23 0.0% 56.5% 43.5% 100.0% 23 0.0% 0.0% 100.0% 100.0%7 2009 49 0.0% 28.6% 71.4% 100.0% 49 2.0% 12.2% 85.7% 98.0%
2010 45 0.0% 26.7% 73.3% 100.0% 45 2.2% 15.6% 82.2% 97.8%8 2009 24 8.3% 12.5% 79.2% 91.7% 24 0.0% 20.8% 79.2% 100.0%
2010 23 0.0% 21.7% 78.3% 100.0% 24 0.0% 20.8% 79.2% 100.0%Total 2009 192 3.1% 36.5% 60.4% 96.9% 193 1.0% 17.1% 81.9% 99.0%
2010 185 4.3% 32.4% 63.2% 95.7% 187 3.2% 16.6% 80.2% 96.8%Burke High 7 2009 75 76.0% 21.3% 2.7% 24.0% 75 82.7% 14.7% 2.7% 17.3%
2010 65 50.8% 49.2% 0.0% 49.2% 65 72.3% 26.2% 1.5% 27.7%8 2009 35 88.6% 11.4% 0.0% 11.4% 33 30.3% 54.5% 15.2% 69.7%
2010 42 88.1% 11.9% 0.0% 11.9% 42 57.1% 33.3% 9.5% 42.9%Total 2009 110 80.0% 18.2% 1.8% 20.0% 108 66.7% 26.9% 6.5% 33.3%
2010 107 65.4% 34.6% 0.0% 34.6% 107 66.4% 29.0% 4.7% 33.6%
82

School Gr. YearNo.
Tested Not Met Met ExemplaryMet/
ExemplaryNo.
Tested Not Met Met ExemplaryMet/
Exemplary
Science Social StudiesPerformance Levels Performance Levels, %
6 2009 114 27.2% 51.8% 21.1% 72.8% 114 9.6% 57.9% 32.5% 90.4%2010 98 25.5% 50.0% 24.5% 74.5% 98 12.2% 48.0% 39.8% 87.8%
7 2009 260 26.2% 55.4% 18.5% 73.8% 260 30.8% 31.5% 37.7% 69.2%2010 232 32.8% 50.9% 16.4% 67.2% 232 39.2% 34.9% 25.9% 60.8%
8 2009 93 19.4% 48.4% 32.3% 80.6% 96 8.3% 50.0% 41.7% 91.7%2010 121 25.6% 43.8% 30.6% 74.4% 119 22.7% 46.2% 31.1% 77.3%
Total 2009 467 25.1% 53.1% 21.8% 74.9% 470 21.1% 41.7% 37.2% 78.9%2010 451 29.3% 48.8% 22.0% 70.7% 449 29.0% 40.8% 30.3% 71.0%
3 2009 154 7.8% 40.3% 51.9% 92.2% 152 0.0% 15.8% 84.2% 100.0%2010 155 16.1% 37.4% 46.5% 83.9% 155 5.2% 22.6% 72.3% 94.8%
4 2009 334 7.5% 46.1% 46.4% 92.5% 333 3.3% 22.5% 74.2% 96.7%2010 340 6.5% 51.5% 42.1% 93.5% 340 2.1% 23.8% 74.1% 97.9%
5 2009 155 7.1% 58.1% 34.8% 92.9% 154 5.8% 40.3% 53.9% 94.2%2010 176 5.1% 50.6% 44.3% 94.9% 172 8.7% 41.3% 50.0% 91.3%
Total 2009 643 7.5% 47.6% 44.9% 92.5% 639 3.1% 25.2% 71.7% 96.9%2010 671 8.3% 48.0% 43.7% 91.7% 667 4.5% 28.0% 67.5% 95.5%
3 2009 14 35.7% 35.7% 28.6% 64.3% 13 7.7% 23.1% 69.2% 92.3%2010 12 75.0% 16.7% 8.3% 25.0% 12 0.0% 50.0% 50.0% 100.0%
4 2009 24 25.0% 62.5% 12.5% 75.0% 24 8.3% 79.2% 12.5% 91.7%2010 32 28.1% 62.5% 9.4% 71.9% 32 12.5% 43.8% 43.8% 87.5%
5 2009 12 58.3% 41.7% 0.0% 41.7% 10 30.0% 40.0% 30.0% 70.0%2010 17 35.3% 58.8% 5.9% 64.7% 17 17.6% 47.1% 35.3% 82.4%
6 2009 11 45.5% 45.5% 9.1% 54.5% 13 7.7% 69.2% 23.1% 92.3%2010 13 46.2% 53.8% 0.0% 53.8% 12 8.3% 50.0% 41.7% 91.7%
7 2009 37 24.3% 64.9% 10.8% 75.7% 37 48.6% 35.1% 16.2% 51.4%8 2009 20 35.0% 50.0% 15.0% 65.0% 22 45.5% 50.0% 4.5% 54.5%
Total 2009 118 33.1% 54.2% 12.7% 66.9% 119 29.4% 49.6% 21.0% 70.6%2010 74 40.5% 52.7% 6.8% 59.5% 73 11.0% 46.6% 42.5% 89.0%
6 2009 77 9.1% 53.2% 37.7% 90.9% 78 2.6% 32.1% 65.4% 97.4%2010 80 11.3% 61.3% 27.5% 88.8% 80 1.3% 36.3% 62.5% 98.8%
7 2009 154 1.9% 42.9% 55.2% 98.1% 154 4.5% 29.2% 66.2% 95.5%2010 162 2.5% 29.6% 67.9% 97.5% 162 6.8% 25.3% 67.9% 93.2%
8 2009 76 2.6% 40.8% 56.6% 97.4% 77 2.6% 33.8% 63.6% 97.4%2010 88 3.4% 26.1% 70.5% 96.6% 86 3.5% 43.0% 53.5% 96.5%
Total 2009 307 3.9% 45.0% 51.1% 96.1% 309 3.6% 31.1% 65.4% 96.4%2010 330 4.8% 36.4% 58.8% 95.2% 328 4.6% 32.6% 62.8% 95.4%
3 2009 7 57.1% 28.6% 14.3% 42.9% 6 16.7% 33.3% 50.0% 83.3%4 2009 20 70.0% 30.0% 0.0% 30.0% 20 30.0% 60.0% 10.0% 70.0%5 2009 10 80.0% 20.0% 0.0% 20.0% 10 70.0% 0.0% 30.0% 30.0%6 2009 23 69.6% 30.4% 0.0% 30.4% 22 13.6% 77.3% 9.1% 86.4%7 2009 43 37.2% 53.5% 9.3% 62.8% 43 32.6% 44.2% 23.3% 67.4%8 2009 20 45.0% 45.0% 10.0% 55.0% 20 35.0% 45.0% 20.0% 65.0%
Total 2009 123 54.5% 39.8% 5.7% 45.5% 121 31.4% 48.8% 19.8% 68.6%
Charleston Progressive
Charleston School Of The Arts
Charlestowne Academy
C E Williams Middle
Charles Pinckney Elem
83

School Gr. YearNo.
Tested Not Met Met ExemplaryMet/
ExemplaryNo.
Tested Not Met Met ExemplaryMet/
Exemplary
Science Social StudiesPerformance Levels Performance Levels, %
Chicora Elem 3 2009 23 87.0% 13.0% 0.0% 13.0% 23 43.5% 43.5% 13.0% 56.5%2010 32 75.0% 18.8% 6.3% 25.0% 33 51.5% 39.4% 9.1% 48.5%
4 2009 44 56.8% 38.6% 4.5% 43.2% 44 15.9% 77.3% 6.8% 84.1%2010 59 59.3% 39.0% 1.7% 40.7% 59 27.1% 59.3% 13.6% 72.9%
5 2009 19 57.9% 42.1% 0.0% 42.1% 19 21.1% 73.7% 5.3% 78.9%2010 22 81.8% 18.2% 0.0% 18.2% 22 68.2% 27.3% 4.5% 31.8%
Total 2009 86 65.1% 32.6% 2.3% 34.9% 86 24.4% 67.4% 8.1% 75.6%2010 113 68.1% 29.2% 2.7% 31.9% 114 42.1% 47.4% 10.5% 57.9%
6 2009 19 89.5% 10.5% 0.0% 10.5% 21 71.4% 28.6% 0.0% 28.6%2010 30 80.0% 20.0% 0.0% 20.0% 22 54.5% 40.9% 4.5% 45.5%
7 2009 51 78.4% 21.6% 0.0% 21.6% 51 88.2% 9.8% 2.0% 11.8%2010 62 82.3% 17.7% 0.0% 17.7% 61 90.2% 9.8% 0.0% 9.8%
8 2009 24 75.0% 25.0% 0.0% 25.0% 31 77.4% 22.6% 0.0% 22.6%2010 20 95.0% 5.0% 0.0% 5.0% 28 92.9% 7.1% 0.0% 7.1%
Total 2009 94 79.8% 20.2% 0.0% 20.2% 103 81.6% 17.5% 1.0% 18.4%2010 112 83.9% 16.1% 0.0% 16.1% 111 83.8% 15.3% 0.9% 16.2%
Drayton Hall Elem 3 2009 69 29.0% 33.3% 37.7% 71.0% 70 7.1% 47.1% 45.7% 92.9%2010 61 29.5% 31.1% 39.3% 70.5% 61 9.8% 26.2% 63.9% 90.2%
4 2009 110 17.3% 62.7% 20.0% 82.7% 110 12.7% 37.3% 50.0% 87.3%2010 133 17.3% 57.9% 24.8% 82.7% 133 12.0% 39.1% 48.9% 88.0%
5 2009 45 22.2% 64.4% 13.3% 77.8% 43 7.0% 51.2% 41.9% 93.0%2010 56 19.6% 60.7% 19.6% 80.4% 52 19.2% 42.3% 38.5% 80.8%
Total 2009 224 21.9% 54.0% 24.1% 78.1% 223 9.9% 43.0% 47.1% 90.1%2010 250 20.8% 52.0% 27.2% 79.2% 246 13.0% 36.6% 50.4% 87.0%
3 2009 10 50.0% 40.0% 10.0% 50.0% 10 40.0% 60.0% 0.0% 60.0%2010 6 50.0% 33.3% 16.7% 50.0% 7 28.6% 42.9% 28.6% 71.4%
4 2009 10 10.0% 70.0% 20.0% 90.0% 10 10.0% 80.0% 10.0% 90.0%2010 15 26.7% 66.7% 6.7% 73.3% 15 13.3% 73.3% 13.3% 86.7%
5 2009 6 50.0% 50.0% 0.0% 50.0% 6 33.3% 33.3% 33.3% 66.7%2010 6 66.7% 33.3% 0.0% 33.3% 6 50.0% 50.0% 0.0% 50.0%
6 2009 5 * * * * 5 * * * *2010 5 * * * * 6 16.7% 50.0% 33.3% 83.3%
Total 2009 31 41.9% 45.2% 12.9% 58.1% 31 22.6% 67.7% 9.7% 77.4%2010 32 34.4% 56.3% 9.4% 65.6% 34 23.5% 58.8% 17.6% 76.5%
3 2009 30 80.0% 20.0% 0.0% 20.0% 27 48.1% 40.7% 11.1% 51.9%2010 24 91.7% 8.3% 0.0% 8.3% 24 58.3% 41.7% 0.0% 41.7%
4 2009 67 71.6% 25.4% 3.0% 28.4% 67 47.8% 50.7% 1.5% 52.2%2010 54 90.7% 9.3% 0.0% 9.3% 54 74.1% 24.1% 1.9% 25.9%
5 2009 37 75.7% 24.3% 0.0% 24.3% 35 62.9% 28.6% 8.6% 37.1%2010 30 53.3% 43.3% 3.3% 46.7% 32 56.3% 37.5% 6.3% 43.8%
Total 2009 134 74.6% 23.9% 1.5% 25.4% 129 51.9% 42.6% 5.4% 48.1%2010 108 80.6% 18.5% 0.9% 19.4% 110 65.5% 31.8% 2.7% 34.5%
*Scores not reported for any category in which there are fewer than six students.
Daniel Jenkins Academy
Edith L Frierson Elem
Edmund A Burns Elem
84

School Gr. YearNo.
Tested Not Met Met ExemplaryMet/
ExemplaryNo.
Tested Not Met Met ExemplaryMet/
Exemplary
Science Social StudiesPerformance Levels Performance Levels, %
Ellington Elem 3 2009 13 69.2% 30.8% 0.0% 30.8% 13 23.1% 69.2% 7.7% 76.9%2010 20 75.0% 10.0% 15.0% 25.0% 16 50.0% 37.5% 12.5% 50.0%
4 2009 28 42.9% 57.1% 0.0% 57.1% 28 17.9% 71.4% 10.7% 82.1%2010 27 44.4% 51.9% 3.7% 55.6% 27 40.7% 48.1% 11.1% 59.3%
5 2009 22 50.0% 50.0% 0.0% 50.0% 21 47.6% 28.6% 23.8% 52.4%2010 12 41.7% 50.0% 8.3% 58.3% 12 50.0% 50.0% 0.0% 50.0%
6 2010 16 43.8% 50.0% 6.3% 56.3% 14 50.0% 42.9% 7.1% 50.0%Total 2009 63 50.8% 49.2% 0.0% 49.2% 62 29.0% 56.5% 14.5% 71.0%
2010 75 52.0% 40.0% 8.0% 48.0% 69 46.4% 44.9% 8.7% 53.6%6 2009 90 27.8% 65.6% 6.7% 72.2% 87 13.8% 47.1% 39.1% 86.2%
2010 93 36.6% 52.7% 10.8% 63.4% 91 20.9% 39.6% 39.6% 79.1%7 2009 179 20.1% 55.3% 24.6% 79.9% 179 26.3% 34.1% 39.7% 73.7%
2010 180 22.2% 51.7% 26.1% 77.8% 181 36.5% 39.2% 24.3% 63.5%8 2009 77 15.6% 58.4% 26.0% 84.4% 79 13.9% 22.8% 63.3% 86.1%
2010 91 19.8% 31.9% 48.4% 80.2% 87 9.2% 40.2% 50.6% 90.8%Total 2009 346 21.1% 58.7% 20.2% 78.9% 345 20.3% 34.8% 44.9% 79.7%
2010 364 25.3% 47.0% 27.7% 74.7% 359 25.9% 39.6% 34.5% 74.1%Fraser Elem 3 2009 13 76.9% 23.1% 0.0% 23.1% 11 9.1% 45.5% 45.5% 90.9%
4 2009 36 61.1% 38.9% 0.0% 38.9% 36 58.3% 38.9% 2.8% 41.7%5 2009 9 77.8% 22.2% 0.0% 22.2% 10 70.0% 30.0% 0.0% 30.0%6 2009 10 80.0% 20.0% 0.0% 20.0% 9 66.7% 33.3% 0.0% 33.3%
Total 2009 68 69.1% 30.9% 0.0% 30.9% 66 53.0% 37.9% 9.1% 47.0%Harbor View Elem 3 2009 44 11.4% 61.4% 27.3% 88.6% 44 4.5% 27.3% 68.2% 95.5%
2010 51 13.7% 41.2% 45.1% 86.3% 49 6.1% 30.6% 63.3% 93.9%4 2009 91 5.5% 59.3% 35.2% 94.5% 91 3.3% 36.3% 60.4% 96.7%
2010 93 11.8% 58.1% 30.1% 88.2% 93 11.8% 43.0% 45.2% 88.2%5 2009 39 28.2% 51.3% 20.5% 71.8% 39 2.6% 51.3% 46.2% 97.4%
2010 43 14.0% 44.2% 41.9% 86.0% 40 12.5% 47.5% 40.0% 87.5%Total 2009 174 12.1% 58.0% 29.9% 87.9% 174 3.4% 37.4% 59.2% 96.6%
2010 187 12.8% 50.3% 36.9% 87.2% 182 10.4% 40.7% 48.9% 89.6%Haut Gap Middle 6 2009 35 34.3% 62.9% 2.9% 65.7% 36 27.8% 50.0% 22.2% 72.2%
2010 51 47.1% 43.1% 9.8% 52.9% 53 15.1% 47.2% 37.7% 84.9%7 2009 63 38.1% 58.7% 3.2% 61.9% 63 52.4% 36.5% 11.1% 47.6%
2010 79 41.8% 48.1% 10.1% 58.2% 79 51.9% 36.7% 11.4% 48.1%8 2009 39 59.0% 33.3% 7.7% 41.0% 35 31.4% 42.9% 25.7% 68.6%
2010 30 53.3% 36.7% 10.0% 46.7% 30 26.7% 46.7% 26.7% 73.3%Total 2009 137 43.1% 52.6% 4.4% 56.9% 134 40.3% 41.8% 17.9% 59.7%
2010 160 45.6% 44.4% 10.0% 54.4% 162 35.2% 42.0% 22.8% 64.8%Hunley Park Elem 3 2009 36 38.9% 52.8% 8.3% 61.1% 33 39.4% 45.5% 15.2% 60.6%
2010 37 43.2% 32.4% 24.3% 56.8% 35 20.0% 42.9% 37.1% 80.0%4 2009 75 57.3% 38.7% 4.0% 42.7% 75 34.7% 53.3% 12.0% 65.3%
2010 65 50.8% 46.2% 3.1% 49.2% 65 29.2% 50.8% 20.0% 70.8%5 2009 23 52.2% 43.5% 4.3% 47.8% 24 33.3% 37.5% 29.2% 66.7%
2010 31 41.9% 48.4% 9.7% 58.1% 29 48.3% 37.9% 13.8% 51.7%Total 2009 134 51.5% 43.3% 5.2% 48.5% 132 35.6% 48.5% 15.9% 64.4%
2010 133 46.6% 42.9% 10.5% 53.4% 129 31.0% 45.7% 23.3% 69.0%
Fort Johnson Middle
85

School Gr. YearNo.
Tested Not Met Met ExemplaryMet/
ExemplaryNo.
Tested Not Met Met ExemplaryMet/
Exemplary
Science Social StudiesPerformance Levels Performance Levels, %
3 2009 54 29.6% 38.9% 31.5% 70.4% 51 9.8% 29.4% 60.8% 90.2%2010 43 18.6% 34.9% 46.5% 81.4% 42 9.5% 31.0% 59.5% 90.5%
4 2009 105 15.2% 59.0% 25.7% 84.8% 104 13.5% 32.7% 53.8% 86.5%2010 99 22.2% 53.5% 24.2% 77.8% 99 10.1% 35.4% 54.5% 89.9%
5 2009 59 16.9% 54.2% 28.8% 83.1% 60 13.3% 28.3% 58.3% 86.7%2010 56 17.9% 60.7% 21.4% 82.1% 57 7.0% 35.1% 57.9% 93.0%
Total 2009 218 19.3% 52.8% 28.0% 80.7% 215 12.6% 30.7% 56.7% 87.4%2010 198 20.2% 51.5% 28.3% 79.8% 198 9.1% 34.3% 56.6% 90.9%
James Island Elem 3 2009 41 17.1% 56.1% 26.8% 82.9% 41 14.6% 51.2% 34.1% 85.4%2010 40 32.5% 45.0% 22.5% 67.5% 42 11.9% 54.8% 33.3% 88.1%
4 2009 77 50.6% 48.1% 1.3% 49.4% 77 23.4% 61.0% 15.6% 76.6%2010 78 23.1% 69.2% 7.7% 76.9% 78 10.3% 52.6% 37.2% 89.7%
5 2009 41 34.1% 53.7% 12.2% 65.9% 43 48.8% 30.2% 20.9% 51.2%2010 38 57.9% 39.5% 2.6% 42.1% 37 43.2% 35.1% 21.6% 56.8%
Total 2009 159 37.7% 51.6% 10.7% 62.3% 161 28.0% 50.3% 21.7% 72.0%2010 156 34.0% 55.8% 10.3% 66.0% 157 18.5% 49.0% 32.5% 81.5%
6 2009 69 36.2% 53.6% 10.1% 63.8% 71 33.8% 45.1% 21.1% 66.2%2010 53 43.4% 43.4% 13.2% 56.6% 53 22.6% 58.5% 18.9% 77.4%
7 2009 146 24.0% 56.2% 19.9% 76.0% 146 35.6% 37.0% 27.4% 64.4%2010 138 34.1% 44.9% 21.0% 65.9% 138 37.0% 26.1% 37.0% 63.0%
8 2009 75 38.7% 33.3% 28.0% 61.3% 75 41.3% 42.7% 16.0% 58.7%2010 68 39.7% 32.4% 27.9% 60.3% 68 41.2% 39.7% 19.1% 58.8%
Total 2009 290 30.7% 49.7% 19.7% 69.3% 292 36.6% 40.4% 22.9% 63.4%2010 259 37.5% 41.3% 21.2% 62.5% 259 35.1% 36.3% 28.6% 64.9%
3 2009 21 66.7% 33.3% 0.0% 33.3% 21 47.6% 47.6% 4.8% 52.4%2010 15 80.0% 20.0% 0.0% 20.0% 14 7.1% 92.9% 0.0% 92.9%
4 2009 40 57.5% 37.5% 5.0% 42.5% 40 27.5% 55.0% 17.5% 72.5%2010 27 74.1% 25.9% 0.0% 25.9% 27 44.4% 51.9% 3.7% 55.6%
5 2009 18 83.3% 16.7% 0.0% 16.7% 22 86.4% 13.6% 0.0% 13.6%2010 17 52.9% 47.1% 0.0% 47.1% 16 31.3% 68.8% 0.0% 68.8%
6 2009 15 66.7% 33.3% 0.0% 33.3% 15 53.3% 46.7% 0.0% 46.7%2010 10 90.0% 10.0% 0.0% 10.0% 12 50.0% 50.0% 0.0% 50.0%
Total 2009 94 66.0% 31.9% 2.1% 34.0% 98 49.0% 42.9% 8.2% 51.0%2010 69 72.5% 27.5% 0.0% 27.5% 69 34.8% 63.8% 1.4% 65.2%
3 2009 7 42.9% 42.9% 14.3% 57.1% 6 16.7% 66.7% 16.7% 83.3%2010 7 57.1% 42.9% 0.0% 42.9% 7 14.3% 71.4% 14.3% 85.7%
4 2009 11 45.5% 45.5% 9.1% 54.5% 11 54.5% 36.4% 9.1% 45.5%2010 16 43.8% 50.0% 6.3% 56.3% 16 25.0% 56.3% 18.8% 75.0%
5 2009 7 28.6% 71.4% 0.0% 71.4% 6 50.0% 50.0% 0.0% 50.0%2010 6 33.3% 50.0% 16.7% 66.7% 5 60.0% 40.0% 0.0% 40.0%
6 2009 7 71.4% 28.6% 0.0% 28.6% 6 16.7% 66.7% 16.7% 83.3%2010 7 71.4% 28.6% 0.0% 28.6% 7 14.3% 71.4% 14.3% 85.7%
7 2009 11 81.8% 18.2% 0.0% 18.2% 11 63.6% 36.4% 0.0% 36.4%8 2009 5 * * * * 5 * * * *
Total 2009 48 56.3% 37.5% 6.3% 43.8% 45 42.2% 46.7% 11.1% 57.8%2010 36 50.0% 44.4% 5.6% 50.0% 35 25.7% 60.0% 14.3% 74.3%
*Scores not reported for any category in which there are fewer than six students.
James Island Middle
James Simons Elem
Jane Edwards Elem
James B Edwards Elem
86

School Gr. YearNo.
Tested Not Met Met ExemplaryMet/
ExemplaryNo.
Tested Not Met Met ExemplaryMet/
Exemplary
Science Social StudiesPerformance Levels Performance Levels, %
3 2009 59 23.7% 42.4% 33.9% 76.3% 57 7.0% 31.6% 61.4% 93.0%2010 58 19.0% 31.0% 50.0% 81.0% 59 10.2% 37.3% 52.5% 89.8%
4 2009 107 14.0% 51.4% 34.6% 86.0% 107 1.9% 44.9% 53.3% 98.1%2010 103 13.6% 50.5% 35.9% 86.4% 103 2.9% 29.1% 68.0% 97.1%
5 2009 52 9.6% 55.8% 34.6% 90.4% 52 7.7% 46.2% 46.2% 92.3%2010 58 12.1% 48.3% 39.7% 87.9% 55 14.5% 32.7% 52.7% 85.5%
Total 2009 218 15.6% 50.0% 34.4% 84.4% 216 4.6% 41.7% 53.7% 95.4%2010 219 14.6% 44.7% 40.6% 85.4% 217 7.8% 32.3% 59.9% 92.2%
6 2010 63 34.9% 58.7% 6.3% 65.1% 63 12.7% 36.5% 50.8% 87.3%7 2010 149 36.2% 52.3% 11.4% 63.8% 149 49.7% 36.9% 13.4% 50.3%8 2010 65 49.2% 33.8% 16.9% 50.8% 54 40.7% 42.6% 16.7% 59.3%
Total 2010 277 39.0% 49.5% 11.6% 61.0% 266 39.1% 38.0% 22.9% 60.9%Ladson Elem 3 2009 48 58.3% 35.4% 6.3% 41.7% 47 44.7% 44.7% 10.6% 55.3%
2010 41 80.5% 14.6% 4.9% 19.5% 43 48.8% 39.5% 11.6% 51.2%4 2009 86 36.0% 51.2% 12.8% 64.0% 85 14.1% 58.8% 27.1% 85.9%
2010 85 24.7% 61.2% 14.1% 75.3% 85 14.1% 54.1% 31.8% 85.9%5 2009 43 53.5% 41.9% 4.7% 46.5% 43 41.9% 41.9% 16.3% 58.1%
2010 38 50.0% 44.7% 5.3% 50.0% 38 42.1% 55.3% 2.6% 57.9%Total 2009 177 46.3% 44.6% 9.0% 53.7% 175 29.1% 50.9% 20.0% 70.9%
2010 164 44.5% 45.7% 9.8% 55.5% 166 29.5% 50.6% 19.9% 70.5%Laing Middle 6 2009 64 31.3% 39.1% 29.7% 68.8% 59 13.6% 55.9% 30.5% 86.4%
2010 86 31.4% 44.2% 24.4% 68.6% 82 11.0% 48.8% 40.2% 89.0%7 2009 130 13.8% 48.5% 37.7% 86.2% 130 29.2% 36.2% 34.6% 70.8%
2010 126 10.3% 42.1% 47.6% 89.7% 126 20.6% 32.5% 46.8% 79.4%8 2009 78 32.1% 51.3% 16.7% 67.9% 82 28.0% 36.6% 35.4% 72.0%
2010 70 22.9% 18.6% 58.6% 77.1% 68 14.7% 26.5% 58.8% 85.3%Total 2009 272 23.2% 47.1% 29.8% 76.8% 271 25.5% 40.6% 33.9% 74.5%
2010 282 19.9% 36.9% 43.3% 80.1% 276 16.3% 35.9% 47.8% 83.7%Lambs Elem 3 2009 30 66.7% 33.3% 0.0% 33.3% 30 43.3% 40.0% 16.7% 56.7%
2010 29 55.2% 31.0% 13.8% 44.8% 28 32.1% 46.4% 21.4% 67.9%4 2009 59 32.2% 57.6% 10.2% 67.8% 59 18.6% 67.8% 13.6% 81.4%
2010 60 41.7% 48.3% 10.0% 58.3% 60 50.0% 38.3% 11.7% 50.0%5 2009 19 31.6% 57.9% 10.5% 68.4% 20 30.0% 70.0% 0.0% 70.0%
2010 29 51.7% 44.8% 3.4% 48.3% 26 50.0% 19.2% 30.8% 50.0%Toal 2009 108 41.7% 50.9% 7.4% 58.3% 109 27.5% 60.6% 11.9% 72.5%
2010 118 47.5% 43.2% 9.3% 52.5% 114 45.6% 36.0% 18.4% 54.4%
Jerry Zucker Middle
Jennie Moore Elem
87

School Gr. YearNo.
Tested Not Met Met ExemplaryMet/
ExemplaryNo.
Tested Not Met Met ExemplaryMet/
Exemplary
Science Social StudiesPerformance Levels Performance Levels, %
Liberty Hill Academy 3 2009 3 * * * * 3 * * * *2010 3 * * * * 1 * * * *
4 2009 4 * * * * 4 * * * *2010 8 62.5% 37.5% 0.0% 37.5% 8 37.5% 62.5% 0.0% 62.5%
5 2009 4 * * * * 3 * * * *2010 1 * * * * 4 * * * *
6 2009 9 88.9% 11.1% 0.0% 11.1% 9 66.7% 33.3% 0.0% 33.3%2010 2 * * * * 7 100.0% 0.0% 0.0% 0.0%
7 2009 9 100.0% 0.0% 0.0% 0.0% 8 100.0% 0.0% 0.0% 0.0%2010 12 100.0% 0.0% 0.0% 0.0% 12 91.7% 8.3% 0.0% 8.3%
8 2009 5 * * * * 6 83.3% 16.7% 0.0% 16.7%2010 13 92.3% 7.7% 0.0% 7.7% 14 100.0% 0.0% 0.0% 0.0%
Total 2009 60 90.0% 10.0% 0.0% 10.0% 65 78.5% 21.5% 0.0% 21.5%2010 130 90.0% 10.0% 0.0% 10.0% 141 80.9% 19.1% 0.0% 19.1%
Lincoln High 7 2010 23 30.4% 56.5% 13.0% 69.6% 23 34.8% 34.8% 30.4% 65.2%8 2010 10 40.0% 60.0% 0.0% 60.0% 10 40.0% 40.0% 20.0% 60.0%
Total 2010 33 33.3% 57.6% 9.1% 66.7% 33 36.4% 36.4% 27.3% 63.6%3 2009 22 59.1% 31.8% 9.1% 40.9% 20 70.0% 25.0% 5.0% 30.0%
2010 23 95.7% 4.3% 0.0% 4.3% 26 61.5% 34.6% 3.8% 38.5%4 2009 31 74.2% 25.8% 0.0% 25.8% 31 54.8% 41.9% 3.2% 45.2%
2010 45 71.1% 26.7% 2.2% 28.9% 45 53.3% 46.7% 0.0% 46.7%5 2009 16 43.8% 56.3% 0.0% 56.3% 15 40.0% 53.3% 6.7% 60.0%
2010 18 61.1% 38.9% 0.0% 38.9% 16 68.8% 31.3% 0.0% 31.3%Total 2009 69 62.3% 34.8% 2.9% 37.7% 66 56.1% 39.4% 4.5% 43.9%
2010 86 75.6% 23.3% 1.2% 24.4% 87 58.6% 40.2% 1.1% 41.4%3 2009 55 20.0% 41.8% 38.2% 80.0% 56 7.1% 25.0% 67.9% 92.9%
2010 44 27.3% 38.6% 34.1% 72.7% 46 4.3% 21.7% 73.9% 95.7%4 2009 91 16.5% 54.9% 28.6% 83.5% 91 11.0% 39.6% 49.5% 89.0%
2010 117 17.1% 64.1% 18.8% 82.9% 117 7.7% 35.0% 57.3% 92.3%5 2009 48 20.8% 64.6% 14.6% 79.2% 49 10.2% 24.5% 65.3% 89.8%
2010 49 18.4% 49.0% 32.7% 81.6% 49 16.3% 36.7% 46.9% 83.7%Total 2009 194 18.6% 53.6% 27.8% 81.4% 196 9.7% 31.6% 58.7% 90.3%
2010 210 19.5% 55.2% 25.2% 80.5% 212 9.0% 32.5% 58.5% 91.0%Mary Ford Elem 3 2009 26 61.5% 38.5% 0.0% 38.5% 24 37.5% 54.2% 8.3% 62.5%
2010 38 84.2% 13.2% 2.6% 15.8% 34 58.8% 38.2% 2.9% 41.2%4 2009 49 69.4% 28.6% 2.0% 30.6% 49 46.9% 46.9% 6.1% 53.1%
2010 43 65.1% 32.6% 2.3% 34.9% 43 27.9% 53.5% 18.6% 72.1%5 2009 22 59.1% 40.9% 0.0% 40.9% 21 66.7% 28.6% 4.8% 33.3%
2010 21 61.9% 38.1% 0.0% 38.1% 20 75.0% 20.0% 5.0% 25.0%Total 2009 97 64.9% 34.0% 1.0% 35.1% 94 48.9% 44.7% 6.4% 51.1%
2010 102 71.6% 26.5% 2.0% 28.4% 97 48.5% 41.2% 10.3% 51.5%3 2009 21 42.9% 57.1% 0.0% 57.1% 21 33.3% 47.6% 19.0% 66.7%
2010 26 73.1% 26.9% 0.0% 26.9% 23 56.5% 39.1% 4.3% 43.5%Total 2009 21 42.9% 57.1% 0.0% 57.1% 21 33.3% 47.6% 19.0% 66.7%
2010 26 73.1% 26.9% 0.0% 26.9% 23 56.5% 39.1% 4.3% 43.5%*Scores not reported for any category in which there are fewer than six students.
Malcolm C Hursey Elem
Mamie Whitesides Elem
Matilda Dunston Elem
88

School Gr. YearNo.
Tested Not Met Met ExemplaryMet/
ExemplaryNo.
Tested Not Met Met ExemplaryMet/
Exemplary
Science Social StudiesPerformance Levels Performance Levels, %
McClellanville Middle 6 2009 12 50.0% 41.7% 8.3% 50.0% 12 8.3% 83.3% 8.3% 91.7%7 2009 28 32.1% 57.1% 10.7% 67.9% 28 75.0% 21.4% 3.6% 25.0%8 2009 14 71.4% 21.4% 7.1% 28.6% 14 42.9% 42.9% 14.3% 57.1%
Total 2009 54 46.3% 44.4% 9.3% 53.7% 54 51.9% 40.7% 7.4% 48.1%Memminger Elem 3 2009 19 47.4% 47.4% 5.3% 52.6% 19 21.1% 52.6% 26.3% 78.9%
2010 26 76.9% 15.4% 7.7% 23.1% 27 44.4% 44.4% 11.1% 55.6%4 2009 31 61.3% 38.7% 0.0% 38.7% 31 25.8% 67.7% 6.5% 74.2%
2010 41 61.0% 39.0% 0.0% 39.0% 41 22.0% 68.3% 9.8% 78.0%5 2009 15 53.3% 40.0% 6.7% 46.7% 15 26.7% 60.0% 13.3% 73.3%
2010 18 72.2% 27.8% 0.0% 27.8% 16 50.0% 43.8% 6.3% 50.0%6 2009 14 78.6% 21.4% 0.0% 21.4% 12 50.0% 50.0% 0.0% 50.0%
2010 18 61.1% 38.9% 0.0% 38.9% 15 20.0% 80.0% 0.0% 80.0%Total 2009 79 59.5% 38.0% 2.5% 40.5% 77 28.6% 59.7% 11.7% 71.4%
2010 103 67.0% 31.1% 1.9% 33.0% 99 32.3% 59.6% 8.1% 67.7%Midland Park Elem 3 2009 52 61.5% 32.7% 5.8% 38.5% 48 35.4% 45.8% 18.8% 64.6%
2010 54 59.3% 29.6% 11.1% 40.7% 57 50.9% 29.8% 19.3% 49.1%4 2009 94 60.6% 35.1% 4.3% 39.4% 93 44.1% 46.2% 9.7% 55.9%
2010 95 48.4% 48.4% 3.2% 51.6% 95 41.1% 47.4% 11.6% 58.9%5 2009 49 51.0% 44.9% 4.1% 49.0% 51 54.9% 39.2% 5.9% 45.1%
2010 46 69.6% 28.3% 2.2% 30.4% 50 78.0% 22.0% 0.0% 22.0%Total 2009 195 58.5% 36.9% 4.6% 41.5% 192 44.8% 44.3% 10.9% 55.2%
2010 195 56.4% 38.5% 5.1% 43.6% 202 53.0% 36.1% 10.9% 47.0%6 2009 49 38.8% 57.1% 4.1% 61.2% 50 10.0% 72.0% 18.0% 90.0%
2010 40 50.0% 47.5% 2.5% 50.0% 40 10.0% 55.0% 35.0% 90.0%7 2009 64 46.9% 46.9% 6.3% 53.1% 63 38.1% 36.5% 25.4% 61.9%
2010 100 32.0% 65.0% 3.0% 68.0% 100 28.0% 46.0% 26.0% 72.0%8 2009 41 41.5% 53.7% 4.9% 58.5% 42 31.0% 59.5% 9.5% 69.0%
2010 30 40.0% 43.3% 16.7% 60.0% 31 22.6% 58.1% 19.4% 77.4%Total 2009 154 42.9% 51.9% 5.2% 57.1% 155 27.1% 54.2% 18.7% 72.9%
2010 170 37.6% 57.1% 5.3% 62.4% 171 22.8% 50.3% 26.9% 77.2%Minnie Hughes Elem 3 2009 14 35.7% 35.7% 28.6% 64.3% 14 21.4% 42.9% 35.7% 78.6%
2010 12 33.3% 33.3% 33.3% 66.7% 13 23.1% 7.7% 69.2% 76.9%4 2009 20 45.0% 50.0% 5.0% 55.0% 20 25.0% 70.0% 5.0% 75.0%
2010 28 28.6% 67.9% 3.6% 71.4% 28 21.4% 67.9% 10.7% 78.6%5 2009 13 30.8% 69.2% 0.0% 69.2% 14 28.6% 42.9% 28.6% 71.4%
2010 10 20.0% 70.0% 10.0% 80.0% 9 44.4% 55.6% 0.0% 55.6%6 2010 12 66.7% 33.3% 0.0% 33.3% 11 54.5% 45.5% 0.0% 45.5%
Total 2009 47 38.3% 51.1% 10.6% 61.7% 48 25.0% 54.2% 20.8% 75.0%2010 62 35.5% 54.8% 9.7% 64.5% 61 31.1% 49.2% 19.7% 68.9%
Military Magnet Academy
89

School Gr. YearNo.
Tested Not Met Met ExemplaryMet/
ExemplaryNo.
Tested Not Met Met ExemplaryMet/
Exemplary
Science Social StudiesPerformance Levels Performance Levels, %
Mitchell Elem 3 2009 22 54.5% 40.9% 4.5% 45.5% 24 41.7% 45.8% 12.5% 58.3%2010 25 56.0% 32.0% 12.0% 44.0% 24 16.7% 58.3% 25.0% 83.3%
4 2009 37 62.2% 35.1% 2.7% 37.8% 37 32.4% 43.2% 24.3% 67.6%2010 45 60.0% 40.0% 0.0% 40.0% 45 37.8% 53.3% 8.9% 62.2%
5 2009 15 60.0% 40.0% 0.0% 40.0% 14 42.9% 42.9% 14.3% 57.1%2010 22 72.7% 22.7% 4.5% 27.3% 24 50.0% 29.2% 20.8% 50.0%
6 2009 20 65.0% 35.0% 0.0% 35.0% 19 21.1% 78.9% 0.0% 78.9%2010 19 78.9% 21.1% 0.0% 21.1% 20 30.0% 65.0% 5.0% 70.0%
Total 2009 94 60.6% 37.2% 2.1% 39.4% 94 34.0% 51.1% 14.9% 66.0%2010 111 64.9% 31.5% 3.6% 35.1% 113 34.5% 51.3% 14.2% 65.5%
3 2009 5 * * * * 6 16.7% 16.7% 66.7% 83.3%2010 7 28.6% 42.9% 28.6% 71.4% 7 14.3% 28.6% 57.1% 85.7%
4 2009 16 6.3% 62.5% 31.3% 93.8% 16 0.0% 56.3% 43.8% 100.0%2010 16 12.5% 43.8% 43.8% 87.5% 16 12.5% 56.3% 31.3% 87.5%
5 2009 9 0.0% 66.7% 33.3% 100.0% 8 12.5% 62.5% 25.0% 87.5%2010 9 0.0% 77.8% 22.2% 100.0% 8 12.5% 62.5% 25.0% 87.5%
6 2009 3 * * * * 4 * * * *2010 5 * * * * 5 * * * *
Total 2009 33 6.1% 60.6% 33.3% 93.9% 34 5.9% 55.9% 38.2% 94.1%2010 37 10.8% 51.4% 37.8% 89.2% 36 16.7% 50.0% 33.3% 83.3%
6 2010 22 68.2% 31.8% 0.0% 31.8% 20 40.0% 50.0% 10.0% 60.0%7 2010 60 61.7% 35.0% 3.3% 38.3% 60 71.7% 18.3% 10.0% 28.3%8 2010 49 63.3% 26.5% 4.1% 30.6% 44 61.4% 25.0% 4.5% 29.5%
Total 2010 131 63.4% 31.3% 3.1% 34.4% 124 62.9% 25.8% 8.1% 33.9%6 2010 26 57.7% 42.3% 0.0% 42.3% 26 46.2% 46.2% 7.7% 53.8%7 2010 64 42.2% 54.7% 3.1% 57.8% 64 65.6% 29.7% 4.7% 34.4%8 2010 32 53.1% 43.8% 12.5% 56.3% 26 61.5% 46.2% 7.7% 53.8%
Total 2010 122 48.4% 49.2% 4.9% 54.1% 116 60.3% 37.1% 6.0% 43.1%Morningside Middle 6 2009 61 67.2% 31.1% 1.6% 32.8% 59 33.9% 55.9% 10.2% 66.1%
7 2009 130 46.2% 50.8% 3.1% 53.8% 130 38.5% 34.6% 26.9% 61.5%8 2009 62 67.7% 32.3% 0.0% 32.3% 63 60.3% 31.7% 7.9% 39.7%
Total 2009 253 56.5% 41.5% 2.0% 43.5% 252 42.9% 38.9% 18.3% 57.1%Moultrie Middle 6 2009 145 11.0% 60.7% 28.3% 89.0% 143 7.7% 57.3% 35.0% 92.3%
2010 141 16.3% 46.8% 36.9% 83.7% 147 9.5% 42.9% 47.6% 90.5%7 2009 236 9.3% 39.4% 51.3% 90.7% 236 15.7% 25.8% 58.5% 84.3%
2010 304 7.2% 40.8% 52.0% 92.8% 304 13.5% 28.0% 58.6% 86.5%8 2009 131 13.0% 32.1% 55.0% 87.0% 129 8.5% 34.9% 56.6% 91.5%
2010 123 10.6% 32.5% 56.9% 89.4% 122 12.3% 27.9% 59.8% 87.7%Total 2009 512 10.7% 43.6% 45.7% 89.3% 508 11.6% 37.0% 51.4% 88.4%
2010 568 10.2% 40.5% 49.3% 89.8% 573 12.2% 31.8% 56.0% 87.8%Mt Pleasant Academy 3 2009 35 5.7% 40.0% 54.3% 94.3% 35 5.7% 25.7% 68.6% 94.3%
2010 39 17.9% 41.0% 41.0% 82.1% 38 7.9% 18.4% 73.7% 92.1%4 2009 78 1.3% 38.5% 60.3% 98.7% 78 2.6% 38.5% 59.0% 97.4%
2010 73 5.5% 41.1% 53.4% 94.5% 73 4.1% 24.7% 71.2% 95.9%5 2009 30 13.3% 53.3% 33.3% 86.7% 31 6.5% 25.8% 67.7% 93.5%
2010 38 5.3% 57.9% 36.8% 94.7% 41 14.6% 24.4% 61.0% 85.4%Total 2009 143 4.9% 42.0% 53.1% 95.1% 144 4.2% 32.6% 63.2% 95.8%
2010 150 8.7% 45.3% 46.0% 91.3% 152 7.9% 23.0% 69.1% 92.1%*Scores not reported for any category in which there are fewer than six students.
Morningside Middle EXCEL
Morningside Middle ARMS
Montessori Community School
90
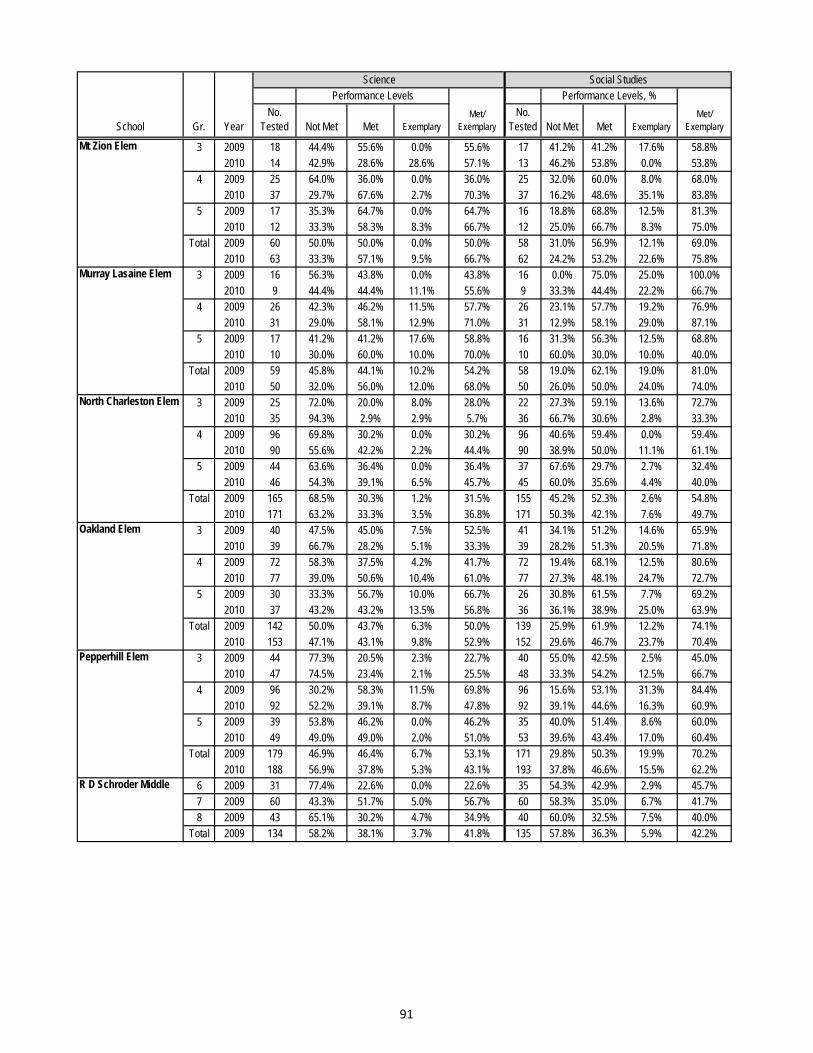
School Gr. YearNo.
Tested Not Met Met ExemplaryMet/
ExemplaryNo.
Tested Not Met Met ExemplaryMet/
Exemplary
Science Social StudiesPerformance Levels Performance Levels, %
Mt Zion Elem 3 2009 18 44.4% 55.6% 0.0% 55.6% 17 41.2% 41.2% 17.6% 58.8%2010 14 42.9% 28.6% 28.6% 57.1% 13 46.2% 53.8% 0.0% 53.8%
4 2009 25 64.0% 36.0% 0.0% 36.0% 25 32.0% 60.0% 8.0% 68.0%2010 37 29.7% 67.6% 2.7% 70.3% 37 16.2% 48.6% 35.1% 83.8%
5 2009 17 35.3% 64.7% 0.0% 64.7% 16 18.8% 68.8% 12.5% 81.3%2010 12 33.3% 58.3% 8.3% 66.7% 12 25.0% 66.7% 8.3% 75.0%
Total 2009 60 50.0% 50.0% 0.0% 50.0% 58 31.0% 56.9% 12.1% 69.0%2010 63 33.3% 57.1% 9.5% 66.7% 62 24.2% 53.2% 22.6% 75.8%
Murray Lasaine Elem 3 2009 16 56.3% 43.8% 0.0% 43.8% 16 0.0% 75.0% 25.0% 100.0%2010 9 44.4% 44.4% 11.1% 55.6% 9 33.3% 44.4% 22.2% 66.7%
4 2009 26 42.3% 46.2% 11.5% 57.7% 26 23.1% 57.7% 19.2% 76.9%2010 31 29.0% 58.1% 12.9% 71.0% 31 12.9% 58.1% 29.0% 87.1%
5 2009 17 41.2% 41.2% 17.6% 58.8% 16 31.3% 56.3% 12.5% 68.8%2010 10 30.0% 60.0% 10.0% 70.0% 10 60.0% 30.0% 10.0% 40.0%
Total 2009 59 45.8% 44.1% 10.2% 54.2% 58 19.0% 62.1% 19.0% 81.0%2010 50 32.0% 56.0% 12.0% 68.0% 50 26.0% 50.0% 24.0% 74.0%
North Charleston Elem 3 2009 25 72.0% 20.0% 8.0% 28.0% 22 27.3% 59.1% 13.6% 72.7%2010 35 94.3% 2.9% 2.9% 5.7% 36 66.7% 30.6% 2.8% 33.3%
4 2009 96 69.8% 30.2% 0.0% 30.2% 96 40.6% 59.4% 0.0% 59.4%2010 90 55.6% 42.2% 2.2% 44.4% 90 38.9% 50.0% 11.1% 61.1%
5 2009 44 63.6% 36.4% 0.0% 36.4% 37 67.6% 29.7% 2.7% 32.4%2010 46 54.3% 39.1% 6.5% 45.7% 45 60.0% 35.6% 4.4% 40.0%
Total 2009 165 68.5% 30.3% 1.2% 31.5% 155 45.2% 52.3% 2.6% 54.8%2010 171 63.2% 33.3% 3.5% 36.8% 171 50.3% 42.1% 7.6% 49.7%
Oakland Elem 3 2009 40 47.5% 45.0% 7.5% 52.5% 41 34.1% 51.2% 14.6% 65.9%2010 39 66.7% 28.2% 5.1% 33.3% 39 28.2% 51.3% 20.5% 71.8%
4 2009 72 58.3% 37.5% 4.2% 41.7% 72 19.4% 68.1% 12.5% 80.6%2010 77 39.0% 50.6% 10.4% 61.0% 77 27.3% 48.1% 24.7% 72.7%
5 2009 30 33.3% 56.7% 10.0% 66.7% 26 30.8% 61.5% 7.7% 69.2%2010 37 43.2% 43.2% 13.5% 56.8% 36 36.1% 38.9% 25.0% 63.9%
Total 2009 142 50.0% 43.7% 6.3% 50.0% 139 25.9% 61.9% 12.2% 74.1%2010 153 47.1% 43.1% 9.8% 52.9% 152 29.6% 46.7% 23.7% 70.4%
Pepperhill Elem 3 2009 44 77.3% 20.5% 2.3% 22.7% 40 55.0% 42.5% 2.5% 45.0%2010 47 74.5% 23.4% 2.1% 25.5% 48 33.3% 54.2% 12.5% 66.7%
4 2009 96 30.2% 58.3% 11.5% 69.8% 96 15.6% 53.1% 31.3% 84.4%2010 92 52.2% 39.1% 8.7% 47.8% 92 39.1% 44.6% 16.3% 60.9%
5 2009 39 53.8% 46.2% 0.0% 46.2% 35 40.0% 51.4% 8.6% 60.0%2010 49 49.0% 49.0% 2.0% 51.0% 53 39.6% 43.4% 17.0% 60.4%
Total 2009 179 46.9% 46.4% 6.7% 53.1% 171 29.8% 50.3% 19.9% 70.2%2010 188 56.9% 37.8% 5.3% 43.1% 193 37.8% 46.6% 15.5% 62.2%
R D Schroder Middle 6 2009 31 77.4% 22.6% 0.0% 22.6% 35 54.3% 42.9% 2.9% 45.7%7 2009 60 43.3% 51.7% 5.0% 56.7% 60 58.3% 35.0% 6.7% 41.7%8 2009 43 65.1% 30.2% 4.7% 34.9% 40 60.0% 32.5% 7.5% 40.0%
Total 2009 134 58.2% 38.1% 3.7% 41.8% 135 57.8% 36.3% 5.9% 42.2%
91

School Gr. YearNo.
Tested Not Met Met ExemplaryMet/
ExemplaryNo.
Tested Not Met Met ExemplaryMet/
Exemplary
Science Social StudiesPerformance Levels Performance Levels, %
Sanders-Clyde Elem 3 2009 16 87.5% 12.5% 0.0% 12.5% 15 33.3% 60.0% 6.7% 66.7%2010 26 84.6% 15.4% 0.0% 15.4% 24 66.7% 29.2% 4.2% 33.3%
4 2009 46 71.7% 28.3% 0.0% 28.3% 46 30.4% 65.2% 4.3% 69.6%2010 39 66.7% 30.8% 2.6% 33.3% 39 30.8% 59.0% 10.3% 69.2%
5 2009 17 64.7% 35.3% 0.0% 35.3% 18 50.0% 44.4% 5.6% 50.0%2010 22 68.2% 31.8% 0.0% 31.8% 20 50.0% 45.0% 5.0% 50.0%
6 2009 11 72.7% 27.3% 0.0% 27.3% 9 0.0% 77.8% 22.2% 100.0%2010 17 82.4% 17.6% 0.0% 17.6% 16 62.5% 31.3% 6.3% 37.5%
7 2009 21 76.2% 23.8% 0.0% 23.8% 21 33.3% 47.6% 19.0% 66.7%2010 27 66.7% 33.3% 0.0% 33.3% 27 63.0% 25.9% 11.1% 37.0%
8 2009 9 66.7% 33.3% 0.0% 33.3% 10 20.0% 60.0% 20.0% 80.0%2010 9 66.7% 33.3% 0.0% 33.3% 7 42.9% 57.1% 0.0% 57.1%
Total 2009 120 73.3% 26.7% 0.0% 26.7% 119 31.1% 58.8% 10.1% 68.9%2010 140 72.1% 27.1% 0.7% 27.9% 133 51.1% 41.4% 7.5% 48.9%
Sixth Grade Academy 6 2010 61 88.5% 11.5% 0.0% 11.5% 67 49.3% 46.3% 4.5% 50.7%at McNair Total 2010 61 88.5% 11.5% 0.0% 11.5% 67 49.3% 46.3% 4.5% 50.7%Springfield Elem 3 2009 37 37.8% 56.8% 5.4% 62.2% 38 15.8% 34.2% 50.0% 84.2%
2010 40 45.0% 35.0% 20.0% 55.0% 39 28.2% 33.3% 38.5% 71.8%4 2009 69 20.3% 55.1% 24.6% 79.7% 69 7.2% 49.3% 43.5% 92.8%
2010 83 31.3% 54.2% 14.5% 68.7% 83 19.3% 34.9% 45.8% 80.7%5 2009 34 29.4% 61.8% 8.8% 70.6% 37 24.3% 45.9% 29.7% 75.7%
2010 40 37.5% 52.5% 10.0% 62.5% 38 36.8% 28.9% 34.2% 63.2%Total 2009 140 27.1% 57.1% 15.7% 72.9% 144 13.9% 44.4% 41.7% 86.1%
2010 163 36.2% 49.1% 14.7% 63.8% 160 25.6% 33.1% 41.3% 74.4%3 2009 60 13.3% 50.0% 36.7% 86.7% 58 10.3% 36.2% 53.4% 89.7%
2010 58 22.4% 32.8% 44.8% 77.6% 59 10.2% 37.3% 52.5% 89.8%4 2009 123 18.7% 47.2% 34.1% 81.3% 123 5.7% 52.8% 41.5% 94.3%
2010 124 24.2% 51.6% 24.2% 75.8% 124 13.7% 46.8% 39.5% 86.3%5 2009 63 19.0% 49.2% 31.7% 81.0% 64 17.2% 45.3% 37.5% 82.8%
2010 60 21.7% 48.3% 30.0% 78.3% 63 15.9% 47.6% 36.5% 84.1%Total 2009 246 17.5% 48.4% 34.1% 82.5% 245 9.8% 46.9% 43.3% 90.2%
2010 242 23.1% 46.3% 30.6% 76.9% 246 13.4% 44.7% 41.9% 86.6%St James-Santee Elem 3 2009 17 70.6% 23.5% 5.9% 29.4% 18 50.0% 38.9% 11.1% 50.0%
2010 9 88.9% 11.1% 0.0% 11.1% 8 25.0% 37.5% 37.5% 75.0%4 2009 16 50.0% 43.8% 6.3% 50.0% 16 12.5% 43.8% 43.8% 87.5%
2010 29 55.2% 44.8% 0.0% 44.8% 29 34.5% 48.3% 17.2% 65.5%5 2009 12 50.0% 41.7% 8.3% 50.0% 12 66.7% 33.3% 0.0% 33.3%
2010 9 66.7% 33.3% 0.0% 33.3% 9 22.2% 66.7% 11.1% 77.8%6 2010 13 84.6% 15.4% 0.0% 15.4% 11 72.7% 27.3% 0.0% 27.3%
Total 2009 45 57.8% 35.6% 6.7% 42.2% 46 41.3% 39.1% 19.6% 58.7%2010 60 68.3% 31.7% 0.0% 31.7% 57 38.6% 45.6% 15.8% 61.4%
St Andrews Math And Science
92

School Gr. YearNo.
Tested Not Met Met ExemplaryMet/
ExemplaryNo.
Tested Not Met Met ExemplaryMet/
Exemplary
Science Social StudiesPerformance Levels Performance Levels, %
St. Andrews Middle 6 2009 72 38.9% 56.9% 4.2% 61.1% 76 17.1% 69.7% 13.2% 82.9%2010 93 25.8% 57.0% 17.2% 74.2% 90 5.6% 50.0% 44.4% 94.4%
7 2009 131 45.8% 45.0% 9.2% 54.2% 131 38.2% 39.7% 22.1% 61.8%2010 161 39.1% 50.9% 9.9% 60.9% 160 40.6% 39.4% 20.0% 59.4%
8 2009 76 43.4% 47.4% 9.2% 56.6% 75 41.3% 52.0% 6.7% 58.7%2010 71 49.3% 40.8% 9.9% 50.7% 68 38.2% 41.2% 20.6% 61.8%
Total 2009 279 43.4% 48.7% 7.9% 56.6% 282 33.3% 51.1% 15.6% 66.7%2010 325 37.5% 50.5% 12.0% 62.5% 318 30.2% 42.8% 27.0% 69.8%
Stiles Point Elem 3 2009 58 12.1% 39.7% 48.3% 87.9% 56 5.4% 23.2% 71.4% 94.6%2010 52 17.3% 40.4% 42.3% 82.7% 51 11.8% 25.5% 62.7% 88.2%
4 2009 103 6.8% 53.4% 39.8% 93.2% 103 5.8% 42.7% 51.5% 94.2%2010 115 9.6% 55.7% 34.8% 90.4% 115 4.3% 39.1% 56.5% 95.7%
5 2009 44 20.5% 63.6% 15.9% 79.5% 44 11.4% 34.1% 54.5% 88.6%2010 52 7.7% 50.0% 42.3% 92.3% 52 15.4% 28.8% 55.8% 84.6%
Total 2009 205 11.2% 51.7% 37.1% 88.8% 203 6.9% 35.5% 57.6% 93.1%2010 219 11.0% 50.7% 38.4% 89.0% 218 8.7% 33.5% 57.8% 91.3%
Stono Park Elem 3 2009 26 38.5% 53.8% 7.7% 61.5% 27 29.6% 37.0% 33.3% 70.4%2010 24 20.8% 62.5% 16.7% 79.2% 26 11.5% 46.2% 42.3% 88.5%
4 2009 48 35.4% 56.3% 8.3% 64.6% 48 12.5% 60.4% 27.1% 87.5%2010 49 26.5% 65.3% 8.2% 73.5% 49 20.4% 55.1% 24.5% 79.6%
5 2009 25 28.0% 52.0% 20.0% 72.0% 24 33.3% 37.5% 29.2% 66.7%2010 24 58.3% 33.3% 8.3% 41.7% 22 31.8% 45.5% 22.7% 68.2%
Total 2009 99 34.3% 54.5% 11.1% 65.7% 99 22.2% 48.5% 29.3% 77.8%2010 97 33.0% 56.7% 10.3% 67.0% 97 20.6% 50.5% 28.9% 79.4%
Sullivans Island Elem 3 2009 22 13.6% 59.1% 27.3% 86.4% 22 4.5% 22.7% 72.7% 95.5%2010 37 13.5% 37.8% 48.6% 86.5% 37 2.7% 27.0% 70.3% 97.3%
4 2009 49 2.0% 55.1% 42.9% 98.0% 49 0.0% 14.3% 85.7% 100.0%2010 49 12.2% 57.1% 30.6% 87.8% 49 8.2% 44.9% 46.9% 91.8%
5 2009 30 3.3% 40.0% 56.7% 96.7% 31 0.0% 19.4% 80.6% 100.0%2010 28 10.7% 35.7% 53.6% 89.3% 28 7.1% 21.4% 71.4% 92.9%
Total 2009 101 5.0% 51.5% 43.6% 95.0% 102 1.0% 17.6% 81.4% 99.0%2010 114 12.3% 45.6% 42.1% 87.7% 114 6.1% 33.3% 60.5% 93.9%
Thomas C. Cario 6 2009 192 12.0% 55.7% 32.3% 88.0% 190 5.3% 41.1% 53.7% 94.7%Middle 2010 204 13.2% 52.0% 34.8% 86.8% 205 5.4% 30.2% 64.4% 94.6%
7 2009 436 10.6% 47.9% 41.5% 89.4% 435 19.5% 31.5% 49.0% 80.5%2010 397 8.3% 36.0% 55.7% 91.7% 397 20.7% 28.7% 50.6% 79.3%
8 2009 195 10.3% 24.1% 65.6% 89.7% 196 9.2% 37.2% 53.6% 90.8%2010 221 9.5% 24.4% 66.1% 90.5% 228 11.4% 19.3% 69.3% 88.6%
Total 2009 823 10.8% 44.1% 45.1% 89.2% 821 13.8% 35.1% 51.2% 86.2%2010 822 9.9% 36.9% 53.3% 90.1% 830 14.3% 26.5% 59.2% 85.7%
W B Goodwin Elem 3 2009 49 38.8% 51.0% 10.2% 61.2% 47 25.5% 48.9% 25.5% 74.5%2010 38 68.4% 26.3% 5.3% 31.6% 39 41.0% 43.6% 15.4% 59.0%
4 2009 71 45.1% 50.7% 4.2% 54.9% 70 22.9% 55.7% 21.4% 77.1%2010 93 44.1% 48.4% 7.5% 55.9% 93 26.9% 54.8% 18.3% 73.1%
5 2009 34 32.4% 67.6% 0.0% 67.6% 35 25.7% 51.4% 22.9% 74.3%2010 30 50.0% 36.7% 13.3% 50.0% 30 50.0% 36.7% 13.3% 50.0%
Total 2009 154 40.3% 54.5% 5.2% 59.7% 152 24.3% 52.6% 23.0% 75.7%2010 161 50.9% 41.0% 8.1% 49.1% 162 34.6% 48.8% 16.7% 65.4%
93

School Gr. YearNo.
Tested Not Met Met ExemplaryMet/
ExemplaryNo.
Tested Not Met Met ExemplaryMet/
Exemplary
Science Social StudiesPerformance Levels Performance Levels, %
West Ashley Middle 6 2009 63 46.0% 50.8% 3.2% 54.0% 56 26.8% 64.3% 8.9% 73.2%2010 55 50.9% 43.6% 5.5% 49.1% 55 23.6% 60.0% 16.4% 76.4%
7 2009 104 41.3% 49.0% 9.6% 58.7% 103 41.7% 31.1% 27.2% 58.3%2010 104 44.2% 48.1% 7.7% 55.8% 104 57.7% 26.0% 16.3% 42.3%
8 2009 73 57.5% 32.9% 9.6% 42.5% 74 36.5% 45.9% 17.6% 63.5%2010 69 46.4% 37.7% 15.9% 53.6% 72 31.9% 37.5% 30.6% 68.1%
Total 2009 240 47.5% 44.6% 7.9% 52.5% 233 36.5% 43.8% 19.7% 63.5%2010 228 46.5% 43.9% 9.6% 53.5% 231 41.6% 37.7% 20.8% 58.4%
CHARTER SCHOOLS6 2009 22 18.2% 63.6% 18.2% 81.8% 21 19.0% 66.7% 14.3% 81.0%
2010 19 42.1% 47.4% 10.5% 57.9% 19 15.8% 36.8% 47.4% 84.2%7 2009 38 15.8% 71.1% 13.2% 84.2% 38 26.3% 39.5% 34.2% 73.7%
2010 66 25.8% 40.9% 33.3% 74.2% 66 40.9% 34.8% 24.2% 59.1%8 2009 21 28.6% 38.1% 33.3% 71.4% 21 4.8% 42.9% 52.4% 95.2%
2010 31 29.0% 41.9% 29.0% 71.0% 30 33.3% 53.3% 13.3% 66.7%Total 2009 81 19.8% 60.5% 19.8% 80.2% 80 18.8% 47.5% 33.8% 81.3%
2010 116 29.3% 42.2% 28.4% 70.7% 115 34.8% 40.0% 25.2% 65.2%3 2009 11 36.4% 36.4% 27.3% 63.6% 10 10.0% 60.0% 30.0% 90.0%
2010 12 58.3% 33.3% 8.3% 41.7% 10 20.0% 50.0% 30.0% 80.0%4 2009 18 5.6% 72.2% 22.2% 94.4% 18 38.9% 27.8% 33.3% 61.1%
2010 20 55.0% 40.0% 5.0% 45.0% 20 35.0% 65.0% 0.0% 65.0%5 2009 7 28.6% 57.1% 14.3% 71.4% 7 42.9% 42.9% 14.3% 57.1%
2010 10 40.0% 60.0% 0.0% 60.0% 8 37.5% 62.5% 0.0% 62.5%6 2009 4 * * * * 4 * * * *
2010 6 50.0% 50.0% 0.0% 50.0% 6 33.3% 66.7% 0.0% 66.7%7 2010 10 50.0% 40.0% 10.0% 50.0% 10 40.0% 60.0% 0.0% 60.0%
Total 2009 40 22.5% 57.5% 20.0% 77.5% 39 28.2% 46.2% 25.6% 71.8%2010 58 51.7% 43.1% 5.2% 48.3% 54 33.3% 61.1% 5.6% 66.7%
3 2009 15 0.0% 46.7% 53.3% 100.0% 14 0.0% 50.0% 50.0% 100.0%2010 16 31.3% 31.3% 37.5% 68.8% 16 25.0% 25.0% 50.0% 75.0%
4 2009 26 19.2% 57.7% 23.1% 80.8% 26 15.4% 46.2% 38.5% 84.6%2010 29 10.3% 72.4% 17.2% 89.7% 29 10.3% 58.6% 31.0% 89.7%
5 2009 12 41.7% 41.7% 16.7% 58.3% 11 18.2% 72.7% 9.1% 81.8%2010 13 23.1% 53.8% 23.1% 76.9% 13 15.4% 30.8% 53.8% 84.6%
6 2009 8 25.0% 75.0% 0.0% 75.0% 8 0.0% 62.5% 37.5% 100.0%2010 7 0.0% 100.0% 0.0% 100.0% 8 25.0% 50.0% 25.0% 75.0%
7 2009 8 12.5% 37.5% 50.0% 87.5% 8 12.5% 12.5% 75.0% 87.5%2010 14 7.1% 57.1% 35.7% 92.9% 14 21.4% 57.1% 21.4% 78.6%
8 2009 6 16.7% 16.7% 66.7% 83.3% 6 16.7% 66.7% 16.7% 83.3%2010 2 * * * * 3 * * * *
Total 2009 75 18.7% 49.3% 32.0% 81.3% 73 11.0% 50.7% 38.4% 89.0%2010 81 14.8% 60.5% 24.7% 85.2% 83 16.9% 44.6% 38.6% 83.1%
8 2010 1 * * * * 2 * * * *Total 2010 1 * * * * 2 * * * *
*Scores not reported for any category in which there are fewer than six students.
East Cooper Montessori Charter
Greg Mathis Charter High
Charleston Charter Math/Science
Charleston Develop. Charter
94

School Gr. YearNo.
Tested Not Met Met ExemplaryMet/
ExemplaryNo.
Tested Not Met Met ExemplaryMet/
Exemplary
Science Social StudiesPerformance Levels Performance Levels, %
Orange Grove Charter 3 2009 49 22.4% 36.7% 40.8% 77.6% 50 8.0% 60.0% 32.0% 92.0%2010 58 36.2% 29.3% 34.5% 63.8% 61 11.5% 37.7% 50.8% 88.5%
4 2009 105 22.9% 66.7% 10.5% 77.1% 105 11.4% 44.8% 43.8% 88.6%2010 106 13.2% 63.2% 23.6% 86.8% 106 7.5% 39.6% 52.8% 92.5%
5 2009 56 14.3% 71.4% 14.3% 85.7% 57 19.3% 38.6% 42.1% 80.7%2010 50 24.0% 64.0% 12.0% 76.0% 51 19.6% 29.4% 51.0% 80.4%
Total 2009 210 20.5% 61.0% 18.6% 79.5% 212 12.7% 46.7% 40.6% 87.3%2010 214 22.0% 54.2% 23.8% 78.0% 218 11.5% 36.7% 51.8% 88.5%
Susan G. Boykin 3 2009 13 84.6% 15.4% 0.0% 15.4% 14 78.6% 21.4% 0.0% 21.4%Charter 2010 10 90.0% 10.0% 0.0% 10.0% 8 50.0% 50.0% 0.0% 50.0%
4 2009 15 86.7% 13.3% 0.0% 13.3% 15 86.7% 13.3% 0.0% 13.3%2010 22 100.0% 0.0% 0.0% 0.0% 22 86.4% 13.6% 0.0% 13.6%
5 2009 12 75.0% 25.0% 0.0% 25.0% 11 72.7% 27.3% 0.0% 27.3%2010 8 75.0% 12.5% 12.5% 25.0% 9 77.8% 22.2% 0.0% 22.2%
6 2009 11 72.7% 27.3% 0.0% 27.3% 12 50.0% 50.0% 0.0% 50.0%2010 9 100.0% 0.0% 0.0% 0.0% 9 66.7% 33.3% 0.0% 33.3%
Total 2009 51 80.4% 19.6% 0.0% 19.6% 52 73.1% 26.9% 0.0% 26.9%2010 49 93.9% 4.1% 2.0% 6.1% 48 75.0% 25.0% 0.0% 25.0%
95