PALFINGER BilPK 2012 d eng RS
38
PALFINGER AG Record year with exceptional increase in earnings Presentation on the 2011 financial year February 2012
Transcript of PALFINGER BilPK 2012 d eng RS

PALFINGER AGRecord year with exceptional increase in earnings
Presentation on the 2011 financial yearFebruary 2012

Market volatility
2
Importance of flexibility and internationality is increasing
-50
50100150200250300350400450500
2005 2006 2007 2008 2009 2010 2011
Revenue (half year)AREA UNITSEUROPEAN UNITS
0
Acc. to IFRS in EUR million.

Highlights 2011 (1)
• Further increase in revenue of 30% – historic record• Exceptionally strong increase in earnings: EBIT + 83%• Internationalization and flexibility support sustainable growth
High growth rates outside Europe (Brazil, North America, Asia)CIS becomes important market for PALFINGER following acquisition of INMANMajority takeover of Palfinger Crane Rus (Area Management CIS)Share buyback and authorized capital create flexibility in financing growth measures
3

Highlights 2011 (2)
• PALFINGER once again outperformer in its industry • Growth achieved in nearly all product areas and regions
Great success in the field of offshore wind energy
• Basis created for maintaining the high level in the years to come• Proposed dividend: EUR 0.38 per share
4

Strategy
PALFINGER at a glance
• Leading international manufacturer of innovative lifting, loading and handling systems
Number one in knuckle boom cranes, timber and recycling cranesand hookloadersNumber two in tail lifts and transportable forkliftsLeading specialist in high-tech railway system solutions
• Global distribution and service network(more than 200 general importers/dealers and 4,500 sales and service centres worldwide)
• Global procurement, production and assembly (28 manufacturing and assembly locations)
• Strategic pillars: Innovation – internationalization – flexibility
6
Maintaining and expanding the Group’s competitive advantage

Strategic objectives 2015
• Diversification will be limited to the core competences • Further increase in flexibility is a priority (strategic pillar)• Internationalization directed towards future markets (Russia, Asia)• Innovation as basis for enhancement of products and services
Catering to regional requirements
• Profitability of all business units – targeted packages of measures
7
Continuation of sustainably profitable growth

Strategic highlights 2011
• Innovation: Research and development a priorityDevelopment of a new crane series Product adjustments to meet specific regional requirements Further development in the field of electronics and mechatronics
• Internationalization: Focus on future marketsAssembly activities started in India Continuous consolidation of market presence in Russia – INMAN acquisitionMarket positioning strategy for China
• Flexibility: 3rd pillar of the Group’s strategyIncrease in flexibility at all value-creation levels Continuation of structural and cost-related programmes
8

Internationalization
9
Revenue 2006
87.5% EUROPEAN UNITS
12.5% AREA UNITS
73.5% EUROPEAN UNITS
Revenue 2011
26.5% AREA UNITS
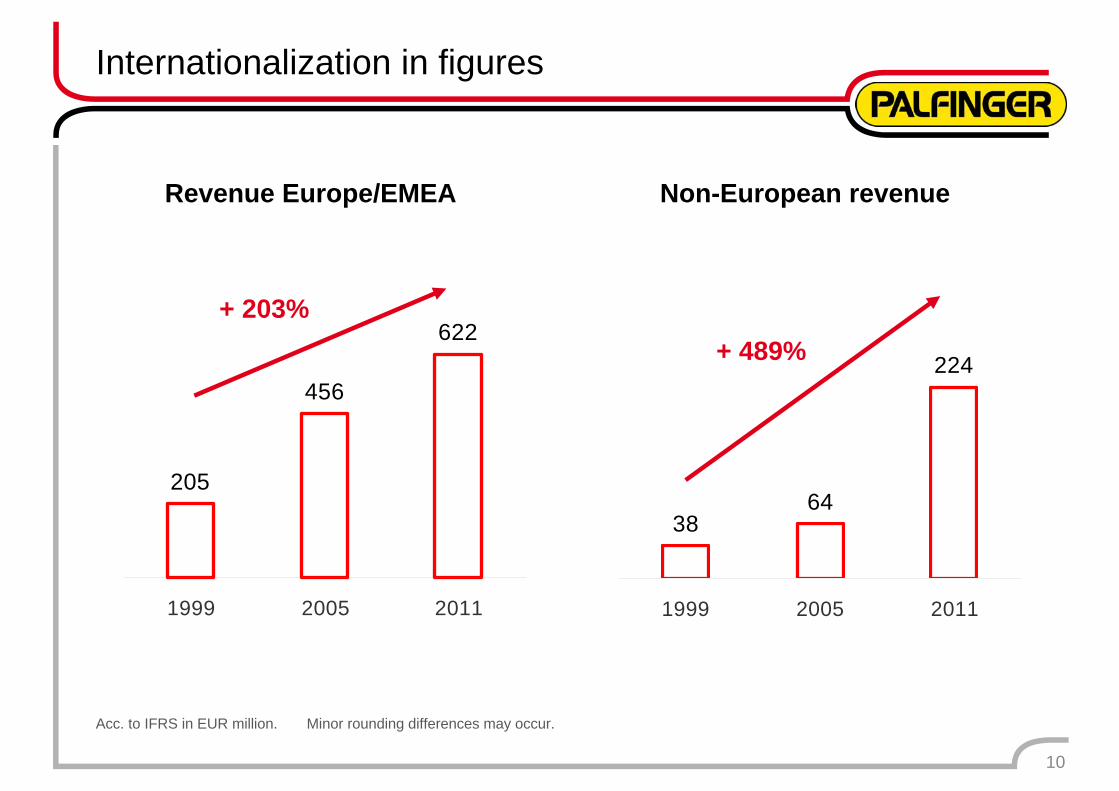
3864
224
1999 2005 2011
205
456
622
1999 2005 2011
Internationalization in figures
Acc. to IFRS in EUR million. Minor rounding differences may occur.
Revenue Europe/EMEA Non-European revenue
+ 489%+ 203%
10

INMAN acquisition
• Leading Russian crane manufacturer (Republic of Bashkortosan)Approx. 400 employeesRevenue 2011: EUR 20.5 million
• Local value creation and recognized product• Expansion of sales and service network
In particular in the Ural region
• Initial consolidation with effect from 26 August 2011
11

28 production sites
12
Lengau/AUT Köstendorf/AUT Elsbethen/AUT Löbau/GER Krefeld/GER
Seifhennersdorf/GER
Ganderkesee/GER
Welwyn Garden City/GBR Cadelbosco/ITA Caussade/FRA
Delnice/CRO
Barneveld/NED Maribor/SLO
Tenevo/BUL Cherven Brjag/BUL
Tiffin/USA Oklahoma City/USANiagara Falls/CAN Trenton/USA
Caxias do Sul/BRA
Cerritos/USACouncil Bluffs/USA
Shenzhen/CHN Hanoi/VIE Chennai/IND
Lazuri/ROUSkrljevo/CRO Ishimbay/RUS

Product portfolio
13
• Truck-mounted knuckle boom cranes• MADAL telescopic cranes• EPSILON timber and recycling cranes• OMAHA STANDARD truck bodies• Marine cranes (incl. davits)• Cranes for offshore wind energy plants• PALIFT/OMAHA STANDARD
hookloaders• RAILWAY rail transport system
solutions• CRAYLER transportable forklifts• RATCLIFF/MBB tail lifts and passenger
lifts• BISON/WUMAG ELEVANT/ETI access
platforms
Flexibility
• Increasing market volatility (regions and industries)• Structures must allow for quick responses• Flexibility at all value-creation levels to be raised
Basis: New organizational structure since 2010Procurement: Master agreements with strategic suppliersProduction: Order-based manufacturing, standardized partsProcesses: Continuous flow manufacturing, self-controlling teamsHuman resources: Core personnel and temporary workers, flexible working time modelsInformation services: Selective outsourcingFinances: Reduction in working capital (in proportion to turnover)
14
Segments

Segment financials
16
Acc. to IFRS in EUR million. Minor rounding differences may occur.
Segment revenue
2010 2011 %
EUROPEAN UNITS 479.2 621.8 + 29.8%AREA UNITS 172.6 223.9 + 29.7%
VENTURES – – –
Segment EBIT
2010 2011 %
EUROPEAN UNITS 52.7 80.1 + 51.9%AREA UNITS (7.6) (1.1) + 85.5%
VENTURES (7.7) (10.3) (33.0%)

EUROPEAN UNITS segment
• Revenue increased by 30%Increases in nearly all product areas, particulary in cranesBusiness unit Marine Systems contributed approx. 1/3 to this increaseStagnation in railway systems
• Hoodloaders sustainably profitable • Segment EBIT increased from EUR 53 million to EUR 80 million• Market shares gained in timber and recycling cranes and access
platforms• Success achieved in the field of offshore wind energy
17

AREA UNITS segment
• Revenue increased by 30%, success achieved reflected in earningsAdditional one-time effect from acquisitions
• Strong upward trend, particularly in North America• Establishment of new products in South America • Strong growth in Asia, still at a low level • Distribution continues to be successful in India• CIS becomes important market for PALFINGER following acquisition
of INMAN
18
VENTURES unit
• Continuation of cost-related and structural programmes • Acquisition of INMAN completed• Intensive development of strategic options for China
19

Key financial figures
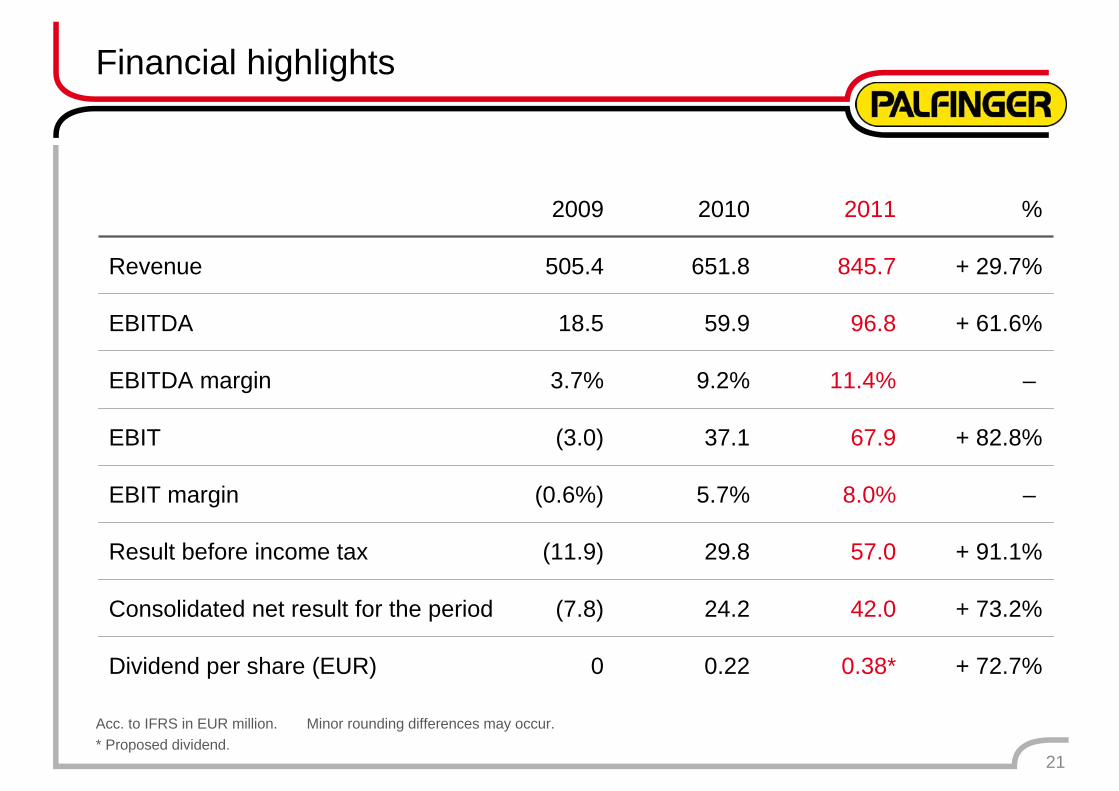
Financial highlights
2009 2010 2011 %
Revenue 505.4 651.8 845.7 + 29.7%
EBITDA 18.5 59.9 96.8 + 61.6%
EBITDA margin 3.7% 9.2% 11.4% –
EBIT (3.0) 37.1 67.9 + 82.8%
EBIT margin (0.6%) 5.7% 8.0% –
Result before income tax (11.9) 29.8 57.0 + 91.1%
Consolidated net result for the period (7.8) 24.2 42.0 + 73.2%
Dividend per share (EUR) 0 0.22 0.38* + 72.7%
21
Acc. to IFRS in EUR million. Minor rounding differences may occur. * Proposed dividend.
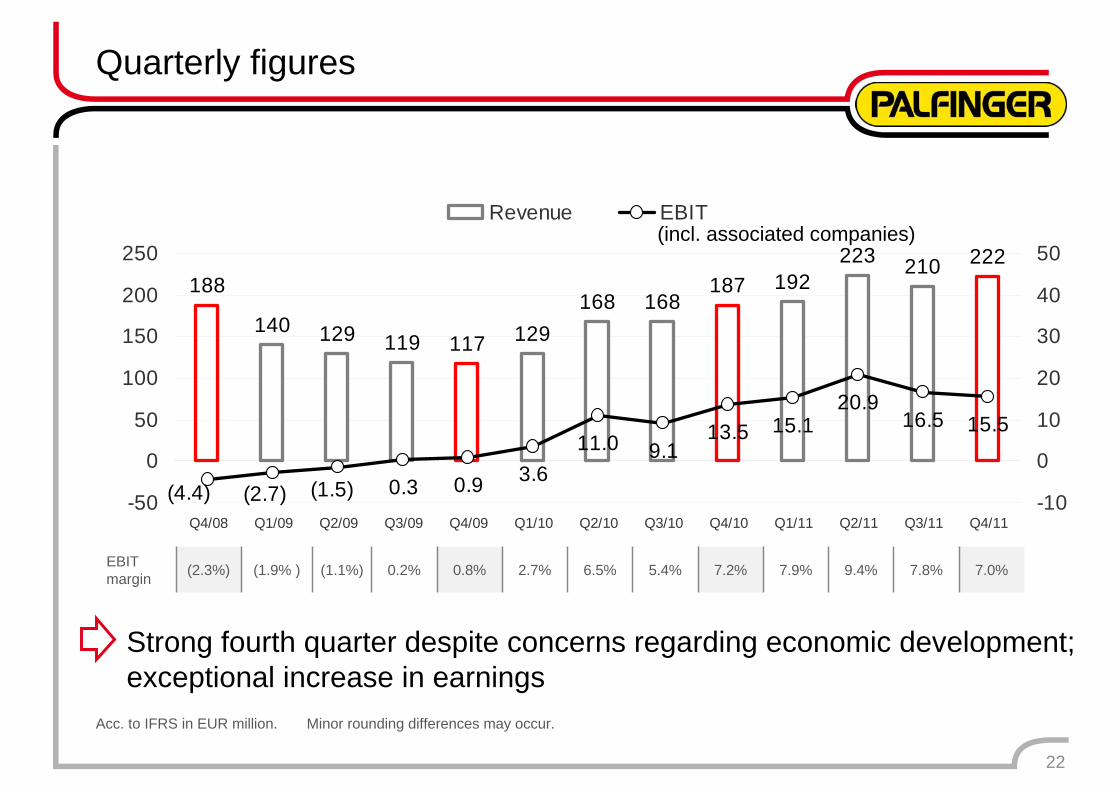
Quarterly figures
22
EBITmargin (2.3%) (1.9% ) (1.1%) 0.2% 0.8% 2.7% 6.5% 5.4% 7.2% 7.9% 9.4% 7.8% 7.0%
Strong fourth quarter despite concerns regarding economic development;exceptional increase in earnings
(incl. associated companies)
Acc. to IFRS in EUR million. Minor rounding differences may occur.
188
140 129 119 117 129168 168
187 192223 210 222
0.3 0.9 3.611.0 9.1
13.5 15.120.9
16.5 15.5
(1.5)(2.7)(4.4)-50
0
50
100
150
200
250
Q4/08 Q1/09 Q2/09 Q3/09 Q4/09 Q1/10 Q2/10 Q3/10 Q4/10 Q1/11 Q2/11 Q3/11 Q4/11-10
0
10
20
30
40
50
Revenue EBIT

242 306 311 378 386
131170 133
103 134
0
100
200
300
400
500
600
2007 2008 2009 2010 2011
Net working capital (in relation to revenue)
Non-current operating assets
Capital employed*
* As at the reporting date.Acc. to IFRS in EUR million. Minor rounding differences may occur.
23
(19%)(21%) (26%)
(16%) (16%)373
477 444520
Increase due to business expansion, relation to revenue constant
481

Return on capital employed
Acc. to IFRS in EUR million. Minor rounding differences may occur.
24
80.3 55.6
443.8480.7
519.6
55.5
32.7(0.1)
476.7
373.1
11.1%7.1%0.0%
13.1%25.7%
-100
0
100
200
300
400
500
600
2007 2008 2009 2010 2011-10%
0%
10%
20%
30%
40%
50%
NOPLAT Capital employed Return on capital employed %

Investment
25
61.4
46.5
8.014.6 18.615.6
28.721.5 22.7
28.8
0102030
40506070
2007 2008 2009 2010 2011
Investment in property, plant, and equipment
Depreciation, amortization, and impairment
Acc. to IFRS in EUR million. Minor rounding differences may occur.
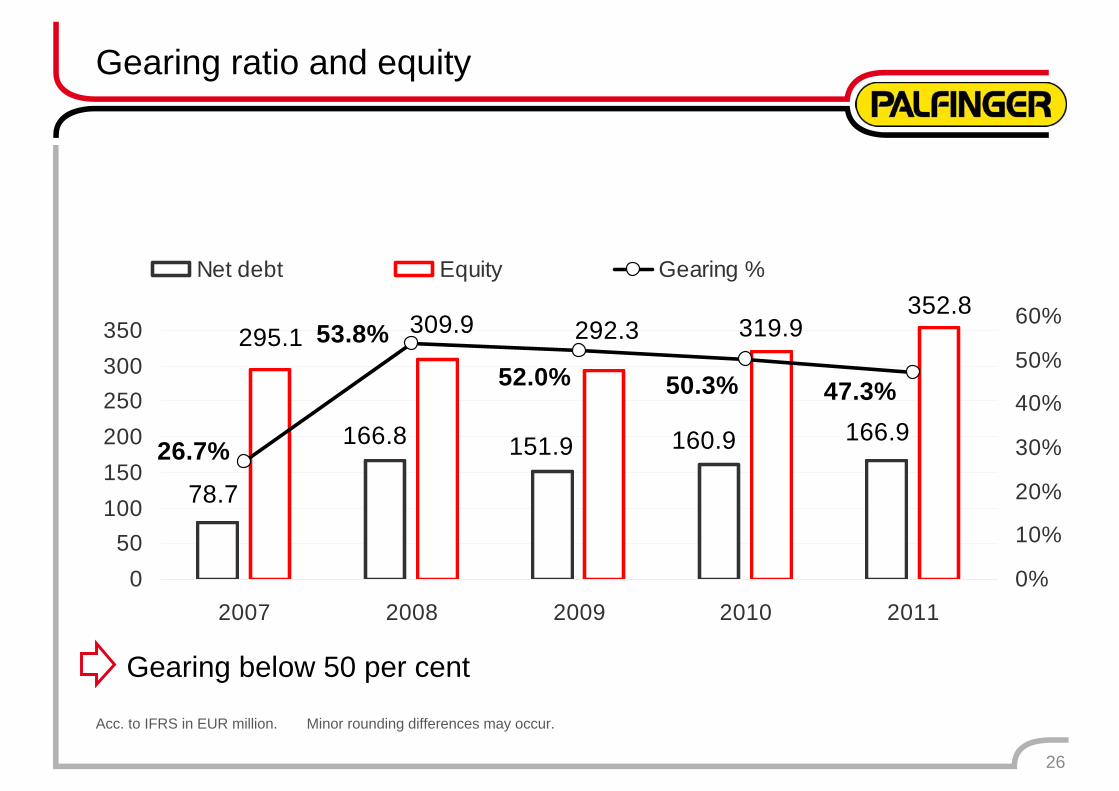
Gearing ratio and equity
26
Gearing below 50 per cent
319.9
78.7
166.8 166.9151.9 160.9
292.3309.9352.8
295.1
26.7%
52.0%53.8%
50.3% 47.3%
050
100150200250300350
2007 2008 2009 2010 20110%
10%
20%
30%
40%
50%
60%
Net debt Equity Gearing %
Acc. to IFRS in EUR million. Minor rounding differences may occur.

320 353
195 161
162 226
0
200
400
600
800
2010 2011
Current liabilitiesNon-current liabilitiesEquity
381 392
296 348
0
200
400
600
800
2010 2011
Current assetsNon-current assets
Balance sheet structure
Acc. to IFRS in EUR million. Minor rounding differences may occur.
27
Long-term financial structure; promissory note loan due in 2012
677 740
Assets Liabilities
677 740
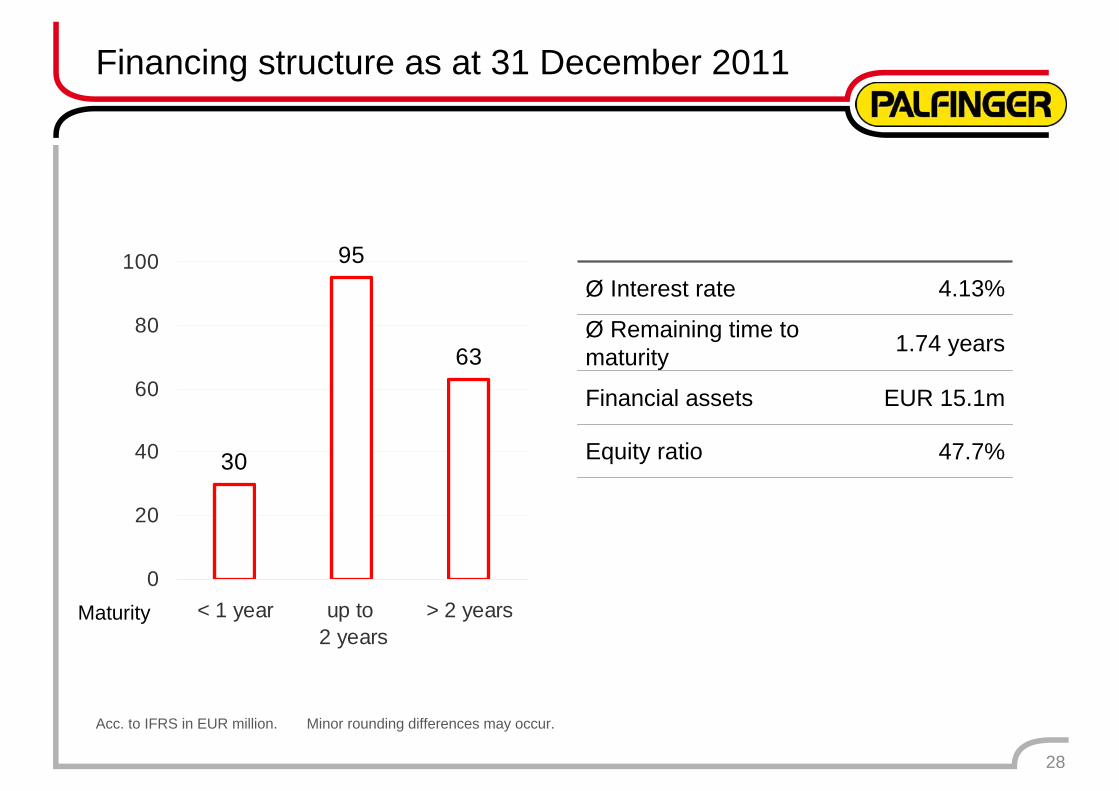
Financing structure as at 31 December 2011
Acc. to IFRS in EUR million. Minor rounding differences may occur.
28
Ø Interest rate 4.13%
Ø Remaining time to maturity 1.74 years
Financial assets EUR 15.1m
Equity ratio 47.7%
Maturity
30
95
63
0
20
40
60
80
100
< 1 year up to 2 years
> 2 years

Free cash flows
Acc. to IFRS in EUR million. Minor rounding differences may occur.
29
(17.2)
(17.0)
42.0
7.8
34.2
(15.9)50.0(2.1)41.51.09.6
2009 2010 2011EBTDA 52.6 85.6+/– Cash flows from companies at equity 1.5 (7.9)+/– Cash flows from working capital (1.2) (28.7)+/– Cash flows from tax payments (3.8) (11.3)Cash flows from operating activities 49.1 37.7+/– Cash flows from investing activities (54.1) (34.6)Cash flows after changes in working capital & investments (5.0) 3.1
+/– Cash flows from interest on borrowingsadjusted by tax expense 9.1 8.6
Free cash flows 4.2 11.7
Cash flows from equity/investor capital (1.1) (12.1)
Cash flows from net debt 6.1 9.0

PALFINGER share
30
ISIN AT0000758305
Number of sharesthereof own shares
35,730,000368,840
Share price as at end of period EUR 12.33
Market capitalization EUR 440.6m
65%Palfinger family
Shareholder structure Shareholder informationas at 30 December 2011
29%free float
1% PALFINGER AG
5% Delta Lloyd

Outlook
Outlook and objectives – internally
32
• Internationalization strategy to be continuedFocus on Asia, particularly China, and RussiaExpansion of product portfolio in the areas
• Further increase in flexibility throughout all units • Complexity management is a priority• Research, development and innovation
Regional product adjustmentsGradual introduction of a new crane series
• Further strengthening of weaker units and areas

Outlook and objectives – externally
• High level of uncertainty in the financial markets impacts real economy
• Situation for PALFINGER clearly better than in 2008/09• Strong fourth quarter signals continued good order situation• Market growth in non-European regions expected
33
PALFINGER strives to increase revenue slightly in 2012 as well

Research reports
Berenberg Bank Hauck & AufhäuserCheuvreux HSBCDeutsche Bank RCBErste Group UBSGoldman Sachs
34
Earnings estimates – consensus (in EUR million) 2012e 2013e
Revenue 806.5 865.3EBIT 62.0 78.8
Earnings per share (EUR) 1.03 1.43

Financial calendar 2012
35
3 February 2012 Balance sheet press conference
16 February 2012 Publication of Annual Report 2011
8 March 2012 Annual General Meeting
12 March 2012 Ex-dividend day
14 March 2012 Dividend payment day
10 May 2012 Publication of resultsfor the first quarter of 2012
9 August 2012 Publication of resultsfor the first half of 2012
9 November 2012 Publication of resultsfor the first three quarters of 2012

Investor relations
36
Herbert Ortner, CEOPhone: +43 662 46 84-2222
Hannes Roither, Company SpokespersonPhone: +43 662 46 84-2260
PALFINGER AGFranz-Wolfram-Scherer-Strasse 24
5020 Salzburg Fax: +43 662 46 84-2280
This presentation contains forward-looking statements made on the basis of all information available at the time of preparation of this presentation. Actual outcomes and results may be substantially different from those predicted.

Backup

60
80
100
120
140
160
180
200
Performance of the PALFINGER share since 2010
38
4 Jan 2010 3 Jan 2011 30 Dec 2011
PALFINGER AGEUR 12.33
ATX
DAX