PALESTINE NATIONAL AUTHORITY - HOME | ESMAP
75
Report No. [*] - GZ Palestinian Authority MINISTRY OF TRANSPORT STRATEGIC ASSESSMENT ON ENERGY EFFICIENCY AND SECURITY FOR PUBLIC TRANSPORT IN THE WEST BANK FINAL REPORT October 2009 Sustainable Development Department Middle East and North Africa Region
Transcript of PALESTINE NATIONAL AUTHORITY - HOME | ESMAP

Report No. [*] - GZ
Palestinian Authority
MINISTRY OF TRANSPORT
STRATEGIC ASSESSMENT ON ENERGY EFFICIENCY AND SECURITY
FOR PUBLIC TRANSPORT IN THE WEST BANK
FINAL REPORT
October 2009
Sustainable Development Department
Middle East and North Africa Region

Energy Efficiency and Security for Public Transport Report – October 2009 2
CURRENCY AND EQUIVALENT UNITS
(As of April 2009) Currency Unit = Israeli New Shekel (NIS)
US$ 1.0 = NIS 4.0 NIS 1.0 = US$ 0.25
ABBREVIATIONS
ADEME Agence De l’Environnement et de la Maitrise de l’Energie. French organization for Environment and Energy for the French Administration
CAN Controller Area Network. It allows all diagnosis and show the calibration of the main parameters used for the engine and others components
CH4 Methane gas CNG Compressed Natural Gas (methane CH4 gas) CO2 Carbon Dioxide COST European Cooperation in Science and Technology
De NOx Generic term for the technique able to reduce the NOx such as EGR or SCR DPF Diesel Particles Filter
EEV Level of performances between Euro5 and 6 (future regulation) Enhanced Environment Friendly Vehicle
EGR Exhaust Gas Re-circulation, which allows the reduction of NOx emissions EPA Environment Protection Agency, a USA agency in charge of defining
regulations related to the environment EURO 0, 1, 2, 3, 4, 5 Term related to the European norm FAP French meaning of Diesel Particles Filter GHGs Greenhouse Gases
HC Hydrocarbon (all the fuel which is not burned during the combustion) LNG Liquid Natural Gas (methane CH4 gas) LPG Liquid Petrol Gas (mixture of butane and propane) MEA Membrane Electrode Assembly of a fuel cell MOT Ministry of Transport
NOx Nitrogen Monoxide or dioxide pollution emitted during the combustion PAMs Portable Acquisition Mobile. Device used with Starbus to gathers the main
characteristics of a route and therefore gives all accurate data PNA Palestinian National Authority PPM particles per million RPM revolutions per minute; speed of the engine SCR Selective Catalyst Reduction of NOx SORT Duty cycle for buses. Standardized On Road Test Cycles STARBUS European project to choose the pathways of buses; www.starbus-tool.eu TA Technical Assistance TOR Terms of Reference WB World Bank WBG West Bank and Gaza
FISCAL YEAR (FY)
January 1 - December 31
Vice President Shamshad Akhtar
Country Director A. David Craig
Sector Manager Jonathan Walters Task Team Leader Ibrahim Dajani

Energy Efficiency and Security for Public Transport Report – October 2009 3
Contributors and Recognitions: This Report was prepared by a World Bank team led by
Ibrahim Dajani and with the participation of Roger Rault, Khaled Alsahili, Lamis Aljounaidi,
Gregoire Gauthier and Khalida Al-Qutob. The team is grateful for the leadership of senior
officials from the Ministry of Transport, and the cooperation of the technical staff. The team
is also grateful for the guidance provided by Ranjan K. Bose and John Allen Rogers for the
helpful comments from peer reviewers. This work was made possible through financial
assistance from the Energy Sector Management Assistance Program (ESMAP).
Energy Efficiency and Security for Public Transport Report – October 2009 4
TABLE OF CONTENTS
1 EXECUTIVE SUMMARY ............................................................................................................................. 6 2 BACKGROUND ....................................................................................................................................... 10 3 REVIEW OF ALTERNATIVE FUELS BUS PATHWAYS ................................................................................. 12
3.1 INTRODUCTORY REMARKS .......................................................................................................................... 12 3.1.1 Local air pollutants: EURO norms ........................................................................................................ 12 3.1.2 Global pollutants ................................................................................................................................. 13
3.2 DIESEL ENGINES ....................................................................................................................................... 14 3.2.1 Diesel ................................................................................................................................................... 14 3.2.2 Water emulsion diesel ......................................................................................................................... 14 3.2.3 Bio diesel ............................................................................................................................................. 15 3.2.4 Ethanol ................................................................................................................................................ 15 3.2.5 Facilities for Diesel engines ................................................................................................................. 16
3.3 OTTO ENGINES ........................................................................................................................................ 16 3.3.1 Liquid Petroleum Gas (LPG) ................................................................................................................. 17 3.3.2 Compressed Natural Gas (CNG) .......................................................................................................... 18 3.3.3 Liquid Natural Gas (LNG) ..................................................................................................................... 20 3.3.4 Biogas .................................................................................................................................................. 20 3.3.5 Facilities for LPG engines ..................................................................................................................... 20 3.3.6 Facilities for CNG engines .................................................................................................................... 22
3.4 ELECTRICAL ENGINES ................................................................................................................................. 24 3.5 HYBRID ENGINES ...................................................................................................................................... 26 3.6 FUEL CELL ENGINES .................................................................................................................................. 27 3.7 COMPARISON OF THE DIFFERENT TECHNOLOGIES ............................................................................................ 30
3.7.1 Local and global emissions .................................................................................................................. 30 3.7.2 Energy efficiency ................................................................................................................................. 31 3.7.3 Maintenance costs .............................................................................................................................. 31 3.7.4 Capital costs ........................................................................................................................................ 32 3.7.5 Operating costs ................................................................................................................................... 33 3.7.6 Synthesis .............................................................................................................................................. 33
4 WEST BANK PUBLIC TRANSPORT AND ENERGY CONTEXT ...................................................................... 35 4.1 PUBLIC TRANSPORT SITUATION .................................................................................................................... 35
4.1.1 The bus fleet ........................................................................................................................................ 35 4.1.2 Public transport industry organization and productivity ..................................................................... 36
4.2 ENERGY AVAILABILITY AND SUPPLY ............................................................................................................... 38 4.2.1 Diesel and gasoline.............................................................................................................................. 38 4.2.2 Compressed Natural Gas ..................................................................................................................... 39 4.2.3 Liquefied Petroleum Gas ..................................................................................................................... 39
4.3 REGIONAL EXPERIENCES WITH ALTERNATIVE FUELS .......................................................................................... 40 4.3.1 Israel .................................................................................................................................................... 40 4.3.2 Jordan .................................................................................................................................................. 41 4.3.3 Egypt ................................................................................................................................................... 41
5 ALTERNATIVE PATHWAYS COMPARISON .............................................................................................. 42 5.1 METHODOLOGY ....................................................................................................................................... 42
5.1.1 Method ................................................................................................................................................ 42 5.1.2 Duty cycles used for the simulations ................................................................................................... 43 5.1.3 Quick presentation of STARBUS .......................................................................................................... 44
5.2 SCENARIOS DESCRIPTION ........................................................................................................................... 45 5.2.1 Common economic and technical assumptions .................................................................................. 46 5.2.2 Reference scenario: Existing fleet EURO 0 ........................................................................................... 46 5.2.3 Scenario 1: EURO3 Diesel .................................................................................................................... 48 5.2.4 Scenario 2: EURO3 LPG........................................................................................................................ 48 5.2.5 Scenario 3: EURO3 CNG ....................................................................................................................... 51 5.2.6 Scenario 4: EURO4 Diesel .................................................................................................................... 53

Energy Efficiency and Security for Public Transport Report – October 2009 5
5.2.7 Scenario 5: EURO4 LPG........................................................................................................................ 55 5.2.8 Scenario 6: EURO4 CNG ....................................................................................................................... 55 5.2.9 Scenarios recap ................................................................................................................................... 57
5.3 RESULTS ................................................................................................................................................. 64 5.3.1 Costs .................................................................................................................................................... 64 5.3.2 Gas emissions ...................................................................................................................................... 64 5.3.3 Safety .................................................................................................................................................. 65 5.3.4 Fuel availability ................................................................................................................................... 66
5.4 SENSITIVITY ANALYSIS ................................................................................................................................ 66 5.4.1 Method ................................................................................................................................................ 66 5.4.2 Results ................................................................................................................................................. 66
5.5 SYNTHESIS .............................................................................................................................................. 67 6 RECOMMENDATIONS ............................................................................................................................ 72
ANNEXES:
ANNEX 1: REFERENCES ........................................................................................................................................... 74
ANNEX 5: SCENARIOS SIMULATION DETAILED RESULTS ...................................................... ERROR! BOOKMARK NOT DEFINED.
ANNEX 6: PRESENTATION DELIVERED ON JUNE 11, 2009 – MOT / OPERATORS / WORLD BANK ROUNDTABLE ............... ERROR!
BOOKMARK NOT DEFINED.

Energy Efficiency and Security for Public Transport Report – October 2009 6
1 EXECUTIVE SUMMARY Background
The ongoing World Bank Technical Assistance (TA) is assisting the Palestinian Ministry of Transport
(MOT) and the bus sector to develop a strategy for strengthening the sector, which at a minimum will
require strengthening of the operators’ finances to be able to afford the urgent fleet renewal. One
strand of this aims at restructuring the industry sector so that it can achieve system-wide efficiencies
and economies of scale. Other strands are needed to focus on practical measures to achieve technical
and operational efficiencies, and help in the reduction of unit operating costs.
Since fuel is the largest expense item in the West Bank and Gaza (WBG) bus industry sector, it needs a
special attention. One area of potentially radical change is to examine whether changes in fuel types
would provide significant benefit. Over the last decade, some Chinese and Indian bus operators have
converted their fleets to gas (Compressed Natural Gas – CNG – or Liquefied Petroleum Gas – LPG), and
to a lesser extent European and North American operators have done so. At the regional level, Israeli
operator Egged is exploring using CNG for its buses. There are also trends to increasing use of blended
fuels, bio-fuels, and ‘clean diesel’. These changes have been stimulated by expected benefits in fuel
costs, security of fuel supply, fuel efficiency, and cleaner emissions.
Finally, improving the efficiency of bus operations is critical to the energy efficient and environment-friendly sustainable environmental improvement of bus transport.
Objectives
The proposed study supports the Transport Strategy (TSN) and the ongoing TA by exploring the options
for the use of alternative fuels in the bus industry in West Bank and Gaza, and carrying out an initial
examination of potential benefits and practicality.
Given (i) the recent high oil price rise and volatility and (ii) the weight of fuel costs within operators’
operating costs, this study examines which fuel alternatives provide the best cost-effectiveness.
Besides, an environmental assessment of the various pathways is carried out.
The main activities of this TA include the following: (i) general review of alternative engine pathways
available for buses; (ii) description of the public transport situation in the West Bank, with a special
focus of fuels availability and use for public transport; and (iii) life cycle cost comparison of 6 scenarios
involving alternative fuel pathways, including CNG and LPG buses.
General review
The reviewed pathways are: diesel and its variations (water-diesel), ethanol, LPG, CNG, electric,
hybrid-electric, and fuel cell engines. Within this review EURO0 to EURO5 were considered and the
advantaged / drawbacks of each pathway were analyzed.
It resulted from this review to take out of the scope of the WBG analysis a few pathways. Fuel cell
engines are only prototypes for the time being. With current batteries capacity, electrical engines
are limited to short inner-city services. Hybrid buses are still very expensive and probably not
affordable for the moment to WBG public transport operators. EURO5 buses are under recent
development and are still expensive too; nevertheless, their use was analyzed and compared to
EURO4 as well as to the potential of fuel options in the WBG. Ethanol and water-diesel are not
present within WBG. CNG is not present either but was kept within the scope of the study, as a

Energy Efficiency and Security for Public Transport Report – October 2009 7
possible motor vehicle fuel in the future, in particular thanks to recent discovery of natural gas Gaza
off-shore.
Alternative fuels use in WBG and the region
In the region, Diesel is the most commonly used fuel for public transport. Nonetheless, in Egypt,
many taxis are running on CNG and there is a pilot program on CNG for buses. In Israel, CNG is not
used for cars but there are about 10,000 private vehicles running on LPG. It is still unclear whether
CNG or LPG is used by public transport vehicles, or not, in Israel. In Jordan, all public transport is run
on Diesel.
In the West Bank, all types of fuels (diesel, gasoline, LPG) are imported and are obtained through
Israel. Road transport accounts for more than half of the overall energy consumed in the Palestinian
Territories. All public transport vehicles use diesel, cheaper than gasoline. CNG is banned for safety
reason on behalf of Israeli – PNA agreements. LPG is not officially recognized as a motor vehicle fuel
but is used by several thousand private cars in WBG.
Methodology and scenarios
The base-case (Scenario 0) is the existing conditions (EURO0 Diesel). Several other scenarios were
established: EURO3 scenarios with Diesel, LPG and CNG, and EURO4 and EURO5 scenarios with
Diesel, LPG and CNG. The EURO4 fuel alternatives were compared with the EURO5 engines for the
same fuel alternatives. All these scenarios were compared with the existing condition (EURO0
Diesel).
A set of key assumptions was defined so that the life cycle cost, on 12 years, of each scenario could
be computed with the STARBUS simulation model. The assumptions included, among others:
various fuels unit prices and escalation, capital cost of each type of bus, specific capital costs
needed for CNG and LPG technologies, maintenance costs of each type of buses, average kilometers
per year, etc. The bus duty cycles used for the simulations are those built in the STARBUS simulation
model.
The scenario comparison is carried out on the basis of: (i) direct costs: fuel costs, maintenance costs
and bus asset depreciation; and (ii) environmental monetarized costs for local pollutants (CO, HC,
NOx, particles) and global pollution (CO2). EU standards were used to monetarize pollution costs.
Finally, a sensitivity analysis on key parameters was carried out to make sure of the results
robustness.
Results
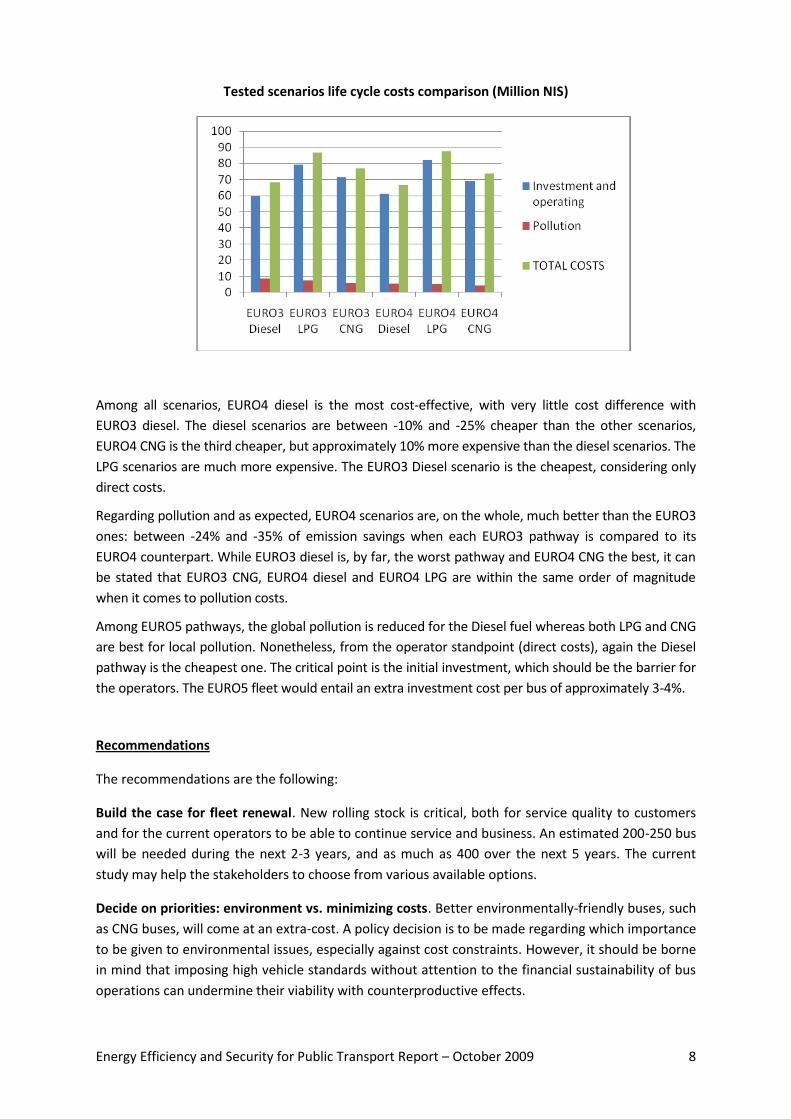
The main results are recapped in the following chart. The results presented are the life-cycle costs of
a 40-bus fleet, over a 12-year time. Costs are shown in discounted million NIS. In addition, EURO5
diesel, LPG, and CNG alternatives were compared to same of fuel alternatives of EURO4 engine.
Energy Efficiency and Security for Public Transport Report – October 2009 8
Tested scenarios life cycle costs comparison (Million NIS)
Among all scenarios, EURO4 diesel is the most cost-effective, with very little cost difference with
EURO3 diesel. The diesel scenarios are between -10% and -25% cheaper than the other scenarios,
EURO4 CNG is the third cheaper, but approximately 10% more expensive than the diesel scenarios. The
LPG scenarios are much more expensive. The EURO3 Diesel scenario is the cheapest, considering only
direct costs.
Regarding pollution and as expected, EURO4 scenarios are, on the whole, much better than the EURO3
ones: between -24% and -35% of emission savings when each EURO3 pathway is compared to its
EURO4 counterpart. While EURO3 diesel is, by far, the worst pathway and EURO4 CNG the best, it can
be stated that EURO3 CNG, EURO4 diesel and EURO4 LPG are within the same order of magnitude
when it comes to pollution costs.
Among EURO5 pathways, the global pollution is reduced for the Diesel fuel whereas both LPG and CNG
are best for local pollution. Nonetheless, from the operator standpoint (direct costs), again the Diesel
pathway is the cheapest one. The critical point is the initial investment, which should be the barrier for
the operators. The EURO5 fleet would entail an extra investment cost per bus of approximately 3-4%.
Recommendations
The recommendations are the following:
Build the case for fleet renewal. New rolling stock is critical, both for service quality to customers
and for the current operators to be able to continue service and business. An estimated 200-250 bus
will be needed during the next 2-3 years, and as much as 400 over the next 5 years. The current
study may help the stakeholders to choose from various available options.
Decide on priorities: environment vs. minimizing costs. Better environmentally-friendly buses, such
as CNG buses, will come at an extra-cost. A policy decision is to be made regarding which importance
to be given to environmental issues, especially against cost constraints. However, it should be borne
in mind that imposing high vehicle standards without attention to the financial sustainability of bus
operations can undermine their viability with counterproductive effects.

Energy Efficiency and Security for Public Transport Report – October 2009 9
Foster Diesel pathways. In light of the conclusions of the study, the diesel pathway should be
promoted for public transport in WBG. Since the simulation results conclude that EURO3 and EURO4
technologies have direct costs in the same order of magnitude, EURO 4 should be encouraged. There
is a large spectrum of bus manufacturers, which give the opportunity to buy EURO3 or EURO4 buses
in good conditions. It is recommended to define a standard for all the operators in order to be able
to procure for a large number of buses at the same time.
Fine-tune the results. The analysis that was carried aims at the strategic level and is preliminary. As
much as possible, it is recommended to fine-tune the simulation inputs so as to get more accurate
results. As the economic environment changes, three items should be of special focus: (i) the buses
unit prices, (ii) the fuel unit prices, and (iii) the bus duty cycle curves really used in WBG conditions.
Fuel supply and availability. Alternative fuels, especially natural gas, supply and availability should
be assessed in a more comprehensive way. The recent discovery of natural gas fields off-shore Gaza
might change energy equilibrium and markets in the region.
Improve operators’ financial situation. The operators financial capability is today limited.
Introducing new buses is likely to, at the same time, decrease the huge maintenance costs that have
to be incurred on their current worn-out buses but also increase dramatically their operating costs in
terms on loan repayment and depreciation. This action is part of the public transport strengthening
that is proposed through the large franchises scheme.
Improve maintenance process. The maintenance organization has to be updated. It is highly
recommended to choose one or just a few kinds of buses (“standard bus”), for the various operators,
so that the maintenance processes are streamlined and eased. The minimum agreement is common
warehouses for the spare parts. It is also recommended that the operators consider subcontracting
for specific operations that requires either heavy investments or high professional capacity. The
subcontracting could be through (i) the bus manufacturer organization, (ii) through the specialization
of the maintenance of the largest operators, or (iii) through a special company, as proposed in the
passenger transport sector development study.
Set a regulatory framework for LPG vehicles. Light LPG vehicles (private cars) are already in use in
the West Bank. Engine retrofitting is currently carried out in informal workshops. It is recommended
that a regulatory framework is established to control this activity and ensure safety standards. The
regulation should include: the retrofitting kits themselves, the garage which modifies the cars, the
LPG stations requirements, and the periodical technical control of the cars and of the stations.
Energy Efficiency and Security for Public Transport Report – October 2009 10
2 BACKGROUND The Transport Sector Strategy Note (TSN) of June 26, 2007 identified several issues of concern in the
transport sector. One of these issues is the problem of high operating costs which has a serious
impact on the overall viability of the transport operators, and hence on their capacity to finance fleet
renewal. A further issue is that the bus companies or taxi offices are often family owned and
managed in a traditional way with very limited initiatives for business plan development or future
planning concepts, and hence have little capacity for assessing and introducing new technologies
that would improve their efficiency, capacity and/or their finances.
At present, virtually all Public Transport (PT) in WBG is provided by privately owned buses, shared
taxis and personal taxis and has been regulated by a traditional system that dates back many years.
There is a high level of fragmentation in both the bus and taxi sectors with many small-scale
operators, most of which have just a few routes. This is compounded by the progressive shrinkage of
business over the last three decades, both through a reduction of the business within the West Bank
and Gaza, and the total cessation of services to destinations outside these territories. As a result,
many of the former larger companies have diminished, both in scale and in technical capacity, and
are surviving on the legacy of historic investments and know-how. There is currently minimal
capacity to absorb complex and innovative technologies.
A recent study of the bus operator sector carried out within an ongoing Bank TA has identified that
there are 76 operators in the West Bank who currently operate 594 buses on 128 registered routes,
and that a further 10 companies and 26 routes are not operational. Of the 76 operators in the West
Bank, all have less than 50 buses, and only 16 operators have 10 or more buses currently
operational. The sentiment within the industry sector is that further contraction is likely unless there
are significant changes in the operating environment. In Gaza, the general bus services have
collapsed completely, with just two recognizable bus operators still providing services mainly for
transport of schoolchildren and students.
The study also examined the cost structure of a number of the larger operators in the West Bank.
This indicated that fuel costs accounts for about 40% of total expenditure in 2008, a significant
increase in previous years. There is little prospect that fuel costs will decrease and serious concern
that the costs will increase even further, and lead to closure of operators who are already in a
difficult financial position having depleted their reserves and exhausted their bus assets. The bus
fleet is life-expired with about 40% of the large-bus fleet being already 16 or more years of age, and
only 5% of the large-bus fleet being 10 or less years old.
The ongoing TA is assisting the Ministry of Transport and the bus operator sector to develop a
strategy for strengthening the sector, which at a minimum will require strengthening of the finances
to be able to afford the urgent fleet renewal. One strand of this considers means of restructuring the
industry sector so that it can achieve system-wide efficiencies, and economies of scale. Other
strands are needed to focus on practical measures to achieve technical and operational efficiencies,
and help in the reduction of unit costs.
Since fuel is the largest expense item, it needs to be a focus of special attention. Some economies
can be made through network design to optimize the kilometers operated, while other measures
could pay attention to the elimination of fuel-inefficient practices. One area of potentially radical
change is to examine whether changes in the fuel type would provide significant benefit. Over the

Energy Efficiency and Security for Public Transport Report – October 2009 11
last decade, many Chinese and Indian bus operators have converted their fleets to gas (CNG or LPG),
and to a lesser extent European and North American operators have done so. At the regional level,
Israeli operator Egged has begun using CNG. There are also trends to increasing use of blended
fuels, biofuels, and ‘clean diesel’. These changes have been stimulated by expected benefits in fuel
costs, security of fuel supply, fuel efficiency, and cleaner emissions.
This Study supports the TSN and the ongoing TA by exploring the options for the use of alternative
fuels in the bus operator sector in West Bank and Gaza, and carrying out an initial examination of the
potential benefits and practicality of implementation.

Energy Efficiency and Security for Public Transport Report – October 2009 12
3 REVIEW OF ALTERNATIVE FUELS BUS PATHWAYS
3.1 INTRODUCTORY REMARKS
Energy and pollution are increasingly important; because of sky-rocketing fuel prices a few months ago
and high fuel price volatility, international organizations and governments are prone to foster energy–
saving programs. Local pollution has a direct impact on the health whereas global pollution -
greenhouse gases, in particular CO2 - is now one of the main challenges in terms of climate change.
Therefore, most countries introduce more stringent regulations in relation with energy and pollution
challenges, especially in the transport sector.
As an example, the European Commission has established pollution regulations in the transport sector
for buses; USA and Japan adopted similar regulations. Other middle-income countries such as India,
China and Russia have launched similar regulations; a few of these countries, such as China, adopted
the European regulations.
3.1.1 LOCAL AIR POLLUTANTS: EURO NORMS
For the past 15 years, these more drastic regulations have been the main drivers for bus
manufacturers to look for new alternative fuels technologies. In Europe, the second petroleum crisis
(years 90’) and the social impact of local pollution were the main two incentives that stimulated
introducing new types of buses (EURO norms). Set by the European Commission, the EURO norms
stipulate the maximum pollutant authorized in gram per KWh. The table 1 below shows the maximum
emission of each pollutant (in grams per Kwh) for each EURO norm.
Table 1: Maximum Emission Limits (grams per KWh)
NORM EURO 0 EURO 1 EURO 2 EURO 3 EURO 4 EURO 5
YEAR 1988-92 1993-96 1996-00 2000-06 2006-09 2009 -
CO 11.2 4.5 4 2.1 1.5 1.5
NOx 14.4 8 7 5 3.5 2
HC 2.4 1.1 1.1 .66 .46 .25
PARTICLES No limit .36 .15 .1 .02 .02
NB: These norms are gathered with special conditions. The emissions are measured on an engine
bench, with load and RPM steady conditions (different levels).
It is important to bear in mind that the EURO norms were introduced progressively; the EURO
thresholds are increasingly difficult to reach and the allocated time to do so is decreasing. As an
example, the delay to move from Euro0 to Euro1 was approximately 6 years and the reduction quite
‘easy’ to obtain. However, for the conversion from Euro3 to Euro4 and Euro5, the delay was only 5
years and the reduction was much more difficult to reach.
Table 1 above shows the emission reduction that should be obtained over 20 years with the EURO 0 to
EURO 5 implementation. The reduction in fuel emissions is around 1/10 for all the regulated pollutants.
Energy Efficiency and Security for Public Transport Report – October 2009 13
Of course, these results need new technologies within the engine and on-board devices, which are able
to obtain positive results for specific pollutants. For EURO5, all the engines require the 1De NO x
systems (SCR2 or EGR3) to pass the norms. Most of the European manufacturers use the SCR system,
which adds some additive to reduce the NO x emissions.
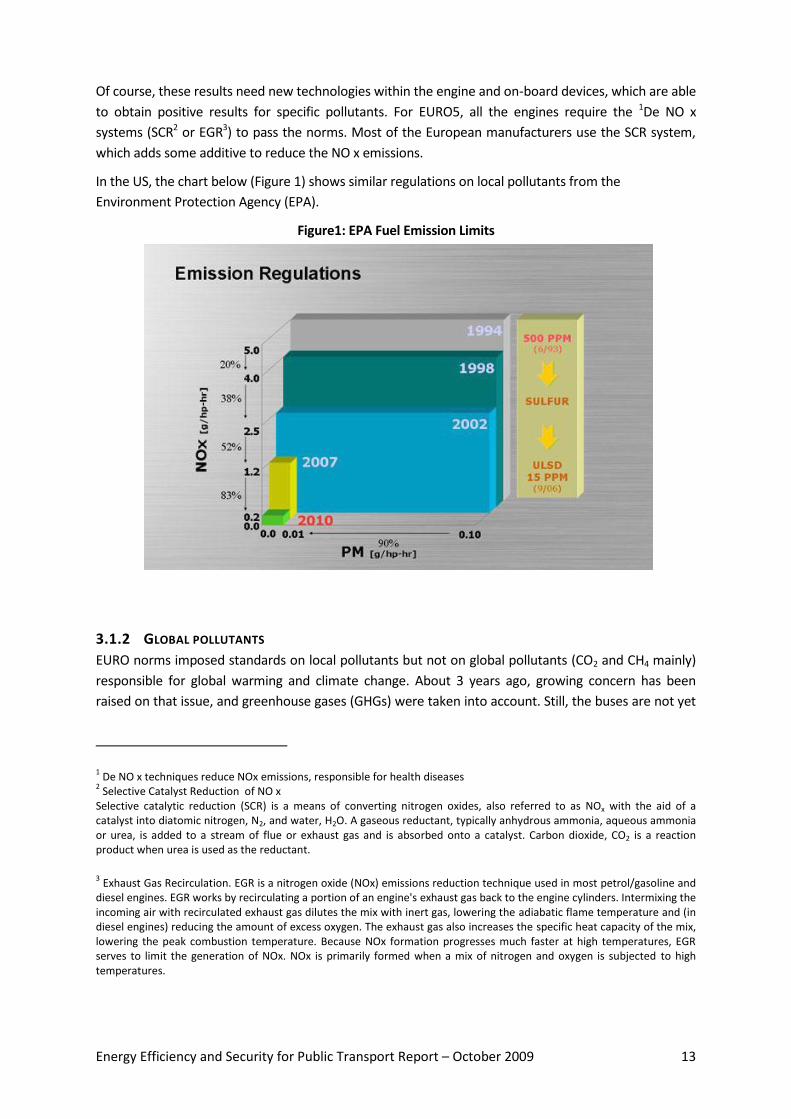
In the US, the chart below (Figure 1) shows similar regulations on local pollutants from the
Environment Protection Agency (EPA).
Figure1: EPA Fuel Emission Limits
3.1.2 GLOBAL POLLUTANTS
EURO norms imposed standards on local pollutants but not on global pollutants (CO2 and CH4 mainly)
responsible for global warming and climate change. About 3 years ago, growing concern has been
raised on that issue, and greenhouse gases (GHGs) were taken into account. Still, the buses are not yet
1 De NO x techniques reduce NOx emissions, responsible for health diseases
2 Selective Catalyst Reduction of NO x
Selective catalytic reduction (SCR) is a means of converting nitrogen oxides, also referred to as NOx with the aid of a catalyst into diatomic nitrogen, N2, and water, H2O. A gaseous reductant, typically anhydrous ammonia, aqueous ammonia or urea, is added to a stream of flue or exhaust gas and is absorbed onto a catalyst. Carbon dioxide, CO2 is a reaction product when urea is used as the reductant.
3 Exhaust Gas Recirculation. EGR is a nitrogen oxide (NOx) emissions reduction technique used in most petrol/gasoline and
diesel engines. EGR works by recirculating a portion of an engine's exhaust gas back to the engine cylinders. Intermixing the incoming air with recirculated exhaust gas dilutes the mix with inert gas, lowering the adiabatic flame temperature and (in diesel engines) reducing the amount of excess oxygen. The exhaust gas also increases the specific heat capacity of the mix, lowering the peak combustion temperature. Because NOx formation progresses much faster at high temperatures, EGR serves to limit the generation of NOx. NOx is primarily formed when a mix of nitrogen and oxygen is subjected to high temperatures.
Energy Efficiency and Security for Public Transport Report – October 2009 14
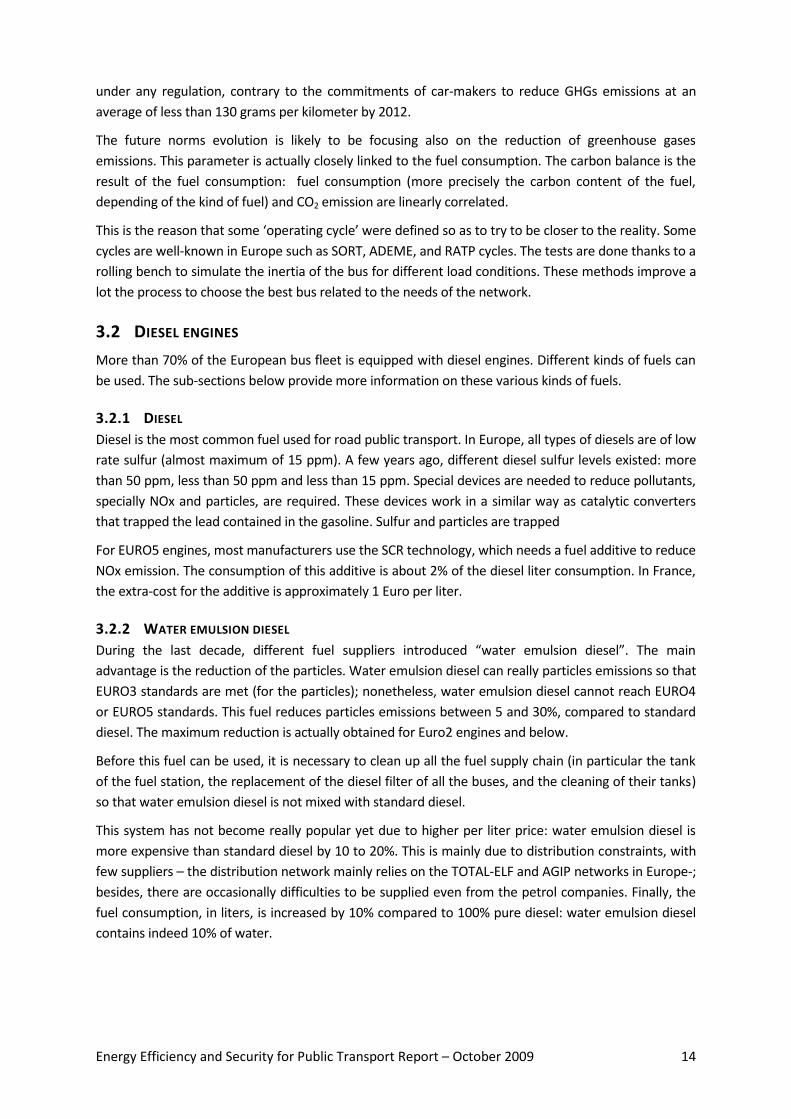
under any regulation, contrary to the commitments of car-makers to reduce GHGs emissions at an
average of less than 130 grams per kilometer by 2012.
The future norms evolution is likely to be focusing also on the reduction of greenhouse gases
emissions. This parameter is actually closely linked to the fuel consumption. The carbon balance is the
result of the fuel consumption: fuel consumption (more precisely the carbon content of the fuel,
depending of the kind of fuel) and CO2 emission are linearly correlated.
This is the reason that some ‘operating cycle’ were defined so as to try to be closer to the reality. Some
cycles are well-known in Europe such as SORT, ADEME, and RATP cycles. The tests are done thanks to a
rolling bench to simulate the inertia of the bus for different load conditions. These methods improve a
lot the process to choose the best bus related to the needs of the network.
3.2 DIESEL ENGINES
More than 70% of the European bus fleet is equipped with diesel engines. Different kinds of fuels can
be used. The sub-sections below provide more information on these various kinds of fuels.
3.2.1 DIESEL
Diesel is the most common fuel used for road public transport. In Europe, all types of diesels are of low
rate sulfur (almost maximum of 15 ppm). A few years ago, different diesel sulfur levels existed: more
than 50 ppm, less than 50 ppm and less than 15 ppm. Special devices are needed to reduce pollutants,
specially NOx and particles, are required. These devices work in a similar way as catalytic converters
that trapped the lead contained in the gasoline. Sulfur and particles are trapped
For EURO5 engines, most manufacturers use the SCR technology, which needs a fuel additive to reduce
NOx emission. The consumption of this additive is about 2% of the diesel liter consumption. In France,
the extra-cost for the additive is approximately 1 Euro per liter.
3.2.2 WATER EMULSION DIESEL
During the last decade, different fuel suppliers introduced “water emulsion diesel”. The main
advantage is the reduction of the particles. Water emulsion diesel can really particles emissions so that
EURO3 standards are met (for the particles); nonetheless, water emulsion diesel cannot reach EURO4
or EURO5 standards. This fuel reduces particles emissions between 5 and 30%, compared to standard
diesel. The maximum reduction is actually obtained for Euro2 engines and below.
Before this fuel can be used, it is necessary to clean up all the fuel supply chain (in particular the tank
of the fuel station, the replacement of the diesel filter of all the buses, and the cleaning of their tanks)
so that water emulsion diesel is not mixed with standard diesel.
This system has not become really popular yet due to higher per liter price: water emulsion diesel is
more expensive than standard diesel by 10 to 20%. This is mainly due to distribution constraints, with
few suppliers – the distribution network mainly relies on the TOTAL-ELF and AGIP networks in Europe-;
besides, there are occasionally difficulties to be supplied even from the petrol companies. Finally, the
fuel consumption, in liters, is increased by 10% compared to 100% pure diesel: water emulsion diesel
contains indeed 10% of water.

Energy Efficiency and Security for Public Transport Report – October 2009 15
3.2.3 BIO DIESEL
Biodiesel is a mixture of diesel and another organic compound. “B30” is a mixture of 430% ethanol and
70% diesel. “Diester” is another biodiesel which contains around 30% of ester (as an example: natural
oil form soybean) and 70% of diesel. Almost all standard diesel engines can work with biodiesels as
experiences show that the rubber or plastic joints and seals present in diesel engines are not affected
by the organic compound. Most diesels in Europe contain some bio-diesel (from1 to 5%, depending on
countries]. The fuel consumption in liter is equivalent to the 100% pure diesel. Table 2 shows
comparison of characteristics of the DIESTER and Diesel products.
Table 2: Comparison between Diesel and DIESTER
Characteristics Diester Diesel
Density (15°C) 0.88 0.83 to0.86
Flash point (°C) 188 > 55
Cetane Index 51 Around 51
Filterability limit temperature (°C) -12 to -15 < -15
Calorific value (MJ/liter) 33.2 35.3 to 36.3
Viscosity (40°C) (mm/s) 4.5 2 to 4.5
Oxygen 11% 0
Source: web site www.partenaires-diester.fr
The bio-diesel main advantage is that the greenhouse gas effect (CO²) is reduced thanks to the use of
vegetable products, which are considered as neutral to the CO² emission balance.
3.2.4 ETHANOL
Ethanol can be produced from sugar cane and sugar beets, as well as from cereals and biowaste. The
technology is developing continuously. Recent findings include technologies for producing ethanol
from cellulose and burning the residual products in district heating or electricity generating plants.
The main advantage concerns the greenhouse effect, thanks to the production of this fuel from
vegetable or crops.
Current interest in ethanol mainly lies in bio-ethanol, produced from the starch or sugar in a wide
variety of crops, but there has been considerable debate about how useful bio-ethanol will be in
replacing fossil fuels in vehicles. Concerns relate to the large amount of arable land required for crops,
as well as the energy and pollution balance of the whole cycle of ethanol production. Recent
developments with cellulosic ethanol production and commercialization may allay some of these
concerns.
Today, only the bus manufacturer SCANIA offers this option but the latest information is that SCANIA
will stop this pathway in Europe, this information should be confirmed. The engine is based on a Diesel
one with the adjunction of an ignition improver. At this moment, in Europe, the ethanol-run bus fleet is
quite small (Sweden and a little Poland).
4 B30: commercial name of a mixture of diesel and ethanol; with 5% ethanol this mixture is called DIESTER.

Energy Efficiency and Security for Public Transport Report – October 2009 16
Stockholm Public Transport Authority introduced ethanol buses in the city bus fleet in the middle of
1980's. The Stockholm fleet has now expanded to 400 buses, the goal being to reach 50% of renewable
bus fuels in 2011 and 100% in 2025. In addition, ethanol-fuelled buses are run in other Swedish cities.
Since 2004, ethanol buses have been introduced in several other cities, such as: Madrid (Spain), La
Spezia (Italy), Slupsk (Poland), and Sao Paolo (Brazil). New generation ethanol buses (from Scania) have
been recently introduced in Oslo (Norway), Nottingham and Redding (UK), Milan (Italy), and Östersund
(Sweden).
Further information about ethanol and ethanol-run engines for buses can be found on the
www.ethanolbus.com website, which most of the above information stems from.
3.2.5 FACILITIES FOR DIESEL ENGINES
Diesel maintenance depot
Diesel buses are the most common standard. Therefore, virtually all bus operators, bus networks
managers or bus importers have the appropriate workshops to maintain diesel buses.
Nevertheless, it is useful to point out specific equipments are required so as to keep the more
technologically-advanced buses properly maintained. Additional facilities and equipment are indeed
needed for Euro3 and Euro4 buses: specific diagnosis equipments to communicate with the engine
through the 5‘CAN’ system and others items are required. Especially, it is recommended to have at
least the smoke tester and gas analyzer to check emissions on a continuous basis. The fuel injection
system needs to be tuned up. These devices costs range from 15-KEuros to 50-KEuros.
Diesel fuel station
Whenever different diesel fuels are used, different specific tanks are required; this entails extra space,
extra logistics management and extra costs. Bus refueling has to be carefully managed and handled so
that each kind of fuel is supplied and each category of engine is fuelled with the appropriate diesel.
3.3 OTTO ENGINES
Generally speaking, “Otto engines” are engines that need to have an ignition to trigger the
combustion; reversely, diesel engines need not ignition and combustion is triggered by compression.
LPG, CNG and LNG engines are Otto engines.
The efficiency of Otto engines is lesser than that of diesel engines. The main reasons to use Otto
engines are either to valorize oil sub-product form refineries (e.g.: Liquid Petroleum Gas), or reduce
some air pollutants. In the early nineties, Otto engines appeared to suppress particles emissions and to
curb NOx emissions, in comparison with Diesel uses. Two main fuels are used for Otto buses engines:
(i) Liquid Petroleum Gas (LPG) which is a mixture of Butane (C4H10) and Propane (C3H8), and (ii)
Methane (CH4). Methane either comes from natural gas (compressed on liquefied) or from the
biomass production.
5 Controller Area Network. It allows all diagnosis and shows the calibration of the main parameters used for the engine and
others components
Energy Efficiency and Security for Public Transport Report – October 2009 17
3.3.1 LIQUID PETROLEUM GAS (LPG)
LPG is a by-product of the oil-refining process. Some countries promote LPG as a transport fuel for the
cars, lorries and buses. The main market is in fact private cars, since car retrofitting for LPG is quite
easy: adding a specific tank and mechanical or electronic (today 100%) fuel injections system. Almost
all the cars are now considered as Bi-fuels, which means they are able to run either with gasoline or
LPG.
For buses application, there is a large difference with the conversion of the cars which use Otto engine
as a standard. In fact the bus manufacturer must develop Otto engines instead of diesel. This
conversion cannot be done like for cars, through mechanical networks.
Compared to the Diesel the economy is in fact more related to the price difference of the fuels, than
the efficiency of the engines, The LPG engine is not so efficient than the Diesel engine.
This is the main reason, that for buses, a few manufacturers (DAF and MAN) introduced LPG engines.
MAN has proposed this option for buses for three years only.
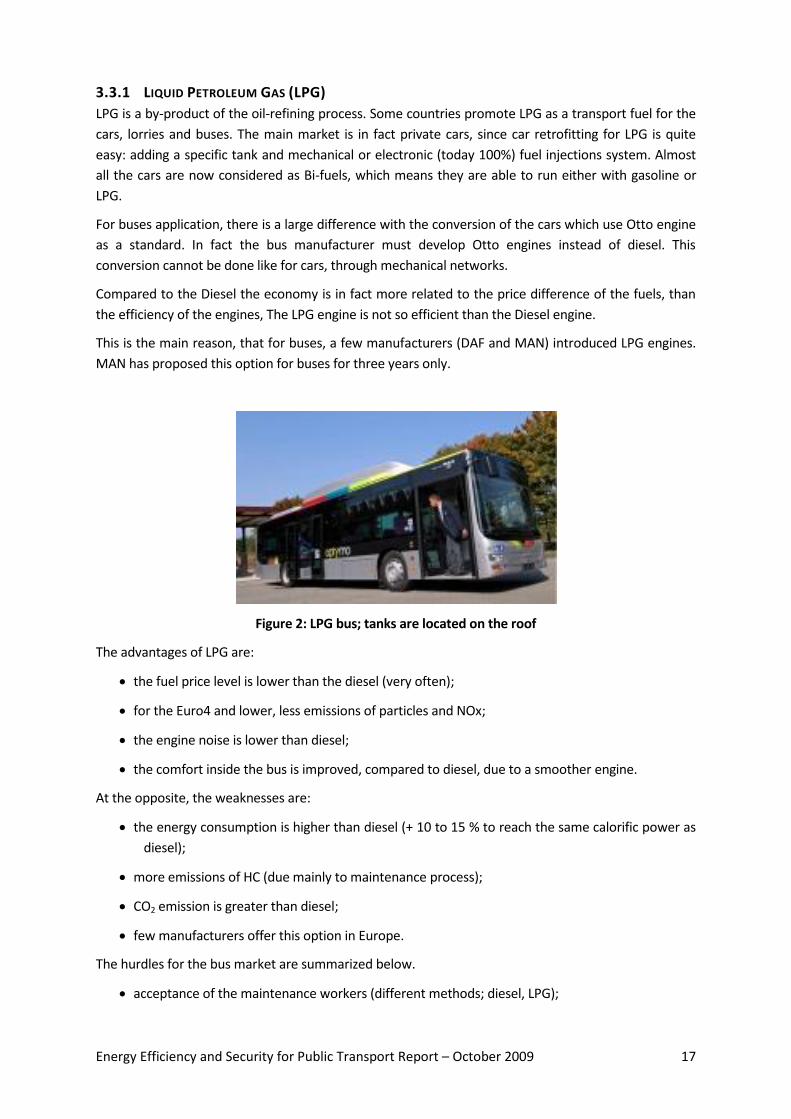
Figure 2: LPG bus; tanks are located on the roof
The advantages of LPG are:
the fuel price level is lower than the diesel (very often);
for the Euro4 and lower, less emissions of particles and NOx;
the engine noise is lower than diesel;
the comfort inside the bus is improved, compared to diesel, due to a smoother engine.
At the opposite, the weaknesses are:
the energy consumption is higher than diesel (+ 10 to 15 % to reach the same calorific power as
diesel);
more emissions of HC (due mainly to maintenance process);
CO2 emission is greater than diesel;
few manufacturers offer this option in Europe.
The hurdles for the bus market are summarized below.
acceptance of the maintenance workers (different methods; diesel, LPG);

Energy Efficiency and Security for Public Transport Report – October 2009 18
The specific and drastic safety rules to handle the fuel and to organize the workshop. The
workshop will require specific devices such as gas extractors, inside parking places to avoid gas
accumulation on the ground in case of leakage;
the extra cost of a LPG station and, therefore, the longer investment payback time;
The time to refuel is a little longer than for the diesel;
The autonomy, which requires large and heavy tanks on board (the average consumption of LPG
is around 80 to 100 liters per 100 kilometers). Therefore, for a range of 400 kilometers, a tank
capacity of 600 liters is needed.
The economic balance between Diesel and LPG is really depending of the price of each fuel, and this
parameter may show great variations from one country to another. For example, in France, the unit
price of diesel is 0.8 EUR (without VAT, May 2009) per liter with a fuel consumption of 49 litres/100 km
compared to LPG price of 0.4 EUR with a consumption of 90 liters /100 km. Thus, the fuel cost per 100
km is 39.2 EUR for the diesel bus and 34 EUR for the LPG bus (data from the Laval and Belfort networks
– France).
There is no clear cut for the environmental comparison between LPG and diesel. Results depend on
which pollutant is considered: NOx, HC, CO and greenhouse gases emissions. The table 7 in chapter
2.7.6 gives the comparison of the emissions and consumption of the different pathways.
3.3.2 COMPRESSED NATURAL GAS (CNG)
“CNG” means Compressed Natural Gas (more that 90% CH4). This technique is used to improve the
energy density on board. The gas pressure inside the tank is 200 bars.
The natural gas offers several advantages, which are mainly:
A large potential for the future, the natural gas resources are more important than the petrol.
A clean fuel compared to the petrol related to the particles.
The natural gas is cheaper than diesel.
The international price is more stable thanks to many long term contracts between the
producers and the international customers.
For these reasons many bus manufacturers offer CNG option for their buses. The main differences with
the diesel bus are:
Replacement of the diesel tank by a CNG tanks (in fact, several bottles), which are able to support up
to 250 bars. The gas is in fact compressed in order to fulfill more gas and; therefore, to have a
reasonable autonomy (400 kilometers is the average). The weight of these tanks is from 400 to 1000
Kg. The tanks are very often located on the roof of the buses. The roof is consolidated to receive this
over weight (see Figure 3).

Energy Efficiency and Security for Public Transport Report – October 2009 19
Figure 3: CNG Bus
The bus refueling may be operated like the diesel is or ‘on the parking’ during off operation periods (at
night).
The advantages of the CNG are:
The price level is lower than the diesel (very often);
For Euro5 engines and lower: less emissions of particles and NOx ;
The engine noise is lower than diesel ;
The comfort inside the bus is improved, compared to diesel, due to a smoother engine.
Conversely, the weaknesses are:
The energy consumption is higher than the diesel;
There are usually more HC emissions (mainly because of to maintenance capability). In fact the
mechanicals do not pay attention that there is no smoke and they think there is no need of
tune up, therefore, the calibration may deviate, and the emissions should be more important
than the normal one.
CO2 emission is greater than diesel,
The over weight of the bus.
The main hurdles for the bus industry:
Possible reluctance from maintenance workers to accept CNG buses because of different
methods compared to diesel;
More drastic safety rules for the fuel and the workshop. This includes the installation of some
specific devices such as gas extractors in the workshop and inside parking places to avoid (in
case of leakage of gas) gas accumulation at the upper locations.
Over costs and, therefore, longer payback time of the CNG station;
Lower autonomy, which requires large and heavy tanks on board (800 kilograms for a 400 km
range) to be made up for.

Energy Efficiency and Security for Public Transport Report – October 2009 20
3.3.3 LIQUID NATURAL GAS (LNG)
LNG means Liquid Natural Gas (mainly CH4). This technique requires a cryogenic tank to keep the
natural gas at a temperature range of -160°C. Liquefied natural gas takes up about 1/600th the volume
of natural gas at an atmospheric condition.
Compared to the CNG, this option offers a similar autonomy to the diesel engine with a tank of 250
liter capacity (400 liter capacity of the CNG fuel to have the same autonomy).
The cost of this option is really expensive due to (i) the very particular fuel station, and (ii) the specific
tanks able to keep the gas liquid (very well insulated system), for some hours of parking. In fact very
few bus applications are currently in operation. With the current technology, there is not really any
objective advantage to pay much more and to support a maintenance process that is more extensive
than the CNG option.
We do not recommend at all this option taking into account the context of this study.
3.3.4 BIOGAS
The biogas could be either CNG or LNG and the consequences in terms of fuel consumption and
emissions are the same as described above. The difference is that biogases derive from the valorization
of the vegetable waste, and not fossil materials. Therefore, biogases are really positive for both energy
independence aspect and CH4 effect. In fact the positive impact compared to the natural gas is the CO2
emission because most of the processes are CO2 neutral. Actually, the CH4 (methane) is produced from
vegetable or/and waste products which through the fermentation of the products produce the gas.
The profitability is concerned through the investment of the methane production unit and the tax level
of this fuel, which is conducted to the price of the gas compared to CNG/LNG.
Some countries such as Sweden, Poland and France push biogas with tax exemptions and sometimes
agree to give incentive or subsidies to launch the production units.
3.3.5 FACILITIES FOR LPG ENGINES
Safety concerns with LPG
Operating LPG requires many changes in the daily bus operation, procedures and habits. Hence, it is
likely that maintenance workers will be reluctant to switch to LPG. Indeed, for safety reasons, it is
forbidden to smoke in any workshop where LPG is operated. When some parts of a bus must be
welded, it is important to check before welding that there is no gas leakage.
Changing these habits and procedures require time and complementary training, for instance
regarding the specific maintenance procedures, different from those of a diesel engine. LPG engines
specificities include: the ignition system calibration, the gas injection system and the checking of gas
leakage of gas from the tank to the engine.
LPG maintenance depot
The maintenance of LPG engines requires to have at least 4 gas analyzers, an ignition control system,
and to check all the safety devices needed to detect any leakage of gas. The minimum installation is
therefore al the electrical plus must be ‘anti –detonation’, to avoid any inspection pit closed to the
place where the LGP bus should be repaired, to have electrical fans to ventilate the air outside of the
inner place, and at last to have a ‘light _sound’ alarm connected to a level gas gauge. Ideally, it is
recommended to have electrical doors, which are connected with the gas sensor. The cost starts from
Energy Efficiency and Security for Public Transport Report – October 2009 21
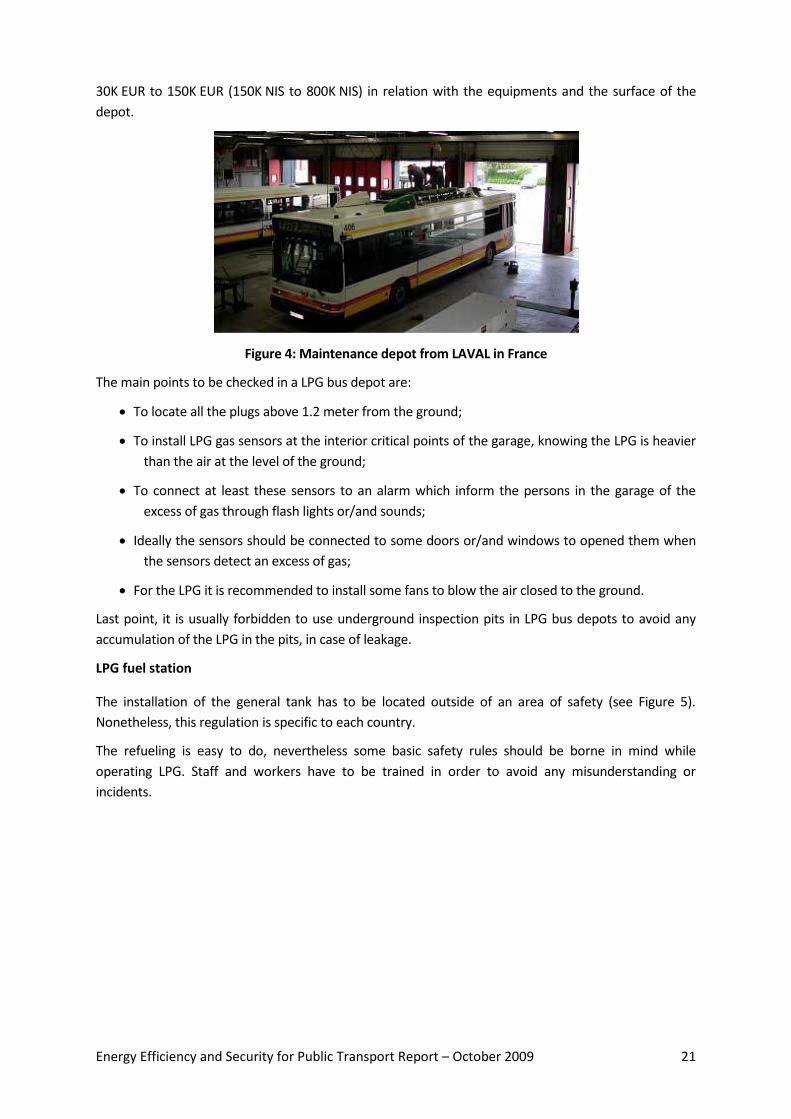
30K EUR to 150K EUR (150K NIS to 800K NIS) in relation with the equipments and the surface of the
depot.
Figure 4: Maintenance depot from LAVAL in France
The main points to be checked in a LPG bus depot are:
To locate all the plugs above 1.2 meter from the ground;
To install LPG gas sensors at the interior critical points of the garage, knowing the LPG is heavier
than the air at the level of the ground;
To connect at least these sensors to an alarm which inform the persons in the garage of the
excess of gas through flash lights or/and sounds;
Ideally the sensors should be connected to some doors or/and windows to opened them when
the sensors detect an excess of gas;
For the LPG it is recommended to install some fans to blow the air closed to the ground.
Last point, it is usually forbidden to use underground inspection pits in LPG bus depots to avoid any
accumulation of the LPG in the pits, in case of leakage.
LPG fuel station
The installation of the general tank has to be located outside of an area of safety (see Figure 5).
Nonetheless, this regulation is specific to each country.
The refueling is easy to do, nevertheless some basic safety rules should be borne in mind while
operating LPG. Staff and workers have to be trained in order to avoid any misunderstanding or
incidents.
Energy Efficiency and Security for Public Transport Report – October 2009 22
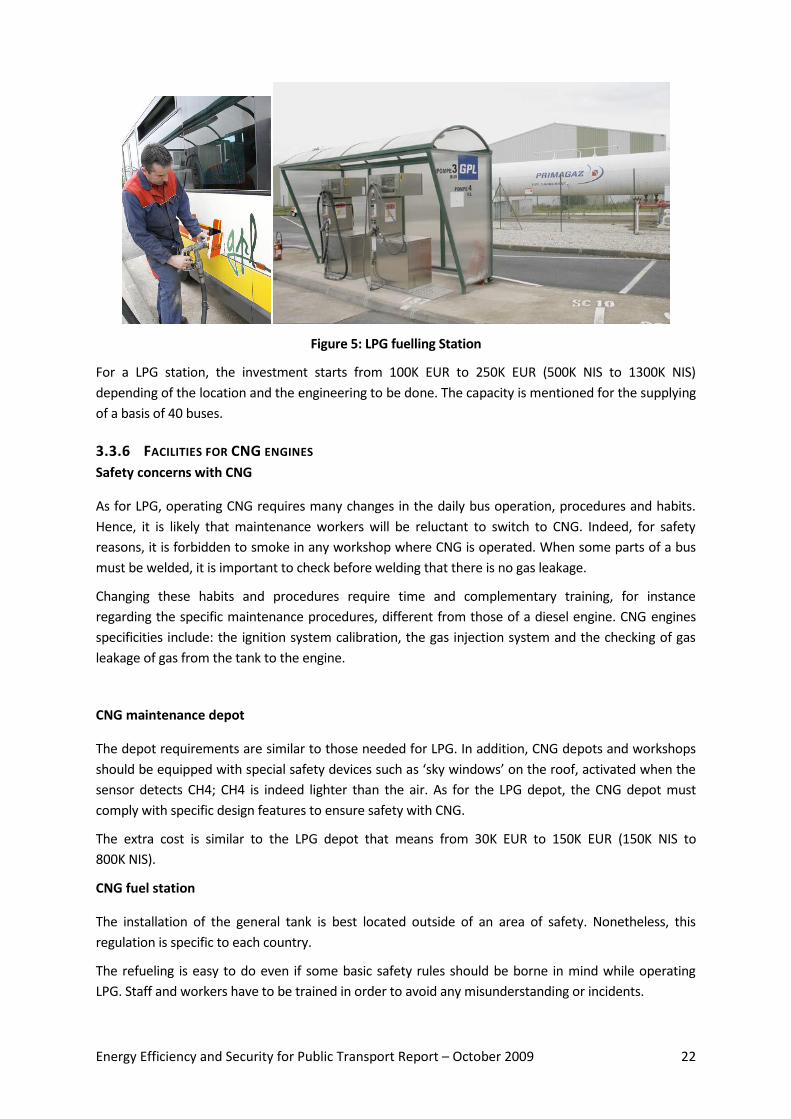
Figure 5: LPG fuelling Station
For a LPG station, the investment starts from 100K EUR to 250K EUR (500K NIS to 1300K NIS)
depending of the location and the engineering to be done. The capacity is mentioned for the supplying
of a basis of 40 buses.
3.3.6 FACILITIES FOR CNG ENGINES
Safety concerns with CNG
As for LPG, operating CNG requires many changes in the daily bus operation, procedures and habits.
Hence, it is likely that maintenance workers will be reluctant to switch to CNG. Indeed, for safety
reasons, it is forbidden to smoke in any workshop where CNG is operated. When some parts of a bus
must be welded, it is important to check before welding that there is no gas leakage.
Changing these habits and procedures require time and complementary training, for instance
regarding the specific maintenance procedures, different from those of a diesel engine. CNG engines
specificities include: the ignition system calibration, the gas injection system and the checking of gas
leakage of gas from the tank to the engine.
CNG maintenance depot
The depot requirements are similar to those needed for LPG. In addition, CNG depots and workshops
should be equipped with special safety devices such as ‘sky windows’ on the roof, activated when the
sensor detects CH4; CH4 is indeed lighter than the air. As for the LPG depot, the CNG depot must
comply with specific design features to ensure safety with CNG.
The extra cost is similar to the LPG depot that means from 30K EUR to 150K EUR (150K NIS to
800K NIS).
CNG fuel station
The installation of the general tank is best located outside of an area of safety. Nonetheless, this
regulation is specific to each country.
The refueling is easy to do even if some basic safety rules should be borne in mind while operating
LPG. Staff and workers have to be trained in order to avoid any misunderstanding or incidents.

Energy Efficiency and Security for Public Transport Report – October 2009 23
Two types of CNG fuel station are possible. The first type is similar to the LPG or Diesel (see Figure 6);
refueling is done bus per bus.
Figure 6: CNG station similar to a fuel diesel station (Creteil depot – France)
The second type of fuel station is called ‘slow refueling’, and each bus (when parked) has an individual
fuel connection to be plugged. This system is cheaper but its operation has to be explained properly to
the staff to avoid missing the connection. The most convenient place is an ‘open space’ to avoid
possible leakage and moving buses (see Figure 7).
Figure 7: “Low refueling” CNG stations (Montpellier depot)

Energy Efficiency and Security for Public Transport Report – October 2009 24
Each bus is connected during the non-operating time to the grid and all the buses are refueled. The
refueling time requires at least 5 to 6 hours. The main constraint is to have a large space to park all the
CNG buses. It is recommended to have this place close to the operated routes to avoid dead trips.
Details of the compression units of the CNG tanks are shown in Figure 8 below.
Figure 8: Details of the compression units and CNG tanks
The investment for a slow refueling station is around 250K EUR (1250K NIS) for 20-bus capacity. For
example, the Toulouse network (France) invested 2 million EUR (10 millions NIS) for a 100-bus capacity
‘slow refueling' station. The average cost for a quick refueling system for a capacity of 40 buses is
around 1 million EUR (5 million NIS).
3.4 ELECTRICAL ENGINES
The power is provided through electric batteries. Main batteries technologies are :
Lead-acid batteries are the most available and inexpensive. Electric vehicles equipped with lead-
acid batteries are capable of up to 130 km per charge.
Nickel Metal Hybrid (NiMH) batteries have higher energy density and may deliver up to 200 km
of range.

Energy Efficiency and Security for Public Transport Report – October 2009 25
New lithium-ion battery-equipped electrical vehicles provide 320–480 km of range per charge.
Lithium is also less expensive than nickel. Today this technology is only focused on car
applications.
Nickel-zinc battery is cheaper and lighter than Nickel-cadmium batteries. They are also cheaper
(but not as light) as Lithium-Ion batteries.
Two kinds of batteries recharging methods are used.
In the first method, the batteries remain on board. While parked, the bus is connected for recharging
to the electrical grid through plugs. This system is similar to the low fuelling CNG system and several
buses can be connected at the same time.
Figure 9: Electrical plug to charge the batteries
The second method is sometimes called ‘swapping system’; once discharged, the batteries rack is
removed from the bus and replaced with charged batteries.
Figure 10: Pack of removable batteries

Energy Efficiency and Security for Public Transport Report – October 2009 26
Figure 11 : Electric bus Elfo EPT model
For the moment, most buses with 100% electrical engines through batteries are small or medium
buses. Very few standard buses (12 meter length) are available. All the networks operating on
electrical engines are for very short trips and for inner city routes. The European fleet is concentrated
in few cities where the city centers have to be pollution and noise free (tourist areas).
The weak points of the electrical engines are:
The price of the battery related to the life time; the batteries initial cost can reach 100k EUR per
bus with life-times usually comprised between 5 to 6 years.
The supply of energy depends on electricity station and/or the battery set on board. For
example the duration to fulfill the batteries should need up to 10 hours. When the batteries
are part of the buses, the buses need to be plugged to the electricity grid during all this time.
The relatively low autonomy of affordable batteries (from 80 to 150 kilometers);
The over cost of this pathway for the mini and midi bus, compared to diesel or CNG;
The lack of offer for standard buses;
The maintenance of the propulsion system, which induces extra operational costs.
This pathway is very specific has not to be evaluated for the aims of this study, focusing mostly on
intercity services.
3.5 HYBRID ENGINES
The principle of the hybrid bus is to have a small combustion engine and an electrical engine supplied
through batteries. The purpose of this combination aims at reducing both fuel consumption and
pollution. Saving rely on a smaller combustion engine, running if possible within better conditions of
load and RPM than conventional propulsion. The additional power is provided through the electrical
power.
There are different schemes of hybrid propulsion, the most offered for bus application is the “serie-
hybrid”. The combustion engine (e.g.: diesel) runs and, through a generator, supplies the batteries; the
electrical engine is connected to the batteries and to the power train. The electrical engine also acts as
an engine brake (electric retarder) and is able to regenerate energy from the deceleration.
The advantages are: (i) downsizing the combustion engine (from around 1000kg to 400kg), (ii) better
running conditions (stable RPM and load) and, thus, better efficiency, and (iii) energy recovery during

Energy Efficiency and Security for Public Transport Report – October 2009 27
the deceleration and braking. When the vehicle brakes, energy which would normally be wasted is
recycled and used to charge the batteries. With continuous charging of the batteries, the vehicle can
achieve a larger operational range than a conventional diesel bus. Figure 12 shows the scheme of
hybrid engine.
Figure 12: Scheme of hybrid bus power train
Environmental benefits
When compared with the conventional EURO4 diesel buses, hybrid buses deliver considerable
environmental improvements:
From 15 to 50 per cent reduction in oxides of nitrogen;
From 20 to 60 per cent reduction in carbon monoxide;
From 20 to 40 per cent reduction in carbon dioxide;
From 15 to 30 per cent reduction in particles matter;
From 15 to 30 per cent reduction in perceived sound levels (noise reduced from 78dB to74dB).
The results show that these buses produce fewer greenhouse gas emissions and harmful local
pollutants, as well as having lower noise levels.
Energy benefits
From 20 to 40 per cent reduction in fuel use;
All type of fuel can be used for the thermal engine.
The present situation of these hybrid buses is mostly yet pre-series buses, even if more and more
manufacturers offer hybrid technologies. At this moment the over cost of purchasing is around 60%
more than the conventional bus. Moreover, the maintenance skills required are very high to afford as
well the conventional, the batteries, the electronic converter and the spare parts supplying.
For the reasons mentioned above, this type of bus is not included at this moment within the study
scope.
3.6 FUEL CELL ENGINES
The fuel cell technology is quite new for the bus applications. Therefore, we first give some indications
about the principles of the fuel cell.
Energy Efficiency and Security for Public Transport Report – October 2009 28
What is a fuel cell? (Source: Documents from Fuel cell bus club.)
A fuel cell is a device that separates hydrogen electrons with a catalyst to produce electricity. After this
process, the hydrogen combines with oxygen from the air to produce water and heat as by-products.
In a sense, a fuel cell is like a battery, using chemical reactions -- not combustion -- to change energy
stored in a fuel directly to electricity. Unlike a battery, a fuel cell can produce electricity continuously,
without needing to be recharged, as long as it is supplied with hydrogen. When fuelled with pure
hydrogen, a fuel cell emits no pollutants and no greenhouse gases.
How does it work?
The basic premise of a fuel cell is as follows: hydrogen (H2) flows toward one side of a catalyst-coated
plate (such as one covered with platinum). When the hydrogen comes in contact with the catalyst
plate, the proton slips through a plastic membrane. The hydrogen protons come in contact with
oxygen in the air to form water (H2O). The plastic membrane is too small for the hydrogen electrons to
pass through. Instead, the electrons are collected on an external circuit and provide electricity. Water
and heat are the only by-products of this electricity-generation if pure hydrogen is being used.
Fuel cell for buses
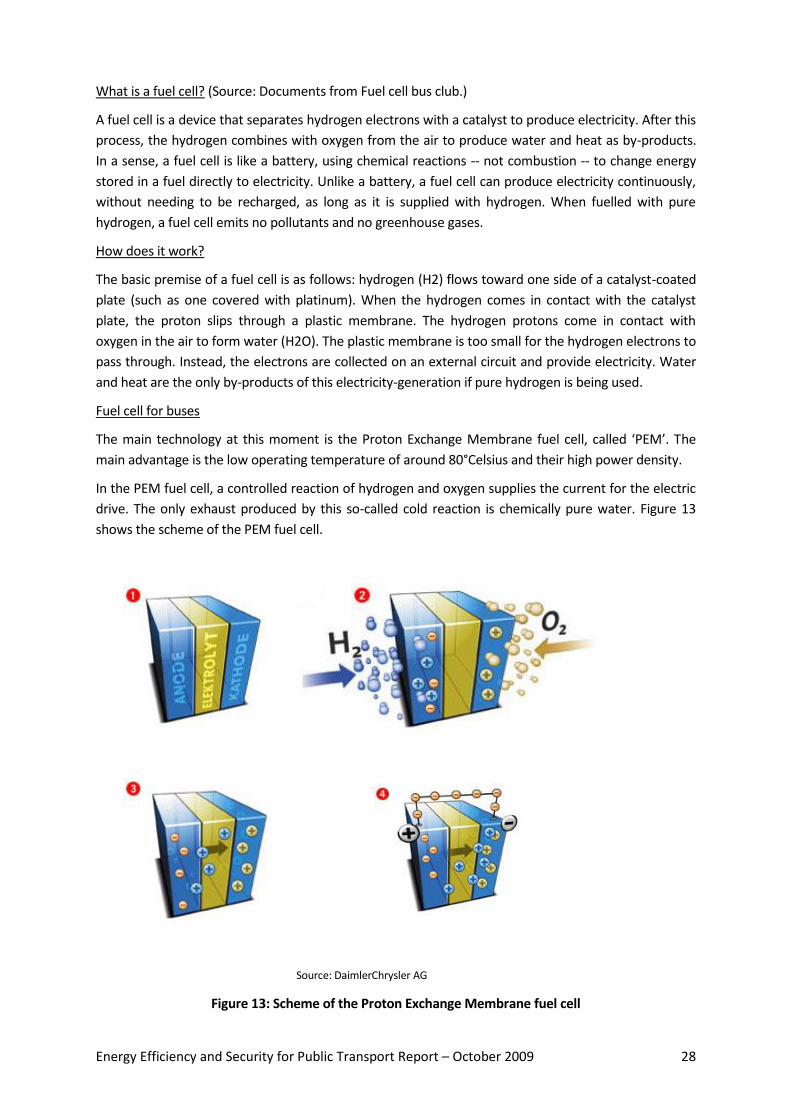
The main technology at this moment is the Proton Exchange Membrane fuel cell, called ‘PEM’. The
main advantage is the low operating temperature of around 80°Celsius and their high power density.
In the PEM fuel cell, a controlled reaction of hydrogen and oxygen supplies the current for the electric
drive. The only exhaust produced by this so-called cold reaction is chemically pure water. Figure 13
shows the scheme of the PEM fuel cell.
Source: DaimlerChrysler AG
Figure 13: Scheme of the Proton Exchange Membrane fuel cell
Energy Efficiency and Security for Public Transport Report – October 2009 29
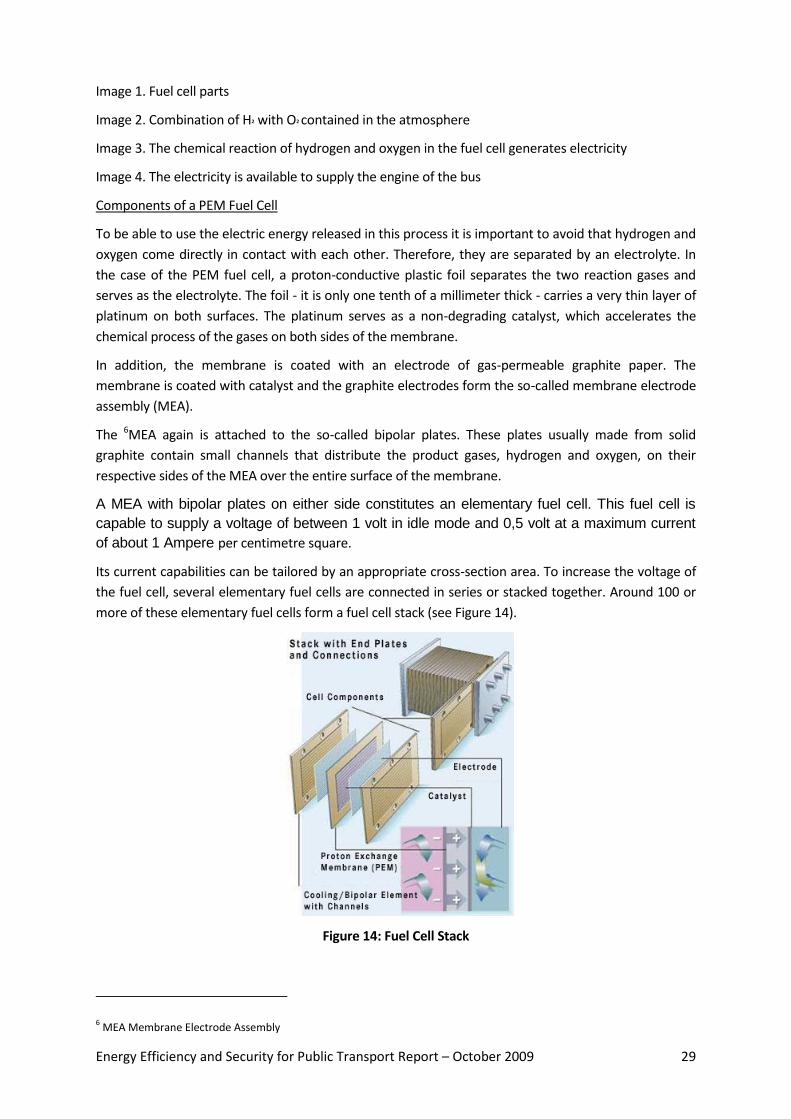
Image 1. Fuel cell parts
Image 2. Combination of H² with O² contained in the atmosphere
Image 3. The chemical reaction of hydrogen and oxygen in the fuel cell generates electricity
Image 4. The electricity is available to supply the engine of the bus
Components of a PEM Fuel Cell
To be able to use the electric energy released in this process it is important to avoid that hydrogen and
oxygen come directly in contact with each other. Therefore, they are separated by an electrolyte. In
the case of the PEM fuel cell, a proton-conductive plastic foil separates the two reaction gases and
serves as the electrolyte. The foil - it is only one tenth of a millimeter thick - carries a very thin layer of
platinum on both surfaces. The platinum serves as a non-degrading catalyst, which accelerates the
chemical process of the gases on both sides of the membrane.
In addition, the membrane is coated with an electrode of gas-permeable graphite paper. The
membrane is coated with catalyst and the graphite electrodes form the so-called membrane electrode
assembly (MEA).
The 6MEA again is attached to the so-called bipolar plates. These plates usually made from solid
graphite contain small channels that distribute the product gases, hydrogen and oxygen, on their
respective sides of the MEA over the entire surface of the membrane.
A MEA with bipolar plates on either side constitutes an elementary fuel cell. This fuel cell is
capable to supply a voltage of between 1 volt in idle mode and 0,5 volt at a maximum current
of about 1 Ampere per centimetre square.
Its current capabilities can be tailored by an appropriate cross-section area. To increase the voltage of
the fuel cell, several elementary fuel cells are connected in series or stacked together. Around 100 or
more of these elementary fuel cells form a fuel cell stack (see Figure 14).
Figure 14: Fuel Cell Stack
6 MEA Membrane Electrode Assembly

Energy Efficiency and Security for Public Transport Report – October 2009 30
In fact the fuel cell engine is the following of the hybrid except the ‘thermal’ engine is a fuel cell instead
of conventional engines. The fuel cell is the opposite of a cell that means from hydrogen the cell
produces energy combined with oxygen. For more explanation, the website www.fuelcells.org enters
more into the details.
The most well known program is CUTE and the following HyFLEET supported by the EC funding.
Several cities have implemented these buses. The approach of these programs is in fact to analyze the
operational conditions, the operative costs, and the different means to supply hydrogen. The results
are really very positive specially a high ratio of operative time. This is the reason of the new program,
which covers not only European cities but are linked to others continents.
Figure 15: Bus with Fuel Cells
The results related to the pollution is obviously clear, they is no more local pollution emissions,
including CO2. More details are available in the European Commission news papers (See Annexes).
At this stage, this technique is still a prototype application; the unit cost of each bus is around 2 million
EUR without the hydrogen fuel station facilities. This pathway is not considered within the scope of this
study.
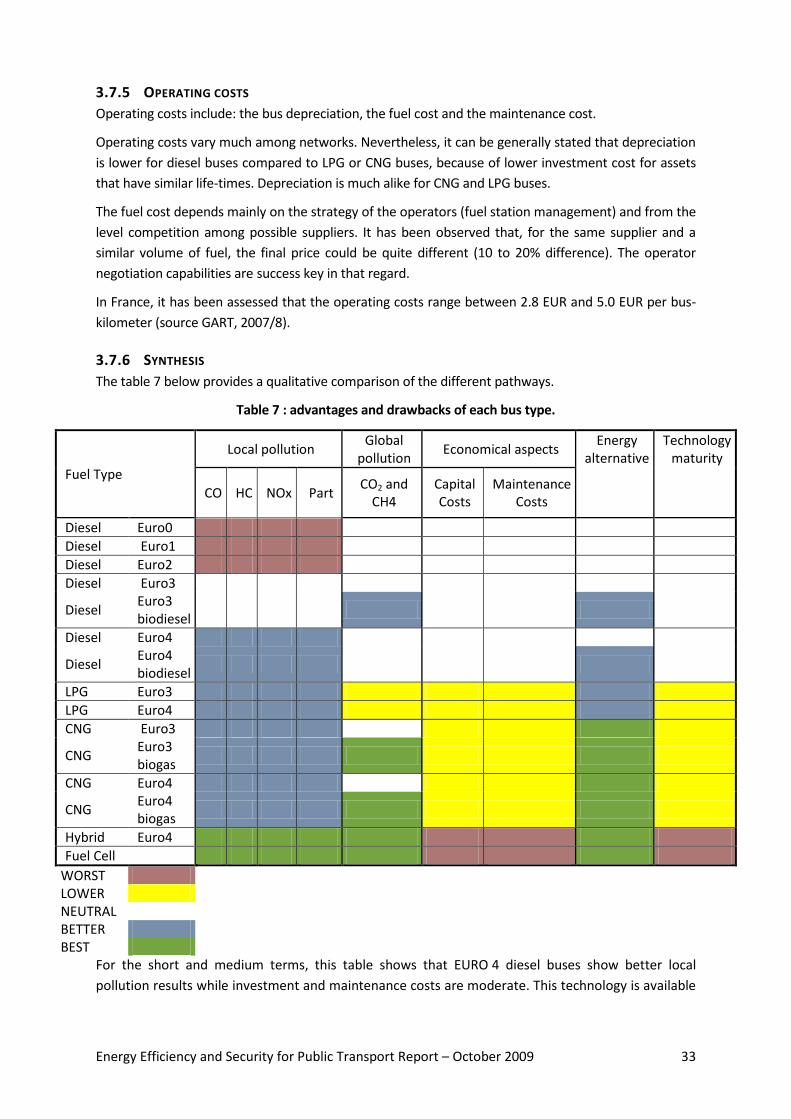
3.7 COMPARISON OF THE DIFFERENT TECHNOLOGIES
3.7.1 LOCAL AND GLOBAL EMISSIONS
From 7STARBUS and other experiments, the following table (Table 3) presents the actual average
measured pollutant emissions for several categories of buses. The emissions are given in grams per
kilometer. These data stem from various networks and different manufacturers. Measurements were
carried out in real conditions within the EU-funded STARBUS and COST 356 projects.
7 See the annex for the details of this European project
Energy Efficiency and Security for Public Transport Report – October 2009 31
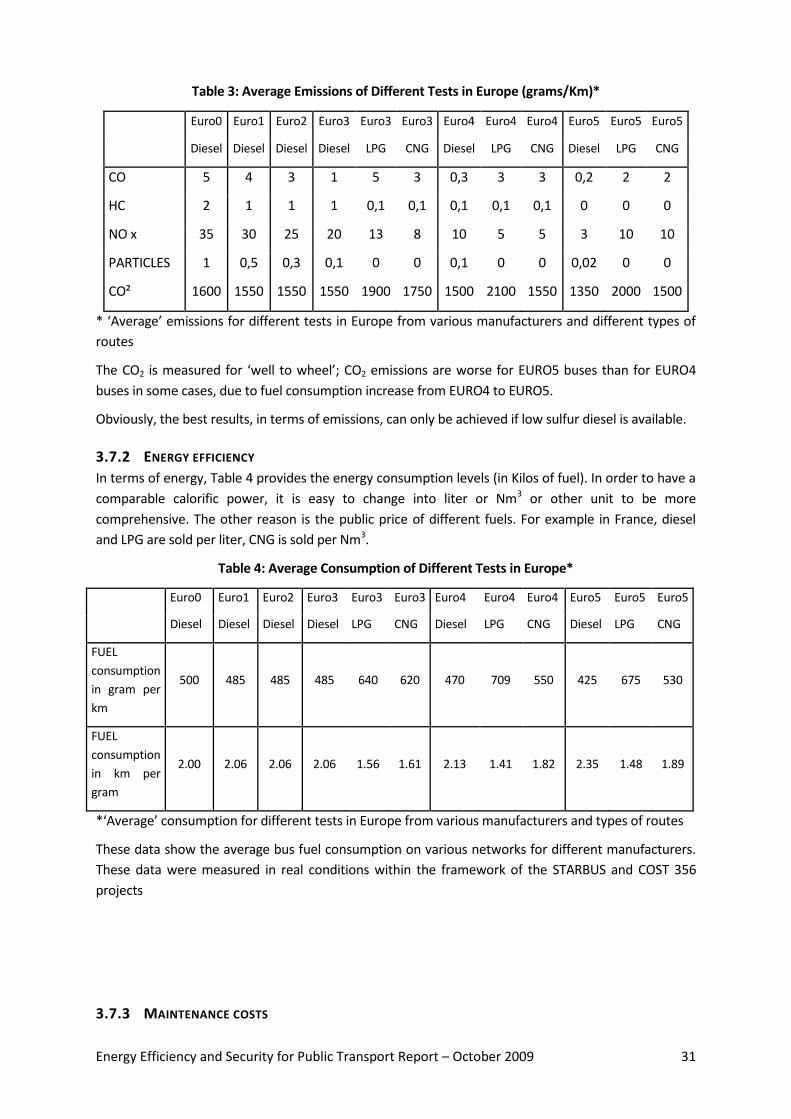
Table 3: Average Emissions of Different Tests in Europe (grams/Km)*
Euro0 Euro1 Euro2 Euro3 Euro3 Euro3 Euro4 Euro4 Euro4 Euro5 Euro5 Euro5
Diesel Diesel Diesel Diesel LPG CNG Diesel LPG CNG Diesel LPG CNG
CO 5 4 3 1 5 3 0,3 3 3 0,2 2 2
HC 2 1 1 1 0,1 0,1 0,1 0,1 0,1 0 0 0
NO x 35 30 25 20 13 8 10 5 5 3 10 10
PARTICLES 1 0,5 0,3 0,1 0 0 0,1 0 0 0,02 0 0
CO² 1600 1550 1550 1550 1900 1750 1500 2100 1550 1350 2000 1500
* ‘Average’ emissions for different tests in Europe from various manufacturers and different types of
routes
The CO2 is measured for ‘well to wheel’; CO2 emissions are worse for EURO5 buses than for EURO4
buses in some cases, due to fuel consumption increase from EURO4 to EURO5.
Obviously, the best results, in terms of emissions, can only be achieved if low sulfur diesel is available.
3.7.2 ENERGY EFFICIENCY
In terms of energy, Table 4 provides the energy consumption levels (in Kilos of fuel). In order to have a
comparable calorific power, it is easy to change into liter or Nm3 or other unit to be more
comprehensive. The other reason is the public price of different fuels. For example in France, diesel
and LPG are sold per liter, CNG is sold per Nm3.
Table 4: Average Consumption of Different Tests in Europe*
Euro0 Euro1 Euro2 Euro3 Euro3 Euro3 Euro4 Euro4 Euro4 Euro5 Euro5 Euro5
Diesel Diesel Diesel Diesel LPG CNG Diesel LPG CNG Diesel LPG CNG
FUEL
consumption
in gram per
km
500 485 485 485 640 620 470 709 550 425 675 530
FUEL
consumption
in km per
gram
2.00 2.06 2.06 2.06 1.56 1.61 2.13 1.41 1.82 2.35 1.48 1.89
*‘Average’ consumption for different tests in Europe from various manufacturers and types of routes
These data show the average bus fuel consumption on various networks for different manufacturers.
These data were measured in real conditions within the framework of the STARBUS and COST 356
projects
3.7.3 MAINTENANCE COSTS
Energy Efficiency and Security for Public Transport Report – October 2009 32
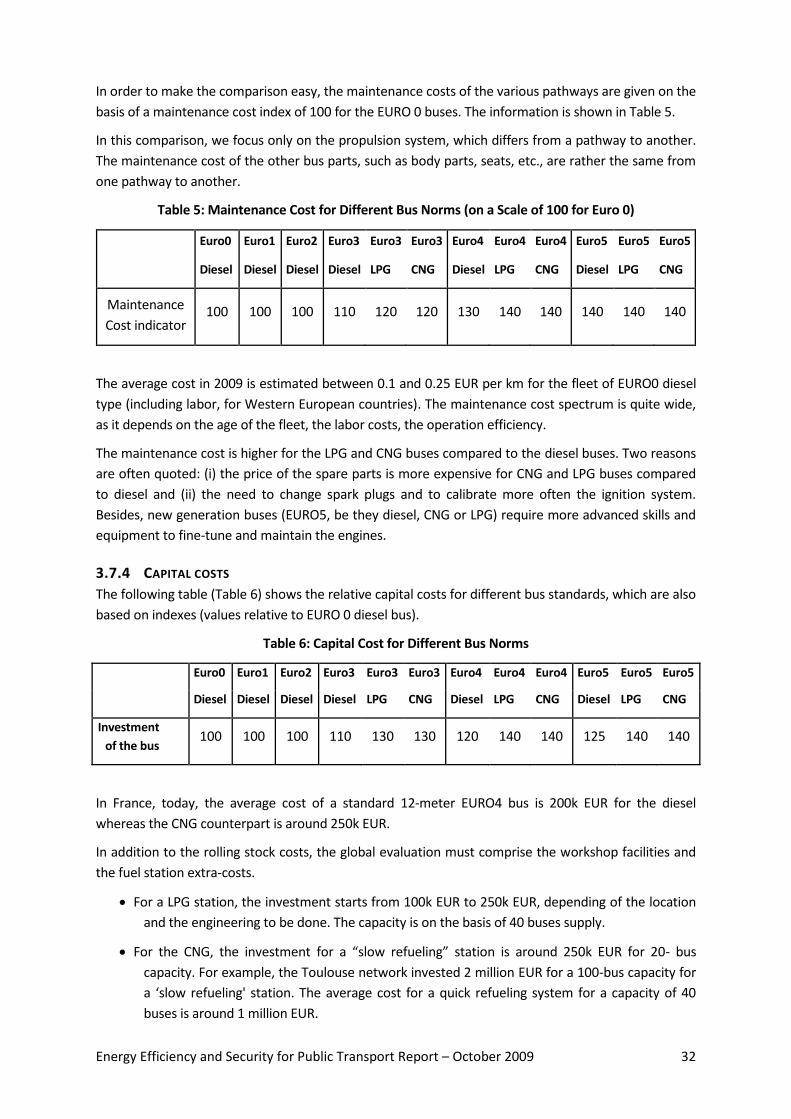
In order to make the comparison easy, the maintenance costs of the various pathways are given on the
basis of a maintenance cost index of 100 for the EURO 0 buses. The information is shown in Table 5.
In this comparison, we focus only on the propulsion system, which differs from a pathway to another.
The maintenance cost of the other bus parts, such as body parts, seats, etc., are rather the same from
one pathway to another.
Table 5: Maintenance Cost for Different Bus Norms (on a Scale of 100 for Euro 0)
Euro0 Euro1 Euro2 Euro3 Euro3 Euro3 Euro4 Euro4 Euro4 Euro5 Euro5 Euro5
Diesel Diesel Diesel Diesel LPG CNG Diesel LPG CNG Diesel LPG CNG
Maintenance
Cost indicator 100 100 100 110 120 120 130 140 140 140 140 140
The average cost in 2009 is estimated between 0.1 and 0.25 EUR per km for the fleet of EURO0 diesel
type (including labor, for Western European countries). The maintenance cost spectrum is quite wide,
as it depends on the age of the fleet, the labor costs, the operation efficiency.
The maintenance cost is higher for the LPG and CNG buses compared to the diesel buses. Two reasons
are often quoted: (i) the price of the spare parts is more expensive for CNG and LPG buses compared
to diesel and (ii) the need to change spark plugs and to calibrate more often the ignition system.
Besides, new generation buses (EURO5, be they diesel, CNG or LPG) require more advanced skills and
equipment to fine-tune and maintain the engines.
3.7.4 CAPITAL COSTS
The following table (Table 6) shows the relative capital costs for different bus standards, which are also
based on indexes (values relative to EURO 0 diesel bus).
Table 6: Capital Cost for Different Bus Norms
Euro0 Euro1 Euro2 Euro3 Euro3 Euro3 Euro4 Euro4 Euro4 Euro5 Euro5 Euro5
Diesel Diesel Diesel Diesel LPG CNG Diesel LPG CNG Diesel LPG CNG
Investment
of the bus 100 100 100 110 130 130 120 140 140 125 140 140
In France, today, the average cost of a standard 12-meter EURO4 bus is 200k EUR for the diesel
whereas the CNG counterpart is around 250k EUR.
In addition to the rolling stock costs, the global evaluation must comprise the workshop facilities and
the fuel station extra-costs.
For a LPG station, the investment starts from 100k EUR to 250k EUR, depending of the location
and the engineering to be done. The capacity is on the basis of 40 buses supply.
For the CNG, the investment for a “slow refueling” station is around 250k EUR for 20- bus
capacity. For example, the Toulouse network invested 2 million EUR for a 100-bus capacity for
a ‘slow refueling' station. The average cost for a quick refueling system for a capacity of 40
buses is around 1 million EUR.
Energy Efficiency and Security for Public Transport Report – October 2009 33
3.7.5 OPERATING COSTS
Operating costs include: the bus depreciation, the fuel cost and the maintenance cost.
Operating costs vary much among networks. Nevertheless, it can be generally stated that depreciation
is lower for diesel buses compared to LPG or CNG buses, because of lower investment cost for assets
that have similar life-times. Depreciation is much alike for CNG and LPG buses.
The fuel cost depends mainly on the strategy of the operators (fuel station management) and from the
level competition among possible suppliers. It has been observed that, for the same supplier and a
similar volume of fuel, the final price could be quite different (10 to 20% difference). The operator
negotiation capabilities are success key in that regard.
In France, it has been assessed that the operating costs range between 2.8 EUR and 5.0 EUR per bus-
kilometer (source GART, 2007/8).
3.7.6 SYNTHESIS
The table 7 below provides a qualitative comparison of the different pathways.
Table 7 : advantages and drawbacks of each bus type.
Fuel Type
Local pollution Global
pollution Economical aspects
Energy alternative
Technology maturity
CO HC NOx Part CO2 and
CH4 Capital Costs
Maintenance Costs
Diesel Euro0
Diesel Euro1
Diesel Euro2
Diesel Euro3
Diesel Euro3 biodiesel
Diesel Euro4
Diesel Euro4 biodiesel
LPG Euro3
LPG Euro4
CNG Euro3
CNG Euro3 biogas
CNG Euro4
CNG Euro4 biogas
Hybrid Euro4
Fuel Cell
WORST LOWER NEUTRAL BETTER BEST
For the short and medium terms, this table shows that EURO 4 diesel buses show better local
pollution results while investment and maintenance costs are moderate. This technology is available

Energy Efficiency and Security for Public Transport Report – October 2009 34
and mature. On the other hand, CNG / LPG technologies will have even lesser local emission records
(and global emissions, with biofuel) but at higher capital and maintenance costs.
EURO1/2 as well as Hydrid/fuel cells are out of scope, the former because of higher pollution and
the latter because of much higher costs.
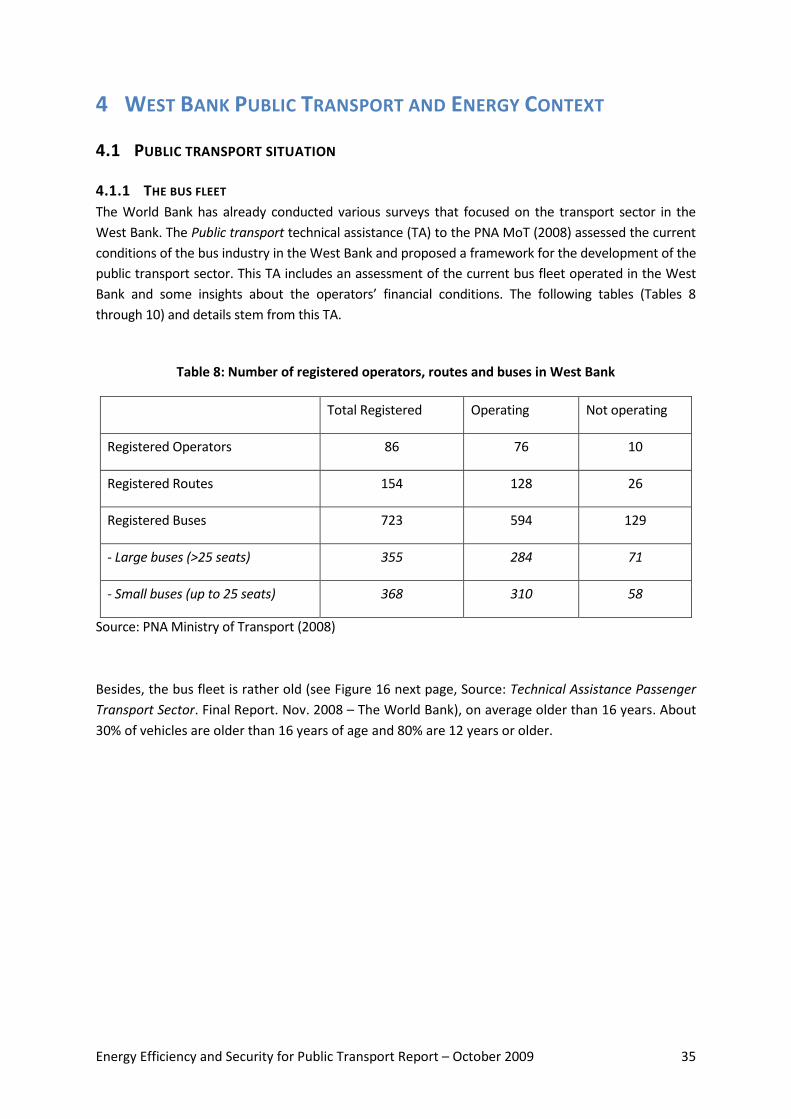
Energy Efficiency and Security for Public Transport Report – October 2009 35
4 WEST BANK PUBLIC TRANSPORT AND ENERGY CONTEXT
4.1 PUBLIC TRANSPORT SITUATION
4.1.1 THE BUS FLEET
The World Bank has already conducted various surveys that focused on the transport sector in the
West Bank. The Public transport technical assistance (TA) to the PNA MoT (2008) assessed the current
conditions of the bus industry in the West Bank and proposed a framework for the development of the
public transport sector. This TA includes an assessment of the current bus fleet operated in the West
Bank and some insights about the operators’ financial conditions. The following tables (Tables 8
through 10) and details stem from this TA.
Table 8: Number of registered operators, routes and buses in West Bank
Total Registered Operating Not operating
Registered Operators 86 76 10
Registered Routes 154 128 26
Registered Buses 723 594 129
- Large buses (>25 seats) 355 284 71
- Small buses (up to 25 seats) 368 310 58
Source: PNA Ministry of Transport (2008)
Besides, the bus fleet is rather old (see Figure 16 next page, Source: Technical Assistance Passenger
Transport Sector. Final Report. Nov. 2008 – The World Bank), on average older than 16 years. About
30% of vehicles are older than 16 years of age and 80% are 12 years or older.

Energy Efficiency and Security for Public Transport Report – October 2009 36
Figure 16: Age of the Bus Fleet in the West Bank
Urban operators typically replace their main fleet at 10-12 years and inter-urban operators on the
main routes replace their vehicles even earlier. Even though there is residual life remaining in the
vehicle, the costs of maintenance tend to increase sharply after that age. The operators can also
benefit from newer technologies, better fuel efficiency, better reliability, and maintenance cost
savings during the initial warranty period, and a superior quality product for their customers.
4.1.2 PUBLIC TRANSPORT INDUSTRY ORGANIZATION AND PRODUCTIVITY
Table 9 below - Source: Ministry of Transport (2008) - shows that there are currently only 6 companies
operating 20 or more buses, and that the 16 companies with 10 buses or more account for 55% of the
market.
Table 9: Scale of Bus Operators in West Bank
Number of Buses Number of Operators of this size
Total Buses on Registered Routes
Cumulative
total
40-49 1 42 (7%) 42 (7%)
30-39 1 37 (6%) 37 (13%)
20-29 4 107 (18%) 144 (31%)
15-19 5 82 (14%) 251 (45%)
10-14 5 56 (10%) 324 (55%)
Total 10 buses or more 16 324 55%
5-9 30 169 (28%) 493 (83%)
1-4 30 103 (17%) 594 (100%)
0 10 0 (0%) 594 (100%)
Grand Total 86 594 (100%) 594 (100%)
Specific data about Nablus and Hebron provides some insight regarding the bus operation productivity
(Table 10 below).
Fleet age – large buses (>25 seats)
0
10
20
30
40
50
60
70
1983 84 85 86 87 88 89 90 91 92 93 94 95 96 97 98 99
2000 1 2 3 4 5 6 7 8
10 years16 years
Extreme investment “deficit” that
urgently needs to be filled
Life-expired fleet that urgently needs
to be replaced
Year of manufactureMay 20th 2008
9Workshop on Palestinian Public Transport Reform

Energy Efficiency and Security for Public Transport Report – October 2009 37
Table 10: Productivity measures of bus operators in Nablus and Hebron
Nablus Buses Hebron Buses
Vehicles in daily service 60% 60%
Trips/vehicle/day 4.2 3.2
Kms/vehicle/day 61 91
Passengers/vehicle/day 113 120
Revenue/vehicle/day (NIS) 380 407
Operating speed 25 30
Source Passenger Transport Sector Final Report - Nov. 2008. The World Bank
NOTES:
1) Includes all services operating within, and to/from, Nablus and Hebron
2) Only routes/buses actually in operation included
3) Passengers and revenue estimated for shared taxis; includes only authorized shared-taxi services
It can be observed that:
Bus Utilization (3-4 trips/day) and output (<100 km/day) are low by any standards;
Passengers per vehicle (~120/day) and revenue per vehicle (NIS 280-400 (<$100)/day) are low by any standards;
Only 60% of the registered fleet is in service (example of Nablus and Hebron);
Buses are being withheld from service even on active routes, due to the reduced business.
Regarding operating costs, the Table 11 below provides a view of the bus operating cost structure in
the West Bank, based on cases observed in Hebron and Nablus areas. The repartition does not include
depreciation: all buses are completely depreciated due to their age.
Table 11: Summary of Cost Structure of Bus Operations
Expense Item Proportion of Total Expenses
Fuel 40 – 48%
Maintenance and Parts 19 – 24%
Salaries 13 – 15%
Insurance and Fees 1.0%
Other Expenses ~ 15%
Source: West bank Bus Assessment Study“. World Bank, 2008.
Regarding bus maintenance, most large operators have their own maintenance facilities. The internal
maintenance facilities are recommended for a minimum of around 50 buses, except if there are no
subcontractors close to the operator.

Energy Efficiency and Security for Public Transport Report – October 2009 38
In comparison with usual standards, the maintenance frequency is very high; usually, maintenance
frequency is calibrated so that each bus is checked every 3000 kilometers, or more. This ageing bus
fleet explains heavier maintenance requirements.
4.2 ENERGY AVAILABILITY AND SUPPLY
All types of fuels (diesel, gasoline, LPG) are imported and are obtained through Israel. LPG and other
types of fuels are transported to the Palestinian areas/central stations from Israel through semi trailer
tanks; there is no pipes system. This is generally coordinated with the Palestinian Petroleum General
Authority.
Road transport accounts for more than half of the overall energy consumed in the Palestinian
Territories. The fuel consumption in the Palestinian Territories used for the transport sector (Gasoline
and Diesel) is presented in Table 12 below.
Table 12: Average Annual Fuel Consumption (1000 litres) in the Palestinian Territories
Year Gasoline Diesel
2007 123662 131717
2006 116430 137193
2005 99113 172742
2004 97097 163121
2003 175387 30338
2002 147240 30111
2001 118906 40157
Source: Palestinian Central Bureau of Statistics, 2005-2009
Over the past several years, no supply shortage of diesel and gasoline had been recorded except in
2006 when the Israeli authority restricted the supply of fuel to the Palestinians as a response to the
formation of a Palestinian government lead by Hamas group. As for LPG, there are times when the
supply is limited during winter time when demand for gas increases for heating and other regular
household usage.
4.2.1 DIESEL AND GASOLINE
Vehicle fuels that are in use in the West Bank and Gaza are Diesel and Gasoline. All public transport
vehicles (buses and taxis) and freight vehicles are using (regular) Diesel fuel because it is cheaper than
Gasoline (current price is 4.7 NIS/l diesel compared to 5.3 NIS/l of Gasoline). Limited number of private
vehicles uses Diesel; most operate on Gasoline.
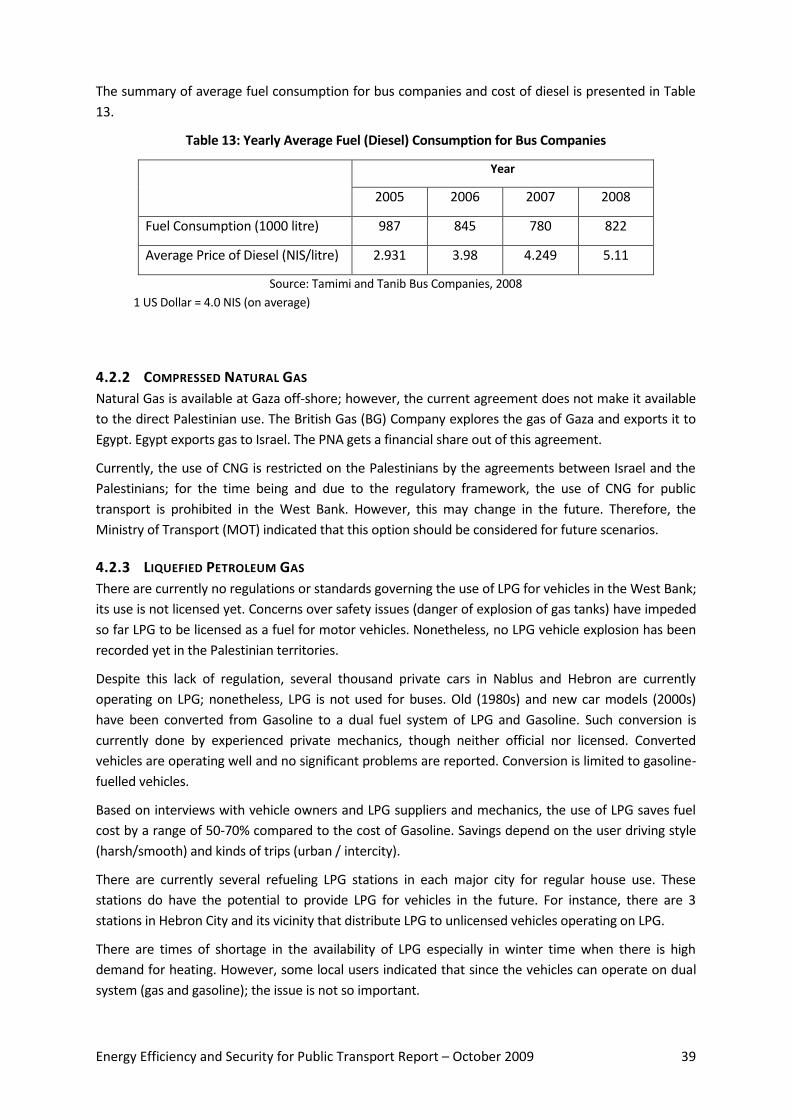
Energy Efficiency and Security for Public Transport Report – October 2009 39
The summary of average fuel consumption for bus companies and cost of diesel is presented in Table
13.
Table 13: Yearly Average Fuel (Diesel) Consumption for Bus Companies
Year
2005 2006 2007 2008
Fuel Consumption (1000 litre) 987 845 780 822
Average Price of Diesel (NIS/litre) 2.931 3.98 4.249 5.11
Source: Tamimi and Tanib Bus Companies, 2008
1 US Dollar = 4.0 NIS (on average)
4.2.2 COMPRESSED NATURAL GAS
Natural Gas is available at Gaza off-shore; however, the current agreement does not make it available
to the direct Palestinian use. The British Gas (BG) Company explores the gas of Gaza and exports it to
Egypt. Egypt exports gas to Israel. The PNA gets a financial share out of this agreement.
Currently, the use of CNG is restricted on the Palestinians by the agreements between Israel and the
Palestinians; for the time being and due to the regulatory framework, the use of CNG for public
transport is prohibited in the West Bank. However, this may change in the future. Therefore, the
Ministry of Transport (MOT) indicated that this option should be considered for future scenarios.
4.2.3 LIQUEFIED PETROLEUM GAS
There are currently no regulations or standards governing the use of LPG for vehicles in the West Bank;
its use is not licensed yet. Concerns over safety issues (danger of explosion of gas tanks) have impeded
so far LPG to be licensed as a fuel for motor vehicles. Nonetheless, no LPG vehicle explosion has been
recorded yet in the Palestinian territories.
Despite this lack of regulation, several thousand private cars in Nablus and Hebron are currently
operating on LPG; nonetheless, LPG is not used for buses. Old (1980s) and new car models (2000s)
have been converted from Gasoline to a dual fuel system of LPG and Gasoline. Such conversion is
currently done by experienced private mechanics, though neither official nor licensed. Converted
vehicles are operating well and no significant problems are reported. Conversion is limited to gasoline-
fuelled vehicles.
Based on interviews with vehicle owners and LPG suppliers and mechanics, the use of LPG saves fuel
cost by a range of 50-70% compared to the cost of Gasoline. Savings depend on the user driving style
(harsh/smooth) and kinds of trips (urban / intercity).
There are currently several refueling LPG stations in each major city for regular house use. These
stations do have the potential to provide LPG for vehicles in the future. For instance, there are 3
stations in Hebron City and its vicinity that distribute LPG to unlicensed vehicles operating on LPG.
There are times of shortage in the availability of LPG especially in winter time when there is high
demand for heating. However, some local users indicated that since the vehicles can operate on dual
system (gas and gasoline); the issue is not so important.

Energy Efficiency and Security for Public Transport Report – October 2009 40
Based on field visits and observation for LPG stations in Hebron, there are no problems to fuel LPG as
current gas stations provide this service with no technical difficulties. The refueling process for vehicles
is simple; refueling time is slightly longer for LPG than for diesel (5-10 minutes in total for LPG while it
is less than 5 minutes for Gasoline fuel).
Interviews with auto workshop owners that currently convert vehicles to LPG show that the total cost
of retrofitting a car to LPG in the West Bank ranges from 3000 to 6000 NIS (US$750 – 1500), depending
on the quality and source of equipment used. The most expensive type is the one with a “multi-point”
system, which is the most advanced technology. In addition, the total cost of a LPG pump station is
approximately $15,000.
The currently used equipments are imported from China, Turkey, Italy, etc. The equipment to be used
in cars shall pass through the Israeli custom and subject to Israeli import regulations. Israel does not
allow the import of any less than Euro3. Some of the equipment used in Hebron is Euro5, and they are
imported from Italy (MG Company) with 3 years warrantee.
Converting Diesel engines to LPG
It is much more difficult (in terms of technical issues and needed expertise) and expensive (in terms of
equipment) to convert diesel-fuelled vehicles to LPG. In fact the all engine must be removed, and
therefore only very few bus manufacturers develop this type of engine. No diesel-fuelled vehicles, in
particular no buses, have been converted to LPG in the Palestinian area or in Israel.
4.3 REGIONAL EXPERIENCES WITH ALTERNATIVE FUELS
4.3.1 ISRAEL
Public and private road motor vehicles in Israel regularly operate on Gasoline and Diesel, although the
use of LPG is licensed.
Israel does not allow importing Euro3 engines and below. From October 2006 on, all trucks, including
public transport vehicles, must be EURO 4 compliant. Current Israeli buses in operation use EURO4
type engines; they currently operate on Diesel with low sulfur. Right now, all new Israeli buses must
comply with EURO5 standards and in any case before 2010 from January 2004 on, the sulfur content of
diesel has been reduced from 350 ppm to 50 ppm. Information from the Israeli ministry of
Environment website states that, by the beginning of 2009, the sulfur content of gasoline and diesel
should go down to 10 ppm.
There are currently about 10,000 private cars operating on LPG in Israel but no public taxis. LPG is not
used either for public transport. There are a few refueling stations for LPG. Israel is considering
increasing taxes on vehicles operating on LPG even if, for the time being, LPG is less taxed than regular
vehicle fuels (Diesel and Gasoline). Based on previous experiences, there might be times where supply
of LPG is in shortage.
Major oppositions to LPG stem from safety issues. One of the current regulations concerning LPG-
operated vehicles is that these vehicles should not park in closed parking; only in open lots.
Based on interviews with Israeli experts, CNG is not used in Israel. There seems to no decision
regarding this. There is also a very limited experience in electric and hybrid vehicles. The use of Bio-
Diesel is still debated.

Energy Efficiency and Security for Public Transport Report – October 2009 41
On the whole, alternative fuel use is limited and there are little specific and written information about
maintenance or refueling issues.
4.3.2 JORDAN
Based on available information, there is no regular program of using alternative fuels on vehicles in
Jordan. There are initiatives underway by private investors to introduce LPG for vehicles use.
4.3.3 EGYPT
Vehicles in Egypt typically operate on Gasoline and Diesel. The largest area of growth in green vehicle
technology in Egypt has been in the use of compressed natural gas (CNG) as an alternative fuel. CNG is
about a third of the price of regular gas (gasoline).
The CNG technology has surged in popularity, particularly with taxi drivers, after 2008’s fuel subsidy
cut, which caused fuel prices to soar as much as 57 percent for the highest grade of gasoline and 35
percent for lower grades. Cairo hosts the first CNG service station in Africa and the Arab world. There,
car owners can have their vehicles converted to run on natural gas for about LE 400 (US$100).
Over 100,000 vehicles in Cairo run on this technology currently, with government-owned natural gas
company Egas pushing to have 300,000 by 2012. There are plans for an increase in the number of NGV
fuelling stations to 390 locations around the country.
While about 70 percent of the vehicles run on natural gas are taxis, about 17 percent are privately
owned vehicles. Motorcycles are also being targeted for conversion to this technology. The Egyptian
Environmental Affairs Agency has partnered with Industry Canada in a $1.4 million program to convert
Cairo’s estimated 300,000 motorcycles to natural gas technology. There are also plans to encourage
the conversion of diesel vehicles, particularly mini-buses, to CNG in the near future. The next
generation of trucks, to be launched in 2010 and 2011, are going to be CNG compliant.
The Egyptian law specifies that vehicles should be Euro1 compliant, but most of cars there are
expected to be Euro 2 compliant.
The EEAA/USAID-sponsored the Cairo Air Improvement Program (CAIP), which focused on improving
Cairo's air quality through reducing harmful emissions from lead smelters and vehicle exhausts. Part of
the programme included providing 50 dedicated CNG public-transit buses to the Cairo Transit
Authority (CTA) and Greater Cairo Bus Company (GCBC). The bus bodies are locally manufactured, but
the CNG engines are manufactured by Cummins in the United States and the rolling chassis were
supplied by a US manufacturer. Key challenges for the government have been to fund the conversion
of the some 3,500 public buses operating in Cairo and change the price differential between CNG and
diesel, which is heavily subsidized (source: http://www.idrc.ca/en/ev-132146-201-1-DO_TOPIC.html).

Energy Efficiency and Security for Public Transport Report – October 2009 42
5 ALTERNATIVE PATHWAYS COMPARISON
5.1 METHODOLOGY
This part compares, within the West Bank context, the various bus pathways for public transport.
The following alternatives are appraised:
Scenario 0: existing fleet Euro0 (baseline scenario);
Scenario 1: Euro3 buses diesel-powered;
Scenario 2: Euro3 buses LPG-powered;
Scenario 3: Euro3 buses CNG-powered;
Scenario 4: Euro4 buses diesel-powered;
Scenario 5: Euro4 buses LPG-powered;
Scenario 6: Euro4 buses CNG-powered.
Other pathways (hybrid, LNG, fuel cell…) are not considered because they are not developed enough
for the time being. EURO5 buses are not included either within the scope of the analysis because of
the extra costs of those buses.
5.1.1 METHOD
The method implemented to compare the various pathways is a Cost Benefit Analysis. The appraisal
takes into account:
Direct costs (bus investment, fuel cost, maintenance cost, over-cost of specific equipments) and
their escalation over time.
External costs monetarizing local pollution (particles, NOx, CO, HC), and global pollution (CO2,
CH4).
The unit price per ton / kilogram of each pollutant should be adjusted to the local conditions. In a first
step, the calculation is based on the European standards, which, in fact, promotes the alternative fuels
compared to diesel. For each of the scenario mentioned above, the 3 types of parameters defining
each scenario are:
Capital cost per new bus;
Maintenance cost per km;
Special costs (specific facilities for LPG...).
Many other parameters are included in the model, even if they do not appear explicitly. For instance,
the model includes the emissions escalation as Euro engine types decrease, (old engines are more
sensitive due to the maintenance levels) and as the total bus mileage increases (fuel consumption is a
positive function of the mileage). All that kind of curves are included in the model; the data was

Energy Efficiency and Security for Public Transport Report – October 2009 43
derived from many on-site assessments across Europe, carried out through the 8COST committee. The
software STARBUS (see 4.1.3 below) is used to carry out the comparison.
All the direct and external costs are calculated for an appraisal period of 12 years, which is assumed to
be the life-time of a new bus. Costs are discounted over the 12-year period, with the discount rate
proposed below.
In addition to the costs mentioned above, a few qualitative parameters are also taken into account for
a more comprehensive comparison; these are:
Safety;
Fuel availability;
Energy independence.
For these three factors, only a qualitative assessment is provided, comparing the scenario to the diesel
pathway.
5.1.2 DUTY CYCLES USED FOR THE SIMULATIONS
The computerization is based on urban duty cycles, which comes from the average fuel consumption
and emission per Euro type of bus identified for every type of fuel (EURO5 and EURO6 types) and the
technology options.
SORT cycle scheme (source UITP)
These data derive from actual duty cycles from urban bus networks; the data collected represent more
than 120 types of duty cycles, and more than 40 models of buses, including diesel, CNG and LPG buses.
The data was gathered through the COST committee and the major improvement, in order to have a
better overview of the in situ conditions than the others evaluations even used in Europe or USA from
rolling benches.
The simulation could be more accurate and better fit to the actual local conditions, if the operators are
able to provide all relevant data regarding (i) actual duty cycles, (ii) fuel consumption, and (iii) emitted
pollutants.
8 COST European Cooperation in Science and Technology

Energy Efficiency and Security for Public Transport Report – October 2009 44
These cycles are in fact quite closer to suburban routes like in the West Bank. Moreover, very often the
cycles predict a stable acceleration and deceleration which is easier than the real route concerning the
emissions and the consumption.
One example is given with the SORT ‘easy urban cycle’ which is a part of the sort cycle test defined for
the European networks.
5.1.3 QUICK PRESENTATION OF STARBUS
STARBUS is an EU-supported research program that started in 2006 and was completed in December
2008. The main outputs of this program are:
A measurement and recording tool this can be used in the bus (on board) to measure a series of
key operating factors, among which: speed, engine velocity, fuel consumption, pollutants
emission, etc. The real conditions of operation are assessed, not bench measurements. With
this tool, many data have been gathered in various networks in Europe, featuring many kinds
of buses, routes, and duty cycles.
Software to estimate all the physical quantities linked to the bus operation and monetarize all
the related costs for a given route. Therefore, STARBUS can be used to assess, with
simulation, (i) fleet renewal / replacement or (ii) fleet extension. This assessment can be
carried out with real data measured on-site with the ‘portable device’, or through the
‘average’ conditions included in the software database. The database contains all the average
emissions and consumption per type of bus (fuel _ euro type) including the versus of each type
of Euro standard like of there is Diesel Particles Trap, Water Emulsion fuel, De NO x systems.
In any case all the specific characteristics such as the fuel cost and maintenance costs are provided by
the operator.
Any person can use the STARBUS software.
The input data are in fact all the parameters normally known such as the description of the fleet
– number of buses per type of Euro standard, mileage-, the assumptions of the simulation,
such as the number of new buses per year and the type of Euro, if there are retrofitting like
Diesel Particles Traps, all the specific costs related to the maintenance and the fuel
management, at last the unit price of the buses, and the financial parameters (inflation rate,
loan rate, fuel price, evolution of the fuel price../..)
The outputs of the simulations are in fact the technical data like emissions and consumption per
pathway, costs of each emission and consumption parameter per pathway described, and at
last the table which summarizes all these cost for the period of calculation.

Energy Efficiency and Security for Public Transport Report – October 2009 45
pathway N°2 YEAR 0 YEAR 1 YEAR 5 YEAR 6 YEAR 15
Bus depreciation 1150815 1122508 1024835 1017374 842066
Bus Maintenance 25080 25021 22858 20385 22237
Workshop investment 3885 3772 3351 3254 0
Workshop maintenance 3000 2971 2857 2829 2592
Fuel station investment 8178 7940 7054 6849 0
Fuel station maintenance 7000 6932 6667 6602 6047
Fuel consumption cost 537342 543350 465137 338985 438710
TOTAL DIRECT COST 1735300 1712494 1532759 1396278 1311652
DIRECT COST PER KM 1,3838 1,3656 1,2223 1,135 1,046
Local pollution 238999 232476 172692 106050 136233
Retrofitting investment 0 6055 5380 0 0
Retrofitting maintenance cost 0 27 28 29 31
CO² cost 89037 89639 76598 55700 71911
Fuel incentives -76500 -78750 -76577 0 0
total pollution cost 251536 249447 178121 161779 208175
pollution cost PER KM 0,201 0,199 0,142 0,129 0,166
GENERAL COST 1986836 1961941 1710880 1558057 1519827
GENERAL COST PER KM 1,584 1,565 1,364 1,264 1,212
Figure 17: Example of an output table from a STARBUS simulation
Finally, this kind of graph shows a synthetic image of each pathway.
Figure 18: synthetic situation of pathways
In conclusion, STARBUS software is free of use and allows anyone to simulate any kind of situations
from its network, to input different assumptions and to have the output results in order to choose or
to study which pathway should be the best for the renewal of the fleet.
5.2 SCENARIOS DESCRIPTION

Energy Efficiency and Security for Public Transport Report – October 2009 46
5.2.1 COMMON ECONOMIC AND TECHNICAL ASSUMPTIONS
For the simulation of conditions in the West Bank, some parameters are retained, which can be
removed through the program translated in Excel file provided in the included CD-Rom.
Exchange rate of the NIS: (from the European Bank currency conversion rate as of May, 1 2009)
1 euro = 5.40 NIS
1 usd = 4.15 NIS
External costs:
CO 16.2 NIS per ton
HC 7560 NIS per ton
NO x 41580 NIS per ton
Particles 682020 NIS per ton
CO2 216 NIS per ton
These unit costs are derived from the EU Handbook on estimation of external costs in the transport
sector (2008). These could be considered higher than acceptable in the West Bank. Nevertheless,
choosing high unit costs to monetarize transportation negative externalities will favor alternative fuels,
compared to diesel.
Financial aspects:
Actualization rate: 12%. This is the standard actualization rate recommended by the World Bank for
West Bank and Gaza.
Inflation rate: 4% per year (average in West Bank); all along the 12 years appraisal period, this rate is
maintained. This rate is representative of the last past years.
Fuel prices: The price of the diesel is based on 4.25 NIS per liter and 3.75 NIS per liter for the LPG
(including the last information updated April 2009). Without any price of the Natural Gas which is not
available in West Bank, the assumption is a price of 3.40 NIS per Nm3 of CNG. This assumption stems
from the comparison of the prices between LPG and CNG in Europe. Of course as soon as the CNG
should be introduced, the simulations will be done with the prices in WBG.
Evolution of fuel prices: 5% per year for all fuels. We consider the energy cost will increase more than
the inflation rate; this assumption is in fact reasonable compared to the forecasts of the energy prices
estimated by some international organizations.
Maintenance cost: For the existing fleet, the average of 0.80 NIS per kilometer is retained, the focus
will be on the main fleet with the larger number of buses in operation. For the new buses, ¼ of this
cost for the new buses either Euro3 or Euro4 will be retained.
Evolution of maintenance costs: 5% per year, mainly taking into account labor costs and spare parts.
The labor costs are more valuated than the inflation rate; this is the main reason of this rate. Moreover
the spare parts after some years are more expensive; the manufacturers support the cost of the stock.
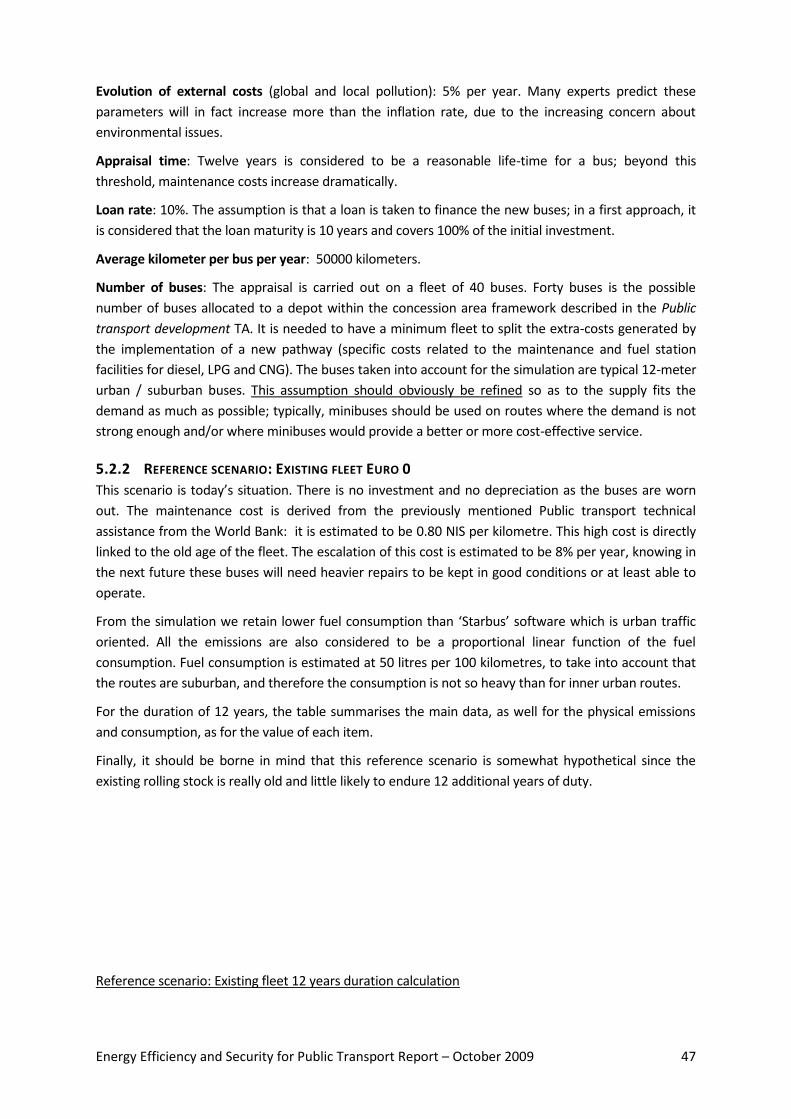
Energy Efficiency and Security for Public Transport Report – October 2009 47
Evolution of external costs (global and local pollution): 5% per year. Many experts predict these
parameters will in fact increase more than the inflation rate, due to the increasing concern about
environmental issues.
Appraisal time: Twelve years is considered to be a reasonable life-time for a bus; beyond this
threshold, maintenance costs increase dramatically.
Loan rate: 10%. The assumption is that a loan is taken to finance the new buses; in a first approach, it
is considered that the loan maturity is 10 years and covers 100% of the initial investment.
Average kilometer per bus per year: 50000 kilometers.
Number of buses: The appraisal is carried out on a fleet of 40 buses. Forty buses is the possible
number of buses allocated to a depot within the concession area framework described in the Public
transport development TA. It is needed to have a minimum fleet to split the extra-costs generated by
the implementation of a new pathway (specific costs related to the maintenance and fuel station
facilities for diesel, LPG and CNG). The buses taken into account for the simulation are typical 12-meter
urban / suburban buses. This assumption should obviously be refined so as to the supply fits the
demand as much as possible; typically, minibuses should be used on routes where the demand is not
strong enough and/or where minibuses would provide a better or more cost-effective service.
5.2.2 REFERENCE SCENARIO: EXISTING FLEET EURO 0
This scenario is today’s situation. There is no investment and no depreciation as the buses are worn
out. The maintenance cost is derived from the previously mentioned Public transport technical
assistance from the World Bank: it is estimated to be 0.80 NIS per kilometre. This high cost is directly
linked to the old age of the fleet. The escalation of this cost is estimated to be 8% per year, knowing in
the next future these buses will need heavier repairs to be kept in good conditions or at least able to
operate.
From the simulation we retain lower fuel consumption than ‘Starbus’ software which is urban traffic
oriented. All the emissions are also considered to be a proportional linear function of the fuel
consumption. Fuel consumption is estimated at 50 litres per 100 kilometres, to take into account that
the routes are suburban, and therefore the consumption is not so heavy than for inner urban routes.
For the duration of 12 years, the table summarises the main data, as well for the physical emissions
and consumption, as for the value of each item.
Finally, it should be borne in mind that this reference scenario is somewhat hypothetical since the
existing rolling stock is really old and little likely to endure 12 additional years of duty.
Reference scenario: Existing fleet 12 years duration calculation

Energy Efficiency and Security for Public Transport Report – October 2009 48
physical value
in tons Monetization
in NIS NIS per
kilometer % Direct
cost %
Pollution % total
cost
Global pollution 36 912 5 685 642 0,237 13% 6%
Local Pollution 37 337 579 1,556 38%
NO x 663 19 752 904 0,823 46% 20%
Particles 36 17 256 484 0,719 40% 18%
HC 61 325 532 0,014 1% 0%
CO 236 2 658 0% 0%
Direct Cost 54 386 770 2,266 56%
Fuel Consumption 10 619 38 543 320 1,606 71% 40%
Maintenance 15 843 451 0,660 29% 16%
Depreciation 0%
Spec maintenance 0 0% 0%
Spec fuel station 0 0% 0%
Total Cost 97 409 992 4,059 100%
The pollution of the existing fleet, based on the European external costs represents 44% of the total
cost of the public transport. The main pollution costs are NO x (20%) and particles (18%) which are
local emissions.
For the operators the fuel is the first component of the cost. Of course, there is no item related to the
depreciation of the investments due to the old age of the buses and workshop depot facilities.
We note that the operative cost is a little less than 2.30 NIS per kilometer.
5.2.3 SCENARIO 1: EURO3 DIESEL
The maintenance cost retained for EURO3 buses is 0.20 NIS per kilometer, with a yearly cost
escalation of 5%. This is a cheaper maintenance cost than the EURO 0 or ‘before0’ cost; the reason is
that the current EURO 0 or ‘before0’ are really worn out and require extra maintenance. The unit
price for a new EURO3 bus given is assumed to be 1 million NIS.
On the 12 years appraisal time, the table below summarizes the main output data, as well the physical
emissions and consumption, as for their monetarized values.
Scenario 1: EURO3 Diesel 12 years duration calculation

Energy Efficiency and Security for Public Transport Report – October 2009 49
physical value
in tons Monetization
in NIS NIS per
kilometer % Direct
cost %
Pollution % total
cost
Global pollution 31 727 4 882 162 0,203 28% 5%
Local Pollution 12 275 828 0,511 13%
NO x 349 10 415 518 0,434 61% 11%
Particles 4 1 758 609 0,073 10% 2%
HC 19 101 484 0,004 1% 0%
CO 19 217 0,000 0% 0%
Direct Cost 77 832 915 3,243 82%
Fuel Consumption 9 138 33 135 770 1,381 43% 35%
Maintenance 3 449 910 0,144 4% 4%
Depreciation 41 195 740 1,716 53% 43%
Spec maintenance 51 495 0,002 0% 0%
Spec fuel station 0 0,000 0% 0%
Total Cost 94 990 905 3,958 100%
The pollution of the Diesel Euro3 fleet represents 18% of the total cost of the public transport. The
main pollution costs are NO x (11%) and the CO2 (5%).
For the operators, depreciation is the first component of the cost (43%). The second item is the fuel
cost (36%). In total, 78% of the direct cost is composed with depreciation and fuel costs. From the
operator’s point of view, the direct cost will increase of 0.977 NIS per bus-kilometer, in comparison
with the Scenario 0.
5.2.4 SCENARIO 2: EURO3 LPG
In comparison with the Euro3 Diesel scenario, the unit price of the new bus is estimated at 1.15
million NIS; the maintenance cost per kilometer is 0.25 NIS. The maintenance cost escalation
retained is 6% per year to take into account the specific equipment to be checked, in particular the
tanks.
On the 12 years appraisal time, the table below summarizes the main output data, as well the
physical emissions and consumption, as for their monetarized values.

Energy Efficiency and Security for Public Transport Report – October 2009 50
Scenario 2: EURO3 LPG 12 years duration calculation
physical value
in tons Monetization
in NIS NIS per
kilometer % Direct
cost %
Pollution % total
cost
Global pollution 40 623 6 251 081 0,260 42% 5%
Local Pollution 8 729 744 0,364 7%
NO x 300 8 713 148 0,363 58% 7%
Particles 0 0 0,000 0% 0%
HC 3 15 000 0,001 0% 0%
CO 144 1 597 0,000 0% 0%
Direct Cost 110 549 346 4,606 88%
Fuel Consumption 12 059 58 573 487 2,441 53% 47%
Maintenance 4 312 387 0,180 4% 3%
Depreciation 47 375 102 1,974 43% 38%
Spec maintenance 164 783 0,007 0% 0%
Spec fuel station 123 587 0,005 0% 0%
Total Cost 125 530 170 5,230 100%
The pollution is less than 12%; 5% for the global pollution and 7% for the NOx. The others pollutants
are negligible. Depreciation is the first direct cost, then the fuel cost. These parameters will be the
most representative of the bus-kilometer cost.
Comparison LPG Euro3 versus Diesel Euro3.
physical
value in tons Monetization in NIS NIS per
kilometer % total cost
Global pollution 8 896 1 368 918 0,057 28,0%
Local Pollution -3 546 083 -0,148 -28,9%
NO x -48 -1 702 370 -0,071 -16,3% Particles -4 -1 758 609 -0,073 -100,0% HC -16 -86 484 -0,004 -85,2%
CO 125 1 379 0,000 634,2%
Direct Cost 32 716 431 1,363 42,0%
Fuel Consumption 2 920 25 437 717 1,060 76,8% Maintenance 862 477 0,036 25,0% Depreciation 6 179 361 0,257 15,0% Spec maintenance 113 288 0,005 220,0%
Spec fuel station 123 587 0,005
Total Cost 30 539 266 1,272 32,1%
The LPG Euro3 pathway is significantly more expensive than the Diesel Euro3 pathway:
+32.1% for the total costs
+ 42.0% for the direct costs.
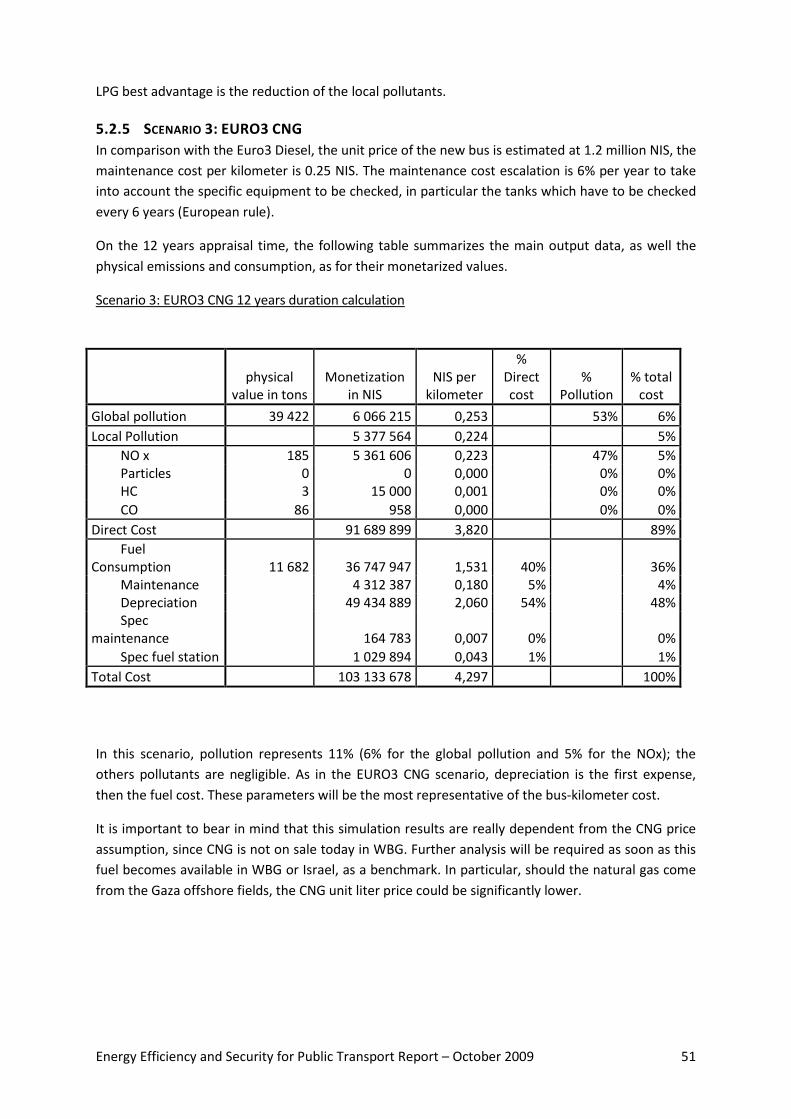
Energy Efficiency and Security for Public Transport Report – October 2009 51
LPG best advantage is the reduction of the local pollutants.
5.2.5 SCENARIO 3: EURO3 CNG
In comparison with the Euro3 Diesel, the unit price of the new bus is estimated at 1.2 million NIS, the
maintenance cost per kilometer is 0.25 NIS. The maintenance cost escalation is 6% per year to take
into account the specific equipment to be checked, in particular the tanks which have to be checked
every 6 years (European rule).
On the 12 years appraisal time, the following table summarizes the main output data, as well the
physical emissions and consumption, as for their monetarized values.
Scenario 3: EURO3 CNG 12 years duration calculation
physical
value in tons Monetization
in NIS NIS per
kilometer
% Direct cost
% Pollution
% total cost
Global pollution 39 422 6 066 215 0,253 53% 6%
Local Pollution 5 377 564 0,224 5%
NO x 185 5 361 606 0,223 47% 5% Particles 0 0 0,000 0% 0% HC 3 15 000 0,001 0% 0%
CO 86 958 0,000 0% 0%
Direct Cost 91 689 899 3,820 89%
Fuel Consumption 11 682 36 747 947 1,531 40% 36%
Maintenance 4 312 387 0,180 5% 4% Depreciation 49 434 889 2,060 54% 48% Spec
maintenance 164 783 0,007 0% 0%
Spec fuel station 1 029 894 0,043 1% 1%
Total Cost 103 133 678 4,297 100%
In this scenario, pollution represents 11% (6% for the global pollution and 5% for the NOx); the
others pollutants are negligible. As in the EURO3 CNG scenario, depreciation is the first expense,
then the fuel cost. These parameters will be the most representative of the bus-kilometer cost.
It is important to bear in mind that this simulation results are really dependent from the CNG price
assumption, since CNG is not on sale today in WBG. Further analysis will be required as soon as this
fuel becomes available in WBG or Israel, as a benchmark. In particular, should the natural gas come
from the Gaza offshore fields, the CNG unit liter price could be significantly lower.

Energy Efficiency and Security for Public Transport Report – October 2009 52
Comparison CNG Euro3 versus Diesel Euro3.
physical value
in tons
Monetization
in NIS
Delta NIS per
kilometer
% total
cost
Global pollution 3 847 592 026 0,049 24,3%
Local Pollution -3 449 132 -0,287 -56,2%
NO x -82 -2 526 956 -0,211 -48,5%
Particles -2 -879 304 -0,073 -100,0%
HC -8 -43 242 -0,004 -85,2%
CO 34 370 0,000 340,5%
Direct Cost 11 719 887 0,977 19,7%
Fuel Consumption 1 272 1 806 089 0,151 10,9%
Maintenance 531 468 0,044 30,8%
Depreciation 8 239 148 0,687 20,0%
Spec maintenance 113 288 0,009 220,0%
Spec fuel station 1 029 894 0,086
Total Cost 8 862 781 0,739 13,0%
physical value in
tons Monetization in
NIS NIS per
kilometer % total
cost
Global pollution 7 695 1 184 052 0,049 24,3%
Local Pollution -6 898 264 -0,287 -56,2%
NO x -164 -5 053 912 -0,211 -48,5% Particles -4 -1 758 609 -0,073 -100,0% HC -16 -86 484 -0,004 -85,2%
CO 67 741 0,000 340,5%
Direct Cost 13 856 985 0,577 17,8%
Fuel Consumption 2 544 3 612 177 0,151 10,9% Maintenance 862 477 0,036 25,0% Depreciation 8 239 148 0,343 20,0% Spec maintenance 113 288 0,005 220,0%
Spec fuel station 1 029 894 0,043
Total Cost 8 142 774 0,339 8,6%
The CNG Euro3 pathway is more expensive than the Diesel Euro3:
+8.6% for the total cost.
+17.8% for the direct costs.
However, this scenario is cheaper than the LPG EURO3 scenario. Similarly to the LPG EURO3
scenario, this scenario’s main advantage is the drastic reduction of local pollutants.
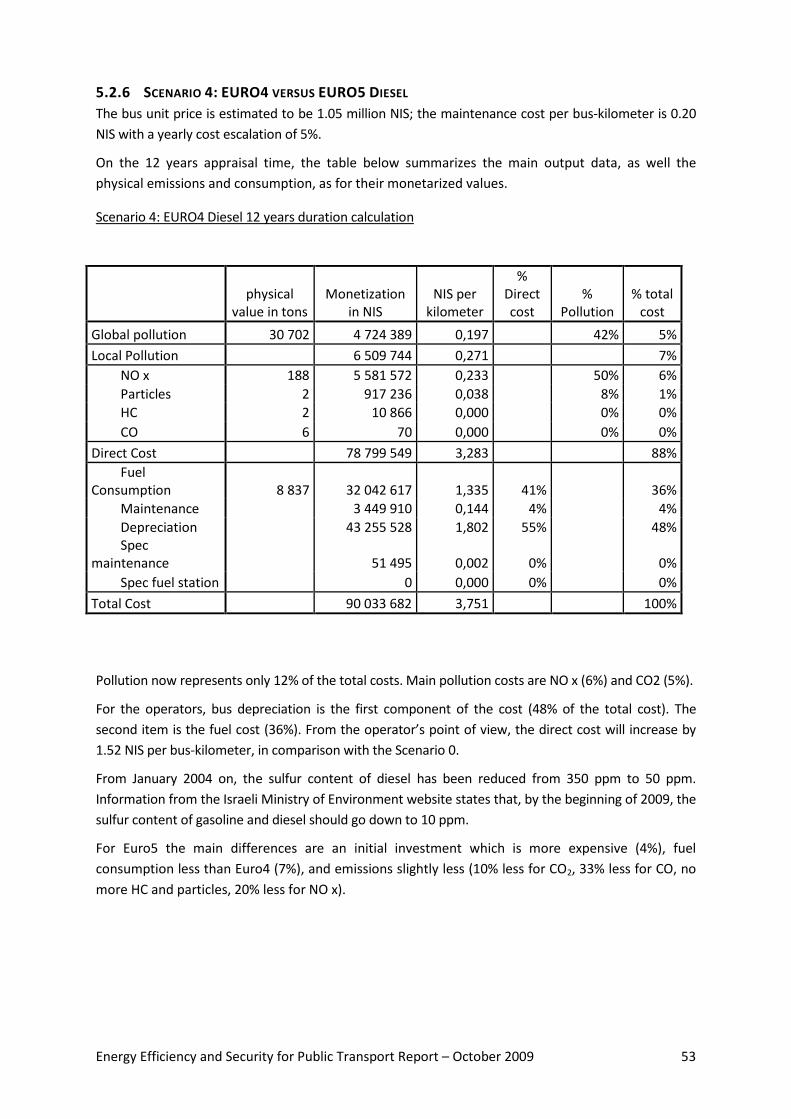
Energy Efficiency and Security for Public Transport Report – October 2009 53
5.2.6 SCENARIO 4: EURO4 VERSUS EURO5 DIESEL
The bus unit price is estimated to be 1.05 million NIS; the maintenance cost per bus-kilometer is 0.20
NIS with a yearly cost escalation of 5%.
On the 12 years appraisal time, the table below summarizes the main output data, as well the
physical emissions and consumption, as for their monetarized values.
Scenario 4: EURO4 Diesel 12 years duration calculation
physical
value in tons Monetization
in NIS NIS per
kilometer
% Direct cost
% Pollution
% total cost
Global pollution 30 702 4 724 389 0,197 42% 5%
Local Pollution 6 509 744 0,271 7%
NO x 188 5 581 572 0,233 50% 6%
Particles 2 917 236 0,038 8% 1%
HC 2 10 866 0,000 0% 0%
CO 6 70 0,000 0% 0%
Direct Cost 78 799 549 3,283 88%
Fuel Consumption 8 837 32 042 617 1,335 41% 36%
Maintenance 3 449 910 0,144 4% 4%
Depreciation 43 255 528 1,802 55% 48% Spec
maintenance 51 495 0,002 0% 0%
Spec fuel station 0 0,000 0% 0%
Total Cost 90 033 682 3,751 100%
Pollution now represents only 12% of the total costs. Main pollution costs are NO x (6%) and CO2 (5%).
For the operators, bus depreciation is the first component of the cost (48% of the total cost). The
second item is the fuel cost (36%). From the operator’s point of view, the direct cost will increase by
1.52 NIS per bus-kilometer, in comparison with the Scenario 0.
From January 2004 on, the sulfur content of diesel has been reduced from 350 ppm to 50 ppm.
Information from the Israeli Ministry of Environment website states that, by the beginning of 2009, the
sulfur content of gasoline and diesel should go down to 10 ppm.
For Euro5 the main differences are an initial investment which is more expensive (4%), fuel
consumption less than Euro4 (7%), and emissions slightly less (10% less for CO2, 33% less for CO, no
more HC and particles, 20% less for NO x).

Energy Efficiency and Security for Public Transport Report – October 2009 54
Scenario 4bis : EURO5 Diesel 12 years duration calculation
physical
value in tons Monetization
in NIS NIS per
kilometer % Direct
cost %
Pollution % total
cost
Global pollution 27 632 4 251 950 0,177 49% 5%
Local Pollution 4 465 304 0,186 5%
NO x 151 4 465 258 0,186 51% 5%
Particles 0 0 0,000 0% 0%
HC 0 0 0,000 0% 0%
CO 4 46 0,000 0% 0%
Direct Cost 77 318 676 3,222 90% Fuel
Consumption 7 951 28 831 523 1,201 37% 34%
Maintenance 3 449 910 0,144 4% 4%
Depreciation 44 985 749 1,874 58% 52% Spec
maintenance 51 495 0,002 0% 0%
Spec fuel station 0 0,000 0% 0%
Total Cost 86 035 930 3,585 100%
The comparison is obviously in favor of the EURO5 type.
physical value in
tons Monetization
in NIS NIS per
kilometer % Direct
cost %
Pollution % total cost
Global pollution -3 070 -472 439 -0,020 19% 12%
Local Pollution -2 044 440 -0,085 51%
NO x -38 -1 116 314 -0,047 44% 28%
Particles -2 -917 236 -0,038 36% 23%
HC -2 -10 866 0,000 0% 0%
CO -2 -23 0,000 0% 0%
Direct Cost -1 480 873 -0,062 37% Fuel
Consumption -886 -3 211 094 -0,134 217% 80%
Maintenance 0 0 0,000 0% 0%
Depreciation 0 1 730 221 0,072 -117% -43% Spec
maintenance 0 0 0,000 0% 0%
Spec fuel station 0 0 0,000 0% 0%
Total Cost -3 997 751 -0,167 100%
The main difference for the operators is in fact the initial investment of the buses. This overcost is
very profitable on the basis of 50000 kilometer per year.
The difference of the fuel consumption cost itself is more than the yearly depreciation including the
financial cost of the investment.
On an economic and financial point of view Euro5 is better than Euro4 type.

Energy Efficiency and Security for Public Transport Report – October 2009 55
5.2.7 SCENARIO 5: EURO4 VERSUS EURO5 LPG
The bus unit price is estimated at 1.15 million NIS; the maintenance cost per kilometer is 0.25 NIS. The
maintenance cost escalation is 6% per year to take into account the specific equipment to be checked,
in particular the tanks.
On the 12 years appraisal time, the table below summarizes the main output data, as well the
physical emissions and consumption, as for their monetarized values.
Scenario 5: EURO4 LPG 12 years duration calculation
physical
value in tons Monetization
in NIS NIS per
kilometer
% Direct cost
% Pollution
% total cost
Global pollution 44 912 6 910 982 0,288 67% 5%
Local Pollution 3 367 499 0,140 3%
NO x 115 3 351 541 0,140 33% 3%
Particles 0 0 0,000 0% 0%
HC 3 15 000 0,001 0% 0%
CO 86 958 0,000 0% 0%
Direct Cost 116 864 315 4,869 92%
Fuel Consumption 13 359 64 888 456 2,704 56% 51%
Maintenance 4 312 387 0,180 4% 3%
Depreciation 47 375 102 1,974 41% 37%
Spec maintenance 164 783 0,007 0% 0%
Spec fuel station 123 587 0,005 0% 0%
Total Cost 127 142 796 5,298 100%
Scenario 5bis: EURO5 LPG 12 years duration calculation
physical value
in tons Monetization in
NIS NIS per
kilometer
% Direct cost
% Pollution
% total cost
Global pollution 42 773 6 581 887 0,274 77% 5%
Local Pollution 2 011 564 0,084 2%
NO x 69 2 010 925 0,084 23% 2%
Particles 0 0 0,000 0% 0%
HC 0 0 0,000 0% 0%
CO 58 639 0,000 0% 0%
Direct Cost 113 752 598 4,740 93% Fuel
Consumption 12 718 61 776 739 2,574 54% 50%
Maintenance 4 312 387 0,180 4% 4%
Depreciation 47 375 102 1,974 42% 39% Spec
maintenance 164 783 0,007 0% 0%
Spec fuel station 123 587 0,005 0% 0%
Total Cost 122 346 049 5,098 100%
The comparison is in favor of Euro5 LPG type.
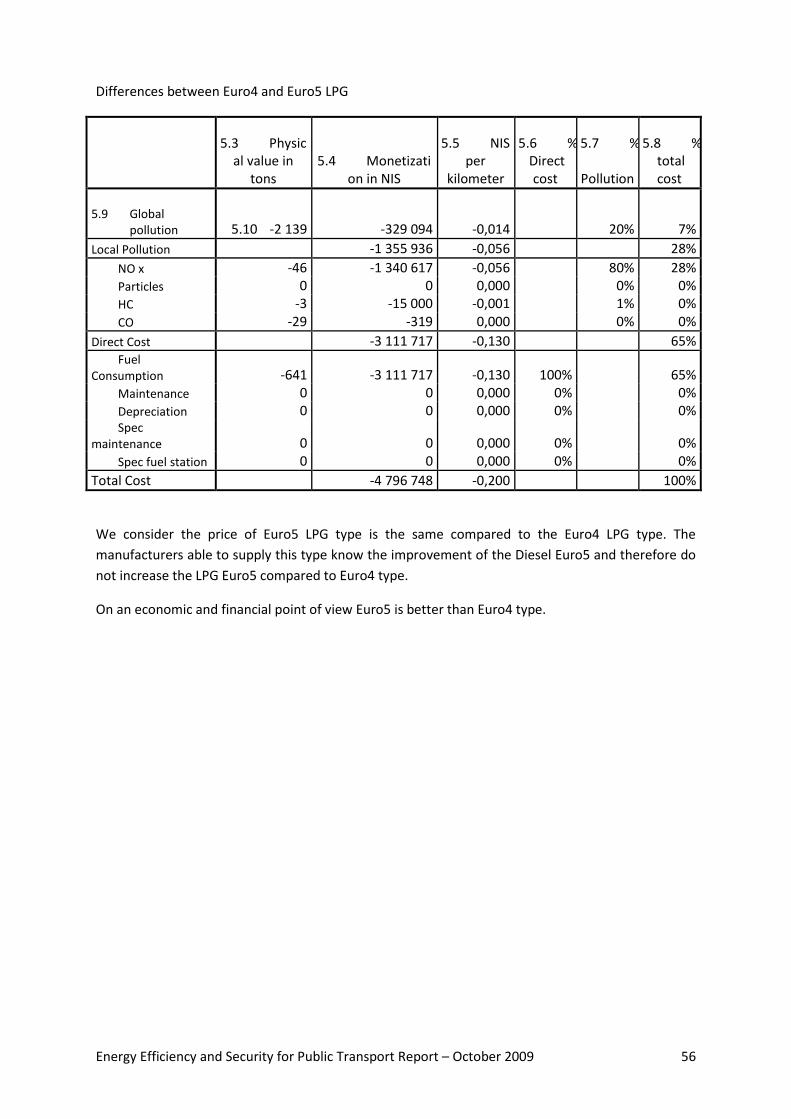
Energy Efficiency and Security for Public Transport Report – October 2009 56
Differences between Euro4 and Euro5 LPG
5.3 Physical value in
tons 5.4 Monetizati
on in NIS
5.5 NIS per
kilometer
5.6 % Direct
cost
5.7 %
Pollution
5.8 % total cost
5.9 Global pollution 5.10 -2 139 -329 094 -0,014 20% 7%
Local Pollution -1 355 936 -0,056 28%
NO x -46 -1 340 617 -0,056 80% 28% Particles 0 0 0,000 0% 0% HC -3 -15 000 -0,001 1% 0%
CO -29 -319 0,000 0% 0%
Direct Cost -3 111 717 -0,130 65% Fuel
Consumption -641 -3 111 717 -0,130 100% 65% Maintenance 0 0 0,000 0% 0% Depreciation 0 0 0,000 0% 0% Spec
maintenance 0 0 0,000 0% 0%
Spec fuel station 0 0 0,000 0% 0%
Total Cost -4 796 748 -0,200 100%
We consider the price of Euro5 LPG type is the same compared to the Euro4 LPG type. The
manufacturers able to supply this type know the improvement of the Diesel Euro5 and therefore do
not increase the LPG Euro5 compared to Euro4 type.
On an economic and financial point of view Euro5 is better than Euro4 type.

Energy Efficiency and Security for Public Transport Report – October 2009 57
Comparison of LPG Euro4 versus Diesel Euro4.
physical value in
tons Monetization in
NIS NIS per
kilometer % total
cost
Global pollution 14 210 2 186 593 0,091 46,3%
Local Pollution -3 142 244 -0,131 -48,3%
NO x -73 -2 230 031 -0,093 -40,0%
Particles -2 -917 236 -0,038 -100,0%
HC 1 4 134 0,000 38,0%
CO 80 888 0,000 1274,2%
Direct Cost 38 064 766 1,586 48,3%
Fuel Consumption 4 522 32 845 839 1,369 102,5% Maintenance 862 477 0,036 25,0%
Depreciation 4 119 574 0,172 9,5%
Spec maintenance 113 288 0,005 220,0%
Spec fuel station 123 587 0,005
Total Cost 37 109 115 1,546 41,2%
Comparison of LPG Euro5 versus Diesel Euro5.
physical value in
tons Monetization
in NIS NIS per
kilometer % total
cost
Global pollution 15 141 2 329 937 0,097 54,8%
Local Pollution 0 -2 453 741 -0,102 -55,0%
NO x -81 -2 454 333 -0,102 -55,0%
Particles 0 0 0,000 0,0%
HC 0 0 0,000 0,0%
CO 53 592 0,000 1274,2%
Direct Cost 36 433 922 1,518 47,1%
Fuel Consumption 4 767 32 945 216 1,373 114,3%
Maintenance 0 862 477 0,036 25,0%
Depreciation 0 2 389 353 0,100 5,3%
Spec maintenance 0 113 288 0,005 220,0%
Spec fuel station 0 123 587 0,005 0,0%
Total Cost 36 310 118 1,513 42,2%
5.10.1 SCENARIO 6: EURO4 VERSUS EURO5 CNG
The bus unit price is estimated to be 1.2 million NIS; the maintenance cost per kilometer is 0.25 NIS.
The maintenance cost escalation is 6% per year to take into account the specific equipment to be
checked, in particular the tanks.
On the 12 years appraisal time, the table below summarizes the main output data, as well the
physical emissions and consumption, as for their monetarized values.

Energy Efficiency and Security for Public Transport Report – October 2009 58
Scenario 6: EURO4 CNG 12 years duration calculation
physical
value in tons Monetization in
NIS NIS per
kilometer % Direct
cost %
Pollution % total
cost
Global pollution 34 925 5 374 307 0,224 61% 6%
Local Pollution 3 367 499 0,140 3%
NO x 115 3 351 541 0,140 38% 3%
Particles 0 0 0,000 0% 0%
HC 3 15 000 0,001 0% 0%
CO 86 958 0,000 0% 0%
Direct Cost 87 540 917 3,648 91%
Fuel Consumption 10 363 32 598 965 1,358 37% 34%
Maintenance 4 312 387 0,180 5% 4%
Depreciation 49 434 889 2,060 56% 51%
Spec maintenance 164 783 0,007 0% 0%
Spec fuel station 1 029 894 0,043 1% 1%
Total Cost 96 282 723 4,012 100%
Scenario 6bis: EURO4 CNG 12 years duration calculation
physical value
in tons Monetization in
NIS NIS per
kilometer % Direct
cost %
Pollution % total
cost
Global pollution 33 799 5 200 942 0,217 72% 6%
Local Pollution 2 011 564 0,084 2%
NO x 69 2 010 925 0,084 28% 2%
Particles 0 0 0,000 0% 0%
HC 0 0 0,000 0% 0%
CO 58 639 0,000 0% 0%
Direct Cost 86 355 500 3,598 92%
Fuel Consumption 9 986 31 413 548 1,309 36% 34%
Maintenance 4 312 387 0,180 5% 5%
Depreciation 49 434 889 2,060 57% 53%
Spec maintenance 164 783 0,007 0% 0%
Spec fuel station 1 029 894 0,043 1% 1%
Total Cost 93 568 006 3,899 100%

Energy Efficiency and Security for Public Transport Report – October 2009 59
Difference between Euro4 and Euro5 CNG
physical value in
tons Monetization in
NIS NIS per
kilometer % Direct cost % Pollution % total cost
Global pollution -1 127 -173 365 -0,007 11% 6%
Local Pollution -1 355 936 -0,056 50%
NO x -46 -1 340 617 -0,056 88% 49%
Particles 0 0 0,000 0% 0%
HC -3 -15 000 -0,001 1% 1%
CO -29 -319 0,000 0% 0%
Direct Cost -1 185 417 -0,049 44%
Fuel Consumption -377 -1 185 417 -0,049 100% 44%
Maintenance 0 0 0,000 0% 0%
Depreciation 0 0 0,000 0% 0% Spec
maintenance 0 0 0,000 0% 0%
Spec fuel station 0 0 0,000 0% 0%
Total Cost -2 714 718 -0,113 100%
The comparison shows the advantages of the Euro5 type compared to the Euro4 type.
We consider the price of Euro5 CNG type is the same compared to the Euro4 CNG type. The
manufacturers able to supply this type know the improvement of the Diesel Euro5 and therefore do
not increase the CNG Euro5 compared to Euro4 type.
On an economic and financial point of view Euro5 is better than Euro4 type.
Comparison between CNG Euro4 and Diesel Euro4.
physical value in
tons Monetization in
NIS NIS per
kilometer % total
cost
Global pollution 4 224 649 918 0,027 13,8%
Local Pollution -3 142 244 -0,131 -48,3%
NO x -73 -2 230 031 -0,093 -40,0% Particles -2 -917 236 -0,038 -100,0%
HC 1 4 134 0,000 38,0% CO 80 888 0,000 1274,2%
Direct Cost 8 741 368 0,364 11,1%
Fuel Consumption 1 526 556 348 0,023 1,7% Maintenance 862 477 0,036 25,0% Depreciation 6 179 361 0,257 14,3%
Spec maintenance 113 288 0,005 220,0% Spec fuel station 1 029 894 0,043
Total Cost 6 249 042 0,260 6,9%
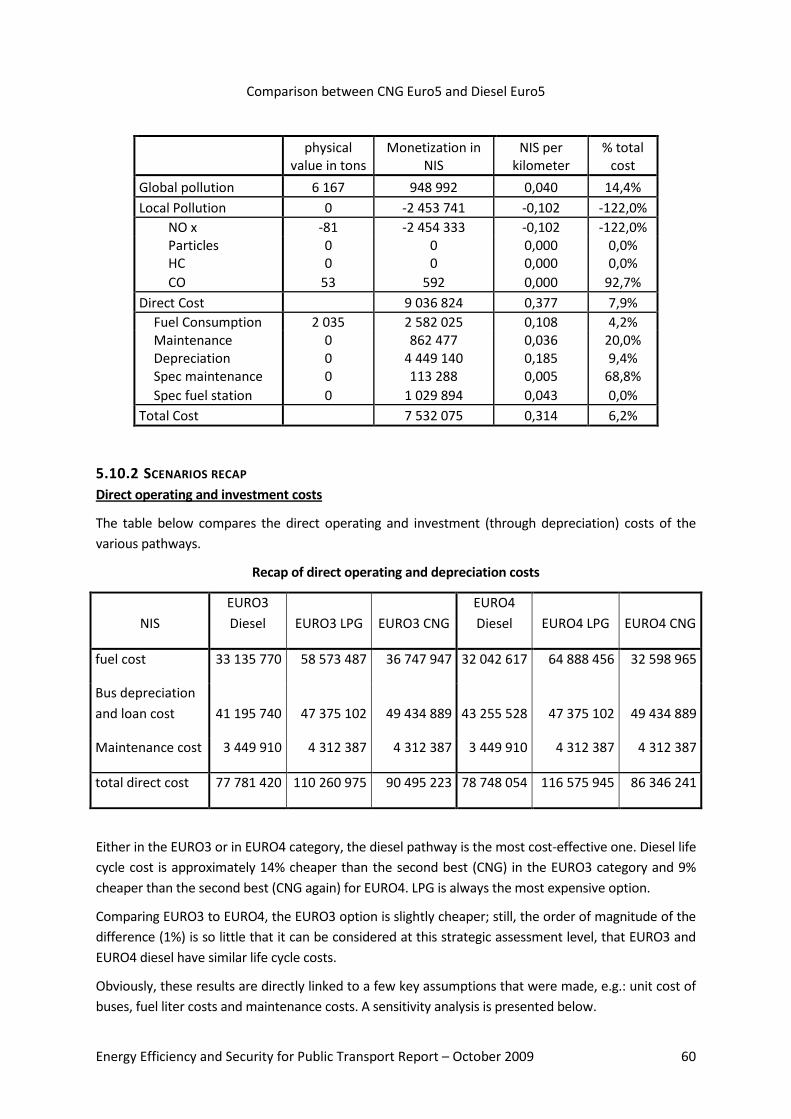
Energy Efficiency and Security for Public Transport Report – October 2009 60
Comparison between CNG Euro5 and Diesel Euro5
physical
value in tons Monetization in
NIS NIS per
kilometer % total
cost
Global pollution 6 167 948 992 0,040 14,4%
Local Pollution 0 -2 453 741 -0,102 -122,0%
NO x -81 -2 454 333 -0,102 -122,0% Particles 0 0 0,000 0,0% HC 0 0 0,000 0,0%
CO 53 592 0,000 92,7%
Direct Cost 9 036 824 0,377 7,9%
Fuel Consumption 2 035 2 582 025 0,108 4,2% Maintenance 0 862 477 0,036 20,0% Depreciation 0 4 449 140 0,185 9,4% Spec maintenance 0 113 288 0,005 68,8%
Spec fuel station 0 1 029 894 0,043 0,0%
Total Cost 7 532 075 0,314 6,2%
5.10.2 SCENARIOS RECAP
Direct operating and investment costs
The table below compares the direct operating and investment (through depreciation) costs of the
various pathways.
Recap of direct operating and depreciation costs
NIS
EURO3
Diesel EURO3 LPG EURO3 CNG
EURO4
Diesel EURO4 LPG EURO4 CNG
fuel cost 33 135 770 58 573 487 36 747 947 32 042 617 64 888 456 32 598 965
Bus depreciation
and loan cost 41 195 740 47 375 102 49 434 889 43 255 528 47 375 102 49 434 889
Maintenance cost 3 449 910 4 312 387 4 312 387 3 449 910 4 312 387 4 312 387
total direct cost 77 781 420 110 260 975 90 495 223 78 748 054 116 575 945 86 346 241
Either in the EURO3 or in EURO4 category, the diesel pathway is the most cost-effective one. Diesel life
cycle cost is approximately 14% cheaper than the second best (CNG) in the EURO3 category and 9%
cheaper than the second best (CNG again) for EURO4. LPG is always the most expensive option.
Comparing EURO3 to EURO4, the EURO3 option is slightly cheaper; still, the order of magnitude of the
difference (1%) is so little that it can be considered at this strategic assessment level, that EURO3 and
EURO4 diesel have similar life cycle costs.
Obviously, these results are directly linked to a few key assumptions that were made, e.g.: unit cost of
buses, fuel liter costs and maintenance costs. A sensitivity analysis is presented below.

Energy Efficiency and Security for Public Transport Report – October 2009 61
NIS EURO4 Diesel EURO4 LPG EURO4 CNG
EURO5 Diesel EURO5 LPG
EURO5 CNG
fuel cost 32 042 617 64 888 456 32 598 965 28 831 523 61 776 739 31 413 548 Bus depreciation and loan cost 43 255 528 47 375 102 49 434 889 44 985 749 47 375 102 49 434 889 Maintenance cost 3 449 910 4 312 387 4 312 387 3 449 910 4 312 387 4 312 387
total direct cost 78 748 054 116 575 945 86 346 241 77 267 182 113 464 228 85 160 824
The option of Euro5 types shows (for 50000 kilometer per year) that it is more interesting for all any
pathway chosen. The difference is approximately 1 million of NIS for Diesel and CNG, and 3 millions NIS
for LPG pathway.
Pollution costs
The table below compares the physical emissions of the various pathways.
Physical emissions of the pathways
EURO3 Diesel EURO3 LPG
EURO3 CNG
EURO4 Diesel EURO4 LPG
EURO4 CNG
Emissions in ton
CO² 31 728 40 624 39 422 30 702 44 912 34 926
CO 18 144 86 6 86 86
HC 18 2 2 2 2 2
NO x 348 300 184 188 116 116
Particles 4 0 0 2 0 0
fuel consumption in ton 9 138 12 058 11 682 8 836 13 358 10 364
For CO, HC and particles, the 6 scenarios have really good results and there is not much difference
between them.
For NOx, EURO4 is approximately twice as much better than EURO3, LPG and CNG being much better
than diesel.
Regarding fuel consumption (and, therefore, CO2 emissions), diesel is always the best pathway, EURO4
being slightly better than EURO3. Fuel consumptions savings range between -15% and -34%,
comparing diesel to the other pathways.

Energy Efficiency and Security for Public Transport Report – October 2009 62
5.10.3 EURO4 Diesel
EURO4 LPG EURO4 CNG
EURO5 Diesel
EURO5 LPG EURO5 CNG
Emissions in ton CO² 30 702 44 912 34 925 27 632 42 773 33 799 CO 6 86 86 4 58 58 HC 2 3 3 0 0 0 NO x 188 115 115 151 69 69 Particles 2 0 0 0 0 0 fuel consumption in ton 8 837 13 359 10 363 7 951 12 718 9 986
The Euro5 pathways are slightly better than Euro4, specifically for the NO x which is related to some
health diseases. The particles for Diesel Euro5 are considered as none.
The table below compares the pollution costs, local and global (CO2) of the various pathways.
Recap of pollution costs
NIS EURO3 Diesel
EURO3 LPG EURO3 CNG
EURO4 Diesel EURO4 LPG
EURO4 CNG
CO² 4 882 162 6 251 080 6 066 214 4 724 388 6 910 982 5 374 306
CO 218 1596 958 70 958 958
HC 101 484 15 000 15 000 10 866 15 000 15 000
NO x 10 415 518 8 713 148 5 361 606 5 581 572 3 351 542 3 351 542
Particles 1 758 608 0 0 917 236 0 0
Total pollution
17 157 990 14 980 824 11 443 780 11 234 132 10 278 482 8 741 806 indirect cost
As expected, EURO4 scenarios are, on the whole, much better than the EURO3 ones: between -24%
and -35% of emission savings when each EURO3 pathway is compared to its EURO4 counterpart.
While EURO3 diesel is, by far, the worst pathway and EURO4 CNG the best, it can be stated that EURO3
CNG, EURO4 diesel and EURO4 LPG are within the same order of magnitude when it comes to
pollution costs.
NIS EURO4 Diesel EURO4 LPG EURO4 CNG
EURO5 Diesel EURO5 LPG
EURO5 CNG
CO² 4 724 389 6 910 982 5 374 307 4 251 950 6 581 887 5 200 942 CO 70 958 958 46 639 639 HC 10 866 15 000 15 000 0 0 0 NO x 5 581 572 3 351 541 3 351 541 4 465 258 2 010 925 2 010 925 Particles 917 236 0 0 0 0 0
total pollution indirect cost 11 234 133 10 278 481 8 741 806 8 717 254 8 593 451 7 212 506
The Euro5 pathways are better than Euro4 for the emissions global and local pollution. At least 20% is
saved in NIS based on external costs hypothesis.

Energy Efficiency and Security for Public Transport Report – October 2009 63
Total costs
The life cycle cost (including environmental costs) comparison of the various pathways is presented
below:
Global comparison between the pathways
NIS EURO3 Diesel EURO3 LPG EURO3 CNG EURO4 Diesel EURO4 LPG
EURO4 CNG
CO² 4 882 162 6 251 080 6 066 214 4 724 388 6 910 982 5 374 306
CO 218 1596 958 70 958 958
HC 101 484 15 000 15 000 10 866 15 000 15 000
NO x 10 415 518 8 713 148 5 361 606 5 581 572 3 351 542 3 351 542
Particles 1 758 608 0 0 917 236 0 0
Total pollution indirect cost 17 157 990 14 980 824 11 443 778 11 234 132 10 278 482 8 741 806
fuel cost 33 135 770 58 573 487 36 747 947 32 042 617 64 888 456 32 598 965 Bus depreciation
and loan cost 41 195 740 47 375 102 49 434 889 43 255 528 47 375 102 49 434 889 Maintenance
cost 3 449 910 4 312 387 4 312 387 3 449 910 4 312 387 4 312 387
total direct cost 77 781 420 110 260 975 90 495 223 78 748 054 116 575 945 86 346 241
maintenance depot 51 495 164 783 164 783 51 495 164 783 164 783
fuel station 0 123 587 1 029 894 0 123 587 1 029 894
total direct and specific costs 77 832 915 110 549 345 91 689 900 78 799 549 116 864 315 87 540 918
TOTAL COSTS 94 990 905 125 530 169 103 133 678 90 033 681 127 142 797 96 282 724
On the 6 scenarios presented, EURO4 diesel is the most cost-effective, with very little cost difference
with EURO3 diesel. The diesel scenarios are between -7% and -29% cheaper than the other scenarios,
EURO4 CNG is the third cheaper, but approximately 8% more expensive than the diesel scenarios. The
LPG scenarios are much more expensive.
It is interesting to notice that the EURO4 Diesel scenario has the best result neither for the potion costs
nor for the operating + depreciation costs. Nonetheless, this scenario is the best compromise.
Among EURO3 pathways, the Diesel EURO3 scenario is the most cost-effective. Even if we separate the
specific costs to launch the LPG or the CNG fuels, Diesel offers the cheapest life cycle cost for the
operators. The Diesel fuel pathway is the lowest direct cost and total cost. For the emissions, the diesel
Euro3 type bus has the lowest global pollution emissions. However, for local pollutants, CNG is the
best, thanks to the absence of particles (same situation for the LPG) and the NO x emission which is
lower than all the others pathways.
Among EURO4 pathways, the global pollution is reduced for the Diesel fuel whereas both LPG and CNG
are best for local pollution. Nonetheless, from the operator standpoint (direct costs), again the Diesel
pathway is the cheapest one.
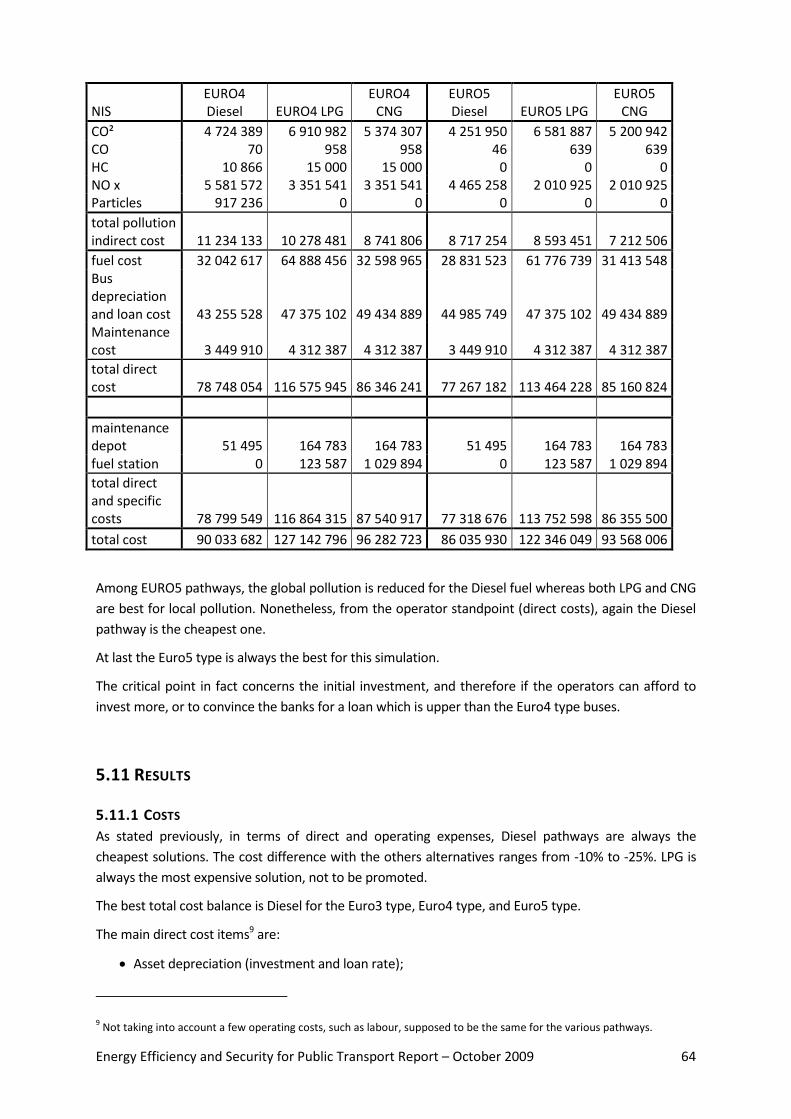
Energy Efficiency and Security for Public Transport Report – October 2009 64
NIS EURO4 Diesel EURO4 LPG
EURO4 CNG
EURO5 Diesel EURO5 LPG
EURO5 CNG
CO² 4 724 389 6 910 982 5 374 307 4 251 950 6 581 887 5 200 942 CO 70 958 958 46 639 639 HC 10 866 15 000 15 000 0 0 0 NO x 5 581 572 3 351 541 3 351 541 4 465 258 2 010 925 2 010 925 Particles 917 236 0 0 0 0 0
total pollution indirect cost 11 234 133 10 278 481 8 741 806 8 717 254 8 593 451 7 212 506
fuel cost 32 042 617 64 888 456 32 598 965 28 831 523 61 776 739 31 413 548 Bus depreciation and loan cost 43 255 528 47 375 102 49 434 889 44 985 749 47 375 102 49 434 889 Maintenance cost 3 449 910 4 312 387 4 312 387 3 449 910 4 312 387 4 312 387
total direct cost 78 748 054 116 575 945 86 346 241 77 267 182 113 464 228 85 160 824
maintenance depot 51 495 164 783 164 783 51 495 164 783 164 783 fuel station 0 123 587 1 029 894 0 123 587 1 029 894
total direct and specific costs 78 799 549 116 864 315 87 540 917 77 318 676 113 752 598 86 355 500
total cost 90 033 682 127 142 796 96 282 723 86 035 930 122 346 049 93 568 006
Among EURO5 pathways, the global pollution is reduced for the Diesel fuel whereas both LPG and CNG
are best for local pollution. Nonetheless, from the operator standpoint (direct costs), again the Diesel
pathway is the cheapest one.
At last the Euro5 type is always the best for this simulation.
The critical point in fact concerns the initial investment, and therefore if the operators can afford to
invest more, or to convince the banks for a loan which is upper than the Euro4 type buses.
5.11 RESULTS
5.11.1 COSTS
As stated previously, in terms of direct and operating expenses, Diesel pathways are always the
cheapest solutions. The cost difference with the others alternatives ranges from -10% to -25%. LPG is
always the most expensive solution, not to be promoted.
The best total cost balance is Diesel for the Euro3 type, Euro4 type, and Euro5 type.
The main direct cost items9 are:
Asset depreciation (investment and loan rate);
9 Not taking into account a few operating costs, such as labour, supposed to be the same for the various pathways.

Energy Efficiency and Security for Public Transport Report – October 2009 65
Fuel cost.
For the external costs, the main parameter is NOx for local pollution, and of course the green effect gas
with the carbon dioxide. Depending of the goals of the Palestinian Authority, these ‘external costs’
have to be reduced to reduce the pollution.
5.11.2 GAS EMISSIONS
For the global pollution, the Diesel is the best solution. This is due to the efficiency of the engine,
inducing lesser fuel consumption, compared to the Otto engines. CNG could be better when the
natural gas comes from waste valorization. In this case, the global balance is more or less neutral, and
therefore the Bio Gas is in this case the best.
NOx has to be considered seriously for the comparison and the choice of the buses. Of course the NOx
emitted from the buses have to be evaluated in comparison with the other sources of pollution.

Energy Efficiency and Security for Public Transport Report – October 2009 66
Finally, the particles emissions are drastically reduced from the existing fleet to the Euro3 choice (1/10
of emissions) and for Euro4 reaches 1/20 reduction.
5.11.3 SAFETY
LPG and CNG are often viewed as non secure fuels. However, these fuels are in fact very safe, and are
even used for home appliances (cooking and heating), as well as in the industry.
In many countries, lots of regulations cater for LPG and CNG used. For buses, tanks must be checked in
order to avoid any leakage, and safety valves have to be calibrated every three or four years. For
instance, a few regulations impose that CNG tanks are checked every 8 to 10 years.
In fact the LPG / CNG alternatives really require stricter safety rules when the buses are indeed parked
within the maintenance depot.
5.11.4 FUEL AVAILABILITY
It is really needed to check in details the supply reliability of LPG / CNG and compare it to that of diesel;
the present study could not enter much into this issue. For LPG, it seems that this fuel has not been
always available for cars, and the operators should negotiate with the potential suppliers that they will
be supplied at any. Contrary to cars, it is very rare to have dual fuel Diesel-LPG buses. The only engine
which can operate as a dual fuel is Cummins type.
For the CNG, the situation is similar to the LPG. Very few models of engine are available as Dual fuel
(Diesel and Natural gas).
In fact, we consider that Diesel is the best fuel to be operated at any time. LPG and CNG fuels
represent greater risks.
5.12 SENSITIVITY ANALYSIS
5.12.1 METHOD
The sensitivity analysis is carried out on the following parameters, which are the main drivers and of
most importance for the operators (more than 80% of the direct costs):

Energy Efficiency and Security for Public Transport Report – October 2009 67
Bus capital cost: break-even bus capital costs, for LPG and CNG, that would make these
pathways as interesting as diesel;
Diesel price escalation: break-even escalation rate that would make other pathways as cheap as
the diesel pathway;
Lower loan rate;
Lower actualization rate.
5.12.2 RESULTS
The table below shows what the level of bus prices should be (break-even price) so that alternative
pathways are as interesting as the Diesel EURO3 pathway. The calculation is carried out only on the
direct costs (excluding pollution).
NIS Origin Price
Break Even
Price Delta price Delta %
Diesel Euro3 1 000 000 1 000 000 0 0,0%
Diesel Euro4 1 050 000 1 025 000 -25 000 -1,0%
LPG Euro3 1 150 000 350 000 -800 000 -69.5%
LPG Euro4 1 150 000 200 000 -950 000 -82,6%
CNG Euro3 1 200 000 860 000 -340 000 -28,3%
CNG Euro4 1 200 000 965 800 -235 000 -19,6%
The direct costs are similar for unit price of buses as follows:
In fact, this situation is very unlikely; CNG and LPG buses will always be more expensive than Diesel
buses. The only solution to reach -20% to -30% discounts on CNG bus capital costs (as needed for their
life cycle cost to be in line with those of diesel) is to buy second hand buses, with the assumption that
these second hand buses are in very good condition. For LPG bus pathway this option is not valid at
any time and any assumption.

Energy Efficiency and Security for Public Transport Report – October 2009 68
Diesel price evolution influence
LPG and CNG prices are assumed to increase every year at a 5% rate. The table below shows what
should be the diesel yearly increase rates so that alternative pathways are as cost-effective as the
EURO3 diesel scenario. The calculation is carried out only on the direct costs (excluding pollution).
Origin Rate
Diesel Rate for
break even
Diesel Euro3 5,0%
Diesel Euro4 5,0% 4,0%
LPG Euro3 5,0% 19,0%
LPG Euro4 5,0% 20,5%
CNG Euro3 5,0% 12,5%
CNG Euro4 5,0% 10,5%
Diesel should be increasing at least at a 10.5% yearly rate (during 12 years) so that a CNG or LPG
pathway begins to be as cost-effective as the EURO3 diesel pathway. Even within a context of high oil
volatility, this situation seems rather unlikely.
Loan rate influence
From 10% to 5% yearly rate, the ranking of the pathways is not changed. We note a decreasing of the
cost of around 15% of the total direct costs (debt service).
Total direct costs Loan rate = 10% per year
Total direct costs Loan rate = 5% per year

Energy Efficiency and Security for Public Transport Report – October 2009 69
A 5% interest loan rate would be very low within the WBG situation. A higher than 10% interest rate, as
in the base-case scenarios, would favour again the diesel scenarios, which entail the least capital costs.
Actualization rate influence
From 12% to 5% yearly rate.
In fact this parameter changes the total amount of the costs, but not the ranking; the variation is more
or less the same in percentage for every pathway. The reason is the large impact of the investment.
Actualization rate 12% per year
Actualization rate 5% per year

Energy Efficiency and Security for Public Transport Report – October 2009 70
From 12% to 5% actualization rate, the difference is similar to 12 to 28 % between these two values.
That shows there is not a real impact on the ranking of the different pathways and Euro type buses.
5.13 SYNTHESIS
Investment and operating costs
The chart below compares the 6 scenarios investment and operating costs, for a fleet of 40 buses, over
a 12-year period. Results are in discounted million NIS.
Direct life-cycle costs, 40 buses (million NIS)
Comparing only direct costs (operating and investment costs), the diesel scenarios are between -9%
and -32% cheaper than the other scenarios. EURO4 CNG is the third cheaper, but approximately 9%
more expensive than the diesel scenarios. The LPG scenarios are the most expensive.

Energy Efficiency and Security for Public Transport Report – October 2009 71
The estimated cost for the existing fleet is only based on maintenance cost, nothing for the
depreciation due to the age of the fleet. Therefore the cost seems the best, which is not in fact the
reality.
Pollution costs
Turning to pollution costs, the chart below compares the 6 scenarios (monetarized costs in discounted
million NIS) for a fleet of 40 buses, over a 12-year period.
Monetarized pollution costs on 12 years, 40 buses (million NIS)
As expected, EURO 4 buses are much less polluting than EURO 3 buses, noting that EURO3 CNG is
almost at the EURO4 levels. For diesel, it is interesting to note that there is a 35% pollution costs
decrease between the EURO3 and EURO4 models. Euro5 are by far the best due to the more stringent
regulations.
Total direct and pollution costs
The chart below compares the 6 scenarios total costs (investment, operating and pollution costs), for a
fleet of 40 buses, over a 12-year period. Results are in discounted million NIS.
Total life-cycle costs, 40 buses (million NIS)
Energy Efficiency and Security for Public Transport Report – October 2009 72
The most cost-effective pathway is Diesel, within the local conditions in West Bank. The EURO4 diesel
is the most cost-effective, with very little cost difference compared to EURO3 diesel. Comparing EURO3
diesel to EURO4 diesel, the latter provides significant local emission savings, for only slighter direct
costs. The diesel scenarios are between -9% and -24% cheaper than the other scenarios, direct costs
(including: fuel consumption, maintenance and depreciation) and pollution costs included.
The sensitivity analysis shows the robustness of the results. Different assumptions do not change the
simulation major results.
Besides, choosing the diesel pathway could also offer an opportunity to buy second hand buses, and
therefore to reduce at a competitive level the direct costs for the operators. Diesel is also the more
flexible and represents today the coherent choice for new buses. Finally, diesel is the pathway that
requires the least maintenance reorganization in today’s operators’ workshops.
On this basis, EURO4 diesel buses are recommended. Within the current regulatory framework, this
recommendation will still have to comply with Israeli importation regulation. Current regulation
demands that imported heavy vehicles are EURO4 compliant. Should EURO5 become mandatory in the
future, EURO 5 buses would be required. In that case, EURO5 fleet would entail:
An extra investment cost per bus of approx. 3-4%;
A fuel consumption reduction by 7%;
Maintenance costs approximately the same.
The comparison shows the advantage of the Euro5 compared to Euro4, due to the mileage, and to
the reduction of the fuel consumption for all pathways. The only critical point concerns the initial
investment which should be the barrier for the operators. In fact they are not in a strong financial
position and they should prefer the minimum of investment to renew their fleet.
6 RECOMMENDATIONS The recommendations are the following:
Build the case for fleet renewal. New rolling stock is critical, both for service quality to customers
and for the current operators to be able to continue service and business. An estimated 200-250 bus
will be needed during the next 2-3 years, and as much as 400 over the next 5 years. The current
study may help the stakeholders to choose from various available options.
Decide on priorities: environment vs. minimizing costs. Better environmentally-friendly buses, such
as CNG buses, will come at an extra-cost. A policy decision is to be made regarding which importance
to be given to environmental issues, especially against cost constraints.
Foster Diesel pathways. In light of the conclusions of the study, the diesel pathway should be
promoted for public transport in WBG. Since the simulation results conclude that EURO3 and EURO4
technologies have direct costs in the same order of magnitude, EURO 4 should be encouraged. There
is a large spectrum of bus manufacturers, which give the opportunity to buy EURO3 or EURO4 buses
in good conditions. It is recommended to define a standard for all the operators in order to be able
to procure for a large number of buses at the same time.
Energy Efficiency and Security for Public Transport Report – October 2009 73
Fine-tune the results. The analysis that was carried aims at the strategic level and is preliminary. As
much as possible, it is recommended to fine-tune the simulation inputs so as to get more accurate
results. As the economic environment changes, three items should be of special focus: (i) the buses
unit prices, (ii) the fuel unit prices, and (iii) the bus duty cycle curves really used in WBG conditions.
Fuel supply and availability. Alternative fuels, especially natural gas, supply and availability should
be assessed in a more comprehensive way. The recent discovery of natural gas fields off-shore Gaza
might change energy equilibrium and markets in the region.
Improve operators’ financial situation. The operators financial capability is today limited.
Introducing new buses is likely to, at the same time, decrease the huge maintenance costs that have
to be incurred on their current worn-out buses but also increase dramatically their operating costs in
terms on loan repayment and depreciation. This action is part of the public transport strengthening
that is proposed through the large franchises scheme.
Improve maintenance process. The maintenance organization has to be updated. It is highly
recommended to choose one or just a few kinds of buses (“standard bus”), for the various operators,
so that the maintenance processes are streamlined and eased. The minimum agreement is common
warehouses for the spare parts. It is also recommended that the operators consider subcontracting
for specific operations that requires either heavy investments or high professional capacity. The
subcontracting could be through (i) the bus manufacturer organization, (ii) through the specialization
of the maintenance of the largest operators, or (iii) through a special company, as proposed in the
passenger transport sector development study.
Set a regulatory framework for LPG vehicles. Light LPG vehicles (private cars) are already in use in
the West Bank. Engine retrofitting is currently carried out in informal workshops. It is recommended
that a regulatory framework is established to control this activity and ensure safety standards. The
regulation should include: the retrofitting kits themselves, the garage which modifies the cars, the
LPG stations requirements, and the periodical technical control of the cars and of the stations.
The kits have to be able to comply with the Euro type level needed in Israel. The LPG tanks have to
be homologated related to the maximum pressure limit, and to offer the right fitting in case of car
accident. The garages must be equipped with the required facilities to install the LPG kits, and the
mechanics have to be certified, after proper specific training. The LPG stations must abide by all the
LPG safety requirements (LPG storage, LPG distribution)
The LPG cars should be controlled every period and be checked specially the LPG tank, and the
leakage diagnosis.

ANNEX 1: REFERENCES
GENERAL INFORMATION http://ec.europa.eu/transport/sustainable/2008_external_costs_en.htm
This website presents information about direct and external cost in Europe. Besides, the European
commission has a complete website including some specific topics or research and development
aspects the EC promoted and financed.
http://ies.jrc.ec.europa.eu/WTW
This website focuses on well to wheel emissions for any type of vehicles.
www.civitas-initiative.org
Most comprehensive EU bus program: CIVITAS.
http://www.euractiv.com/fr/transport/acquisition-vehicules-propres-eurodeputes-soutiennent-
projets-fermes-autorites-publiques/article-173633
This website is dedicated to promote clean and efficient vehicles.
BUS MANUFACTURERS Almost all of them have a website where all the pathways they produce are described. This is a non
exhaustive list of major European bus manufacturers:
IRISBUS irisbus.com
MAN man-mn.com
MERCEDES evobus.com
VOLVO Volvo.com/bus
SCANIA scania.com/bus
SOLARIS solarisbus.pl
ASSOCIATIONS OR SPECIFIC ORGANIZATIONS For some techniques or topics, different associations or organizations exist, which promote or/and
describe the available products.
http://www.dieselnet.com/standards/eu/hd.php
This site gathers the different regulations and emissions of the diesel engines.
www.diester.org
This website focuses on bio-diesel.
www.dieselretrofit.eu/
This website is useful regarding particulate emissions reduction on existing fleets.
www.ngvglobal.com

Energy Efficiency and Security for Public Transport Report – October 2009 75
This website focuses on natural gas (CNG, LNG).
www.biogasmax.com
This website gathers information about a few cities in Europe which use biogas.
www.althytude.info
This site is dedicated to the HYTHANE fuel (a mixture of gas and hydrogen).
www.cleanairnet.org ; www.lpg-vehicles.co.uk
This sites focus on fuel LPG-run buses.
www.fuel-cell-bus-club.com ; www.fuelcells.org
This sites focus on fuel cell technologies.
www.ethanolbus.com
This site focuses on Ethanol-run buses.
OTHERS USEFUL WEBSITES www.transbus.org
This is the website specialize in buses in France. It also has a lot of information about the French
operators and the new introduction of buses.
www.uitp.com
This website is the public transport international association. It contains information about alternative
fuels, networks and operators.
http://ec.europa.eu/energy/intelligent/implementation/reporting_en.htm
Projects such as STARBUS and others supported by the EC more precisely the Executive Agency for
Competitiveness and Innovation (EACI).
http://ec.europa.eu/transport/sustainable/doc/2008_costs_handbook.pdf For the external cost monetarization, the European Commission through the IMPACT (Internalization Measures and Policies for all Internal COSTS) survey gathers all the useful tables and external costs