Palestine Economic Policy Research Institute (MAS ... · CONTENTS Palestine Economic Policy...
22
Palestine Economic Policy Research Institute (MAS) Palestinian Central Bureau of Statistics (PCBS) Palestine Monetary Authority (PMA) 45
Transcript of Palestine Economic Policy Research Institute (MAS ... · CONTENTS Palestine Economic Policy...

Palestine Economic Policy Research Institute (MAS)Palestinian Central Bureau of Statistics (PCBS)Palestine Monetary Authority (PMA)
45

September 2016
Editor: Nu’man Kanafani
Palestine Economic Policy Research Institute- MAS (General Coordinator: Salam Salah)The Palestinian Central Bureau of Statistics (Coordinator: Amina Khasib)Palestine Monetary Authority (Coordinator: Shaker Sarsour)
CopyrightAll rights reserved. No part of this publication may be reproduced, stored in a retrieval system, or transmitted in any form or by any means, electronic, mechanical, photo copying, or otherwise, without the prior permission of the Palestine Economic Policy Research Institute/MAS, the Palestinian Central Bureau of Statistics and Palestine Monetary Authority.
@ 2016 Palestine Economic Policy Research Institute (MAS)P.O. Box 19111, Jerusalem and P.O. Box 2426, RamallahTelephone: +972-2-298-7053/4Fax: +972-2-298-7055e-mail: [email protected]: www.mas.ps
@ 2016 Palestinian Central Bureau of StatisticsP.O. Box 1647, RamallahTelephone: +972-2-2982700Fax: +972-2-2982710e-mail: [email protected]: www.pcbs.gov.ps
@ 2016 Palestine Monetary AuthorityP.O. Box 452, RamallahTelephone: +972-2-2409920Fax: +972-2-2409922e-mail: [email protected]: www.pma.ps
To Order CopiesContact the Administration on the above addresses.
This issue of the Economic & Social Monitor is partially supported by:
Economic Monitor Issue 45/2016
CONTENTS
Palestine Economic Policy Research Institute (MAS)
Palestinian Central Bureau of Statistics (PCBS)
Palestine Monetary Authority (PMA)
FORWORD
GDPBox 1: Population of East and West Jerusalem
Labor MarketBox 2: One Out of Five Workers is Paid Less Than the Minimum Wage
Public Finance Box 3: The PA’s Fiscal Losses on Clearance Revenues Estimated at US$ 300 million Annually
The Banking SectorBox 4: Correspondent Bank: A Channel for Remit-tances and Trade with Israel
Investment Indicators
Prices and Inflation Box 5: Economic Concepts and Definitions: Quantitative Easing
Foreign Trade
Key Economic Indicators in Palestine 2010-2016
In the previous issue of the Quarterly Economic Monitor – No. 44, we pointed out that we have been working on developing this publication, particularly in terms of enhancing its analytical con-tent, so as to better serve the needs of Palestinian policy-makers and researchers. We also mentioned that the three institutions in-volved in the preparation of this publication have been thinking of ways to expand the existing partnership. In addition to the provi-sion of data, it was envisaged that all partners will be more in-volved in contributing analyses that are relevant to the economic situation and that they will share the responsibility for securing the means for sustaining this publication.
Indeed, representatives of the three institutions met several times to discuss how to develop the Monitor and a representative of the Palestine Capital Market Authority (PCMA), which had expressed interest in joining the partnership with MAS, PMA and PCBS, was invited to attend. (PCMA has officially joined the partnership, effective the beginning of 2017). The discussions concentrated mostly on readers’ remarks and feedback that we have been able to gather, as well as on ideas presented by the Editor of the Monitor that aimed at improving form and content. Eventually, our three institutions agreed to modify the presentation and layout to make it more attractive, and to reduce the amount of text and to rely more on tables and graphics to convey the information. Also, it was decided to change the title from the “Economic and Social Monitor” to the “Economic Monitor” so as to give more promi-nence to the main the area of emphasis of the publication. It is understood, of course, that this change in the title does not pre-clude addressing social indicators occasionally, which tend to change more slowly than the economic indicators and are not ex-pected to undergo significant changes over a quarter of a year.
The most significant modification that was introduced in line with the expressed views of the partnering institutions was to gradually expand the analytical content of the Monitor. Thus the research departments at MAS, the PMA, and the PCMA will contribute analyses, whereas PCBS, as producer of the data, will not do so, in line with the requirements of scientific objectivity.
We hope that the readers will like this issue, and we welcome any feedback to further develop the Monitor and make it more useful to users, within the scope of its objectives. It is our pleasure to use this opportunity to extend our gratitude to all parties that contrib-uted funds that made sustaining this publication possible.
Palestine Economic Policy Research Institute (MAS)Palestinian Central Bureau of Statistics (PCBS)Palestine Monetary Authority (PMA)

Economic Monitor no. 45/ 2016
2
1. GDP
Gross Domestic Product (GDP) is the monetary value of all types of goods and services produced in an economy during a specific period of time. To avoid double counting, the GDP measures the value of final goods. And it is called “domestic” because it records the value of production within a certain geographic area, whether it is the production of a citizen or a non-citizen (while the “GNP” variable” takes into account the production of citizens of a certain country, whether they live inside or outside the country). GDP is valued at current prices or constant prices in a given year (base year). The lat-ter reflects the real increase in production and it excludes the increase generated by the rising prices (inflation) since the base year.
GDP is a measure of flow not of stock, like the stock of net capital assets accumulated in a country over the years. GDP is measured by one of two ways: from the production side (the value of what is produced by every economic sector, such as agriculture, industry, etc...) or from the use side (the value of the different uses of the produced goods, such as domestic consumption and investment). It is important to note that, since part of the domestic consumption comes from imports, and part of domestic production goes to ex-port, the calculation of GDP from the use side requires the addition of export and subtraction of imports.
The Palestinian GDP (at 2004 constant prices) grew by 0.6% over Q1 2016, and by an 8.0% annual growth rate between Q1 2015 and Q1 2016. This growth is mainly ascribed to economic expansion in the Gaza Strip:. the West Bank’s GDP grew by 5% compared to 20% in Gaza Strip. This high growth rate in Gaza Strip reflects an increase in production from a low level in the first place, as a result of the Israeli siege and latest invasion.
The Gap in GDP between the West Bank and the Gaza StripGaza Strip’s high GDP growth rate diminished the gap be-tween the West Bank’s and Gaza Strip’s contribution to GDP, as the latter increased from 22% in Q1 2015 to 25% in Q1 2016. Meanwhile the Strip’s per capita GDP reached US$ 274 during the first three months of 2016, which is less than the half of the West Bank’s per capita GDP.
Table 1-1: Per Capita GDP in Palestine * by Region (constant prices, base year 2004)
Economic Activity Q1 2015 Q1 2016
GDP (million US$) 1,852.0 444.3
-West Bank 1,431.6 564.0
-Gaza Strip 420.0 273.9
Per Capita GDP (US$) 423.4 444.3
-West Bank 555.6 564.0
-Gaza Strip 233.9 273.9(*) Data do not include that part of Jerusalem which was annexed by Israel following its occupation of the West Bank in 1967.
Figure 1-1: Palestine GDP* by Region (constant prices, base year 2004) (US $ Millions)
(*) Data do not include that part of Jerusalem which was annexed by Israel following its occupation of the West Bank in 1967.
Figure 1-3: Per Capita GDP in Palestine* (constant prices, base year 2004)
(*) Data do not include that part of Jerusalem which was annexed by Israel following its occupation of the West Bank in 1967.
Figure 1-2: GDP in the West Bank and the Gaza Strip*
(fixed prices, base year 2004) (US$ Millions)
(*) Data do not include that part of Jerusalem which was annexed by Israel following its occupation of the West Bank in 1967.
West Bank
Gaza Strip
0200400600800
1,0001,2001,4001,6001,8002,000
Q1 2015 Q4 2015 Q1 2016
Palestine
West Bank
Gaza Strip
0
500
1,000
1,500
2,000
2,500
Q1,
06
Q1,
07
Q1,
08
Q1,
09
Q1,
10
Q1,
11
Q1,
12
Q1,
13
Q1,
14
Q1,
15
Q1,
16
Palestine
West Bank
Gaza Strip
0
100
200
300
400
500
600
Q1, 0
6
Q1, 0
7
Q1, 0
8
Q1, 0
9
Q1, 1
0
Q1. 1
1
Q1, 1
2
Q1, 1
3
Q1, 1
4
Q1, 1
5
Q1, 1
6
3
Economic Monitor no. 45/ 2016
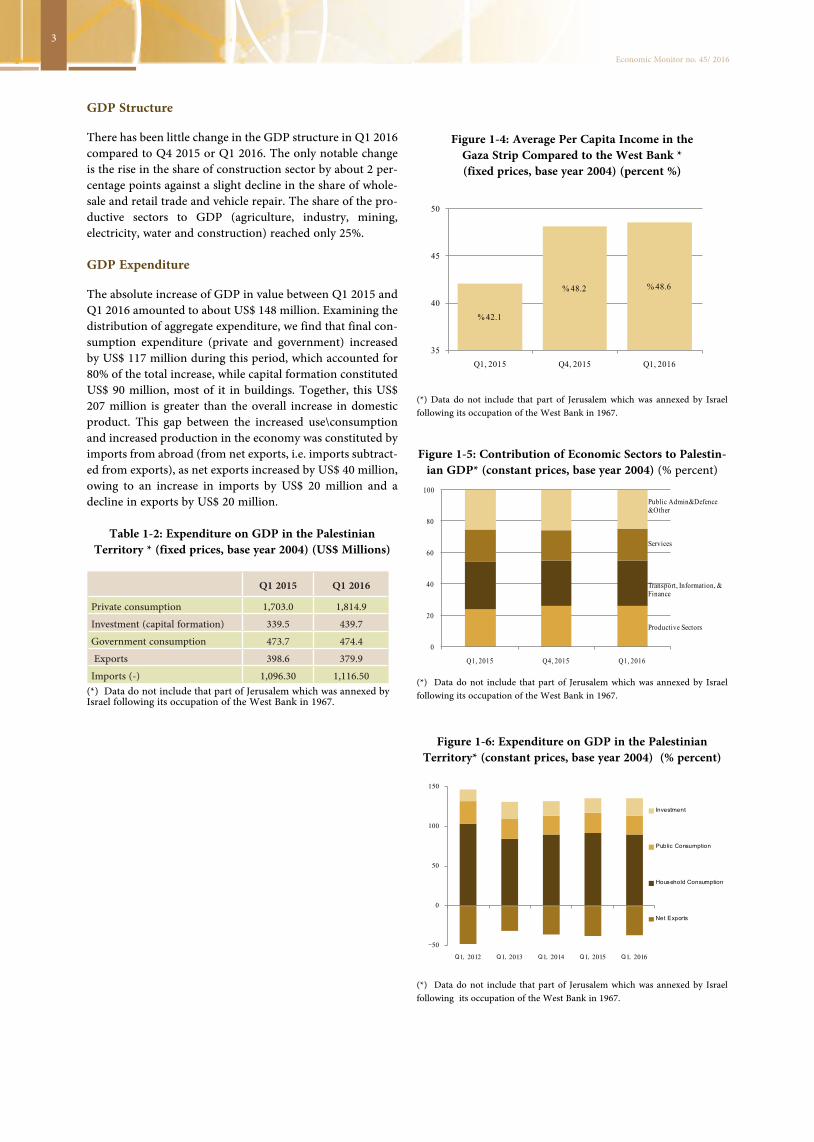
Figure 1-4: Average Per Capita Income in the Gaza Strip Compared to the West Bank * (fixed prices, base year 2004) (percent %)
(*) Data do not include that part of Jerusalem which was annexed by Israel following its occupation of the West Bank in 1967.
GDP Structure
There has been little change in the GDP structure in Q1 2016 compared to Q4 2015 or Q1 2016. The only notable change is the rise in the share of construction sector by about 2 per-centage points against a slight decline in the share of whole-sale and retail trade and vehicle repair. The share of the pro-ductive sectors to GDP (agriculture, industry, mining, electricity, water and construction) reached only 25%. GDP Expenditure
The absolute increase of GDP in value between Q1 2015 and Q1 2016 amounted to about US$ 148 million. Examining the distribution of aggregate expenditure, we find that final con-sumption expenditure (private and government) increased by US$ 117 million during this period, which accounted for 80% of the total increase, while capital formation constituted US$ 90 million, most of it in buildings. Together, this US$ 207 million is greater than the overall increase in domestic product. This gap between the increased use\consumption and increased production in the economy was constituted by imports from abroad (from net exports, i.e. imports subtract-ed from exports), as net exports increased by US$ 40 million, owing to an increase in imports by US$ 20 million and a decline in exports by US$ 20 million.
Table 1-2: Expenditure on GDP in the Palestinian Territory * (fixed prices, base year 2004) (US$ Millions)
Q1 2015 Q1 2016
Private consumption 1,703.0 1,814.9
Investment (capital formation) 339.5 439.7
Government consumption 473.7 474.4
Exports 398.6 379.9
Imports (-) 1,096.30 1,116.50(*) Data do not include that part of Jerusalem which was annexed by Israel following its occupation of the West Bank in 1967.
Figure 1-5: Contribution of Economic Sectors to Palestin-ian GDP* (constant prices, base year 2004) (% percent)
Figure 1-6: Expenditure on GDP in the Palestinian Territory* (constant prices, base year 2004) (% percent)
(*) Data do not include that part of Jerusalem which was annexed by Israel following its occupation of the West Bank in 1967.
(*) Data do not include that part of Jerusalem which was annexed by Israel following its occupation of the West Bank in 1967.
% 42.1
% 48.2 % 48.6
35
40
45
50
Q1, 2015 Q4, 2015 Q1, 2016
0
20
40
60
80
100
Q1, 2015 Q4, 2015 Q1, 2016
Public Admin&Defence &Other
Services
Transport, Information, & Finance
Productive Sectors
-50
0
50
100
150
Q1, 2012 Q1, 2013 Q1, 2014 Q1, 2015 Q1, 2016
Investment
Public Consumption
Household Consumption
Net Exports

Economic Monitor no. 45/ 2016
4
Box 1: Population of East and West Jerusalem
According to the Statistical Yearbook of Jerusalem (2016)1 issued by Jerusalem Municipality and the Jerusalem Institute for Israeli Stud-ies, the number of residents in East and West Jerusalem amounted to about 850 thousand in 2014, 37% of whom were Palestinians, almost all of whom lived in the eastern part of the City. As shown in the table below, the population’s natural increase rate and fertility rate are higher among Jewish settlers than Palestinians. This is attributed to the high percentage of religious Jews residing in Jerusalem. The Jerusalem municipal area, according to the Israeli definition, was constituted by 125 thousand acres in 2008 (compared to 33 thousand acres in 1952 and 108 thousand in 1967), which includes most of the Israeli settlements in the area of East Jerusalem occupied in 1967.
Table 1 : Demographic Numbers of Population in East and West Jerusalem (2014)
ArabsJews & others
Total
No. of Residents* 315,900 533,900 849,800
Percent of children (0-14) 38% 32% 34%
Percent of elderly aged 65 years and older
4% 12% 9%
Median age 20.7 years 25.8 years 23.7 years
Average persons per household
5.3 members 3.3 members 3.9 members
Natural increase rate 23.4 (per thousand)
23.7 (per thousand)
23.6 (per thousand)
Total fertility rate 3.33 (per thousand)
4.30 (per thousand)
3.91 (per thousand)
Source: the Statistical Yearbook of Jerusalem (2016).*The book uses the expression “residents”.
The figure below shows that the net increase in the number of resi-dents in East and West Jerusalem in 2014 amounted to 19,920, while the natural increase of the population amounted to 23,020 person. This is because the net increase of the population equals the natural increase of population plus immigration from other countries (3,600 immigrants) plus net internal migration. The net internal migration to/from Jerusalem was negative at 6,700 emigrants in the year 2014.
1 http://www.jiis.org/?cmd=statistic.544#.V5iYVvmrikp.
Figure 1: Development of Population in East and West Jerusalem (2014)
Source: http://www.jiis.org/?cmd=satistic.544#.V5iYVvmrikp
-20,000
-10,000
0
10,000
20,000
30,000
40,000
Natural increaserate
new emigrants
internal migrationto Jerusalem
migration fromJerusalem
2. The Labor Market
Labor market statistics differentiate between the population and the manpower. According to the Palestinian Central Bu-reau of Statistics (PCBS), the latter comprises all persons aged 15 years and older. As well it differentiates between manpower and the labor force where the latter includes only all persons qualified to work and seeking actively to find work. Finally, there is the actual number of the workers, where the deference between the labor force and the actual number of workers measures the ratio of unemployment.
The Participation Rate
The numbers show that the percent of labor force to man-power in Palestine (which is known as the participation rate) was around 45% in recent years. This ratio is close to prevail-ing ratios in other countries in the region (42% in Jordan, for example, in 2014, according to World Bank data), but it is significantly different from those in developed countries, where the participation rate is close to 60% or higher, as in Germany and Norway, for example.
There is a wide gap between the male and female participa-tion rates in Palestine, as the percent rises to 70% for males, and drops to only 20% for females. There is no remarkable disparity between the West Bank and Gaza Strip in this re-gard. Obviously, the decline in the female participation rate in Palestine is the factor driving the decline in the total par-ticipation rate.
Labor Distribution
The number of workers in Palestine rose by 1.1% between Q4 2015 and Q1 2016 reaching 974 thousand. The distribution of workers in Q1 2016 was 58% in the West Bank, around 30% in Gaza Strip, and 12% (or about 115 thousand workers) in Israel and the settlements. More than a fourth of the work-ers in Palestine work in the public sector, and this share rises to about 37% in the Gaza Strip, while the balance of the em-ployed work in the private sector.
Informal Israeli sources estimated the number of the West Bank workers inside the Green Line during Q1 2016 at 100 thousand workers, half of them working without official per-mits, while the number of workers inside Israeli settlements was 25 thousand.
During Q1 2016, the share of those working in the Palestini-an services sector was 35%, rising to 55% in the Gaza Strip. Trade employed 21% of workers in Palestine, while the con-struction sector employs 20% in the West Bank, and less than 7% in the Gaza Strip.
Unemployment
The unemployment rate (the number of unemployed people divided by the number of people in the labor force) rose to 26.6% in Q1 2016, one percentage point higher than the pre-vious quarter and the corresponding quarter 2015. This rise between the corresponding quarters was a result of the rise in

5
Economic Monitor no. 45/ 2016
Figure 2-1: Individuals (aged 15 years and older)and Workers in Palestine
Figure 2-2: % Distribution of Palestinian Workers by Region and by Sector, Q1 2016 (%)
Figure 2-3: % Distribution of Palestinian Workers by Economic Activity, Q1 2016 (%)
the unemployment rate in the West Bank (by two percentage points), while in the Gaza Strip the rate remained at nearly the same level (41.2%).
Table 2-1: Unemployment Rate among Individuals Participating in Palestine’s Labor Force by Region
and Gender (Q2 2016) (%)
Males Females Total
West Bank 15.5 28.4 18.0
Gaza Strip 34.5 62.6 41.2
Palestine 22.3 42.8 26.6 Two of the most noticeable characteristics of unemployment in the Palestinian territory are that:
1) It is high among the youth: the unemployment rate among the youth aged between 15-24 years reached 41.7% (61.3% for females against 37.2% for males). This indicates that a large proportion of the unemployed are new entrants to the labor market2) The unemployment rate decreases with the comple-tion of higher educational levels for males, inverse to females (see Figure 2-5): The unemployment rate in Q1 2016 amounted to 28.8% for uneducated males, while it was 18.8% for males with 13 schooling years and over. On the other hand, the unemployment rate for females with 13 schooling years and over was 48.1% while it was 11.7% only for uned-ucated females.
Production Growth and the Change in Unemployment
Figure 2-6 shows two curves; one for the rate of growth in production (at constant prices) and the other depicts the un-employment rate for each quarter during Q1 2012 to Q1 2016. The first noticeable aspect of the figure is the sharp fluctua-tion in the curve of the GDP growth rate. There is no doubt that part of this fluctuation can be explained by the seasonal/cyclical nature of GDP, as economic activity is somewhat re-duced in the winter and autumn compared to other seasons. Nevertheless, the impact of political factors and restrictions imposed by the occupation on economic activity elucidate the sharp and periodic fluctuation of economic growth. The sec-ond issue of note is that there is a clear relation between the movement of the two curves, i.e. whenever there is an in-crease in the rate of growth of production, there will be a de-cline in the unemployment rate, and vice versa.
Using a simple exercise to link the two variables during the study period, we find that every increase in the growth rate by 1% is accompanied by a decrease in the unemployment rate by 0.26% during the study period. This simplified and proximate linkage provides a simple estimate of the amount of acceleration needed in the growth rate and the time span necessary to achieve a significant reduction in the high un-employment rates, in Palestine in general, and in Gaza Strip in particular.
Population
Manpower
Work Force
No. of Workers0
1,000
2,000
3,000
4,000
5,000
6,000
Q1, 09
Q3, 09
Q1,1
0
Q3, 10
Q1, 11
Q3, 11
Q1, 12
Q3, 12
Q1, 13
Q3, 13
Q1, 14
Q3, 14
Q1, 15
Q3, 15
Q1, 16
Is rael &Settlments
OtherSectors
PrivateSector
PublicSector
0
20
40
60
80
100Israel &Settlments
Gaza Strip
West bank
Agriculture, Fishery, & Fostery Mining &
Manufacturing Industries
Building & construction
Trade, Resturants, &
Hotels
Transportation, Storage, &
Telecommunication
Services & other Sectors

Economic Monitor no. 45/ 2016
6
Figure 2-4: The No. of Employed and Unemployed in Palestine by Age Group (Q1 2016)
Figure 2-5: The No. of Employed and Unemployed in Palestine by Educational Level and Gender (Q1 2016)
Figure 2-6: Growth Rate of GDP and Unemployment Rate in Palestine (Q1 2012 - Q1 2016)
Work Hours and Days
Figure 2-7 and Table 2-2 show the average work hours and days for Palestinian workers. It is noted that there is a conver-gence in the average number of the monthly work days in the West Bank and Gaza Strip, but the average number of weekly work hours in the West Bank is higher than Gaza Strip by more than 15%. This is more owing to lack of employment opportunities in the Strip than the productivity or choice of hours of work (comfort preferences), which is the case in the developed countries, where such factors explain shorter work hours.
Table 2-2: The Average Weekly Work Hours and the Monthly Work Days by Region (Q1 2016)
Place of Work
Average
Weekly Work
Hours
Average Monthly
Work days
West Bank 43.9 22.5
Gaza Strip 38.1 22.3
Israel and the settlements 40.3 19.8
Total 41.6 22.0
Wages
The data indicate that the average wage of workers in Israel and the settlements is about triple the wage of workers in the Gaza Strip. The gap is even wider when considering the me-dian wage. The median wage is significantly higher than the average wage, because it reflects the wage level whereby the wages of half of all workers are above it, and the wages of half of all workers are below it.
The median daily wage for workers in Palestine amounted to NIS 92.3 in Q1 2016, which means that the wages of half of the known-wage workers were above NIS 92.3 and the wages of the other half were below that. The median wage of work-ers in Israel and the settlements was about four times that of workers in the Gaza Strip (Table 2-3).
However, additional costs are incurred by Palestinian work-ers working in Israel, as they are forced frequently to pay to permits and job brokers (an amount estimated at 1,500 shek-els per month), as well as transportation fees (about NIS 500 monthly). Moreover, they spend long hours waiting at the crossing points, which extends the working day to 16 hours instead of 8 hours.
It is also important to emphasize that there is a significant difference between the wages of the workers who work inside Israel and those who work in the settlements in the occupied territory, as confirmed in a statement by the Israeli Minister of Finance in mid-August.
In addition to the high nominal wages of workers in Israel and the settlements, and the discrepancy between the average and median wage among workers in the West Bank and Gaza Strip, the following observations on wages are pertinent:
136 136 47 24 10
190
315
245
158
67 -
100
200
300
400
15-24 25-34 35-44 45-54 55+
Thousand
Unemployed Employed
15337 44 17 9
93
479
131207
44 1599
0
100
200
300
400
500
600
أقل من ثانوي ثانوي جامعي أقل من ثانوي ثانوي جامعي
ذكور ألفإناث
عاطلین عن العمل عاملین
GDP Average Growth Rate
Unemployment Rate
15
17
19
21
23
25
27
29
31
-12
-10
-8
-6
-4
-2
0
2
4
6
8
10
Q1,
12
Q2,
12
Q3,
12
Q4,
12
Q1,
13
Q2,
13
Q3,
13
Q4,
13
Q1,
14
Q2,
14
Q3,
14
Q4,
14
Q1,
15
Q2,
15
Q3,
15
Q4,
15
Q1,
16

7
Economic Monitor no. 45/ 2016
Figure 2-7: the Average Weekly Work Hours and the Monthly Work Days in Palestine (Q1 2012-Q1 2016)
• the average wage of workers in the private sector is lower than average wage of workers in the public sector by 20% in the West Bank and by 54% in Gaza Strip.• there is a gendered wage gap: the total daily wage for females working in the private sector in the West Bank is about 75% of the males daily wage, while the gap is less in the public sector.• the daily wage of about 73% of the private sector employees in Gaza Strip, (and 23% in the West Bank) is below the minimum wage (NIS 65). For more information about this topic, see box 2 below, on the application of the minimum wage decree.
Figure 2-8: The Average and Median Daily Wage (in NIS) of Known-wage Workers in Palestine (Q1 2012-Q1 2016)
Average Weekly Work Hours
Average Monthly Work Days
21
21.5
22
22.5
23
39
40
41
42
43
44
1ر ،
20
14
2ر ،
20
14
3ر ،
20
14
4ر ،
20
14
1ر ،
20
15
2ر ،
20
15
3ر ،
20
15
4ر ،
20
15
1ر ،
20
16
DayHour
Median Wage
Average Wage
60
70
80
90
100
110
Q1,
201
4
Q2,
201
4
Q3,
201
4
Q4,
201
4
Q1,
201
5
Q2,
201
5
Q3,
201
5
Q4,
201
5
Q1,
201
6
NIS
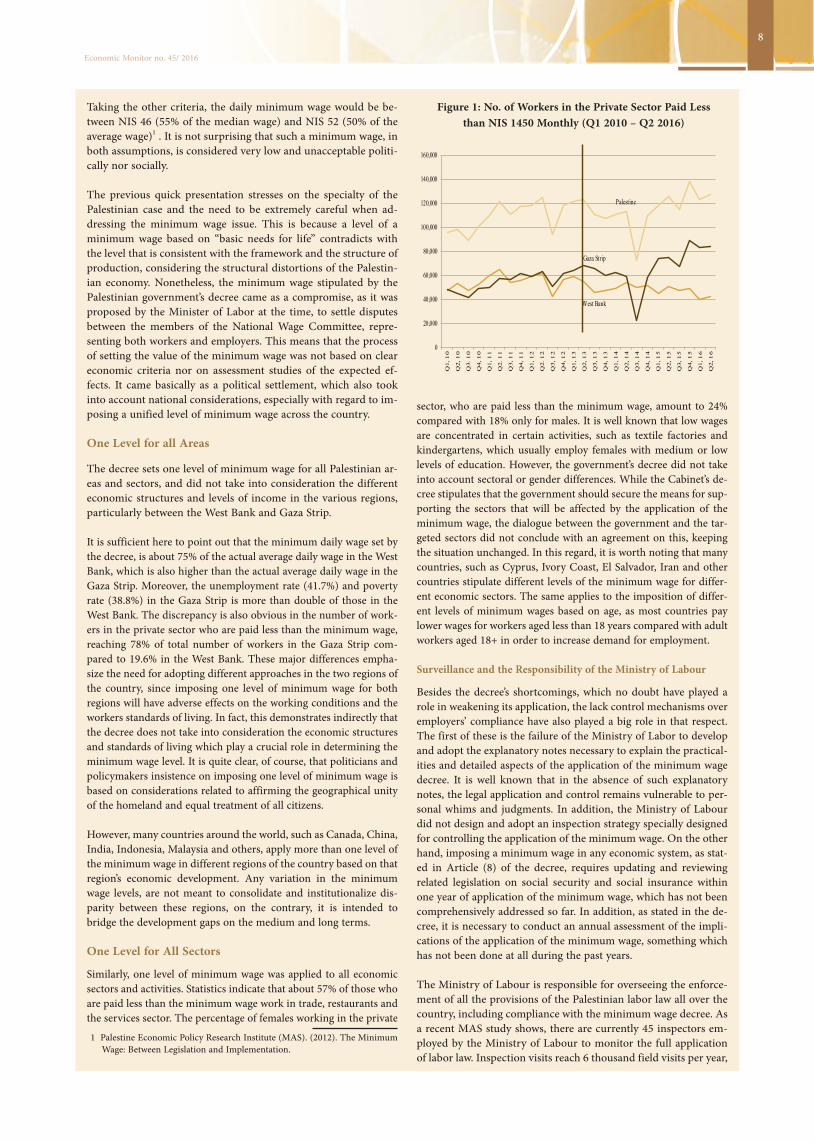
Early in 2013, the Palestinian Government decided to impose a minimum wage level. However, two and a half years later more than 126 thousand private sector workers are still paid less than the level set by law (in addition to about 4% of public sector workers, accord-ing to other sources). Based on data recently released by PCBS, Fig-ure 1 shows that the minimum wage decree did not lead to concrete progress in real life, as the number of workers who are paid less than the minimum wage remained high. As well, the sharp fluctuations in some quarters of the year (the significant decline in the third quarter 2014, for example) confirm that this number changes de-pending on other factors other than the government’s decree.
The Cabinet’s decree on the minimum wage came following lengthy negotiations between the members of the National Wage Commit-tee which comprised representatives of the public sector, trade un-ions, and the private sector. According to the decree, the minimum wage was set at NIS 1,450 per month, NIS 65 per day, and NIS 8.5 per hour in all the Palestinian territories and for all sectors.
We contend in this review box, that the weak application of the minimum wage decree in Palestine is due to two factors; the first is related to the decree itself, and the second is related to the fol-low-up and application mechanisms.
Criteria for Determining the Minimum Wage
There are two main schools for setting the minimum wage in different countries. The first uses an approach based on defining the value of ‘income needed to cover basic needs for life’ or ‘poverty line’, and the second uses economic variables such as labor productivity and average (or median) wage prevailing in the country or the region. In the Pales-tinian case there is no clear reference of either of the two approaches.
Taking the first criterion, the poverty line in Palestine for a family of 5 members is estimated at NIS 2,293 per month, and the deep pov-erty line at NIS 1,832 per month. Assuming that the number of workers in the family is 1.6, and that they are paid the minimum wage, according to the decree, the monthly income of a family is NIS 2,320. This is higher than deep poverty line and poverty line. By this calculation, the decree guarantees that the family’s income will not be below the poverty line. But this, of course, is dependent on having 1.6 working individuals in the standard family (two adults and three children). If the average number of working individuals in the family is under 1.5, then the minimum monthly wage does not guarantee maintaining the basic requirements of the family.
Some economists argue that providing income necessary for life is a noble and obligatory mission, nevertheless it is a social responsibility that should not be connected to production costs and systems. The lev-el of wages in the production systems is determined by labor productiv-ity and by supply and demand factors. If high wages are imposed, the consequently curtailed competitiveness could negatively influence workers themselves because of the surging rates of unemployment.
According to this school, an alternative approach to determining the minimum wage is based on the use of a certain percentage of the average per capita GDP, the average daily wage, or the actual median daily wage in the economy. Most countries set the mini-mum wage at 40-60% of the per capita GDP, or 40-50% of the av-erage wage, or 55% of the median wage prevailing in the country. Taking 60% of the per capita income in Palestine as a criterion, the minimum monthly wage should not be more than NIS 532 only.
Box 2: One out of Five Workers is Paid Lessthan the Minimum Wage
Economic Monitor no. 45/ 2016
8
Figure 1: No. of Workers in the Private Sector Paid Less than NIS 1450 Monthly (Q1 2010 – Q2 2016)
Taking the other criteria, the daily minimum wage would be be-tween NIS 46 (55% of the median wage) and NIS 52 (50% of the average wage)1 . It is not surprising that such a minimum wage, in both assumptions, is considered very low and unacceptable politi-cally nor socially.
The previous quick presentation stresses on the specialty of the Palestinian case and the need to be extremely careful when ad-dressing the minimum wage issue. This is because a level of a minimum wage based on “basic needs for life” contradicts with the level that is consistent with the framework and the structure of production, considering the structural distortions of the Palestin-ian economy. Nonetheless, the minimum wage stipulated by the Palestinian government’s decree came as a compromise, as it was proposed by the Minister of Labor at the time, to settle disputes between the members of the National Wage Committee, repre-senting both workers and employers. This means that the process of setting the value of the minimum wage was not based on clear economic criteria nor on assessment studies of the expected ef-fects. It came basically as a political settlement, which also took into account national considerations, especially with regard to im-posing a unified level of minimum wage across the country.
One Level for all Areas
The decree sets one level of minimum wage for all Palestinian ar-eas and sectors, and did not take into consideration the different economic structures and levels of income in the various regions, particularly between the West Bank and Gaza Strip.
It is sufficient here to point out that the minimum daily wage set by the decree, is about 75% of the actual average daily wage in the West Bank, which is also higher than the actual average daily wage in the Gaza Strip. Moreover, the unemployment rate (41.7%) and poverty rate (38.8%) in the Gaza Strip is more than double of those in the West Bank. The discrepancy is also obvious in the number of work-ers in the private sector who are paid less than the minimum wage, reaching 78% of total number of workers in the Gaza Strip com-pared to 19.6% in the West Bank. These major differences empha-size the need for adopting different approaches in the two regions of the country, since imposing one level of minimum wage for both regions will have adverse effects on the working conditions and the workers standards of living. In fact, this demonstrates indirectly that the decree does not take into consideration the economic structures and standards of living which play a crucial role in determining the minimum wage level. It is quite clear, of course, that politicians and policymakers insistence on imposing one level of minimum wage is based on considerations related to affirming the geographical unity of the homeland and equal treatment of all citizens.
However, many countries around the world, such as Canada, China, India, Indonesia, Malaysia and others, apply more than one level of the minimum wage in different regions of the country based on that region’s economic development. Any variation in the minimum wage levels, are not meant to consolidate and institutionalize dis-parity between these regions, on the contrary, it is intended to bridge the development gaps on the medium and long terms.
One Level for All Sectors
Similarly, one level of minimum wage was applied to all economic sectors and activities. Statistics indicate that about 57% of those who are paid less than the minimum wage work in trade, restaurants and the services sector. The percentage of females working in the private
1 Palestine Economic Policy Research Institute (MAS). (2012). The Minimum Wage: Between Legislation and Implementation.
sector, who are paid less than the minimum wage, amount to 24% compared with 18% only for males. It is well known that low wages are concentrated in certain activities, such as textile factories and kindergartens, which usually employ females with medium or low levels of education. However, the government’s decree did not take into account sectoral or gender differences. While the Cabinet’s de-cree stipulates that the government should secure the means for sup-porting the sectors that will be affected by the application of the minimum wage, the dialogue between the government and the tar-geted sectors did not conclude with an agreement on this, keeping the situation unchanged. In this regard, it is worth noting that many countries, such as Cyprus, Ivory Coast, El Salvador, Iran and other countries stipulate different levels of the minimum wage for differ-ent economic sectors. The same applies to the imposition of differ-ent levels of minimum wages based on age, as most countries pay lower wages for workers aged less than 18 years compared with adult workers aged 18+ in order to increase demand for employment.
Surveillance and the Responsibility of the Ministry of Labour
Besides the decree’s shortcomings, which no doubt have played a role in weakening its application, the lack control mechanisms over employers’ compliance have also played a big role in that respect. The first of these is the failure of the Ministry of Labor to develop and adopt the explanatory notes necessary to explain the practical-ities and detailed aspects of the application of the minimum wage decree. It is well known that in the absence of such explanatory notes, the legal application and control remains vulnerable to per-sonal whims and judgments. In addition, the Ministry of Labour did not design and adopt an inspection strategy specially designed for controlling the application of the minimum wage. On the other hand, imposing a minimum wage in any economic system, as stat-ed in Article (8) of the decree, requires updating and reviewing related legislation on social security and social insurance within one year of application of the minimum wage, which has not been comprehensively addressed so far. In addition, as stated in the de-cree, it is necessary to conduct an annual assessment of the impli-cations of the application of the minimum wage, something which has not been done at all during the past years.
The Ministry of Labour is responsible for overseeing the enforce-ment of all the provisions of the Palestinian labor law all over the country, including compliance with the minimum wage decree. As a recent MAS study shows, there are currently 45 inspectors em-ployed by the Ministry of Labour to monitor the full application of labor law. Inspection visits reach 6 thousand field visits per year,
West Bank
Gaza Strip
Palestine
0
20,000
40,000
60,000
80,000
100,000
120,000
140,000
160,000
Q1,
10
Q2,
10
Q3.
10
Q4,
10
Q1,
11
Q2.
11
Q3,
11
Q4,
11
Q1,
12
Q2.
12
Q3,
12
Q4,
12
Q1,
13
Q2,
13
Q3,
13
Q4,
13
Q1,
14
Q2,
14
Q3,
14
Q4,
14
Q1,
15
Q2,
15
Q3,
15
Q4,
15
Q1,
16
Q2,
16

9
Economic Monitor no. 45/ 2016
while the number of institutions that are supervised by the Minis-try of Labour totals to 100 thousand facility. The study stresses that the problem is not in the scarcity of Ministry’s staff (during 2014 the number of employees amounted to 773), but in the lack of staff qualified for conducting control and inspection visits and in providing the necessary resources for these inspections. 2
Another MAS study noted that the method used by the MOL for monitoring the implementation of the minimum wage decree en-tailed calling on the institutions and meeting the employees and employers.3 This method proved to be ineffective, since there is shortage in human resources needed to carry out inspection visits and in the other means needed for these operations. According to 2013 data there is only one inspector for every 20,500 workers in the West Bank. This is in addition to the inefficiency of inspectors which is ascribed to a number of reasons; severe shortage of the MOL inspection vehicles (each Directorate owns one vehicle only for all the directorate field jobs, which means canceling or postpon-ing tasks when using the vehicle for other jobs or in case the car is not working or unavailable, or short of fuel). The study points to the incompatibility of the number of inspection visits with the number of operating institutions in each governorate, as it was found that the number of inspection visits to some governorates exceeded those to other governorates that have larger number of institutions. Also the distribution of inspection visits is inconsistent with the percent of workers who are paid below the minimum wage across the governorates, while the number of visits to the governo-rates which have high percentage of workers who are paid below the minimum wage was much less than governorates with lower per-centages. According to the Ministry of Labor, the distribution of the inspection visits depends on the accessibility of the institutions. In light of all these factors, the work of the Ministry of Labor related to controlling the application of the decree depends basically on cases filed by workers themselves, so it is perhaps not surprising that the Ministry rarely receive any complaints in this regard.
Is the Palestinian Economy Ready to Apply a Minimum Wage
In concluding, an important question arises: Are the above-men-tioned factors sufficient to explain the reasons for noncompliance with the minimum wage decree in the Palestinian territory? Are these factors sufficiently convincing, even after considering the dif-ficult political situation, especially the political division between the West Bank and Gaza Strip and the ambiguity in Gaza Strip position on the decree? Or is it that the fundamental gaps in the core of the decree and the failure to monitor its enforcement are just minor factors, while the main cause of this failure is attributed to the fact that the Palestinian economy is unprepared for this decree yet, whether in terms of administrative structure or productivity, and is not ready to handle the costs and consequences of the enforcement of a minimum wage? This is a difficult question, which should have been addressed and studied thoroughly before issuing the decree, and still worth studying even years after the issuance of the decree. 4
This Box was prepared by Habib Al Hin, Assistant Researcher at MAS.
2 Kutab, Alesander et al. (2016): Expenditure Performance and Program-Based Budgeting: the Case of Ministry of Labour (MoL), 2016. Palestine Economic Policy Research Institute (MAS).
3 Fallah, Belal (2014). Evaluation of Employers’ Compliance with the Mini-mum Wage Regulations in the West Bank, Palestine Economic Policy Re-search Institute (MAS)
4 In Monitor 32, we cited a simple exercise which shows that for the applica-tion of the minimum wage decree, wages of the private sector need to rise by US$ 230 million annually, and that 57% of this amount should be provided by the services sector
3- Public Finance
The three figures in this section depict the PNA’s financial position during Q1 2016
During Q1 2016, public revenues, including clearance reve-nues, saw a significant rise of 60% compared to the previous quarter, against a decline in total public expenditures by 2% compared with the previous quarter. This decline is due to a drop in non-wage expenses by about 18%, despite the 17% rise in the bill of salaries.
The rise in revenues and the decline in expenditures during Q1 2016, have led to a total surplus of NIS 583 million, com-pared with a deficit of NIS 281 million in the corresponding quarter 2015, and a deficit of NIS 719 million in the previous quarter. This shift from negative to positive is attributed to the high increase in clearance revenues (40%) during Q1 2016, compared with the previous quarter, triple the revenues of the corresponding quarter. This was owing to a freeze on transfer of Palestinian clearance revenues during the last quarters of the year (see Table 3-1 which shows details of the clearance transfers).
The surplus of the budget includes grants and foreign aid, as the budget before grants and foreign aid recodes a deficit of NIS 24.4 million.
Cash Surplus/Commitment Deficit
The total surplus and the total deficit (before grants and for-eign aid), during Q1 2016, were calculated based on cash ba-sis, i.e. on the basis of actual revenues and expenses earned and paid during the quarter. Meanwhile during that period the government delayed some due payments (known as “ar-rears”). The total government arrears amounted to NIS 780 million in Q1 2016. Adding the arrears to the total budget deficit on cash basis (before grants and aid), will increase the deficit from NIS 24 million (on cash basis) to NIS 804 mil-lion (on commitment basis).
Arrears
Table 3-2 gives an idea about the structure and value of ar-rears. During Q1 2016 the government exerted strenuous ef-forts and managed to decrease arrears accumulating by half compared with the corresponding quarter 2015, achieving also a significant decrease compared with the previous quarter. This drop was in the wages and salaries arrears, while the pri-vate sector and municipalities arrears saw a significant rise. It is worth mentioning that several studies have warned and stressed the economic consequences of the government’s accu-mulating arrears due to the private companies and suppliers.
Foreign Aid
Table 3-3 shows the total Grants and Foreign Aid to the gov-ernment, and shows that the value of aid decreased by 30% during Q1 2016 compared with the corresponding quarter 2015.

Economic Monitor no. 45/ 2016
10
Figure 3-1 : Public Revenues, (on cash basis, Q1 2016 )(NIS million)
Figure 3-2: Public Expenditure (on Cash Basis, Q1 2016 )(NIS million)
Figure 3-3: Budget Surplus/Deficit (before Grants and Foreign Aid) on Cash Basis and Commitment
Basis, Q1 2016 (NIS million)
Public Debt
During Q1 2016 the public debt reached around NIS 9.6 mil-lion, recording a drop by 3.5% compared to the previous quarter. It should be noted that the public debt, estimated in US$, reached US$ 2,527 million, a drop of half a percentage point compared with Q4 2015, as a result of the fall in the dollar’s exchange rate against the shekel.
Table 3-1: Clearance Revenues on Commitment Basis (NIS million)
Item Q1 2015 Q4 2015 Q1 2016
Customs revenues 656.3 758.5 686.1
VAT 578.3 573.6 527
Purchase tax (7.5) 4.1- -8
Fuel excise 658.2 720.3 702.1
Income tax 6.6 8.3 10.4
1,891.9 2,056.6 1,917.6
Table 3-2: Accumulated Arrears (NIS million)
Item Q1 2015 Q4 2015 Q1 2016
Tax rebates 158.6 14.4 -28
Wages and salaries 852.2 332 108.8
Private sector 269.1 473.8 466.8
Developmental expenditure 48.3 60.9 68.5
Local government payments 107.7 -11.1 163.6
Total 1,435.9 870.0 779.7
Table 3-3: Grants and Foreign Aid to the PA (NIS million)
Item Q1 2015 Q4 2015 Q1 2016
Budget support 799.7 586.4 542.0
-Arab grants 617.1 237.2 345.7
- International grants 182.6 349.2 196.3
Developmental funding 73.5 92.9 65.0
Total 873.2 679.3 607.0
Table 3-4: Public Debt (NIS million)
Item Q1 2015 Q4 2015 Q1 2016
Domestic debt 5,207.9 5,726.8 5,490.9
Bank loans 2,778.9 3,119.8 2,998.3
External debt 4,236.1 4,181.3 4,072.5
Total 9,443.9 9,908.1 9,563.4
Budget
Acrual Base Deficit
804
Cash Base
Deficit 24
Total Public Expenditures
3,445
CurrentExpenditures
3,302
Salaries and Wages 1,811
Non-wagesExpenditiure 1,203
Net lending289
Development Expenditure 142
Total Revenues&Grants 4,028
Total Revenues3,421
Local Revenues1,269
Clearance Revenues 2,151
Grant &Aid607
Budget Aid542
Developing Aid65

11
Economic Monitor no. 45/ 2016
In its semi-annual Economic Monitoring report on the Palestinian economy, the World Bank addresses fiscal leakage under the reve-nue sharing arrangements between the Palestinian National Au-thority and Israel. The report provides estimates of the amount of leakage of financial resources to which the PA is entitled under the Paris Protocol on Economic Relations PPER, but are collected and withheld by Israel.
The report begins by depicting the fiscal situation of the Palestin-ian Authority. It states that the Palestinian Authority managed to reduce the budget deficit from 24.6% of GDP in 2008 to 11.4% in 2015. However, this deficit is still large with an absolute value of US$ 1.45 billion. With the decline in international aid and grants, which used to cover the fiscal deficit, the Palestinian government is now forced to seek financing from banks and delay payments. The arrears accumulating on the government to the private sector suppliers and to the employees’ pension fund was equivalent to 20% of GDP in 2015.
We argue in this box, that stopping financial leakage and revising clearance conditions could fill an important part of the financing gap in the Palestinian budget, specially that clearance revenues represent 73% of the PNA’s total revenues.
The report discusses the following six channels\sources of fiscal leakage :1
1) Indirect import and undervaluation of direct imports: Most of the goods imported from third countries are cleared by Israeli customs. Also Palestinian importers resort to indirect im-porting via Israeli importers rather than direct importing of goods to avoid difficulties and delays they might face in clearing their merchandise at the Israeli customs. This results in a fiscal loss for the PA on the customs and VAT revenues of these goods.
The report estimates the difference between the value of regis-tered Palestinian imports from Israel and the predicted value (produced by a gravity model) at US$ 726 million in 2014. This is an estimate of Palestinian imports coming via Israel, which are actually imported from third countries, amounting to 35% of total imports from Israel (excluding water, electricity, and fuel). Using an average import tariff and purchase tax, the report finds that fiscal leakage via this channel reached US$ 30.6 million in 2014.
On the other hand, Palestinian and Israeli tradesmen usually de-clare lower prices of imported goods than their real value (lower at 32% for imports from third countries and 23% for Israeli goods). This results in an annual fiscal leakage for the PNA reaching US$ 53 million (= US$ 222 million x average tariff and VAT rate).
2) Leakage on Bilateral Trade with IsraelThe World Bank reports that a large proportion of trade flows be-tween Palestine and Israel take place without registered clearance invoices, resulting in losses for the PA on VAT of these purchases,
1 For more details on financial leakage sources, refer to monitor 31 (Dec 2013)
Box 3: The PA’s Fiscal Losses on Clearance Revenues Estimated at US$ 300 Million Annually
and on income tax that Palestinian tradesmen have to pay. This applies to Gaza to a big extent. Given the lack of a physical border, goods are also smuggled to the Palestinian territory (specially via area “C”). Finally there are losses caused by underestimating the value of products registered in clearance issued invoices.
The report proclaim that Israeli numbers on the value of goods supplied to the Palestinian territory are relatively accurate (be-cause Israeli tradesmen are obliged to submit clearing bills to the authorities when selling to West Bank and Gaza Strip trades-men). But Israel does not share this information with the PA. The World Bank report found out that the difference in the value of VAT on goods bought by tradesmen in the West Bank and Gaza Strip as recorded in the Israeli papers and the value of clearing tax invoices the PA hold, amounted to US$ 103.7 million in 2014 (equivalent to 17% of the value of taxes recuperated by the PA) .
3) Deductions from Palestinian workers’ wages. Israeli employers do not pay the national insurance tax on Palestinian workers they employ. So as to avoid preferring Palestinian workers over Israeli workers, the Israeli government imposed on them what is known as “equalization levy”2 . Paris Protocol constitute that Israel has to transfer the accumulating equalization levy to the PA on a month-ly basis (after deducting health insurance costs for workers in the workplace), provided that the PA uses these funds to finance a social security system for Palestinian workers and their families. Israeli official figures show that the amount of funds that have been collected under this item amounted to US$ 169.2 million during the period 2006-2013. The World Bank report estimated that this item amounted in 2014 to US$ 14 million, resources which have not been transferred to the PA. Israeli excuses for this are that a social security system has not being established. Israel also deducts from workers’ wages the so called “health stamp”, al-though Palestinian workers do not benefit from the health insur-ance services in Israel. The report estimated the deducted amount at about $ 55.4 million during 2006-2013, and by US$ 16.2 million in 2014. Finally, according to Paris Protocol Israel should transfer 75% of income tax deductions to the PA (100% of income taxes deducted from the wages of workers working in settlements).
In this regard, the report mentions that Palestinian workers are not always paid the Israeli minimum wage, as Israeli employers do not report the actual numbers and real wages of workers. The re-port stresses that the value of income taxes that Israel is actually transferring to the PA is extremely low, and did not exceed US$ 8.4 million annually during the last years.
4) Taxes collected in “area C”. There is are a number of economic ac-tivities in “area C” (industrial, tourism related-projects, and electricity and telecommunication ventures) for which the PA has received the income tax levied on these activities (which are located outside the borders of settlements and military areas) as specified in PPER.
2 For a more detailed report on workers deductions, refer to monitor volume 33 ( Aug 2013)
Economic Monitor no. 45/ 2016
12
5) Allenby (al Karameh) Bridge exit fees. As PPER stipulates, the PA is entitled to 46% of fees collected on Allenby Bridge, which is imposed on the first 750 thousand passengers, and 62% if the number of passengers exceeds this number (750 Thousand). In 1995 an exit fee of US$ 26 only was collected. Despite that the fee rose up to US$ 40 in 2008 (US$ 46 for foreigners), Israel still trans-fers US$ 10.5 per passenger only to the PA. The report estimated the amount that Israel should have transferred to the PA in 2014 by about US$ 20.1 million, compared with what it has actually transferred which does not exceed US$ 7.9 million, meaning that the financial leakage that year on this item amounted to US$ 12.2 million.
6) High collection and administrative costs. PPER sets out that Israel will deduct 3% of tax revenues collected and transferred to the PA in return for collection and administrative costs incurred by Israel. The value of this item reached US$ 63 million in 2014. The report states that a rate of 3% might have been acceptable in the nineties, considering the low size of trade and extensive ad-ministrative efforts then. Nowadays the actual administrative costs must not exceed 0.6%.3 Using this reasonable rate for administra-tive costs, the report concludes that Israel’s share in return for handling collection and transferring taxes should not exceed US$ 13 million, which means that the difference between the deducted amount and the reasonable amount is US$ 50 million. On the other hand, the report mentions that Israel deducts 3% of excises on fuel the PA purchase from Israeli companies. The PA insists that collecting these taxes are not associated with any administra-tive costs on Israel and the 3% deduction should not apply to these taxes, which is prejudicial and should be stopped (totaled Israeli deductions on fuel excises reached US$ 30 million in 2014).
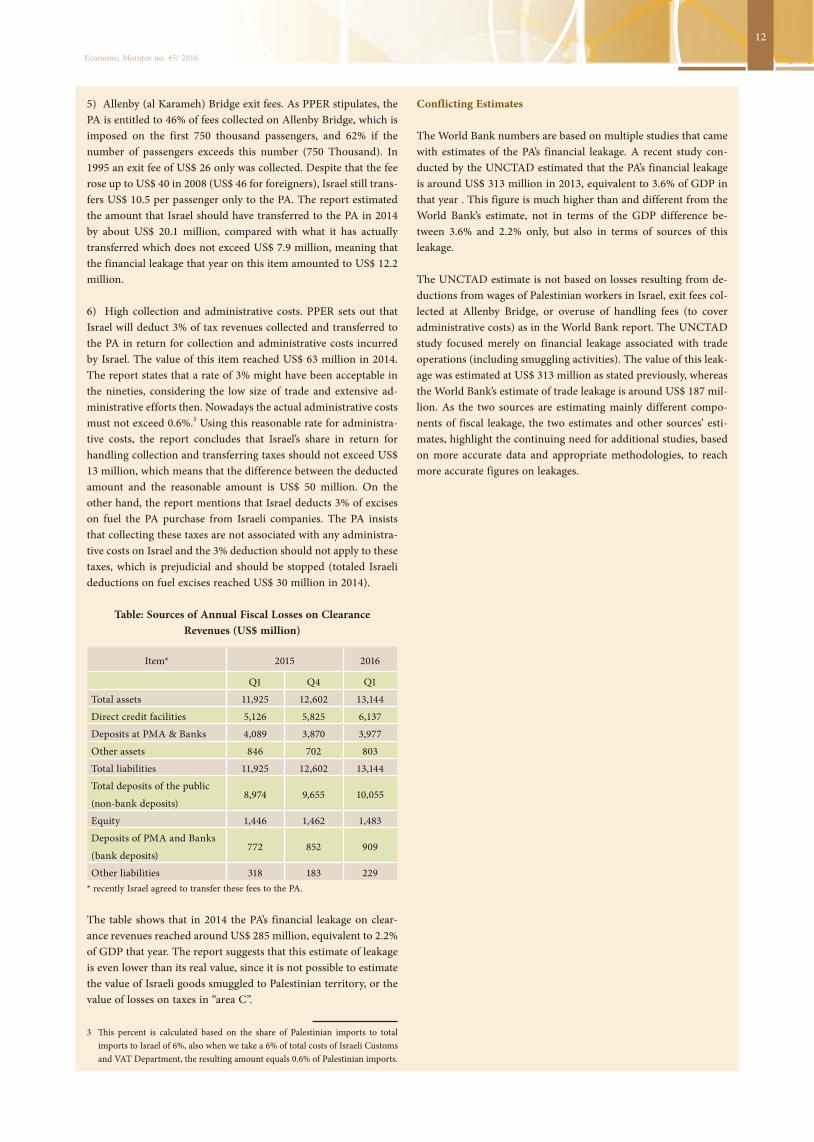
Table: Sources of Annual Fiscal Losses on Clearance Revenues (US$ million)
Item* 2015 2016
Q1 Q4 Q1
Total assets 11,925 12,602 13,144
Direct credit facilities 5,126 5,825 6,137
Deposits at PMA & Banks 4,089 3,870 3,977
Other assets 846 702 803
Total liabilities 11,925 12,602 13,144
Total deposits of the public
(non-bank deposits)8,974 9,655 10,055
Equity 1,446 1,462 1,483
Deposits of PMA and Banks
(bank deposits)772 852 909
Other liabilities 318 183 229* recently Israel agreed to transfer these fees to the PA.
The table shows that in 2014 the PA’s financial leakage on clear-ance revenues reached around US$ 285 million, equivalent to 2.2% of GDP that year. The report suggests that this estimate of leakage is even lower than its real value, since it is not possible to estimate the value of Israeli goods smuggled to Palestinian territory, or the value of losses on taxes in “area C”.
3 This percent is calculated based on the share of Palestinian imports to total imports to Israel of 6%, also when we take a 6% of total costs of Israeli Customs and VAT Department, the resulting amount equals 0.6% of Palestinian imports.
Conflicting Estimates
The World Bank numbers are based on multiple studies that came with estimates of the PA’s financial leakage. A recent study con-ducted by the UNCTAD estimated that the PA’s financial leakage is around US$ 313 million in 2013, equivalent to 3.6% of GDP in that year . This figure is much higher than and different from the World Bank’s estimate, not in terms of the GDP difference be-tween 3.6% and 2.2% only, but also in terms of sources of this leakage.
The UNCTAD estimate is not based on losses resulting from de-ductions from wages of Palestinian workers in Israel, exit fees col-lected at Allenby Bridge, or overuse of handling fees (to cover administrative costs) as in the World Bank report. The UNCTAD study focused merely on financial leakage associated with trade operations (including smuggling activities). The value of this leak-age was estimated at US$ 313 million as stated previously, whereas the World Bank’s estimate of trade leakage is around US$ 187 mil-lion. As the two sources are estimating mainly different compo-nents of fiscal leakage, the two estimates and other sources’ esti-mates, highlight the continuing need for additional studies, based on more accurate data and appropriate methodologies, to reach more accurate figures on leakages.

13
Economic Monitor no. 45/ 2016
4- The Banking Sector
By the end of Q1 2016 the net assets (liabilities) of licensed banks in Palestine were US$ 13.1 million, realizing a rise by 4.3% compared with the fourth quarter 2015, and a rise by 10.2% compared with the corresponding quarter of the pre-vious year.
Table 4-1: Consolidated Balance Sheet for Licensed Banks Operating in Palestine (US$ millions)
Item* 2015 2016
Q1 Q4 Q1
Total assets 11,925 12,602 13,144
Direct credit facilities 5,126 5,825 6,137
Deposits at PMA & Banks 4,089 3,870 3,977
Other assets 846 702 803
Total liabilities 11,925 12,602 13,144
Total deposits of the public
(non-bank deposits)8,974 9,655 10,055
Equity 1,446 1,462 1,483
Deposits of PMA and Banks
(bank deposits)772 852 909
Other liabilities 318 183 229
Credit Facilities
Similar to previous quarters, the direct credit facilities con-tinued rising during Q1 2016 reaching around US$ 313 mil-lion adding to the total credit facilities which amounted to US$ 6.1 billion. Credit facilities granted to the public sector accounted for 23% of the total and the remaining 77% were granted to the public sector. By geographical distribution, al-though Gaza’s Strip share rose by 13% over the consecutive quarters, Gaza’s Strip share of these facilities was still modest, and did not exceed 13%.
Regarding liabilities, the public deposits (non-bank) reached US$ 400 million during Q4 2015 and Q1 2016. The share of the public sector deposits was 7% of the total deposits ( leav-ing 93% for the private sector). Gaza Strip’s share was 11% of the total deposits. Figures 4-1 and 4-2 show the distribution of deposits by type and currency, while figure 4-3 depicts the percentile distribution of the total credit facilities of the pri-vate sector, where consumption goods’ loans accounted for 28% of total credit facilities.
Profits of Banks Operating in Palestine
The net income of banks (Banks’ profits) reached US$ 42.3 million during Q1 2016, an increase of 45% compared with the previous quarter. This is owing to the rise in revenues and drop in expenditures at same level (5.5%). Similar to previous quarters, interest contributed with about 70% to the Bank’s net income.
Figure 4-1:% Distribution of Public Deposits by Type (Q1 2016)
Figure 4-2: % Distribution of Public Deposits by Currency (Q1 2016)
Figure 4-3: % Distribution of Total Credit Facilities Granted to the Private Sector ( Q1 2016) (US$ million)
Current Deposits39.1%
Time Deposits 28.4%
Saving Deposits32.5%
USD37.7%
JOD25.3%
NIS33.2%
Other Currencies
3.8%
Consumption loans28%
Real estate and
construction19%
Auto loans9%
External & Internal Trade18%
Other26%

Economic Monitor no. 45/ 2016
14
Table 4-2: Revenues of Licensed Banks in Palestine (US$ millions)
2015 2016
Q1 Q4 Aggregate Q1
Net revenues 123 130.7 512.1 138.4
Interest s 88.8 97 373.8 98.4
Commissions 22.6 22.1 90.5 24.2
Other operating revenues 11.6 11.6 47.8 15.8
Expenses 86.9 101.5 378.2 96.1
Operating expenses and
allocations76.9 91.8 334.8 86.3
Tax 10 9.7 43.4 9,8
Net income 36.1 29.2 133.9 42.3
Interest Rates
The figures show that Net Interest Rate Spread (the differ-ence between the average yield banks receive from loans and other interest-accruing activities and the average rate they pay on deposits, known as “spread”) was the highest on the NIS currency (8.45 percentage points), then on JOD (6.28 percentage points), and then US$ (6.15 percentage points). The interest rate on the different currencies is affected by the monetary policy of that currency’s country (this explains the fall in the NIS interest rates compared with the previous quarter as a result of the monetary expansion policy of Bank of Israel). It is also affected by risks associated with different currencies which are expected by banks (like the problem of NIS cash surplus held by Palestinian banks). A final factor is competitiveness, or lack of competitiveness between banks, which is also considered influential in determining the level of interest rates and the deference between interest rates on deposits and those on credits. A study conducted by MAS, concluded that “‘spread’ is higher in Palestine compared with neighboring countries” (Monitor, issue 37).
Specialized Credit Institutions (SCIs)
There are six specialized credit institutions (SCIs) licensed by the Palestine Monetary Authority (PMA), operating through 75 branches and offices. Table 4-3 shows that total loan portfolio granted through SCIs reached US$ 150 million, 73% in the West Bank, and the rest in the Gaza Strip. The number of bor-rowers was 55.6 thousand. About 30% of these loans were in-vested in the housing sector, and about 25% of the total was invested in the trade sector. During Q1 2016 the market value of shares traded on the Pales-tine Exchange (PEX) constituted 3.6% of GDP only. About 84% of the total value of traded shares on PEX was held by five large companies, namely: Palestinian Telecommunications Group (34%); Bank of Palestine (22%), Palestine Development and In-vestment Company (PADICO) (13%); the Commercial Bank (10%); and the Arab Palestinian Investment Company (APIC) (5%). The market value of shares listed on PEX declined by 3.8% compared to the previous quarter reaching US$ 3.21 bil-lion, affecting Al Quds Index which has closed at 506.28 points– 26.45 points decrease compared to previous quarter.
Figure 4-4: Interest Rates on Deposits and Loans in Palestine by Currency (%) ( Q1 2016)
Table 4-3: SCIs data (Q1 2016)
2016 Q1
Clientele 55,598
West Bank 39,433
Gaza Strip 16,165
Total Loan portfolio (US$ millions) 149.7
West Bank 109.2
Gaza Strip 40.5
Table 4-4: % of Market Value of Shares Traded on PEX by Sector (by the end of Q1 2016)
No. of Companies
Listed on PEX
49 Market Value of Shares Listed
on PEX (US$ Billion)
3.21
Industry 13 Services 41%
Services 12 Banks and Financial services 30%
Investment 9 Investment 16%
Banks and Financial
services
8 Industry 9%
Insurance 7 Insurance 4%
Loans Deposits
0
2
4
6
8
10
USD
Loans
Deposits
0
2
4
6
8
10
NIS
LoansDeposits
0
2
4
6
8
10
JOD

15
Economic Monitor no. 45/ 2016
Box 4: Correspondent Bank: A Channel for Remit-tances and Trade with Israel
Although there are four clearing houses responsible for settling the various clearing operations between Palestinian and Israeli banks, there is still no direct connection between these houses, which precludes direct clearing operations (such as swapping a cheque written against an account in a Palestinian bank with a cheque written against an account in an Israeli bank).
Money transfers and cheques exchange operations between Israeli and Palestinian banks are done through what is known as the “cor-respondent bank”, with the transaction going as follows. Suppose that someone (buyer) in the West Bank bought merchandise from a tradesman in Israel, and wrote a cheque for the tradesman against his account in the Palestinian bank. Once the Israeli tradesman deposits the cheque in his account in an Israeli bank, the bank will send the cheque’s details to ‘the correspondent bank’, which in turn sends the details of the cheque to the buyer’s Pales-tinian bank. When the cheque is verified and if there are sufficient funds in the account, the Palestinian bank transfers the amount of the cheque to the correspondent bank after debiting it from the buyers account. Then the correspondent bank transfers the amount to the Israeli bank, who credits the amount to the Israeli tradesman account. The same procedure applies if a Palestinian tradesman receives a cheque from an Israeli buyer drawn against his account in an Israeli bank.
Knowing that nearly 70% of Palestinian imports come from Israel, and that 85% of Palestinian exports go to Israel, gives a quick idea about the vital role “a correspondent bank” play. This is of course in addition to the large direct remittances, such as remittances of the wages of Palestinian workers in Israel and the custom and tax revenues remittances to PA, which are also settled through the ‘correspondent bank’.
The International Monetary Fund (IMF) Report, issued in Sep-tember 2016 on the Palestinian economy, states that the number of cheques issued by Palestinians to Israeli beneficiaries, which was settled through the correspondent bank, amounted to 300 thou-sand cheques in 2015. The value of these cheques was NIS 8 bil-lion. While Israelis’ cheques to Palestinian beneficiaries in the same year, amounted to NIS 800 thousand cheques, with a total value of NIS 7 billion. In addition, the value of direct transfers from Palestine to Israel was NIS 8 billion and NIS 14 billion vice versa. It should be noted that the clearance transfers between Isra-el and the PA are included in the last item.
The IMF report discusses pros and cons of the “correspondent bank” system. It also touches on the risks that might face the Pal-estinian economy in the event of ending correspondent banking relations, which happened in 2009, when the correspondent bank stopped dealing with banks in Gaza Strip, alleging that it is located in a ‘hostile territory’.
5- Investment Indicators
Building Licenses
The number of building licenses issued is a useful indicator of investment activity. Figure 5-1 shows the changes in the num-ber of registered licenses and licensed buildings’ areas quarter over quarter. The number of licenses in Q1 2016 was 3,232 licenses, 243 of which were for non-residential buildings.
On the other hand, licensed buildings’ areas in Q1 2016 amount-ed to 1,322 thousand square meters, 48% higher than the corre-sponding quarter. That the number of registered licenses does not mean that all those who have obtained a license started con-struction activities, and that a relatively large part of construction activities, especially in rural areas, is not registered or licensed.
Vehicles Registration
The number of vehicles registered for the first time is a standard indicator of the economic situation and expectations of the population. Since vehicles are relatively expensive products and they are often purchased via bank loans, they can be an indica-tor of the general economic climate and expectations. During Q1 2016, the number of new and second-hand vehicles (regis-tered for the first time) in the West Bank was 7,240, 240 vehicle higher than the number in the previous quarter, and 1,811 vehi-cle higher than the number in the corresponding quarter 2015.
Table 6-1: New and Second-hand Registered Vehicles, West Bank (Q1 2016)
Vehicles
imported from
international
market (new)
Vehicles
imported from
international
market (used)
Vehicles from
the Israeli
market (used)
Total
Jan 353 1,622 374 2,349
Feb 385 2,072 218 2,675
Mar 534 1,402 280 2,216
Total 1,272 5,096 872 7,240
Figure 5-1: Total Issued Building Licenses and Licensed Areas in Palestine (2015-2016)
Qua
rter 1
, 201
5
Qua
rter 4
, 201
5
Qua
rter 1
, 201
6
0
500
1,000
1,500
2,000
2,500
3,000
3,500
No. of issued Licenses
Qua
rter 1
, 201
5
Qua
rter 4
, 201
5
Qua
rter 1
, 201
6
0
500
1,000
1,500Thousand m2
Licensied Areas
Economic Monitor no. 45/ 2016
16
6- Prices and Inflation
The index (CPI) measures the prices of a selection of basic goods and services that reflect the consumption pattern of av-erage families in an economy (the “consumption basket”). The components of the basket are given different weights according to the percentage of households spending on them. The aver-age prices of the components of the basket are measured in different geographical areas in the country, while the inflation rate is a measure of the average change in the value of the CPI between the beginning and the end of a certain period. So whereas the price index reflects the rise in prices since the base year, the rate of inflation measures the average upward price movement between two selected periods.
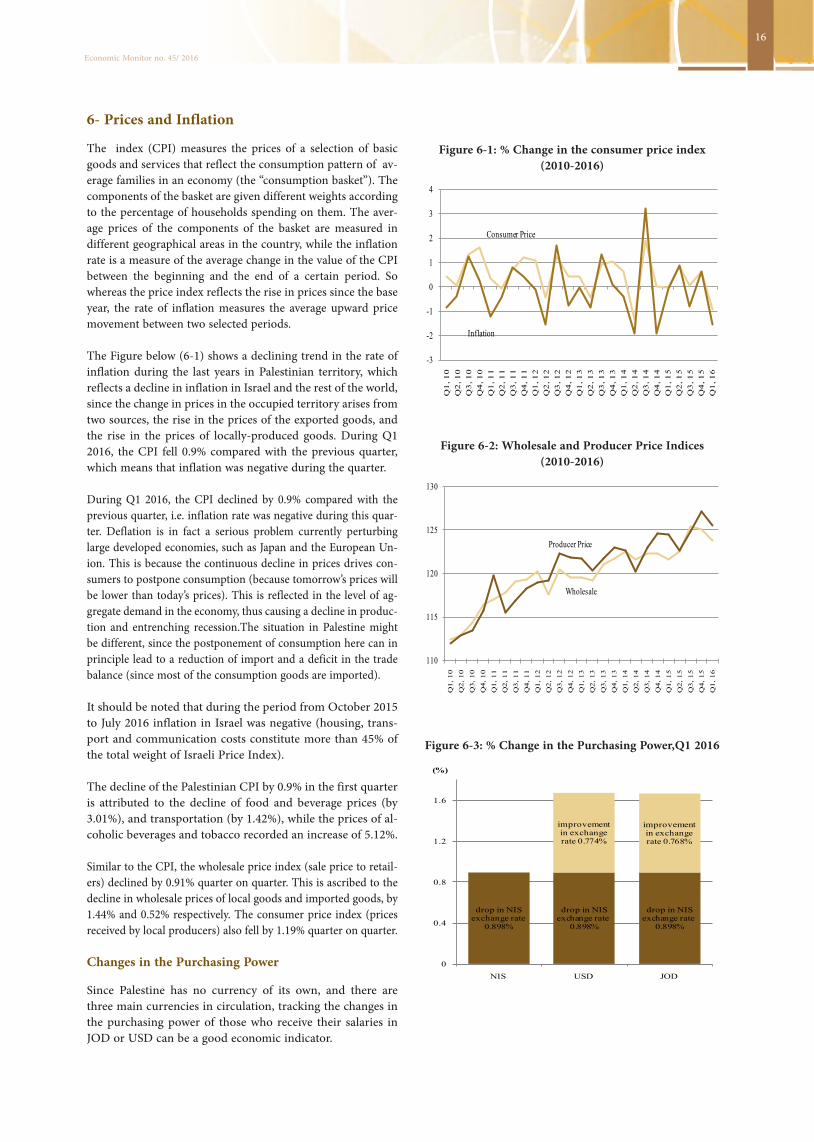
The Figure below (6-1) shows a declining trend in the rate of inflation during the last years in Palestinian territory, which reflects a decline in inflation in Israel and the rest of the world, since the change in prices in the occupied territory arises from two sources, the rise in the prices of the exported goods, and the rise in the prices of locally-produced goods. During Q1 2016, the CPI fell 0.9% compared with the previous quarter, which means that inflation was negative during the quarter.
During Q1 2016, the CPI declined by 0.9% compared with the previous quarter, i.e. inflation rate was negative during this quar-ter. Deflation is in fact a serious problem currently perturbing large developed economies, such as Japan and the European Un-ion. This is because the continuous decline in prices drives con-sumers to postpone consumption (because tomorrow’s prices will be lower than today’s prices). This is reflected in the level of ag-gregate demand in the economy, thus causing a decline in produc-tion and entrenching recession.The situation in Palestine might be different, since the postponement of consumption here can in principle lead to a reduction of import and a deficit in the trade balance (since most of the consumption goods are imported).
It should be noted that during the period from October 2015 to July 2016 inflation in Israel was negative (housing, trans-port and communication costs constitute more than 45% of the total weight of Israeli Price Index).
The decline of the Palestinian CPI by 0.9% in the first quarter is attributed to the decline of food and beverage prices (by 3.01%), and transportation (by 1.42%), while the prices of al-coholic beverages and tobacco recorded an increase of 5.12%.
Similar to the CPI, the wholesale price index (sale price to retail-ers) declined by 0.91% quarter on quarter. This is ascribed to the decline in wholesale prices of local goods and imported goods, by 1.44% and 0.52% respectively. The consumer price index (prices received by local producers) also fell by 1.19% quarter on quarter.
Changes in the Purchasing Power
Since Palestine has no currency of its own, and there are three main currencies in circulation, tracking the changes in the purchasing power of those who receive their salaries in JOD or USD can be a good economic indicator.
Figure 6-2: Wholesale and Producer Price Indices (2010-2016)
Figure 6-3: % Change in the Purchasing Power,Q1 2016
Figure 6-1: % Change in the consumer price index (2010-2016)
Consumer Price
Inflation
-3
-2
-1
0
1
2
3
4
Q1
, 10
Q2
, 10
Q3
, 10
Q4
, 10
Q1
, 11
Q2
, 11
Q3
, 11
Q4
, 11
Q1
, 12
Q2
, 12
Q3
, 12
Q4
, 12
Q1
, 13
Q2
, 13
Q3
, 13
Q4
, 13
Q1
, 14
Q2
, 14
Q3
, 14
Q4
, 14
Q1
, 15
Q2
, 15
Q3
, 15
Q4
, 15
Q1
, 16
Wholesale
Producer Price
110
115
120
125
130
Q1,
10
Q2,
10
Q3,
10
Q4,
10
Q1,
11
Q2,
11
Q3,
11
Q4,
11
Q1,
12
Q2,
12
Q3,
12
Q4,
12
Q1,
13
Q2,
13
Q3,
13
Q4,
13
Q1,
14
Q2,
14
Q3,
14
Q4,
14
Q1,
15
Q2,
15
Q3,
15
Q4,
15
Q1,
16
drop in NIS exchange rate
0.898%
drop in NIS exchange rate
0.898%
drop in NIS exchange rate
0.898%
improvement in exchange rate 0.774%
improvement in exchange rate 0.768%
0
0.4
0.8
1.2
1.6
NIS USD JOD
(%)
17
Economic Monitor no. 45/ 2016
NIS Purchasing Power: the rate of inflation in the Palestinian economy measures the change in purchasing power of all individ-uals who receive their salaries in NIS and spend all their income in that currency. Through Q4 2015 and Q1 2016 the purchasing power, improved by 0.898% over the consecutive quarters.
US$ Purchasing Power: During Q1 2016 the US$ exchange rate against the NIS improved by 0.774% (up to NIS 3.908 per dollar), against a fall in the NIS exchange rate by 0.898%. This means that the purchasing power of individuals who receive their salaries in US$ and spend all their salaries in that curren-cy has improved during Q1 2016 by 1.672% (= 0.898+0.774).
JOD Purchasing Power: Despite the fact that the JOD ex-change rate is pegged with the US$ exchange rate, a slight change in their exchange rate against the NIS can be detected. The JOD exchange rate against the NIS has improved by 0.768% during Q1 2016 compared with the previous quarter. Which means that the purchasing power of individuals who receive their salaries in JOD and spend all their income in NIS has improved during Q1 2016 by 1.666 (=0.898+0.768).
It is realized that an improvement in the NIS purchasing pow-er might not have significant impact on households that are obliged to pay their living costs in JOD or US$ ( like the housing rent or a loan installment).
The standard instrument of monetary policy is when a central bank buys or sells short-term government bonds in order to reach a target for nominal interbank interest rate, by influencing its movement up or down (this interest rate is called LIBOR). The Libor movement in turn affects other types of interest rates. When targeting interest rates in the sale and purchase of bonds (which are called open market operations), the central bank aims to influence the inflation rate in the economy and keep it within the targeted margin. Buying bonds from the market increases the money supply in the economy, and this in turn results in lowering interest rates, which leads to increasing consumer loans, investments, and rise in prices (inflation). But when the central bank sells bonds it practically reduces the money supply in order to reduce the inflation rate. In brief, standard monetary pol-icy is based on influencing interest rates in order to stimulate or discourage expansion (and price inflation) in the economy.
Since the global financial crisis of 2008, central banks have faced a deep dilemma. The standard policy instrument became ineffective in stimulating the economy following the sweeping recession of the global economy (the average global growth dropped from 4% in 2007 to -2% in 2009, and many advanced and big countries lost about third of its national production when inflation dropped to almost zero). The ineffectiveness of conventional monetary policy is attributed to the fact that interest rates dropped simultaneously to lowest levels, which meant that the option of using standard policy tools (stimulating demand by decreasing short-term interest rates) was no longer a viable option for central banks.
The New Policy
The “quantitative easing” policy is a new and unconventional tool that was used by central banks to increase demand and stimulate growth in the economy without relying on short-term interest rates. ‘Quantita-tive easing’ refers to when central banks create new money (electronic) and use it in buying relatively long-term bonds, usually government bonds, or other private financial assets (like pension or provident funds and banks as well). This policy is described as ‘quantitative’ be-cause these purchases are not about reaching a certain level of inflation rate, as in the case of standard policies, yet it is related to ‘quantities’ of bond purchases announced in advance by the central bank.
Over the past years most of the world’s developed countries applied ‘quantitative easing’ programs, which were costly programs. Japan was the first country to use this new policy in March 2001, as it was the first country to maintain an interest rate close to zero, and a negative inflation since late nineties. By 2013 Japan’s central bank adopted a program that entails the purchase of ¥ 70 trillion (thou-sand billion) bonds per year, which was raised to ¥ 80 trillion bonds in 2014. The US Federal Reserve began a quantitative easing program in 2008, and bought US$ 600 billion worth of housing bonds (which was named QE1). In the following year the amount was raised to US$ 750 billion. In 2010-2011 the Fed launched the QE2 program, and bought US$ 75 billion bonds monthly for a whole year, and announced another program for the following year that worth US$ 400 billion. Later the QE3 program was applied by buying US$ 40 billion bonds monthly through September 2012 to October 2014. By that time the value of the Fed’s accumulating
:Box 5: Economic Concepts and DefinitionsQuantitative Easing

Economic Monitor no. 45/ 2016
18
assets had reached US$ 4.5 trillion. Similarly, the Bank of England used the same policy, starting September 2009. By July 2012, the Bank owned bonds amounting to £ 375 billion. On the other hand, the European Central Bank adopted this policy late after being widely criticized for policy inaction. By the end of 2015, the Bank announced a plan to buy € 60 billion bonds a month and by March 2016 it had raised its purchases to € 80 billion each month.
Channels of Impact
The question this poses is through which channels the increase in the money supply (quantitative easing) influences the real econo-my? Economists call the channels through which the money sup-ply impact real variables, such as production and employment, the “Transmission Mechanism”. In fact there are four channels through which quantitative easing influences the economy:
1. When the central bank buys bonds, the bonds’ prices rise, which means that real interest on the bonds (yield) goes down. This in turn lowers the costs of loans for companies that issue new bonds, which stimulate investment and economic growth.2. The rise in bond prices increases the bondholders’ sense of wealth, which can increase spending and demand.3. The increase in money supply at banks could increase credits and lending, which reflect positively on demand and growth.4. Finally, the increase in money supply can stimulate infla-tion to a targeted level, which also reflect positively on demand and growth and protect the economy from negative inflation.
Assessing the new policy
What is the overall assessment of the ‘quantitative easing’ policy: was it successful in rescuing economies that have been in chronic recession? There is no simple answer to this question because it is difficult to isolate the impact of quantitative easing from the influence of other instruments that have been adopted to handle the crisis. Nevertheless, defenders of this policy affirm its success. Empirical studies suggest that it succeeded in reducing interest rates on long-term debts (corporate bonds, for exam-ple). The Chairman of the US Federal Reserve stated that QE1 and QE2 led to increasing economic activities in the United States by 3%, and creating nearly 2 million jobs in the private sector. But opponents of this policy insist that the second channel, mentioned above, has made the rich richer, widened the income gap, and that the third channel was in-effective, as banks who have sold bonds, accumulated larger reserves and did not increase the banks credit activities. Also they argue that the eas-ing policy had an adverse impact on “good behavior”, harmful to inves-tors savings, and have expensive costs compared with its earnings. For instance, when Bank of England bought £ 375 billion bonds, it achieved a growth rate of 1.5%-2%, which means that the value-added achieved from spending £375 billion was £ 23-28 billion only.
Alternatives Policies
A group of QE opponents proposed using alternative instruments, like the People’s Quantitative Easing policy, i.e. creation of money and making payments directly to the people to spend without any cost on them. The other alternative policy is Sovereign Money poli-cy, which suggests creation of money and spending it on infrastruc-ture projects and social services for the benefit of citizens. These alternatives nevertheless are accompanied with high risks, like un-controllable high inflations rates, which can be avoided when apply-ing a standard QE policy, by selling accumulating bonds.
7- Foreign Trade
The value of registered merchandise imports during Q1 2016 totaled to about US$ 1,152.6 million, down by 8.5% com-pared with the previous quarter and higher by 2.6% over the corresponding quarter 2015. Merchandise exports (US$ 208 million) also shrank by 11% compared with the previous quarter, and by 1.4% compared with the corresponding quar-ter 2015. This means that the deficit in the merchandise bal-ance of trade amounted to US$ 944 million. The deficit has dropped slightly as a result of the surplus in the balance of service imports from Israel (US$ 5 million).
Table 7-1: Palestinian Balance of Payments *(US$ million)
2015 2016
Q1 Q4 Q1
Trade balance of goods and services**
(1,164.5) (1,314.7) (1,170.9)
Net goods (1,123.5) (1,268.9) (1,130.3)
Net services (41.0) (45.8) (40.6)
2. Income balance 331.8 347.5 364.4
Workers' remunerations received from abroad 307.8 330.4 372.3
- Investment income received from abroad 24.0 17.1 (7.6)
3. Balance of current transfers 519.3 517.4 528.7
Net transfers to the government (from abroad) 206.0 156.5 143.7
Net transfers to other sectors (from abroad) 313.4 360.9 385.0
4. Balance of current account (1 +2 +3) (313.4) (449.8) (277.8)
5. Net capital and financial account 176.0 570.4 198.8
6. Net errors and omissions 134.7 -122.2 76.4
* Data do not include that part of Jerusalem governorate which was forcefully annexed by Israel following the occupation of the West Bank in 1967.** Registered imports and exports are those numbers registered in the clearance accounts of trade between Palestine and Israel and in the customs data (includ-ing direct trade with overseas markets). Add to that the agricultural goods (which are registered by the Ministry of Agriculture). The registered trade fig-ures are significantly lower than the actual figures of the Palestinian foreign
trade. The actual figures are placed in the Palestinian balance of payments.
Balance of Payments
The deficit in the Palestinian current account reached US$ 278 million in Q1 2016, which is equivalent to 8.4% of GDP at current prices. The current account of the balance of pay-ments is the net aggregate of three sub-balances: the balance of trade (net trade in goods and services), the income balance (net transfer of factor income from abroad, such as labor and capital), and the balance of current transfers (e.g. interna-tional aid to the government and private transfers). The cur-rent account deficit ( which is called balance of payments deficit as well) was caused by a deficit in the trade balance ( US$ 1,170 million) against a surplus in the income balance (which generates mainly from the wages of Palestinian work-

19
Economic Monitor no. 45/ 2016
Figure 7-1: Imports and Exports of Registered Merchandise* (US$ million)
ers employed in Israel) by US$ 364 million and a surplus in the transfers balance (a quarter of which generated from for-eign aid).
The deficit in the trade balance was financed by surplus in the capital and financial account, which covered an amount of US$ 199 million. This item (the capital and financial ac-count) represents a debit on the national economy, as long as it has positive value.
Theoretically, there should be a perfect balance between the current account deficit and the surplus of capital and finan-cial account, i.e. the net value of the two should be zero. However, there is often a deference between them, usually recorded under “errors and omissions”.
International Investments
At the end of Q1 2016, Palestine’s foreign assets totaled about US$ 5,891 million, 5.6% of which represent direct invest-ments, and 19% represent investment portfolio. On the other hand, total external liabilities amounted to US$ 4,985 mil-lion, more than half of which were direct investments. The difference between assets and liabilities means that the over-seas investments by Palestinians were US$ 906 million higher than investments of non-residents. But it should be noted that a significant portion of these assets (67%) are currency and deposits by Palestinian banks abroad. As for direct in-vestments, figures indicate that foreign direct investment in Palestine outweighed actual Palestinian direct investments abroad by US$ 2,309 million.
Figure 7-3: International Investments Balance (Q1 2016)* (Million US$)
Figure 7-2: Exports and Imports of Registered Services from Israel (US$ million)
* Data do not include that part of Jerusalem governorate which was forcefully annexed by Israel following the occupation of the West Bank in 1967.
Imports 1,124
Imports 1,153
Exports 211
Exports 208
0
20
0
40
0
60
0
80
0
1,0
00
1,2
00
Q1 2015
Q1 2016
Imports 33
Imports 32
Exports 37
Exports 37
0 10 20 30 40
Q1 2015
Q1 2016
Direct Investments 328
direct investments 2,637
portfolio investments 1,118
portfolio investments 711
Other investments 3,981
other investments 1,637
Reserve assets 464
0
1,000
2,000
3,000
4,000
5,000
6,000
Total Assets Total Liabilities

Economic Monitor no. 45/ 2016
20
Indicator 2010 2011 2012 2013 20142015 2015 2016 c
Q1 Q2 Q3 Q4 Q1
Population (thousand)
oPt 4,048.4 4,168.9 4,293.3 4,420.5 4,550.4 4,632.9 4,666.0 4,699 4,732.7 4,682.5 4,766.2
West Bank 2,513.3 2,580.2 4,649.0 2,719.1 2,790.3 2,835.4 2,853.5 2,871.6 2,889.8 2,862.5 2,908.0
Gaza Strip 1,535.1 1,588.7 1,644.3 1,701.4 1,760.1 1,797.5 1,812.5 1,827.6 1,842.9 1,820.0 1,858.2
Labor Market
No. of workers (thousand) 745.0 837.0 858.0 885.0 917.0 950 971.0 947.0 983.0 963 974.0
Participation rate (%) 41.1 43.0 43.3 43.6 45.8 45.6 45.7 45.8 46.2 45.8 45.8
Unemployment rate (%) 23.7 20.9 23.0 23.4 23.4 25.6 25.9 24.8 27.4 26.9 25.8
West Bank 17.2 17.3 19.0 18.6 17.7 16.3 15.4 18.7 18.7 17.3 18.0
Gaza Strip 37.8 28.7 31.0 32.6 43.9 41.6 41.5 42.7 38.4 41.0 41.2
National Accounts (USD millions)
GDP 8,913.1 10,465.4 11,476.0 12,476.0 12,715.6 2,933.3 3,193.2 3,219.6 3,331.3 12,677.4 3,301.9
Household expenditure 8,354.7 9,602.4 10.158.5 11,062.6 11,840.4 2,777.5 2,914.2 3,146.6 2,957.4 11,795.7 2,987.2
Government expenditure 2,500.8 2,892.3 3,126.9 3,381.7 3,478.2 737.3 857.9 860.6 919.1 3,374.9 768.8
Gross capital formation 1,921.5 1,863.8 2,378.5 2,707.3 2,415.0 529.3 730.2 632.3 797.7 2,689.5 686.0
GDP per capita at Current prices (USD)
2,338.7 2,664.9 2,787.2 2,992.2 2,960.1 670.6 724.7 725.4 745.1 2,865.8 733.3
GDP per capita at constant prices (USD)
1,606.4 1,752.5 1,807.5 1,793.3 1,737.4 423.4 444.7 433.0 444.8 1,745.9 444.3
Foreign Trade a (US$ Million)
Merchandise Exports 1,110.0 1,492.5 1,547.9 1,756.1 1,858.1 471.3 542.8 485.7 518.8 2,018.6 476.2
Merchandise Imports 4,613.4 5,100.6 5,574.7 6,053.0 6,9496.9 1,537.0 1,746.5 1,811.4 1,765.3 6,860.2 1,562.6
Net Merchandise Balance (3,503.4) (3,608.1) (4,026.8) (4,296.9) (4,638.8) (1,065.7) (1,203.7) (1,325.7) (4,841.6) (4,841.6) (1,086.4)
Exports of Registered Services 257.3 306.9 323.2 315.7 314.2 60.9 82.4 76.6 304.1 304.1 61.9
Imports of Registered Services 650.9 622.6 725.2 751.0 712.0 159.6 159.5 169.7 641.2 641.2 146.3
Net Balance of Services (393.6) (315.7) (402.0) (435.3) (397.8) (98.7) (77.1) (93.1) (337.1) (337.1) (84.4)Current account (Balance of payments) (1,306.9) (2,069.5) (1,820.8) (2,383.4) (2,149.0) (313.4) (363.4) (586.3) (1,712.9) (1,712.9) (277.8)
Exchange rates and inflation
USD/NIS exchange rate 3.70 3.60 3.90 3.60 3.60 3.94 3.90 3.80 3.90 3.90 3.87
JOD/NIS exchange rate 5.30 5.10 5.40 5.10 5.10 5.57 5.50 5.40 5.50 5.50 5.51
Inflation rate (%)b 3.75 2.88 2.78 1.72 1.73 (0.03) 0.85 0.04 0.65 1.43 (0.90)
Public Finance (cash basis USD millions)
Net domestic revenues (including clearance)
1,900.0 2,275.9 2,240.1 2,319.9 2,791.2 399.2 1,018.4 923.1 550.4 2,891.4 883.9
Current expenditure 2,983.0 2,960.7 3,047.1 3,250.7 3,445.9 636.3 ,018.0 911.4 859.2 3,424.9 813.3
Developmental expenditure 275.1 296.2 211.0 168.4 160.9 55.7 37.2 32.6 51.1 176.4 31.2
current budget deficit\surplus (before grants)
(1,083.0) (1,081.0) (1018.0) (1,099.2) (815.6) (237.2) (36.7) (20.8) (359.9) (709.9) 70.6
Total grants and aid 1,277.0 977.5 932.1 1,358.0 1,230.4 221.6 258.8 142.4 174.9 796.8 155.9
Total budget deficit\surplus (after grants and aid)
(81.0) (103.5) (85.9) 258.7 414.8 (71.2) 222.1 121.6 (185.0) 86.9 195.2
Public debt 1,882.8 2,212.8 2,482.5 2,376.2 2,216.8 2,396.9 2,344.9 2,236.0 2,537.2 2,547.2 2,458.5
The Banking Sector (USD millions)
Banks assets/liabilities 8,590.0 9,110.0 9,799.0 11,191.0 11,822.0 11,925.4 12,420.0 12,462.1 12,602.3 12,602.3 13,143.6
Equity 1,096.0 1,182.0 1,258.0 1,360.0 1,464.0 1,446.2 1,396.0 1,427.0 1,461.7 1,461.7 1,483.2
Deposits at banks 6,802.0 6,973.0 7,484.0 8,304.0 8,935.0 8,974.1 9,456.4 9,506.5 9,654.6 9,654.6 10,054.7
Credit facilities 2,825.0 3,483.0 4,122.0 4,480.0 4,895.0 5,126.0 5,419.7 5,420.4 5,824.7 5,824.7 6,137.3
Key Economic Indicators in Palestine, 2010 - 2016
These data do not include that part of Jerusalem governorate which was forcefully annexed by Israel following its occupation of the West Bank in 1967 (With exception to unemployment and population figures).a. Foreign Trade figures are based on estimates in the balance of payments. b. The inflation rate estimation is based on year-over-year comparisons of the average indices of consumer prices (the target year with the previous year).c. Figures for 2016 are preliminary and subject to further revision. d. Figures between brackets indicate negative values.