Palaeoclimate, glacier and treeline reconstruction based ... filecountries (Russia, Mongolia,...
12
Palaeoclimate, glacier and treeline reconstruction based on geomorphic evidences in the Mongun-Taiga massif (south-eastern Russian Altai) during the Late Pleistocene and Holocene Dmitry Ganyushkin a, * , Kirill Chistyakov a , Ilya Volkov a , Dmitry Bantcev a , Elena Kunaeva b , Dagmar Brandov a c , Gerald Raab c , Marcus Christl d , Markus Egli c a Saint-Petersburg State University, Department of Physical Geography and Landscape Planning, Saint-Petersburg 199178,10 liniya V.O., h.33-35, Russian Federation b Pushkin Leningrad State University,10 Peterburgskoe shosse, St Petersburg (Pushkin) 196605, Russian Federation c Department of Geography, University of Zurich, Winterthurerstrasse 190, CH-8057 Zurich, Switzerland d Laboratory of Ion Beam Physics, ETH Zurich, 8093 Zurich, Switzerland article info Article history: Received 30 March 2017 Received in revised form 27 November 2017 Accepted 17 December 2017 Available online 26 December 2017 Keywords: Palaeoclimate reconstruction Pleistocene Holocene Arid mountains of Altai Treeline Glaciers abstract Little is known about the extent of glaciers and dynamics of the landscape in south-eastern Russian Altai. The effects of climate-induced fluctuations of the glaciers and the upper treeline of the Mongun-Taiga mountain massif were, therefore, reconstructed on the basis of in-situ, multiannual observations, geomorphic mapping, radiocarbon and surface exposure dating, relative dating (such as Schmidt- hammer and weathering rind) techniques and palaeoclimate-modelling. During the maximal advance of the glaciers, their area was 26-times larger than now and the equi- librium line of altitude (ELA) was about 800 m lower. Assuming that the maximum glacier extent took place during MIS 4, then the average summer temperatures were 2.7 C cooler than today and the amount of precipitation 2.1 times higher. Buried wood trunks by a glacier gave ages between 60 and 28 cal ka BP and were found 600e700 m higher than the present upper treeline. This evidences a distinctly elevated treeline during MIS 3a and c. With a correction for tectonics we reconstructed the summer warming to have been between 2.1 and 3.0 C. During MIS 3c, the glaciated area was reduced to less than 0.5 km 2 with an increase of the ELA of 310e470 m higher than today. Due to higher precipi- tation, the glaciated area during MIS 3a was close to the current ELA. Exposure dating ( 10 Be) would indicate that the maximum glacier extension was 24ka BP, but the results are questionable. From a geomorphic point of view, the maximum extent can more likely be ascribed to the MIS4 stage. We es- timate a cooling of summer temperature of e 3.8 to e 4.2 C and a decrease in precipitation of 37e46% compared to the present-day situation. Samples of wood having an age of 10.6e6.2 cal ka BP were found about 350 m higher than the present treeline. It seems that the summer temperature was 2.0e2.5 C higher and annual precipitation was double that of the present-day. For that period, the reconstructed glaciation area was 1 km 2 less than today. Three neoglacial glacier advances were detected. The glaciers covered about double the area during the Little Ice Age (LIA), summer cooling was 1.3 C with 70% of the present-day precipitation. The reconstructed amplitude of climatic changes and the shift of the altitu- dinal zones show that the landscape has reacted sensitively to environmental changes and that dramatic changes may occur in the near future. © 2017 Elsevier Ltd and INQUA. All rights reserved. 1. Introduction The Altai mountain region is situated at the border of Central Asia and Siberia and is an area having numerous geomorphic fea- tures that clearly display the variability of climatic conditions and landscape dynamics. The Altai mountains span four different * Corresponding author. Petersburg State University, Institute of Earth Sciences, Department of Physical Geography and Landscape Planning, Saint-Petersburg 199178, 10 liniya V.O., h.33-35, Russian Federation. E-mail address: [email protected] (D. Ganyushkin). Contents lists available at ScienceDirect Quaternary International journal homepage: www.elsevier.com/locate/quaint https://doi.org/10.1016/j.quaint.2017.12.031 1040-6182/© 2017 Elsevier Ltd and INQUA. All rights reserved. Quaternary International 470 (2018) 26e37
Transcript of Palaeoclimate, glacier and treeline reconstruction based ... filecountries (Russia, Mongolia,...
lable at ScienceDirect
Quaternary International 470 (2018) 26e37
Contents lists avai
Quaternary International
journal homepage: www.elsevier .com/locate/quaint
Palaeoclimate, glacier and treeline reconstruction based ongeomorphic evidences in the Mongun-Taiga massif (south-easternRussian Altai) during the Late Pleistocene and Holocene
Dmitry Ganyushkin a, *, Kirill Chistyakov a, Ilya Volkov a, Dmitry Bantcev a,Elena Kunaeva b, Dagmar Brandov�a c, Gerald Raab c, Marcus Christl d, Markus Egli c
a Saint-Petersburg State University, Department of Physical Geography and Landscape Planning, Saint-Petersburg 199178, 10 liniya V.O., h.33-35, RussianFederationb Pushkin Leningrad State University, 10 Peterburgskoe shosse, St Petersburg (Pushkin) 196605, Russian Federationc Department of Geography, University of Zurich, Winterthurerstrasse 190, CH-8057 Zurich, Switzerlandd Laboratory of Ion Beam Physics, ETH Zurich, 8093 Zurich, Switzerland
a r t i c l e i n f o
Article history:Received 30 March 2017Received in revised form27 November 2017Accepted 17 December 2017Available online 26 December 2017
Keywords:Palaeoclimate reconstructionPleistoceneHoloceneArid mountains of AltaiTreelineGlaciers
* Corresponding author. Petersburg State UniversitDepartment of Physical Geography and Landscape199178, 10 liniya V.O., h.33-35, Russian Federation.
E-mail address: [email protected] (D. Ganyus
https://doi.org/10.1016/j.quaint.2017.12.0311040-6182/© 2017 Elsevier Ltd and INQUA. All rights
a b s t r a c t
Little is known about the extent of glaciers and dynamics of the landscape in south-eastern Russian Altai.The effects of climate-induced fluctuations of the glaciers and the upper treeline of the Mongun-Taigamountain massif were, therefore, reconstructed on the basis of in-situ, multiannual observations,geomorphic mapping, radiocarbon and surface exposure dating, relative dating (such as Schmidt-hammer and weathering rind) techniques and palaeoclimate-modelling.
During the maximal advance of the glaciers, their area was 26-times larger than now and the equi-librium line of altitude (ELA) was about 800m lower. Assuming that the maximum glacier extent tookplace during MIS 4, then the average summer temperatures were 2.7 �C cooler than today and theamount of precipitation 2.1 times higher. Buried wood trunks by a glacier gave ages between 60 and28 cal ka BP and were found 600e700m higher than the present upper treeline. This evidences adistinctly elevated treeline during MIS 3a and c. With a correction for tectonics we reconstructed thesummer warming to have been between 2.1 and 3.0 �C. During MIS 3c, the glaciated area was reduced toless than 0.5 km2 with an increase of the ELA of 310e470m higher than today. Due to higher precipi-tation, the glaciated area during MIS 3a was close to the current ELA. Exposure dating (10Be) wouldindicate that the maximum glacier extension was 24 ka BP, but the results are questionable. From ageomorphic point of view, the maximum extent can more likely be ascribed to the MIS4 stage. We es-timate a cooling of summer temperature of e 3.8 to e 4.2 �C and a decrease in precipitation of 37e46%compared to the present-day situation. Samples of wood having an age of 10.6e6.2 cal ka BP were foundabout 350m higher than the present treeline. It seems that the summer temperature was 2.0e2.5 �Chigher and annual precipitation was double that of the present-day. For that period, the reconstructedglaciation area was 1 km2 less than today. Three neoglacial glacier advances were detected. The glacierscovered about double the area during the Little Ice Age (LIA), summer cooling was 1.3 �C with 70% of thepresent-day precipitation. The reconstructed amplitude of climatic changes and the shift of the altitu-dinal zones show that the landscape has reacted sensitively to environmental changes and that dramaticchanges may occur in the near future.
© 2017 Elsevier Ltd and INQUA. All rights reserved.
y, Institute of Earth Sciences,Planning, Saint-Petersburg
hkin).
reserved.
1. Introduction
The Altai mountain region is situated at the border of CentralAsia and Siberia and is an area having numerous geomorphic fea-tures that clearly display the variability of climatic conditions andlandscape dynamics. The Altai mountains span four different
D. Ganyushkin et al. / Quaternary International 470 (2018) 26e37 27
countries (Russia, Mongolia, Kazakhstan and China). Due to theremoteness of the Altai mountains, this region is still very poorlystudied in regard to the Holocene and Pleistocene landscape dy-namics in general and glacier fluctuations in particular (Lehmkuhlet al., 2016). A general framework or pattern about the timing ofthe last glaciation, its maximum, the extension of the glaciersduring the different time periods of the Late Pleistocene and Ho-locene and related altitudinal shifts of the vegetation zones arelargely unknown. Some first ideas about former glaciations in theAltai were published in the late 19th century (e.g., Mihaelis, 1886).Several dozens of stratigraphic schemes for the Quaternary havebeen created only for the Russian Altai. These schemes were basedon differing theories about the number and extent of glacial epochs.For the Late Pleistocene, for example, some authors reconstructedone glaciation (Obruchev, 1914; Svitoch and Faustov, 1978;Butvilovskiy, 1993), one glaciation with two ‘megastadials’(Okishev, 1982, 2011) or two separate glaciations (Devyatkin, 1965).The problem for the creation of a comprehensive scheme for thePleistocene and Holocene glacial fluctuations was caused by thedifferent approaches used, the absence of numerical ages for themoraines, the incongruity of results obtained from radiocarbon andother dating techniques and the spatial discontinuity of the re-constructions. The number of radiocarbon datings is small and theymostly covered an insufficiently long time interval. The availableresults of luminescence dating (Sheinkman, 2002; Agatova et al.,2009; Agatova and Nepop, 2017) or cosmogenic 10Be and 26Alsurface exposure dating (Gribenski et al., 2016; Herget et al., 2017)remain partially controversial because older glacial forms oftenhave not been dated, which rendered their attribution to maximalglacier extents of the LGM (Last Glacial Maximum) difficult.
In the Russian Altai, the history of Pleistocene and Holocenefluctuations of the glaciers and landscape dynamics is slightlybetter known because the climate is more humid, thus giving riseto more finds of datable organic remains. For the Mongolian Altai,geochronological results suggest large ice advances that correlateto the marine isotope stages (MIS) 4 and 2. This is in contrast to theresults obtained from the central Mongolian Khangai mountains,where ice advances additionally occurred during MIS3. During thePleistocene, glacial equilibrium-line altitudes (ELAs) were about500 to> 1000m lower in the more humid portion of the Russianand western Mongolian Altai, compared to 300e600m in the drierranges of the eastern Mongolian Altai (Lehmkuhl et al., 2016). Inlarge parts of the Altai, Kanghai and north-eastern Tibetan plateaupermafrost induces periglacial processes. Examples from late Ho-locene solifluction activity in the Altai, Khangai and north-easternTibetan plateau show a different intensity of solifluction processesduring the late Holocene and Little Ice Age (LIA) due to a decreasein temperature and higher soil humidity (Lehmkuhl et al., 2016).
The problem of the unknown number of Pleistocene glaciations,glacial fluctuations and the timing of the maximal glacial extent(s)still remain unsolved. Sheinkman (2011) dated it to 105e115 ky BPby using thermoluminescence (TL) and varve counting and referredit toMIS 5d. Several authors (Svitoch and Faustov,1978; Borisov andMinina, 1989) dated the maximal glacial stage with 58± 6.7 ka BPby using TL dating in the Chagan-Uzun key area. Okishev (2011)even referred it to the interval between 58± 6.7 and 32± 4 ka BP.MIS 3 ages were given for the Chinese Altai (Xu et al., 2009) andlater re-dated to the MIS 4 stage (Zhao et al., 2013). Butvilovskiy(1993) attributed the maximum stage to about 18e20 ka BP(Butvilovskiy, 1993). Recent surface exposure results (10Be) gave anage for the glacial maximum at approximately 19.2 ka BP (Gribenskiet al., 2016). For south-eastern Altai, most of the palaeogeographicinformation is related to the South-Chuya range (Agatova et al.,2012). Using radiocarbon data, Agatova et al. (2014) were able totrace former glacier fluctuations and upper tree limit variations for
this part of the Altai for the last 3 ka. Glacier advances occurredbetween 2300 and 1700 cal BP and during the 13th e 19th century(LIA). Further to the east, the climate becomes more arid, thevegetation is sparse and findings of organic fossils are rare.Consequently, this has also restricted the database on palaeo-information. In 1988, the University of St. Petersburg started tocollect palaeoglaciologic and palaeoclimatic data on the Mongun-Taiga mountain massif (eastern part of the Altai range). The maingoal of this paper is to develop a chronology of glaciation and toreconstruct fluctuations of the glacial settings, climatic conditionsand treeline variability in the Mongun Taiga during the Late Pleis-tocene and Holocene.
2. Study area
The Mongun-Taiga mountain massif is situated in the south-eastern periphery of the Russian Altai mountains (Fig. 1). It islocated within the internal drainage basin of the Mongolian GreatLakes. The highest peak has an elevation of 3971m a.s.l. The mainridge stretches from southwest to northeast, reaching3000e3300m in the western and eastern periphery and3500e3970m in the central part. The climate of the massif is coldand arid. According to data of the closest meteorological stationMugur-Aksy (1830m a.s.l., 50� 220 4500 N, 90� 260 000 E; WMO code362780: about 30 km to the north-east of the massif) the averageannual precipitation is 160mm, the mean summer temperature is12.0 �C and mean temperature about e 3 �C. Forest vegetation isconcentrated on the northern slopes of the massif with LarixSibirica usually occurring between 2000 and 2400m a.s.l. The uppertreeline varies between 2400m on north-western slopes to 2300on the north-eastern slopes. The upper treeline of the north-eastern slopes corresponds to an average summer temperature of8.8 �C (Chistyakov et al., 2012). Glacial relief forms such as cirques,U-shaped valleys or moraines are widely present at altitudes above1800m а.s.l. Three different morphological groups of moraines,representing glacial advances, can be distinguished.
Currently, there are 30 glaciers having a total area of 20.2 km2
within the massif. Valley glaciers comprise over half of that area.The number of small hanging and cirque glaciers, however, is alsosignificant. One large proportion of the glaciers is found around thehighest summit of themassif (3971m a.s.l.) and a smaller one to thewest of the Tolaity valley having a maximal altitude of 3681m a.s.l.The central part of both complexes is dominated by a flat summit-glacier. This type of glacier diverges radially and has a uniformaccumulation zone. Usually, the largest glaciers develop on theleeward, north-eastern slopes. The ice accumulation there is theresult of a combination of snow-drift and low insolation.
The vertical extension of glaciation is from 3970 to 2900m a.s.l.The average ELA for the glaciers of the Mongun-Taiga massif is at3390m a.s.l. The glaciers of the massif, however, are retreatingd asthey are in many other parts of the world. The tendency of anaccelerating retreat is particularly well-documented for the largestglaciers during the last 10 years: for example, the average rate ofretreat of the Shara-Horagai glacier in 2013e2016 was 44.2m/year(Ganiushkin et al., 2015 and unpublished results).
3. Materials and methods
The investigations are based on in situ measurements and ob-servations (glaciologic, glacio-geomorphic, hydrological, meteoro-logical, palaeogeographic) over the last 35 years that enabled amodelling of palaeoclimate and timing of glaciation. The glaciologicand glacio-geomorphic field observations included the delineationof the present-day glaciers using field mapping, route observations,GPS-trekking of glacial termination and moraines, a geodetic
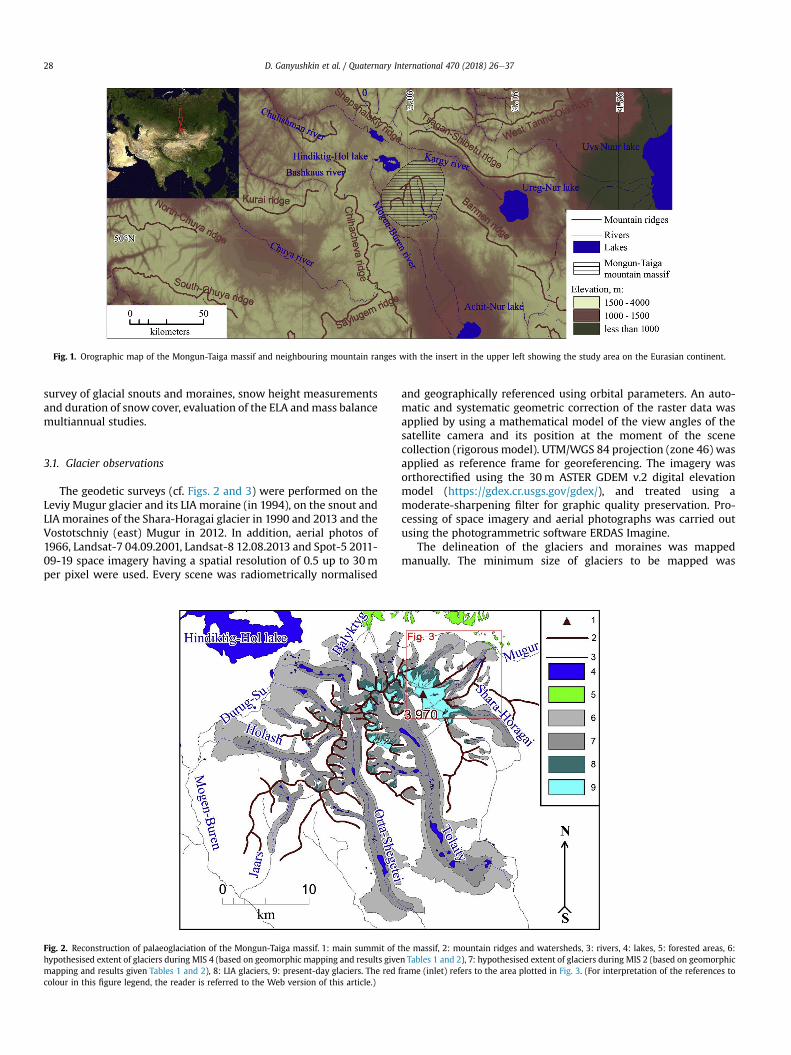
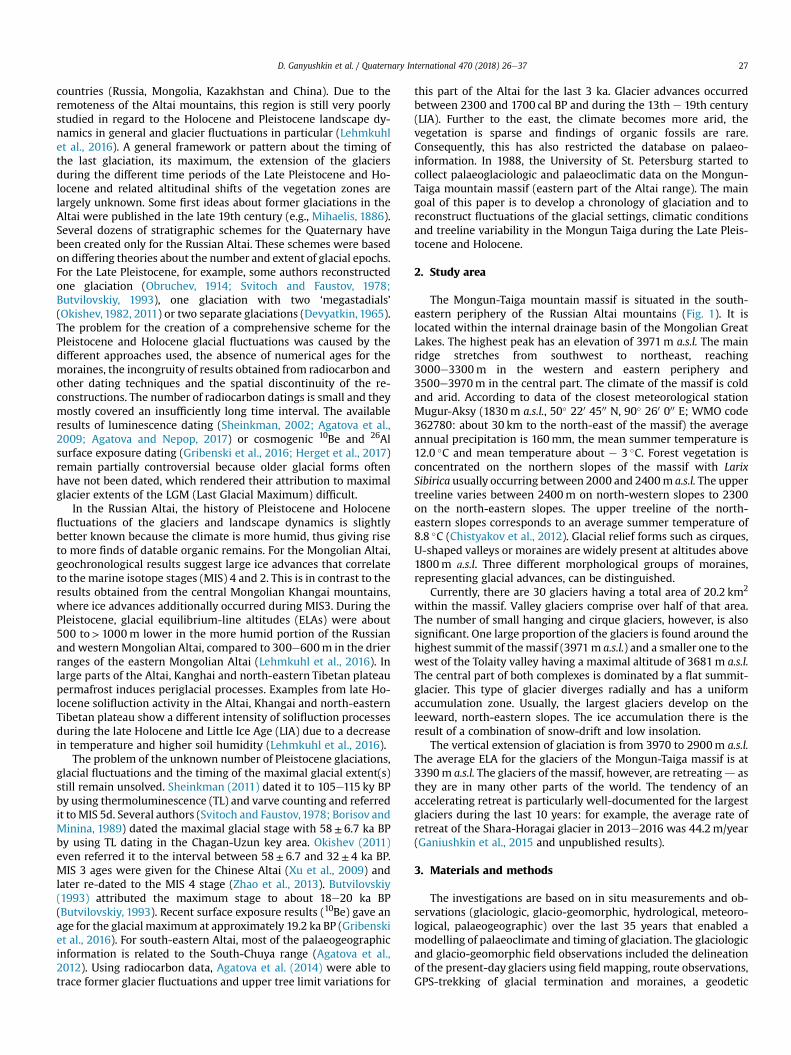
Fig. 1. Orographic map of the Mongun-Taiga massif and neighbouring mountain ranges with the insert in the upper left showing the study area on the Eurasian continent.
D. Ganyushkin et al. / Quaternary International 470 (2018) 26e3728
survey of glacial snouts and moraines, snow height measurementsand duration of snow cover, evaluation of the ELA andmass balancemultiannual studies.
3.1. Glacier observations
The geodetic surveys (cf. Figs. 2 and 3) were performed on theLeviy Mugur glacier and its LIA moraine (in 1994), on the snout andLIA moraines of the Shara-Horagai glacier in 1990 and 2013 and theVostotschniy (east) Mugur in 2012. In addition, aerial photos of1966, Landsat-7 04.09.2001, Landsat-8 12.08.2013 and Spot-5 2011-09-19 space imagery having a spatial resolution of 0.5 up to 30mper pixel were used. Every scene was radiometrically normalised
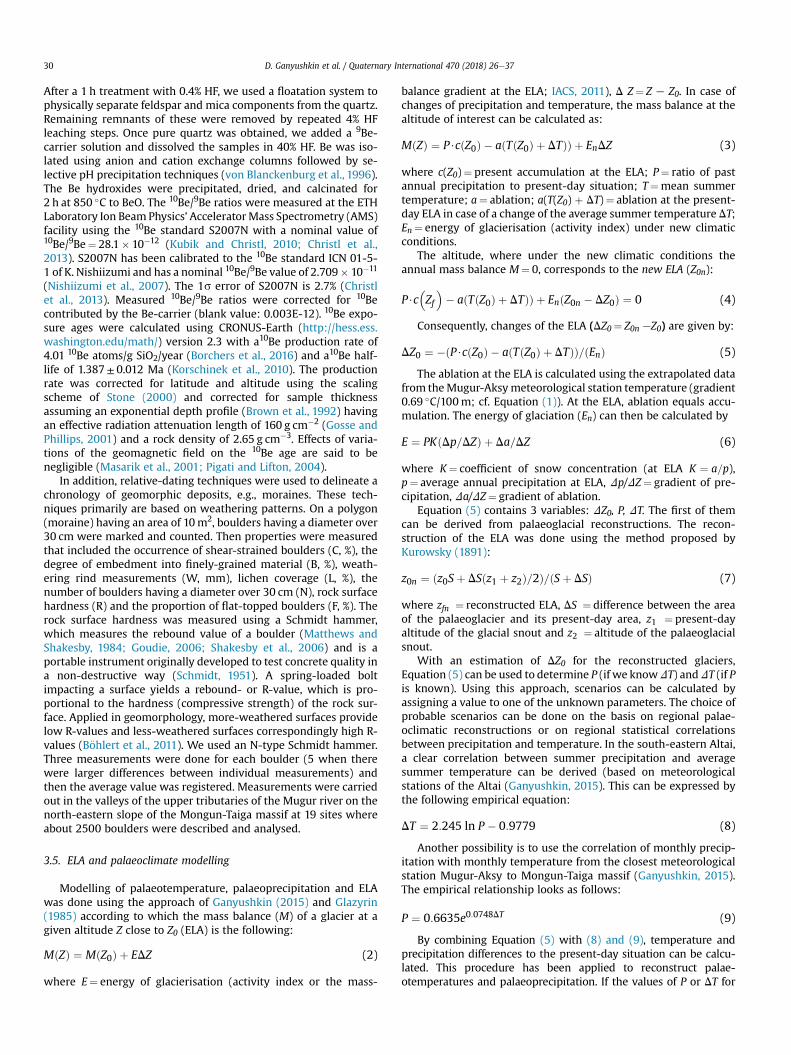
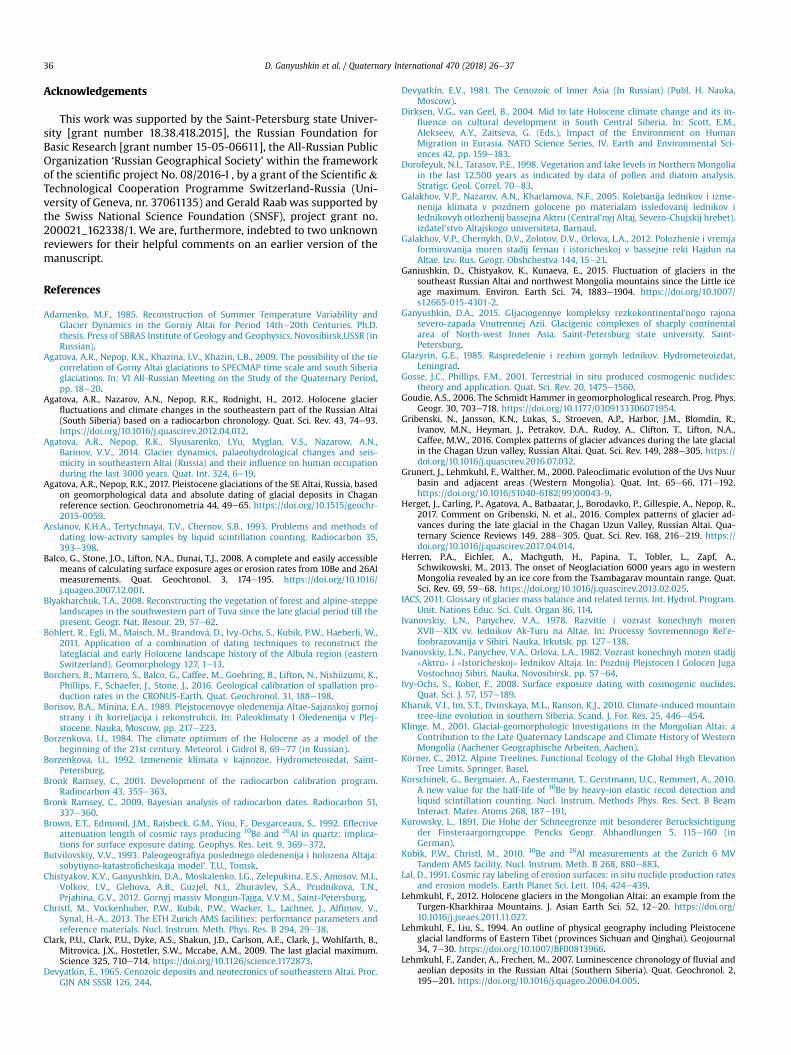
Fig. 2. Reconstruction of palaeoglaciation of the Mongun-Taiga massif. 1: main summit of thypothesised extent of glaciers during MIS 4 (based on geomorphic mapping and results givemapping and results given Tables 1 and 2), 8: LIA glaciers, 9: present-day glaciers. The redcolour in this figure legend, the reader is referred to the Web version of this article.)
and geographically referenced using orbital parameters. An auto-matic and systematic geometric correction of the raster data wasapplied by using a mathematical model of the view angles of thesatellite camera and its position at the moment of the scenecollection (rigorous model). UTM/WGS 84 projection (zone 46) wasapplied as reference frame for georeferencing. The imagery wasorthorectified using the 30m ASTER GDEM v.2 digital elevationmodel (https://gdex.cr.usgs.gov/gdex/), and treated using amoderate-sharpening filter for graphic quality preservation. Pro-cessing of space imagery and aerial photographs was carried outusing the photogrammetric software ERDAS Imagine.
The delineation of the glaciers and moraines was mappedmanually. The minimum size of glaciers to be mapped was
he massif, 2: mountain ridges and watersheds, 3: rivers, 4: lakes, 5: forested areas, 6:n Tables 1 and 2), 7: hypothesised extent of glaciers during MIS 2 (based on geomorphicframe (inlet) refers to the area plotted in Fig. 3. (For interpretation of the references to
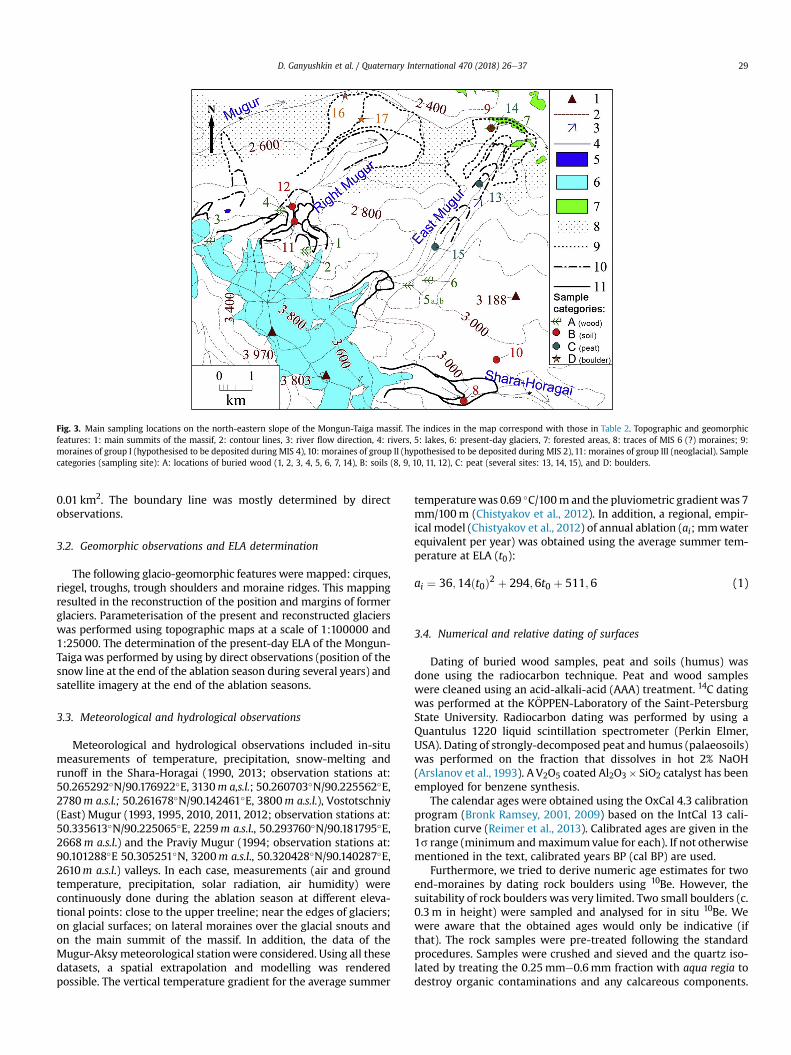
Fig. 3. Main sampling locations on the north-eastern slope of the Mongun-Taiga massif. The indices in the map correspond with those in Table 2. Topographic and geomorphicfeatures: 1: main summits of the massif, 2: contour lines, 3: river flow direction, 4: rivers, 5: lakes, 6: present-day glaciers, 7: forested areas, 8: traces of MIS 6 (?) moraines; 9:moraines of group I (hypothesised to be deposited during MIS 4), 10: moraines of group II (hypothesised to be deposited during MIS 2), 11: moraines of group III (neoglacial). Samplecategories (sampling site): A: locations of buried wood (1, 2, 3, 4, 5, 6, 7, 14), B: soils (8, 9, 10, 11, 12), C: peat (several sites: 13, 14, 15), and D: boulders.
D. Ganyushkin et al. / Quaternary International 470 (2018) 26e37 29
0.01 km2. The boundary line was mostly determined by directobservations.
3.2. Geomorphic observations and ELA determination
The following glacio-geomorphic features were mapped: cirques,riegel, troughs, trough shoulders and moraine ridges. This mappingresulted in the reconstruction of the position and margins of formerglaciers. Parameterisation of the present and reconstructed glacierswas performed using topographic maps at a scale of 1:100000 and1:25000. The determination of the present-day ELA of the Mongun-Taigawas performed by using by direct observations (position of thesnow line at the end of the ablation season during several years) andsatellite imagery at the end of the ablation seasons.
3.3. Meteorological and hydrological observations
Meteorological and hydrological observations included in-situmeasurements of temperature, precipitation, snow-melting andrunoff in the Shara-Horagai (1990, 2013; observation stations at:50.265292�N/90.176922�E, 3130m a,s.l.; 50.260703�N/90.225562�E,2780m a.s.l.; 50.261678�N/90.142461�E, 3800m a.s.l.), Vostotschniy(East) Mugur (1993, 1995, 2010, 2011, 2012; observation stations at:50.335613�N/90.225065�E, 2259m a.s.l., 50.293760�N/90.181795�E,2668m a.s.l.) and the Praviy Mugur (1994; observation stations at:90.101288�E 50.305251�N, 3200m a.s.l., 50.320428�N/90.140287�E,2610m a.s.l.) valleys. In each case, measurements (air and groundtemperature, precipitation, solar radiation, air humidity) werecontinuously done during the ablation season at different eleva-tional points: close to the upper treeline; near the edges of glaciers;on glacial surfaces; on lateral moraines over the glacial snouts andon the main summit of the massif. In addition, the data of theMugur-Aksymeteorological stationwere considered. Using all thesedatasets, a spatial extrapolation and modelling was renderedpossible. The vertical temperature gradient for the average summer
temperaturewas 0.69 �C/100m and the pluviometric gradient was 7mm/100m (Chistyakov et al., 2012). In addition, a regional, empir-ical model (Chistyakov et al., 2012) of annual ablation (ai; mmwaterequivalent per year) was obtained using the average summer tem-perature at ELA (t0):
ai ¼ 36;14ðt0Þ2 þ 294;6t0 þ 511;6 (1)
3.4. Numerical and relative dating of surfaces
Dating of buried wood samples, peat and soils (humus) wasdone using the radiocarbon technique. Peat and wood sampleswere cleaned using an acid-alkali-acid (AAA) treatment. 14C datingwas performed at the K€OPPEN-Laboratory of the Saint-PetersburgState University. Radiocarbon dating was performed by using aQuantulus 1220 liquid scintillation spectrometer (Perkin Elmer,USA). Dating of strongly-decomposed peat and humus (palaeosoils)was performed on the fraction that dissolves in hot 2% NaOH(Arslanov et al., 1993). A V2O5 coated Al2O3� SiO2 catalyst has beenemployed for benzene synthesis.
The calendar ages were obtained using the OxCal 4.3 calibrationprogram (Bronk Ramsey, 2001, 2009) based on the IntCal 13 cali-bration curve (Reimer et al., 2013). Calibrated ages are given in the1s range (minimum andmaximumvalue for each). If not otherwisementioned in the text, calibrated years BP (cal BP) are used.
Furthermore, we tried to derive numeric age estimates for twoend-moraines by dating rock boulders using 10Be. However, thesuitability of rock boulders was very limited. Two small boulders (c.0.3m in height) were sampled and analysed for in situ 10Be. Wewere aware that the obtained ages would only be indicative (ifthat). The rock samples were pre-treated following the standardprocedures. Samples were crushed and sieved and the quartz iso-lated by treating the 0.25mme0.6mm fraction with aqua regia todestroy organic contaminations and any calcareous components.
D. Ganyushkin et al. / Quaternary International 470 (2018) 26e3730
After a 1 h treatment with 0.4% HF, we used a floatation system tophysically separate feldspar and mica components from the quartz.Remaining remnants of these were removed by repeated 4% HFleaching steps. Once pure quartz was obtained, we added a 9Be-carrier solution and dissolved the samples in 40% HF. Be was iso-lated using anion and cation exchange columns followed by se-lective pH precipitation techniques (von Blanckenburg et al., 1996).The Be hydroxides were precipitated, dried, and calcinated for2 h at 850 �C to BeO. The 10Be/9Be ratios were measured at the ETHLaboratory Ion Beam Physics’ AcceleratorMass Spectrometry (AMS)facility using the 10Be standard S2007N with a nominal value of10Be/9Be¼ 28.1� 10�12 (Kubik and Christl, 2010; Christl et al.,2013). S2007N has been calibrated to the 10Be standard ICN 01-5-1 of K. Nishiizumi and has a nominal 10Be/9Be value of 2.709� 10�11
(Nishiizumi et al., 2007). The 1s error of S2007N is 2.7% (Christlet al., 2013). Measured 10Be/9Be ratios were corrected for 10Becontributed by the Be-carrier (blank value: 0.003E-12). 10Be expo-sure ages were calculated using CRONUS-Earth (http://hess.ess.washington.edu/math/) version 2.3 with a10Be production rate of4.01 10Be atoms/g SiO2/year (Borchers et al., 2016) and a10Be half-life of 1.387± 0.012 Ma (Korschinek et al., 2010). The productionrate was corrected for latitude and altitude using the scalingscheme of Stone (2000) and corrected for sample thicknessassuming an exponential depth profile (Brown et al., 1992) havingan effective radiation attenuation length of 160 g cm�2 (Gosse andPhillips, 2001) and a rock density of 2.65 g cm�3. Effects of varia-tions of the geomagnetic field on the 10Be age are said to benegligible (Masarik et al., 2001; Pigati and Lifton, 2004).
In addition, relative-dating techniques were used to delineate achronology of geomorphic deposits, e.g., moraines. These tech-niques primarily are based on weathering patterns. On a polygon(moraine) having an area of 10m2, boulders having a diameter over30 cm were marked and counted. Then properties were measuredthat included the occurrence of shear-strained boulders (C, %), thedegree of embedment into finely-grained material (B, %), weath-ering rind measurements (W, mm), lichen coverage (L, %), thenumber of boulders having a diameter over 30 cm (N), rock surfacehardness (R) and the proportion of flat-topped boulders (F, %). Therock surface hardness was measured using a Schmidt hammer,which measures the rebound value of a boulder (Matthews andShakesby, 1984; Goudie, 2006; Shakesby et al., 2006) and is aportable instrument originally developed to test concrete quality ina non-destructive way (Schmidt, 1951). A spring-loaded boltimpacting a surface yields a rebound- or R-value, which is pro-portional to the hardness (compressive strength) of the rock sur-face. Applied in geomorphology, more-weathered surfaces providelow R-values and less-weathered surfaces correspondingly high R-values (B€ohlert et al., 2011). We used an N-type Schmidt hammer.Three measurements were done for each boulder (5 when therewere larger differences between individual measurements) andthen the average value was registered. Measurements were carriedout in the valleys of the upper tributaries of the Mugur river on thenorth-eastern slope of the Mongun-Taiga massif at 19 sites whereabout 2500 boulders were described and analysed.
3.5. ELA and palaeoclimate modelling
Modelling of palaeotemperature, palaeoprecipitation and ELAwas done using the approach of Ganyushkin (2015) and Glazyrin(1985) according to which the mass balance (M) of a glacier at agiven altitude Z close to Z0 (ELA) is the following:
MðZÞ ¼ MðZ0Þ þ EDZ (2)
where E¼ energy of glacierisation (activity index or the mass-
balance gradient at the ELA; IACS, 2011), D Z¼ Z e Z0. In case ofchanges of precipitation and temperature, the mass balance at thealtitude of interest can be calculated as:
MðZÞ ¼ P$cðZ0Þ � aðTðZ0Þ þ DTÞÞ þ EnDZ (3)
where c(Z0)¼ present accumulation at the ELA; P¼ ratio of pastannual precipitation to present-day situation; T¼mean summertemperature; a¼ ablation; a(T(Z0) þ DT)¼ ablation at the present-day ELA in case of a change of the average summer temperature DT;En¼ energy of glacierisation (activity index) under new climaticconditions.
The altitude, where under the new climatic conditions theannual mass balance M¼ 0, corresponds to the new ELA (Z0n):
P$c�Zf�� aðTðZ0Þ þ DTÞÞ þ EnðZ0n � DZ0Þ ¼ 0 (4)
Consequently, changes of the ELA (DZ0¼ Z0n eZ0) are given by:
DZ0 ¼ �ðP$cðZ0Þ � aðTðZ0Þ þ DTÞÞ=ðEnÞ (5)
The ablation at the ELA is calculated using the extrapolated datafrom theMugur-Aksymeteorological station temperature (gradient0.69 �C/100m; cf. Equation (1)). At the ELA, ablation equals accu-mulation. The energy of glaciation (En) can then be calculated by
E ¼ PKðDp=DZÞ þ Da=DZ (6)
where K¼ coefficient of snow concentration (at ELA K ¼ a=p),p¼ average annual precipitation at ELA, Dp/DZ¼ gradient of pre-cipitation, Da/DZ¼ gradient of ablation.
Equation (5) contains 3 variables: DZ0, P, DT. The first of themcan be derived from palaeoglacial reconstructions. The recon-struction of the ELA was done using the method proposed byKurowsky (1891):
z0n ¼ ðz0Sþ DSðz1 þ z2Þ=2Þ=ðSþ DSÞ (7)
where zfn ¼ reconstructed ELA, DS ¼ difference between the areaof the palaeoglacier and its present-day area, z1 ¼ present-dayaltitude of the glacial snout and z2 ¼ altitude of the palaeoglacialsnout.
With an estimation of DZ0 for the reconstructed glaciers,Equation (5) can be used to determine P (if we knowDT) andDT (if Pis known). Using this approach, scenarios can be calculated byassigning a value to one of the unknown parameters. The choice ofprobable scenarios can be done on the basis on regional palae-oclimatic reconstructions or on regional statistical correlationsbetween precipitation and temperature. In the south-eastern Altai,a clear correlation between summer precipitation and averagesummer temperature can be derived (based on meteorologicalstations of the Altai (Ganyushkin, 2015). This can be expressed bythe following empirical equation:
DT ¼ 2:245 ln P � 0:9779 (8)
Another possibility is to use the correlation of monthly precip-itation with monthly temperature from the closest meteorologicalstation Mugur-Aksy to Mongun-Taiga massif (Ganyushkin, 2015).The empirical relationship looks as follows:
P ¼ 0:6635e0:0748DT (9)
By combining Equation (5) with (8) and (9), temperature andprecipitation differences to the present-day situation can be calcu-lated. This procedure has been applied to reconstruct palae-otemperatures and palaeoprecipitation. If the values of P or DT for

D. Ganyushkin et al. / Quaternary International 470 (2018) 26e37 31
some time point are, however, known from literature, calculationswere directly carried out using Equation (5). Having theDT value, thedifference between the present-day and the past upper treeline DFcan be calculated. Finds of buried wood gave, in addition, indicationsabout the past upper treeline. Assuming that the found wood wasclose to the treeline, then DT ¼ DF=Gt , with DF¼ difference be-tween the altitude of the find and the altitude of the current treeline,Gt¼ present-day altitudinal gradient of temperature.
The obtained DZ0 and values of ELA and treeline variationsshould be corrected for tectonic shifts. In several parts, the Altaimountains are tectonically very active. This activity led to the dis-locations of quaternary sediments (e.g., the northern bank of theupper flow of Shara-Horagai). Recent earthquakes having amagnitude of 7e8 took place in the area of the Mongun-Taigamassif (Actit-Nur earthquake 19th of October 1938 and Ureg-Nurearthquake 15th of May 1970). Tectonic movements during theLate Pleistocene are indicated by indirect traces, e.g. the presence offaults with a vertical amplitude of up to 500m (near the riverShara-Horagay), the occurrence of hanging valleys (300e400m), orthe presence of post-glacial erosional trenches with a depth of up to500m. From this the tectonic uplift can be roughly estimated withabout 400m for the last 75 ka. This corresponds to an uplift rate ofabout 5.3mm/year.
4. Results
4.1. Geomorphic patterns and glacier extension
The first group (group I) of moraines is composed of a bluish-grey sandy material, having a large number of rounded boulders,mostly granite. Its surface is hummocky-like, with many small,round thermokarst depressions and lakes. These forms are locatedat the transition from U-shaped valleys to the intermountain de-pressions, i.e. at altitudes of 1800e2200m a.s.l. In some valleys,these moraines can be traced on trough shoulders until the cirques(at an altitude of about 3100m a.s.l.). Furthermore, these morainescan be subdivided into several stages: the oldest holds the greatestarea but, in some places, the terminal moraines of the youngeststage break through the older ones. The moraines of group II aresituated within the troughs, reaching 2100e2200m a.s.l. at theirlowest extension. Their composition is similar to the first group.These are typical moraines of a valley glaciation. The morainesshow erosion in many places. Some moraines still dam lakes in thetongue basin, especially the youngest of these moraines. Lateralmoraines of this group can be traced on trough shoulders up to thecirques to an altitude of about 2600e2700m a.s.l., but 50e150mbelow the previous group. The moraines of group III are charac-terised by coarse angular stony material intersected with sand andclay deposits. These types of moraines exhibit 3 stages that areusually adjacent to each other or even overlap each other. Theymostly form sediment complexes in the upper part of troughs nextto the present-day glaciers. These moraine complexes are usuallybare of vegetation or slightly covered by pioneer vegetation; theyhave steep fronts. Glacial ice is sometimes exposed by thermokarst.These moraines are almost unaffected by erosion.
Although nowadays the glaciers mostly have a north-easternaspect, the ancient moraines are more extensive on the southernslopes of the massif (Fig. 2). According to our reconstruction, theglaciers of the southern and south-eastern slopes had a length of upto 30e35 km during the LGM, while on the northern slopes theyhad a length less than half of that. At the same time, the glacialtermini were 300e400m lower on the southern slopes than on thenorthern slopes. Such a disproportion could only have been causedby a higher moisture flux from the south and/or due to snowdrifting from the north-facing slopes.
4.2. Dating of surfaces
4.2.1. Relative chronologyThe results of relative dating are given in Table 1. Both variables,
shear-strained boulders (C) and their embedment into the finely-grained material (B), increase proportionally along the morpho-logical groups of moraines (increasing values from III to I; Table 1).Also, the proportion of flat-topped boulders (F) increases in thesame order. The rebound values and the weathering rind thick-nesses show that the surface of themoraine groups I and II were themost weathered. From a stratigraphic point of view, moraine groupI must be older thanmoraine group II. This trend is best reflected bythe parameters C, B and F. This means that the cracking of largerboulders and their embedment into the fine material are suitableprocesses to describe the long-term evolution of moraines. Thedisintegration of smaller boulders on moraine surfaces or theirprogressive coverage by finer sediments and soils, the coverage ofthe boulders with lichens and the flattening of the large bouldersare active processes at the early stage of moraine evolution.Rebound values (R) rapidly decreased during the early stage ofmoraine evolution. The slight increase of these values for the oldestmoraine group could have been caused by the disintegration of lesssolid boulders and the preservation of the more resistant part.Chemical weathering (oxidation, ferruginisation) in conditionswith low precipitation strongly depends on local differences inmoisture content. Usually, slightly thicker weathering rinds weremeasured near creeks (higher air humidity; in general 1e2mmthicker weathering rinds compared to drier conditions; data notshown). This might have slightly biased the temporal trend ofweathering rind thickness.
4.2.2. Radiometric chronologyDirect dating of the moraines was difficult. Dating of warm
periods during interstadials can help to fix glacial advances to atime interval. The minimal age for the warm period after theadvance of the earliest stage of the third moraine group(3141e2776 cal BP; Table 2) was measured in the Praviy (right)Mugur valley (soil on the surface of a grass-covered moraine,adjacent to a younger bare moraine complex, index 11 in Fig. 3 andTable 2). There is also a high probability that the buried woodhaving an age 3697e3495 cal BP (index 7; Fig. 3), and found about50m above the present-day upper treeline, refers to this warmphase. Another time marker is a buried soil having an age of5881e5326 cal BP (index 8; Table 2, Fig. 3) that was found in theShara-Horagai valley where the river cuts a moraine. This meansthat one (or maybe two) glacial advance(s) occurred between 5.5and 3.6 ka cal BP. This period can be referred to the earliest glacialadvance of the Neoglacial period (cooling period that started afterthe Holocene Climatic Optimum, Akkem stage of Altai glaciers). Awarmer period obviously ended about 1.2 ka BP indicated by aburied soil (1293e1089 cal BP; index 12 in Fig. 3) and peat(1224e1009 cal BP; buried by stony material from a talus cone,index 15 in Fig. 3). The maximum advance of the LIA glaciers wasabout 1810e1820 AD (Ganiushkin et al., 2015) according todendrochronological measurements.
The warm period preceding the Neoglacial was characterised bya rise of the upper treeline to a level of 300e400m higher thantoday. Several finds of ancient wood having 10180e10580 (samplesite 5; Fig. 3), 9245e9000 (sample site 6) and 6350e6170 cal BP(sample site 5; Table 2) indicate this shift. The dating of peat, woodand charcoal (Table 2 and Fig. 3; sample sites 13, 14, 15) indicatesthat relatively warm and/or moist conditions seem to have existedin the mid-Holocene. According to fossil wood finds having an ageof 31436e31178 and 29537e28759 cal BP (sample sites 3 and 4;Table 2) at altitudes of 1000 and 500m above the current upper
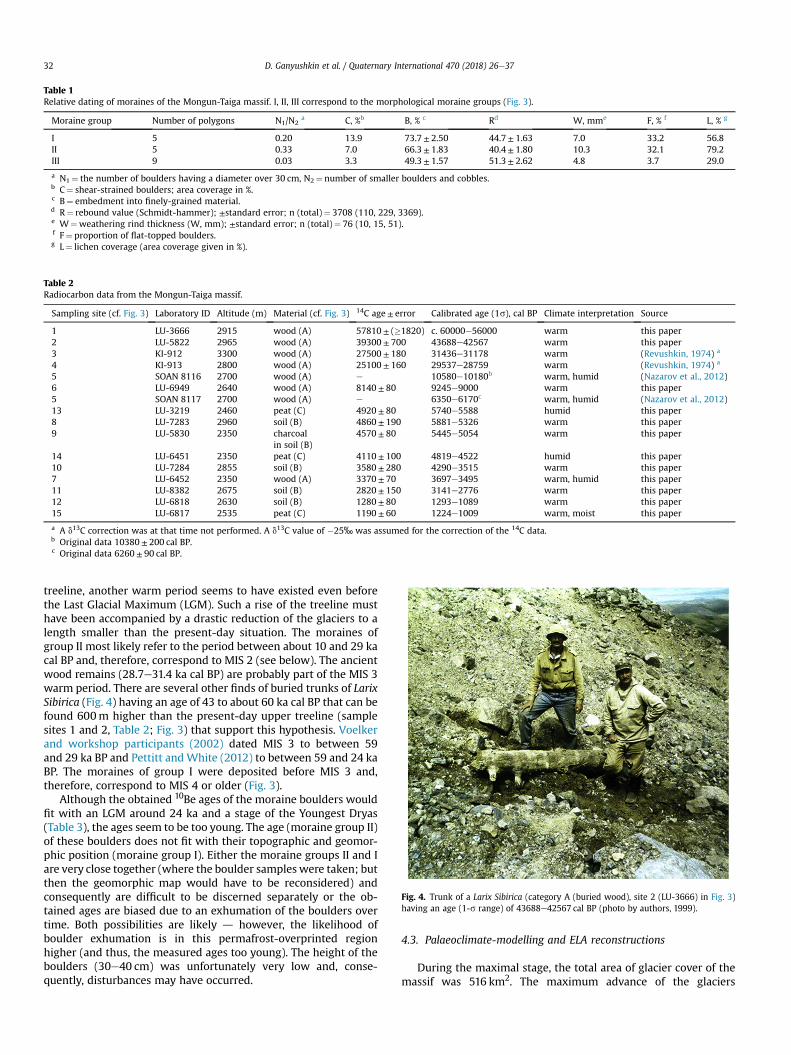
Table 1Relative dating of moraines of the Mongun-Taiga massif. I, II, III correspond to the morphological moraine groups (Fig. 3).
Moraine group Number of polygons N1/N2a C, %b B, % c Rd W, mme F, % f L, % g
I 5 0.20 13.9 73.7± 2.50 44.7± 1.63 7.0 33.2 56.8II 5 0.33 7.0 66.3± 1.83 40.4± 1.80 10.3 32.1 79.2III 9 0.03 3.3 49.3± 1.57 51.3± 2.62 4.8 3.7 29.0
a N1¼ the number of boulders having a diameter over 30 cm, N2¼ number of smaller boulders and cobbles.b C¼ shear-strained boulders; area coverage in %.c B¼ embedment into finely-grained material.d R¼ rebound value (Schmidt-hammer); ±standard error; n (total)¼ 3708 (110, 229, 3369).e W¼weathering rind thickness (W, mm); ±standard error; n (total)¼ 76 (10, 15, 51).f F¼ proportion of flat-topped boulders.g L¼ lichen coverage (area coverage given in %).
Table 2Radiocarbon data from the Mongun-Taiga massif.
Sampling site (cf. Fig. 3) Laboratory ID Altitude (m) Material (cf. Fig. 3) 14C age± error Calibrated age (1s), cal BP Climate interpretation Source
1 LU-3666 2915 wood (A) 57810± (�1820) c. 60000e56000 warm this paper2 LU-5822 2965 wood (A) 39300± 700 43688e42567 warm this paper3 KI-912 3300 wood (A) 27500± 180 31436e31178 warm (Revushkin, 1974) a
4 KI-913 2800 wood (A) 25100± 160 29537e28759 warm (Revushkin, 1974) a
5 SOAN 8116 2700 wood (A) e 10580e10180b warm, humid (Nazarov et al., 2012)6 LU-6949 2640 wood (A) 8140± 80 9245e9000 warm this paper5 SOAN 8117 2700 wood (A) e 6350e6170c warm, humid (Nazarov et al., 2012)13 LU-3219 2460 peat (C) 4920± 80 5740e5588 humid this paper8 LU-7283 2960 soil (B) 4860± 190 5881e5326 warm this paper9 LU-5830 2350 charcoal
in soil (B)4570± 80 5445e5054 warm this paper
14 LU-6451 2350 peat (C) 4110± 100 4819e4522 humid this paper10 LU-7284 2855 soil (B) 3580± 280 4290e3515 warm this paper7 LU-6452 2350 wood (A) 3370± 70 3697e3495 warm, humid this paper11 LU-8382 2675 soil (B) 2820± 150 3141e2776 warm this paper12 LU-6818 2630 soil (B) 1280± 80 1293e1089 warm this paper15 LU-6817 2535 peat (C) 1190± 60 1224e1009 warm, moist this paper
a A d13C correction was at that time not performed. A d13C value of �25‰ was assumed for the correction of the 14C data.b Original data 10380± 200 cal BP.c Original data 6260± 90 cal BP.
Fig. 4. Trunk of a Larix Sibirica (category A (buried wood), site 2 (LU-3666) in Fig. 3)having an age (1-s range) of 43688e42567 cal BP (photo by authors, 1999).
D. Ganyushkin et al. / Quaternary International 470 (2018) 26e3732
treeline, another warm period seems to have existed even beforethe Last Glacial Maximum (LGM). Such a rise of the treeline musthave been accompanied by a drastic reduction of the glaciers to alength smaller than the present-day situation. The moraines ofgroup II most likely refer to the period between about 10 and 29 kacal BP and, therefore, correspond to MIS 2 (see below). The ancientwood remains (28.7e31.4 ka cal BP) are probably part of the MIS 3warm period. There are several other finds of buried trunks of LarixSibirica (Fig. 4) having an age of 43 to about 60 ka cal BP that can befound 600m higher than the present-day upper treeline (samplesites 1 and 2, Table 2; Fig. 3) that support this hypothesis. Voelkerand workshop participants (2002) dated MIS 3 to between 59and 29 ka BP and Pettitt and White (2012) to between 59 and 24 kaBP. The moraines of group I were deposited before MIS 3 and,therefore, correspond to MIS 4 or older (Fig. 3).
Although the obtained 10Be ages of the moraine boulders wouldfit with an LGM around 24 ka and a stage of the Youngest Dryas(Table 3), the ages seem to be too young. The age (moraine group II)of these boulders does not fit with their topographic and geomor-phic position (moraine group I). Either the moraine groups II and Iare very close together (where the boulder samples were taken; butthen the geomorphic map would have to be reconsidered) andconsequently are difficult to be discerned separately or the ob-tained ages are biased due to an exhumation of the boulders overtime. Both possibilities are likely d however, the likelihood ofboulder exhumation is in this permafrost-overprinted regionhigher (and thus, the measured ages too young). The height of theboulders (30e40 cm) was unfortunately very low and, conse-quently, disturbances may have occurred.
4.3. Palaeoclimate-modelling and ELA reconstructions
During the maximal stage, the total area of glacier cover of themassif was 516 km2. The maximum advance of the glaciers
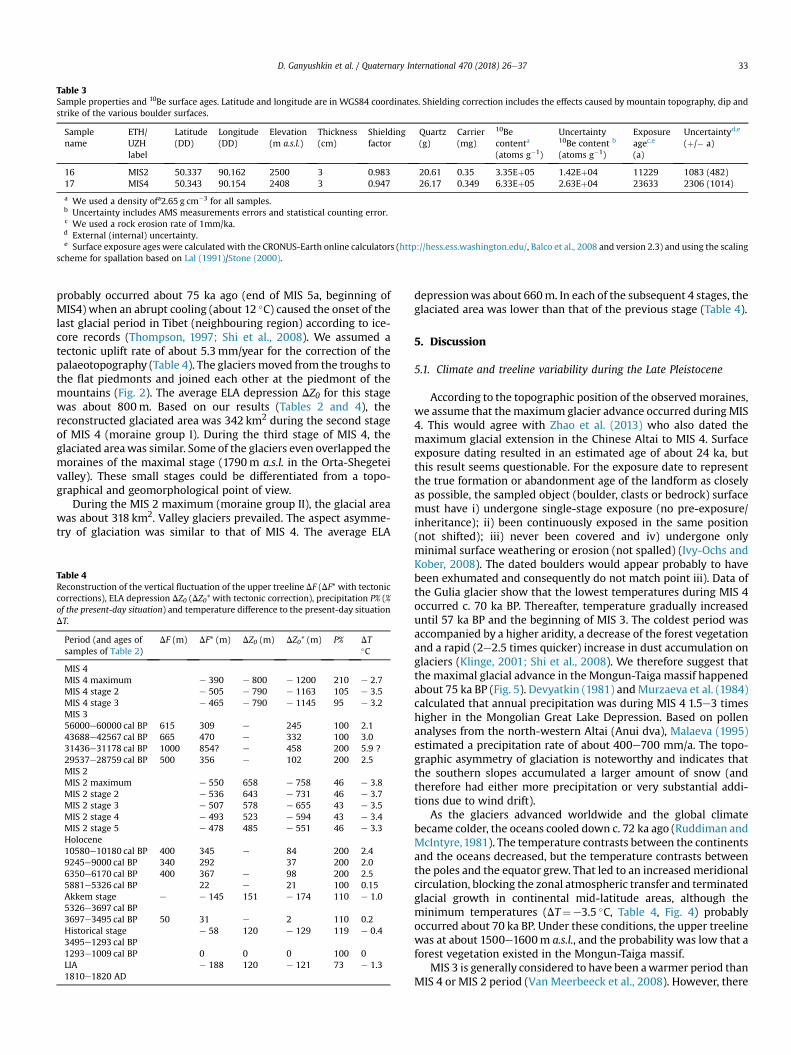
Table 3Sample properties and 10Be surface ages. Latitude and longitude are in WGS84 coordinates. Shielding correction includes the effects caused by mountain topography, dip andstrike of the various boulder surfaces.
Samplename
ETH/UZHlabel
Latitude(DD)
Longitude(DD)
Elevation(m a.s.l.)
Thickness(cm)
Shieldingfactor
Quartz(g)
Carrier(mg)
10Becontenta
(atoms g�1)
Uncertainty10Be content b
(atoms g�1)
Exposureagec,e
(a)
Uncertaintyd,e
(þ/� a)
16 MIS2 50.337 90.162 2500 3 0.983 20.61 0.35 3.35Eþ05 1.42Eþ04 11229 1083 (482)17 MIS4 50.343 90.154 2408 3 0.947 26.17 0.349 6.33Eþ05 2.63Eþ04 23633 2306 (1014)
a We used a density ofa2.65 g cm�3 for all samples.b Uncertainty includes AMS measurements errors and statistical counting error.c We used a rock erosion rate of 1mm/ka.d External (internal) uncertainty.e Surface exposure ages were calculated with the CRONUS-Earth online calculators (http://hess.ess.washington.edu/, Balco et al., 2008 and version 2.3) and using the scaling
scheme for spallation based on Lal (1991)/Stone (2000).
D. Ganyushkin et al. / Quaternary International 470 (2018) 26e37 33
probably occurred about 75 ka ago (end of MIS 5a, beginning ofMIS4) when an abrupt cooling (about 12 �C) caused the onset of thelast glacial period in Tibet (neighbouring region) according to ice-core records (Thompson, 1997; Shi et al., 2008). We assumed atectonic uplift rate of about 5.3mm/year for the correction of thepalaeotopography (Table 4). The glaciers moved from the troughs tothe flat piedmonts and joined each other at the piedmont of themountains (Fig. 2). The average ELA depression DZ0 for this stagewas about 800m. Based on our results (Tables 2 and 4), thereconstructed glaciated area was 342 km2 during the second stageof MIS 4 (moraine group I). During the third stage of MIS 4, theglaciated areawas similar. Some of the glaciers even overlapped themoraines of the maximal stage (1790m a.s.l. in the Orta-Shegeteivalley). These small stages could be differentiated from a topo-graphical and geomorphological point of view.
During the MIS 2 maximum (moraine group II), the glacial areawas about 318 km2. Valley glaciers prevailed. The aspect asymme-try of glaciation was similar to that of MIS 4. The average ELA
Table 4Reconstruction of the vertical fluctuation of the upper treeline DF (DF* with tectoniccorrections), ELA depression DZ0 (DZ0* with tectonic correction), precipitation P% (%of the present-day situation) and temperature difference to the present-day situationDT.
Period (and ages ofsamples of Table 2)
DF (m) DF* (m) DZ0 (m) DZ0* (m) P% DT�C
MIS 4MIS 4 maximum e 390 e 800 e 1200 210 e 2.7MIS 4 stage 2 e 505 e 790 e 1163 105 e 3.5MIS 4 stage 3 e 465 e 790 e 1145 95 e 3.2MIS 356000e60000 cal BP 615 309 e 245 100 2.143688e42567 cal BP 665 470 e 332 100 3.031436e31178 cal BP 1000 854? e 458 200 5.9 ?29537e28759 cal BP 500 356 e 102 200 2.5MIS 2MIS 2 maximum e 550 658 e 758 46 e 3.8MIS 2 stage 2 e 536 643 e 731 46 e 3.7MIS 2 stage 3 e 507 578 e 655 43 e 3.5MIS 2 stage 4 e 493 523 e 594 43 e 3.4MIS 2 stage 5 e 478 485 e 551 46 e 3.3Holocene10580e10180 cal BP 400 345 e 84 200 2.49245e9000 cal BP 340 292 37 200 2.06350e6170 cal BP 400 367 e 98 200 2.55881e5326 cal BP 22 e 21 100 0.15Akkem stage5326e3697 cal BP
e e 145 151 e 174 110 e 1.0
3697e3495 cal BP 50 31 e 2 110 0.2Historical stage3495e1293 cal BP
e 58 120 e 129 119 e 0.4
1293e1009 cal BP 0 0 0 100 0LIA1810e1820 AD
e 188 120 e 121 73 e 1.3
depressionwas about 660m. In each of the subsequent 4 stages, theglaciated area was lower than that of the previous stage (Table 4).
5. Discussion
5.1. Climate and treeline variability during the Late Pleistocene
According to the topographic position of the observed moraines,we assume that the maximum glacier advance occurred during MIS4. This would agree with Zhao et al. (2013) who also dated themaximum glacial extension in the Chinese Altai to MIS 4. Surfaceexposure dating resulted in an estimated age of about 24 ka, butthis result seems questionable. For the exposure date to representthe true formation or abandonment age of the landform as closelyas possible, the sampled object (boulder, clasts or bedrock) surfacemust have i) undergone single-stage exposure (no pre-exposure/inheritance); ii) been continuously exposed in the same position(not shifted); iii) never been covered and iv) undergone onlyminimal surface weathering or erosion (not spalled) (Ivy-Ochs andKober, 2008). The dated boulders would appear probably to havebeen exhumated and consequently do not match point iii). Data ofthe Gulia glacier show that the lowest temperatures during MIS 4occurred c. 70 ka BP. Thereafter, temperature gradually increaseduntil 57 ka BP and the beginning of MIS 3. The coldest period wasaccompanied by a higher aridity, a decrease of the forest vegetationand a rapid (2e2.5 times quicker) increase in dust accumulation onglaciers (Klinge, 2001; Shi et al., 2008). We therefore suggest thatthe maximal glacial advance in the Mongun-Taiga massif happenedabout 75 ka BP (Fig. 5). Devyatkin (1981) andMurzaeva et al. (1984)calculated that annual precipitation was during MIS 4 1.5e3 timeshigher in the Mongolian Great Lake Depression. Based on pollenanalyses from the north-western Altai (Anui dva), Malaeva (1995)estimated a precipitation rate of about 400e700 mm/a. The topo-graphic asymmetry of glaciation is noteworthy and indicates thatthe southern slopes accumulated a larger amount of snow (andtherefore had either more precipitation or very substantial addi-tions due to wind drift).
As the glaciers advanced worldwide and the global climatebecame colder, the oceans cooled down c. 72 ka ago (Ruddiman andMcIntyre,1981). The temperature contrasts between the continentsand the oceans decreased, but the temperature contrasts betweenthe poles and the equator grew. That led to an increased meridionalcirculation, blocking the zonal atmospheric transfer and terminatedglacial growth in continental mid-latitude areas, although theminimum temperatures (DT¼e3.5 �C, Table 4, Fig. 4) probablyoccurred about 70 ka BP. Under these conditions, the upper treelinewas at about 1500e1600m a.s.l., and the probability was low that aforest vegetation existed in the Mongun-Taiga massif.
MIS 3 is generally considered to have been awarmer period thanMIS 4 or MIS 2 period (Van Meerbeeck et al., 2008). However, there

Fig. 5. Reconstruction of temperature fluctuations, precipitation, ELA and the elevation of the upper treeline (with corrections for tectonic uplift). Red line: temperature, relative tothe present-day climate DT* (�C); Blue line: precipitation at the current ELA, P (mm); Green line: upper treeline, DF* (m) (relative to present-day elevation); Black line: ELA, DZ0* (m)relative to present-day level. (For interpretation of the references to colour in this figure legend, the reader is referred to the Web version of this article.)
D. Ganyushkin et al. / Quaternary International 470 (2018) 26e3734
is evidence of some considerable climatic fluctuations within theMIS 3 (Shi et al., 2008). According to our reconstruction for theinterval of about 58e43.5 ka BP, DT in the Mongun-Taiga massifreached þ2.1 to þ3.0 �C (Table 4). This is in agreement with thereconstructions of the Gulia glacial kerns in Tibet (Shi et al., 2008),according to which the early MIS 3 (60e54 ka BP) was about 3�Сwarmer than today. Nonetheless, some glacier advances alsooccurred during MIS 3: e.g., in the Northern and Eastern Tibet(between 41 and 49 ka ago; Lehmkuhl and Liu, 1994). In theKhangai mountains the MIS 3 glacial advance (40e35 ka ago) iseven considered as the largest (Rother et al., 2014). Also for the Altairegion, the situation does not seem that clear. In the Kanan basin,the same moraines for a maximum glacier advance gave differingages (Xu et al., 2009). It is, therefore, unclear if a further glacialadvance occurred in the Mongun-Taiga massif in MIS 3. Severalfinds of ancient wood indicate a rather warmer climate. Wetherefore suggest that if any glacier advance took place, then it ismore likely that it took place during the interval 43.5e27 ka agoand was less distinct than the MIS 4 and MIS 2 advances (Fig. 5).
There are no palaeoecological reconstructions that allow anestimation of the precipitation rates in theMongun-Taigamassif forthe period 58e43.5 ka BP. If precipitation was less than today, afurther expansion of forest in that period seems unlikely. Thethermic contrasts between the poles and the equator in that periodwere similar when compared to the present-day situation (Serginand Sergin, 1978). The reconstructed DZ0 for the time interval58e43.5 ka BP (245e332m; Table 4) was not large enough tosuggest that the glaciers of the Mongun-Taiga massif disappearedcompletely. The climate during the MIS 3a stage in Tibet and north-western China was 2e4�С warmer than today with a precipitationrate of 40e100% that of the present-day (Shi et al., 2008). The findsof buriedwood having an age 25e27 ka in theMongun-Taigamassif(Revushkin, 1974) indicate that there were warm and moist con-ditions just before the onset of the MIS 2 glaciation. However, thealtitude of the first sample (3300m a.s.l.), that has a14C age of27.5± 0.180 ka BP is doubtful. The place of sampling was describedas a moraine ridge of one of the latest glacial advances on the leftside of the outlets of the Mugur river; but in fact all moraines thereare located several hundred metres lower. Therefore, this find
indicates warm conditions, but the reconstructed palae-otemperatures are not particularly reliable. The altitude of thesecond find (29537e28759 cal BP) at 2800m a.s.l. seems morereliable. Consequently, the palaeo-reconstructions are based on thissample. We calculated for that period a doubling of the annualprecipitation which is in agreement with reconstructions ofMurzaeva et al. (1984) and Malaeva (1995) for the Mongolian GreatLakes depression. Under such conditions the reconstructed DZ0 isonly about 100m and the glacial cover would have been onlyslightly smaller than today.
The minimum summer insolation for 45� N was reached about24e22 ka ago (Clark et al., 2009). The exact timing of the maximalglacier advance is large and varies fromabout 13 ka (Okishev, 2011) to28e19 kaBP (Lehmkuhl et al., 2007). In southern Siberia, the summertemperatures during the LGM were about 4�С lower than today(Borzenkova, 1992) and in Tibet about 5�С lower (Shi et al., 2008).Okishev (2011) calculateda decrease in summer temperature of 3.8�Сwhich agrees with our estimation of DT¼e 3.8�С (Table 4).Sheinkman (2011) assumed that the glaciation in the Siberianmountains was mainly caused by cooling, because the ice sheets ofnorth-western Eurasia intercepted the Atlantic moisture. The altitu-dinal shift of the ELAvaries in literature frome 1200m (Butvilovskiy,1993) to e 610m (Okishev, 2011) owing to different palaeoglacialreconstructions. Our calculations of DZ0 for the MIS 2 maximum (e658m) and the information about the increased aridity in the Mon-golian Great Lakes basin let us assume that during themaximumandpostmaximal stages ofMIS 2precipitation decreased (the calculated Pvalues are in the range 43e46%; Table 4). The cooling was most pro-nounced (e3.8 �C) in theLatePleistocene (MIS2maximum,Table4). Ifwe assume a MIS 2 age of the LGM (assuming that the 10Be data arecorrect) then the calculated aridity and cooling would be even moredistinct with 37% and e 4.2 �C, respectively.
5.2. Climate and treeline variability during the Holocene
The discovered Pinus Sibirica trees trunks of the Vostotschniy(East) Mugur valley in the Mongun-Taiga massif at an altitude of2700m have an age of 10180e10580 cal BP (SОAN 8116) and6170e6350 cal BP (SОАN- 8117; Nazarov et al., 2012, Table 2).
D. Ganyushkin et al. / Quaternary International 470 (2018) 26e37 35
Nowadays, the nearest Pinus Sibirica stands are located150e200 km to thewest and 100 km to the north of the finding site.This indicates that the amount of precipitation was higher thantoday and would agree with the findings of Blyakharchuk (2008).Our find of an ancient wood having an age of 9245e9000 cal BP(Table 2) in the same valley at an altitude of 2640m a.s.l. refers tothe same warm and moist period. This is in agreement with find-ings of other alpine areas such as the European Alps where thetreeline was higher between about 10 and 4 ka BP mostly due to awarmer climate (K€orner, 2012). The reconstructed DT values(2.0e2.4 �С), the doubling of precipitations (Table 4) and a 37e84mrise of the ELA indicate that the reconstructed area of glaciationwasonly 1e2 km2 smaller than today. Warmer and moister conditionsthan today are indicated by a find of wood (Pinus Sibirica) having anage of 6170e6350 cal BP (Table 2) that was discovered about 400mhigher than the present-day treeline (Nazarov et al., 2012). Incontrast to this, drier conditions d leading to a forest decline(Rudaya et al., 2009) d were reconstructed for Mongolia between7.11 and 4.39 ka (Peck et al., 2002) and in the Uvs Nuur depression(about 5 ka ago; Dorofeyuk and Tarasov, 1998; Grunert et al., 2000).For themid-Holocene,DT is estimated from2 �C (Borzenkova,1984)to 0.5 �C (Velichko et al., 2009) in south-western to north-westernSiberia and in the Altai. This matches well with our reconstructions.Charcoal finds (5445e5054 cal BP; Table 2) above the present-daytreeline and a buried soil as a result of the first neoglacialadvance (5881e5326 cal BP; Table 2) point to this warm period. Wecannot exclude the possibility of a complete deglaciation of themassif during the late MIS 2 and early Holocene, although we haveno evidence for this. A complete deglaciation seems to haveoccurred in theMongolian Altai about 6 ka ago (Herren et al., 2013).
During the late Holocene, three glacial advances are usuallydistinguished in the Russian Altai: the Akkem stage, the ‘Historicalstage’ and the Aktru stage (¼ LIA), which are considered either asphases of the Last Glacial Epoch (Okishev, 2011) or as advances ofglaciers that regenerated after the Holocene thermal optimum(Neoglacial; (Solomina, 1999; Agatova et al., 2012). The Akkemstage is dated to 4.3e4.0 ka BP (Galakhov et al., 2005), 4.4 ka BP(Okishev, 2011) and 4.9e4.2 cal BP (Agatova et al., 2012). This is ingeneral agreement with our findings. According to our 14C dating(Table 2), a Neoglacial advance seemed to have occurred between5.9 and 3.7 cal BP. The reconstructed average of DZ0¼e 151m andDZ0* ¼ e 174 m do, however, not agree with Okishev (2011) whocalculated 250e290m for the different areas of the Russian Altai.This may be due to the different methods used. The approach usedby Okishev (2011) may produce better results for valley glaciers butnot for smaller cirque glaciers and flat-summit glaciers.
Most studies noted a change from arid to moister conditions atthe transition from the Middle Holocene to the Neoglacial. Ac-cording to Peck et al. (2002) the severest arid conditions in NorthCentral Mongolia were between 7110 and 6260 cal BP, less aridconditions between 6260 and 4390 cal BP, generally humid condi-tions after 4390 cal BP that was then followed by a more humidclimate of 2710e1260 cal BP than today. In the Minusinsk and theUyuk depressions in northern Tuva (Dirksen and van Geel, 2004)the climate became more humid 4e3 ka BP. About 3 ka BP annualprecipitation increased under relatively cold conditions (until 1.6 kaBP). A moderately comparable trend was detected in the Uvs Nuurdepression by Dorofeyuk and Tarasov (1998) and Grunert et al.(2000). Based on the temperature decrease (DT¼e 1 �C), we ob-tained a precipitation rate that slightly exceeds the present-daysituation (P¼ 110%). This agrees well with the increase in humidi-ty after the mid-Holocene for the studied region. According toAgatova et al. (2012), a cooling and a minor glacial advance be-tween 3.7 and 3.3 ka BP may have occurred but we did not find anytraces in the Mongun-Taiga that would confirm this.
The dated burials of soils (3141e2776 and 1293e1089; Table 2)are in relatively good agreement with the suggested advances atabout 2500e3100 (Galakhov et al., 2012) and around about1700e1800 years ago (Agatova et al., 2012; Galakhov et al., 2012).According to Okishev (2011), DZ0 was 145e190m for this Historicalstage, which slightly exceeds our results (120m). Okishev (2011)calculated a DT of e 1 �C and Galakhov et al. (2005) a DT of e
0.4 �C. When using the value e 0.4 �C in our modelling, we obtainan increased precipitation (119%) which agrees well with the UvsNuur transgression at that period (Dorofeyuk and Tarasov, 1998;Grunert et al., 2000).
The last glacier advance in the Altai, the LIA or Aktry stage,occurred between the 13th and the 19th century. Themaximum LIAglacial advance in the Altai seems to have happened between the17th and mid-19th century (Ivanovskiy and Panychev, 1978;Ivanovskiy et al., 1982; Ovchinnikov et al., 2002; Okishev, 2011;Nazarov et al., 2016). According to tree-ring measurements andrelated climatic reconstructions (Myglan et al., 2012) the lowestsummer temperatures in the Mongun-Taiga massif were deter-mined for the period 1788e1819. Based on dendrochronologicalreconstructions (Ganiushkin et al., 2015), the maximum glacialadvance took place at the beginning of the 19th century and theglaciers started to retreat after about 1810e1820 AD. Okishev(2011) gives for the Russian Altai an average DZ0 value of 70m.Lehmkuhl (2012) obtained for the Turgen and Kharkhiraa massifs(Mongolia) a reconstructed DELA of 81 and 76m, respectively.During the last millennia, the treeline position did not changedistinctly (Kharuk et al., 2010) because the oscillation of climatewas not that strong and treeline position always lags behind cli-matic change by at least 50, and possibly up to more than 100 years(K€orner, 2012).
The reconstructed DT values for the LIA maximum in the Altaiare e 2 to e 2.5 �C (Adamenko, 1985), e 0.4 �C (Okishev, 2011) ande 0.8 to e 0.9 �C (Okishev, 1985). Summer temperature (June, July)did not seem to have fluctuated that much but winter and meanannual temperatures strongly increased since the LIA in the Altai(Schwikowski et al., 2009). According to Ganiushkin et al., 2015, theclimate of the Mongun-Taiga massif was relatively cold and dryduring the LIA maximum (DT¼e 1.3 �C, P¼ 73%). This value cor-relates well with data from Barnaul, the longest-running meteo-rological station in the Altai region.
6. Conclusions
Using published and our new data, a chronology of glaciationand the reconstruction of climatic fluctuations in the Mongun Taiga(Altai) was rendered possible for the about the last about 80 ka. Wedetermined high amplitudes of climatic, glacial and treelinechanges. The variability (compared to the present-day climate) ofsummer temperatures ranged from e 3.8 (e 4.2) to þ 3.0 �C, pre-cipitation from 43 (37) to 200%, the ELA from e 1200 to 460 m andthe upper treeline from e 550 to 470 m. The amount of precipita-tionwas themain factor that determined the timing of themaximalglacial advance in Late Pleistocene. It seems that theMIS 3c andMIS3a stages were extraordinarily warm. The distinctly elevated tree-line during that time evidences that the glaciers retreated toprobably high altitudes and covered only a small area. Themaximum glacier extent was probably during MIS 4. There is noevidence of a complete disappearance of the glaciers even in thewarmest periods of the Late Pleistocene. The precise dating of theLGM, however, still remains open and additional 10Be dates (onsuitable boulders) are needed. During several periods, forestvegetation occupied larger areas than today. The actual tendency ofwarming and increase in precipitation after the LIA maximumprobably will lead to a wider expansion of forests.
D. Ganyushkin et al. / Quaternary International 470 (2018) 26e3736
Acknowledgements
This work was supported by the Saint-Petersburg state Univer-sity [grant number 18.38.418.2015], the Russian Foundation forBasic Research [grant number 15-05-06611], the All-Russian PublicOrganization ‘Russian Geographical Society’ within the frameworkof the scientific project No. 08/2016-I , by a grant of the Scientific &Technological Cooperation Programme Switzerland-Russia (Uni-versity of Geneva, nr. 37061135) and Gerald Raab was supported bythe Swiss National Science Foundation (SNSF), project grant no.200021_162338/1. We are, furthermore, indebted to two unknownreviewers for their helpful comments on an earlier version of themanuscript.
References
Adamenko, M.F., 1985. Reconstruction of Summer Temperature Variability andGlacier Dynamics in the Gorniy Altai for Period 14the20th Centuries. Ph.D.thesis. Press of SBRAS Institute of Geology and Geophysics, Novosibirsk,USSR (inRussian).
Agatova, A.R., Nepop, R.K., Khazina, I.V., Khazin, L.B., 2009. The possibility of the tiecorrelation of Gorny Altai glaciations to SPECMAP time scale and south Siberiaglaciations. In: VI All-Russian Meeting on the Study of the Quaternary Period,pp. 18e20.
Agatova, A.R., Nazarov, A.N., Nepop, R.K., Rodnight, H., 2012. Holocene glacierfluctuations and climate changes in the southeastern part of the Russian Altai(South Siberia) based on a radiocarbon chronology. Quat. Sci. Rev. 43, 74e93.https://doi.org/10.1016/j.quascirev.2012.04.012.
Agatova, A.R., Nepop, R.K., Slyusarenko, I.Yu, Myglan, V.S., Nazarow, A.N.,Barinov, V.V., 2014. Glacier dynamics, palaeohydrological changes and seis-micity in southeastern Altai (Russia) and their influence on human occupationduring the last 3000 years. Quat. Int. 324, 6e19.
Agatova, A.R., Nepop, R.K., 2017. Pleistocene glaciations of the SE Altai, Russia, basedon geomorphological data and absolute dating of glacial deposits in Chaganreference section. Geochronometria 44, 49e65. https://doi.org/10.1515/geochr-2015-0059.
Arslanov, K.H.A., Tertychnaya, T.V., Chernov, S.B., 1993. Problems and methods ofdating low-activity samples by liquid scintillation counting. Radiocarbon 35,393e398.
Balco, G., Stone, J.O., Lifton, N.A., Dunai, T.J., 2008. A complete and easily accessiblemeans of calculating surface exposure ages or erosion rates from 10Be and 26Almeasurements. Quat. Geochronol. 3, 174e195. https://doi.org/10.1016/j.quageo.2007.12.001.
Blyakharchuk, T.A., 2008. Reconstructing the vegetation of forest and alpine-steppelandscapes in the southwestern part of Tuva since the late glacial period till thepresent. Geogr. Nat. Resour. 29, 57e62.
B€ohlert, R., Egli, M., Maisch, M., Brandov�a, D., Ivy-Ochs, S., Kubik, P.W., Haeberli, W.,2011. Application of a combination of dating techniques to reconstruct thelateglacial and early Holocene landscape history of the Albula region (easternSwitzerland). Geomorphology 127, 1e13.
Borchers, B., Marrero, S., Balco, G., Caffee, M., Goehring, B., Lifton, N., Nishiizumi, K.,Phillips, F., Schaefer, J., Stone, J., 2016. Geological calibration of spallation pro-duction rates in the CRONUS-Earth. Quat. Geochronol. 31, 188e198.
Borisov, B.A., Minina, E.A., 1989. Plejstocenovye oledenenija Altae-Sajanskoj gornojstrany i ih korreljacija i rekonstrukcii. In: Paleoklimaty I Oledenenija v Plej-stocene. Nauka, Moscow, pp. 217e223.
Borzenkova, I.I., 1984. The climate optimum of the Holocene as a model of thebeginning of the 21st century. Meteorol. i Gidrol 8, 69e77 (in Russian).
Borzenkova, I.I., 1992. Izmenenie klimata v kajnozoe. Hydrometeoizdat, Saint-Petersburg.
Bronk Ramsey, C., 2001. Development of the radiocarbon calibration program.Radiocarbon 43, 355e363.
Bronk Ramsey, C., 2009. Bayesian analysis of radiocarbon dates. Radiocarbon 51,337e360.
Brown, E.T., Edmond, J.M., Raisbeck, G.M., Yiou, F., Desgarceaux, S., 1992. Effectiveattenuation length of cosmic rays producing 10Be and 26Al in quartz: implica-tions for surface exposure dating. Geophys. Res. Lett. 9, 369e372.
Butvilovskiy, V.V., 1993. Paleogeografiya poslednego oledenenija i holozena Altaja:sobytiyno-katastroficheskaja model’. T.U., Tomsk.
Chistyakov, K.V., Ganyushkin, D.A., Moskalenko, I.G., Zelepukina, E.S., Amosov, M.I.,Volkov, I.V., Glebova, A.B., Guzjel, N.I., Zhuravlev, S.A., Prudnikova, T.N.,Prjahina, G.V., 2012. Gornyj massiv Mongun-Tajga. V.V.M., Saint-Petersburg.
Christl, M., Vockenhuber, P.W., Kubik, P.W., Wacker, L., Lachner, J., Alfimov, V.,Synal, H.-A., 2013. The ETH Zurich AMS facilities: performance parameters andreference materials. Nucl. Instrum. Meth. Phys. Res. B 294, 29e38.
Clark, P.U., Clark, P.U., Dyke, A.S., Shakun, J.D., Carlson, A.E., Clark, J., Wohlfarth, B.,Mitrovica, J.X., Hostetler, S.W., Mccabe, A.M., 2009. The last glacial maximum.Science 325, 710e714. https://doi.org/10.1126/science.1172873.
Devyatkin, E., 1965. Cenozoic deposits and neotectonics of southeastern Altai. Proc.GIN AN SSSR 126, 244.
Devyatkin, E.V., 1981. The Cenozoic of Inner Asia (In Russian) (Publ. H. Nauka,Moscow).
Dirksen, V.G., van Geel, B., 2004. Mid to late Holocene climate change and its in-fluence on cultural development in South Central Siberia. In: Scott, E.M.,Alekseev, A.Y., Zaitseva, G. (Eds.), Impact of the Environment on HumanMigration in Eurasia. NATO Science Series, IV. Earth and Environmental Sci-ences 42, pp. 159e183.
Dorofeyuk, N.I., Tarasov, P.E., 1998. Vegetation and lake levels in Northern Mongoliain the last 12,500 years as indicated by data of pollen and diatom analysis.Stratigr. Geol. Correl. 70e83.
Galakhov, V.P., Nazarov, A.N., Kharlamova, N.F., 2005. Kolebanija lednikov i izme-nenija klimata v pozdnem golocene po materialam issledovanij lednikov ilednikovyh otlozhenij bassejna Aktru (Central’nyj Altaj, Severo-Chujskij hrebet).izdatel’stvo Altajskogo universiteta, Barnaul.
Galakhov, V.P., Chernykh, D.V., Zolotov, D.V., Orlova, L.A., 2012. Polozhenie i vremjaformirovanija moren stadij fernau i istoricheskoj v bassejne reki Hajdun naAltae. Izv. Rus. Geogr. Obshchestva 144, 15e21.
Ganiushkin, D., Chistyakov, K., Kunaeva, E., 2015. Fluctuation of glaciers in thesoutheast Russian Altai and northwest Mongolia mountains since the Little iceage maximum. Environ. Earth Sci. 74, 1883e1904. https://doi.org/10.1007/s12665-015-4301-2.
Ganyushkin, D.A., 2015. Gljaciogennye kompleksy rezkokontinental’nogo rajonasevero-zapada Vnutrennej Azii. Glacigenic complexes of sharply continentalarea of North-west Inner Asia. Saint-Petersburg state university, Saint-Petersburg.
Glazyrin, G.E., 1985. Raspredelenie i rezhim gornyh lednikov. Hydrometeoizdat,Leningrad.
Gosse, J.C., Phillips, F.M., 2001. Terrestrial in situ produced cosmogenic nuclides:theory and application. Quat. Sci. Rev. 20, 1475e1560.
Goudie, A.S., 2006. The Schmidt Hammer in geomorphologlical research. Prog. Phys.Geogr. 30, 703e718. https://doi.org/10.1177/0309133306071954.
Gribenski, N., Jansson, K.N., Lukas, S., Stroeven, A.P., Harbor, J.M., Blomdin, R.,Ivanov, M.N., Heyman, J., Petrakov, D.A., Rudoy, A., Clifton, T., Lifton, N.A.,Caffee, M.W., 2016. Complex patterns of glacier advances during the late glacialin the Chagan Uzun valley, Russian Altai. Quat. Sci. Rev. 149, 288e305. https://doi.org/10.1016/j.quascirev.2016.07.032.
Grunert, J., Lehmkuhl, F., Walther, M., 2000. Paleoclimatic evolution of the Uvs Nuurbasin and adjacent areas (Western Mongolia). Quat. Int. 65e66, 171e192.https://doi.org/10.1016/S1040-6182(99)00043-9.
Herget, J., Carling, P., Agatova, A., Batbaatar, J., Borodavko, P., Gillespie, A., Nepop, R.,2017. Comment on Gribenski, N. et al., 2016. Complex patterns of glacier ad-vances during the late glacial in the Chagan Uzun Valley, Russian Altai. Qua-ternary Science Reviews 149, 288e305. Quat. Sci. Rev. 168, 216e219. https://doi.org/10.1016/j.quascirev.2017.04.014.
Herren, P.A., Eichler, A., Machguth, H., Papina, T., Tobler, L., Zapf, A.,Schwikowski, M., 2013. The onset of Neoglaciation 6000 years ago in westernMongolia revealed by an ice core from the Tsambagarav mountain range. Quat.Sci. Rev. 69, 59e68. https://doi.org/10.1016/j.quascirev.2013.02.025.
IACS, 2011. Glossary of glacier mass balance and related terms. Int. Hydrol. Program.Unit. Nations Educ. Sci. Cult. Organ 86, 114.
Ivanovskiy, L.N., Panychev, V.A., 1978. Razvitie i vozrast konechnyh morenXVIIdXIX vv. lednikov Ak-Turu na Altae. In: Processy Sovremennogo Rel’e-foobrazovanija v Sibiri. Nauka, Irkutsk, pp. 127e138.
Ivanovskiy, L.N., Panychev, V.A., Orlova, L.A., 1982. Vozrast konechnyh moren stadij«Aktru» i «Istoricheskoj» lednikov Altaja. In: Pozdnij Plejstocen I Golocen JugaVostochnoj Sibiri. Nauka, Novosibirsk, pp. 57e64.
Ivy-Ochs, S., Kober, F., 2008. Surface exposure dating with cosmogenic nuclides.Quat. Sci. J. 57, 157e189.
Kharuk, V.I., Im, S.T., Dvinskaya, M.L., Ranson, K.J., 2010. Climate-induced mountaintree-line evolution in southern Siberia. Scand. J. For. Res. 25, 446e454.
Klinge, M., 2001. Glacial-geomorphologic Investigations in the Mongolian Altai: aContribution to the Late Quaternary Landscape and Climate History of WesternMongolia (Aachener Geographische Arbeiten, Aachen).
K€orner, C., 2012. Alpine Treelines. Functional Ecology of the Global High ElevationTree Limits. Springer, Basel.
Korschinek, G., Bergmaier, A., Faestermann, T., Gerstmann, U.C., Remmert, A., 2010.A new value for the half-life of 10Be by heavy-ion elastic recoil detection andliquid scintillation counting. Nucl. Instrum. Methods Phys. Res. Sect. B BeamInteract. Mater. Atoms 268, 187e191.
Kurowsky, L., 1891. Die Hohe der Schneegrenze mit besonderer Berucksichtigungder Finsteraargorngruppe. Pencks Geogr. Abhandlungen 5, 115e160 (inGerman).
Kubik, P.W., Christl, M., 2010. 10Be and 26Al measurements at the Zurich 6 MVTandem AMS facility. Nucl. Instrum. Meth. B 268, 880e883.
Lal, D., 1991. Cosmic ray labeling of erosion surfaces: in situ nuclide production ratesand erosion models. Earth Planet Sci. Lett. 104, 424e439.
Lehmkuhl, F., 2012. Holocene glaciers in the Mongolian Altai: an example from theTurgen-Kharkhiraa Mountains. J. Asian Earth Sci. 52, 12e20. https://doi.org/10.1016/j.jseaes.2011.11.027.
Lehmkuhl, F., Liu, S., 1994. An outline of physical geography including Pleistoceneglacial landforms of Eastern Tibet (provinces Sichuan and Qinghai). Geojournal34, 7e30. https://doi.org/10.1007/BF00813966.
Lehmkuhl, F., Zander, A., Frechen, M., 2007. Luminescence chronology of fluvial andaeolian deposits in the Russian Altai (Southern Siberia). Quat. Geochronol. 2,195e201. https://doi.org/10.1016/j.quageo.2006.04.005.

D. Ganyushkin et al. / Quaternary International 470 (2018) 26e37 37
Lehmkuhl, F., Klinge, M., Rother, H., Hülle, D., 2016. Distribution and timing ofHolocene and Late Pleistocene glacier fluctuations in western Mongolia. Ann.Glaciol. 57, 169e178.
Malaeva, E.M., 1995. Ob izmenchivosti klimaticheskogo rezhima Gornogo Altaja vpozdnem plejstocene i paleogljaciologicheskih rekonstrukcijah. Geomorfologija51e60.
Masarik, J., Frank, M., Schaefer, J.M., Wieler, R., 2001. Correction of in-situ cosmo-genic nuclide production rates for geomagnetic field intensity variations duringthe past 800,000 years. Geochem. Cosmochim. Acta 65, 2995e3003.
Matthews, J.A., Shakesby, R.A., 1984. The status of the ‘Little Ice Age’ in southernNorway: relative age dating of Neoglacial moraines with Schmidt hammer andlichenometry. Boreas 13, 333e346. https://doi.org/10.1111/j.1502-3885.1984.tb01128.x.
Mihaelis, E.P., 1886. An ice-period in Altai mountains. Nature 35, 149.Murzaeva, V.E., Konopleva, V.I., Devyatkin, E.V., Serebrjanyj, L.R., 1984. Pljuvial’nye
obstanovki pozdnego plejstocena i golocena v aridnoj zone Azii i Afriki. Izv. ANSSSR, Ser. Geogr. 15e25.
Myglan, V.S., Oidupaa, O.C., Vaganov, E.A., 2012. A 2367-year tree-ring chronologyfor the Altay-Sayan region (Mongun-Taiga mountain massif). Archaeol. Ethnol.Anthropol. Eurasia 40, 76e83.
Nazarov, A.N., Myglan, V.S., Orlova, L.A., Ovchinnikov, I.Y., 2016. Aktivnost’ lednikaMalyj Aktru (Central’nyj Altaj) i izmenenija granicy lesa v bassejne Aktru zaistoricheskij period. Led i sneg 56, 103e118.
Nazarov, A.N., Solomina, O.N., Myglan, V.S., 2012. Dinamika verhnej granicy lesa ilednikov Central’nogo i Vostochnogo Altaja v golocene. Dokl. Akad. Nauk 444,1e5.
Nishiizumi, K., Imamura, M., Caffee, M.W., Southon, J.R., Finkel, R.C., McAninch, J.,2007. Absolute calibration of 10Be AMS standards. Nucl. Instrum. Meth. B 258,403e413.
Obruchev, V.A., 1914. Altai Sketches (Sketch First). Notes on the Traces of AncientGlaciation in the Russian Altai. Altajskie jetjudy (jetjud pervyj). Zametki o sle-dah drevnego oledenenija v Russkom Altae. Zemlevedenie, pp. 50e97.
Okishev, P.А., 1982. Dynamics of Altai Glaciation in the Late Pleistocene and Holo-cene. T.U., Tomsk.
Okishev, P.A., 1985. Malyj lednikovyj period na Altae. Mater. gljaciologicheskihIssled 170e174.
Okishev, P.A., 2011. Rel’ef i oledenenie Russkogo Altaja (Izd. Tom. un-ta, Tomsk).Ovchinnikov, D.V., Panyushkina, I.P., Adamenko, M.F., 2002. Millennial larch tree-
ring chronology for Mountain Altai and its use for reconstructing summertemperatures. Geogr. Nat. Resour. 102e108.
Peck, J. a, Khosbayar, P., Fowell, S.J., Pearce, R.B., Ariunbileg, S., Hansen, B.C.S.,Soninkhishig, N., 2002. Mid to Late Holocene climate change in north centralMongolia as recorded in the sediments of Lake Telmen. Palaeogeogr. Palae-oclimatol. Palaeoecol. 183, 135e153. https://doi.org/10.1016/S0031-0182(01)00465-5.
Pettitt, P.B., White, M., 2012. The British Palaeolithic: Human Societies at the Edge ofthe Pleistocene World (Routledge, Abingdon).
Pigati, J.S., Lifton, N.A., 2004. Geomagnetic effects on time-integrated cosmogenicnuclide production with emphasis on in situ 14C and 10Be. Earth Planet Sci. Lett.226, 193e205.
Reimer, P.J., Bard, E., Bayliss, A., Beck, J.W., Blackwell, P.G., Bronk Ramsey, C.,Buck, C.E., Cheng, H., Edwards, R.L., Friedrich, M., Grootes, P.M., Guilderson, T.P.,Haflidason, H., Hajdas, I., Hatt�e, C., Heaton, T.J., Hoffmann, D.L., Hogg, A.G.,Hughen, K.A., Kaiser, K.F., Kromer, B., Manning, S.W., Nui, M., Reimer, R.W.,Richards, D.A., Scott, E.M., Southon, J.R., Staff, A.R.A., Turney, C., van der Plicht, J.,2013. IntCal13 and Marine13 radiocarbon age calibration curves 0e50,000 yearscal BP. Radiocarbon 55, 1869e1887.
Revushkin, A.S., 1974. O nahodke iskopaemoj drevesiny na hrebte Mongun-Tajga(Jugo-Zapadnaja Tuva). Izv. Sib. Otd. AN SSSR serija bil 46e47.
Rother, H., Lehmkuhl, F., Fink, D., Nottebaum, V., 2014. Surface exposure datingreveals MIS-3 glacial maximum in the Khangai Mountains of Mongolia. Quat.Res. 82, 297e308. https://doi.org/10.1016/j.yqres.2014.04.006.
Rudaya, N., Tarasov, P., Dorofeyuk, N., Solovieva, N., Kalugin, I., Andreev, A.,Daryin, A., Diekmann, B., Riedel, F., Tserendash, N., Wagner, M., 2009. Holoceneenvironments and climate in the Mongolian Altai reconstructed from theHoton-Nur pollen and diatom records: a step towards better understandingclimate dynamics in Central Asia. Quat. Sci. Rev. 28, 540e554. https://doi.org/10.1016/j.quascirev.2008.10.013.
Ruddiman, W.F., McIntyre, A., 1981. Oceanic mechanisms for amplification of the23,000-year ice-volume cycle. Science 212, 617e627. https://doi.org/10.1126/science.212.4495.617.
Schmidt, E., 1951. A non-destructive concrete tester. Concrete 59 (8), 34e35.Schwikowski, M., Eichler, A., Kalugin, I., Ovtchinnikov, D., Papina, T., 2009. Past
climate variability in the Altai. PAGES News 17, 44e45.Sergin, V.J., Sergin, S.J., 1978. Sistemnyj analiz programmy bol’shih kolebanij klimata
i oledenenija zemli (Hydrometeoizdat, Leningrad).Shakesby, R.A., Matthews, J.A., Owen, G., 2006. The Schmidt hammer as a relative-
age dating tool and its potential for calibrated-age dating in Holocene glaciatedenvironments. Quat. Sci. Rev. 2846e2867.
Sheinkman, V.S., 2002. Testing the S-S technique of TL dating on the Dead Seasections, its use in the Altai Mountains and palaeogeographic interpretation ofresults. Archeol. Ethnogr. 10, 22e37.
Sheinkman, V.S., 2011. Glaciation in the high mountains of Siberia. In: Ehlers, J.,Gibbard, P.L., Hughes, P.D. (Eds.), Quaternary Glaciations e Extent and Chronol-ogy e a Closer Look. Developments in Quaternary Science, vol. 15, pp. 883e907.
Shi, Y., Huang, M., Yao, T., He, Y., 2008. Glaciers and Related Environments in China.Sience Press, Beijing.
Solomina, O.N., 1999. Gornye ledniki Severnoj Evrazii v Golocene (Nauchnyj mir,Moscow).
Stone, J.O., 2000. Air pressure and cosmogenic isotope production. J. Geophys. Res.105/B10 (23), 753e759.
Svitoch, A.A., Faustov, S.S., 1978. Rezul’taty izuchenija novejshih otlozhenij neko-toryh razrezov Chujskoj vpadiny v svjazi s istoriej oledenenija Gornogo Altaja.In: Sovremennoe I Drevnee Oledenenie Ravninnyh I Gornyh Rajonov SSSR(Sbornik Statej). Izd-vo GO SSSR, pp. 114e124.
Thompson, L.G., 1997. Tropical climate instability: the last glacial cycle from aQinghai-Tibetan ice core. Science 276 (80), 1821e1825. https://doi.org/10.1126/science.276.5320.1821.
Van Meerbeeck, C.J., Renssen, H., Roche, D.M., 2008. How did Marine isotope stage 3and last glacial maximum climates differ? Perspectives from equilibrium simu-lations. Clim. Past Discuss 4, 1115e1158. https://doi.org/10.5194/cpd-4-1115-2008.
Velichko, A.A., Klimanov, V.A., Borzenkova, I., 2009. Klimaticheskie harakteristikigolocena (6000-5500 l.n.) (karty 6e10). In: Paleoklimaty I PaleolandshaftyVnetropicheskogo Prostranstva Severnogo Polusharija. Pozdnij Plejstocen eGolocen. Atlas-monografija. Geos, Moscow, pp. 20e24.
Voelker, A.H.L., Workshop participants, 2002. Global distribution of centennial scalerecords for Marine isotope stage (MIS) 3: a database. Quat. Sci. Rev. 21,1185e1212.
von Blanckenburg, F., Belshaw, N.S., O'Nions, R.K., 1996. Separation of 9Be andcosmogenic 10Be from environmental materials and SIMS isotope dilutionanalysis. Chem. Geol. 129, 93e99.
Xu, X., Yang, J., Dong, G., Wang, L., Miller, L., 2009. OSL dating of glacier extentduring the last glacial and the Kanas lake basin formation in Kanas river valley,Altai mountains, China. Geomorphology 112, 306e317. https://doi.org/10.1016/j.geomorph.2009.06.016.
Zhao, J., Yin, X., Harbor, J.M., Lai, Z., Liu, S., Li, Z., 2013. Quaternary glacial chronologyof the Kanas river valley, Altai mountains, China. Quat. Int. 311, 44e53. https://doi.org/10.1016/j.quaint.2013.07.047.