PAKISTAN HUMANITARIAN AND EARLY RECOVERY … · Provincial Dashboard: Punjab 4. Provincial...
22
PAKISTAN H AND EARLY OVERVIEW 17 March 2011 OCHA Pakistan HUMANITARIAN RECOVERY (HERO) Billi Bierling, OCHA N A 2011
Transcript of PAKISTAN HUMANITARIAN AND EARLY RECOVERY … · Provincial Dashboard: Punjab 4. Provincial...

PAKISTAN HUMANITARIAN
AND EARLY RECOVERY
OVERVIEW (HERO) 17 March 2011
OCHA Pakistan
PAKISTAN HUMANITARIAN
AND EARLY RECOVERY
OVERVIEW (HERO)
Billi Bierling, OCHA 2011
PAKISTAN HUMANITARIAN
Billi Bierling, OCHA 2011

TABLE OF CONTENTS
1. What is the Humanitarian Early Recovery Overview (HERO)?
1.1. Overview
1.2. Components
1.3. Scope
1.4. Approach
1.5. Methodology
2. National Dashboard
2.1. Agriculture Sector Page
2.2. Community Restoration Sector Page
2.3. Education Sector Page
2.4. Shelter Sector Page
2.5. Food Sector Page
2.6. Health Sector Page
2.7. Nutrition Sector Page
2.8. WASH Sector Page
2.9. Protection Sector Page
2.10. CCCM Sector Page
3. Provincial Dashboard: Punjab
4. Provincial Dashboard: Sindh
5. Provincial Dashboard: Khyber Pakhtunkhwa (KPK) and Federally Administered Tribal Areas
(FATA)
OVERVIEW
The Humanitarian and Early Recovery Overview (HERO) is an expanded version of the
Humanitarian Dashboard developed by the Inter Agency Standing Committee (IASC) Needs
Assessment Task Force (NATF). Its aim is to provide a concise yet comprehensive overview of
humanitarian and early recovery needs, coverage and gaps across clusters/sectors. It allows the
Humanitarian Country Teams and other actors to track progress, identify information gaps and
maintain a consistent and agreed overview of humanitarian and early recovery situations.
COMPONENTS
The HERO affords a snapshot of the Pakistan humanitarian and early recovery situation as of 28
February 2011. Included in this document are components providing information at the national
level (for floods-affected areas), with additional chapters which allow for the reader to ‘drill
down’ to the provincial level. This approach is a response to feedback identified by field actors in
Pakistan and is intended to maximize the utility of the HERO at both the headquarters level to
inform policy discussions, and the field to inform operational decision-making as well as policy
discussions.
The HERO consists of the following components:
National Dashboard
The National Dashboard presents information on needs, coverage and gaps provided by Cluster
Leads, as well as the status of funding received through the Pakistan Floods Emergency
Response Plan (PFERP), disaggregated by sector. The two-page consolidated overview is
followed by individual sector pages which identify sector priorities, needs, strategies and
coverage.
Provincial Dashboards
The provincial Dashboards draw upon data on damages collected and made publicly available by
the Government of Pakistan (GoP), National Disaster Management Authority (NDMA) as well as
that provided by Cluster Leads on needs, targets, coverage and gaps. This information was
supplemented with accessible data from needs assessments and, in the case of Punjab and
Sindh, findings from the Union Council Ranking exercise and Punjab Village Profiling Multi-
cluster Rapid Assessment Mechanism (McRAM). Heads of the OCHA provincial sub-offices and
OCHA’s Reporting Unit provided narratives that serve as the contextual overview.
SCOPE
The HERO was compiled by OCHA and addresses only those areas where OCHA has a presence.
Thus, included in this document are those districts identified as most-affected in Sindh, Punjab
and Khyber Pakhtunkhwa (KPK) by the Government of Pakistan (GoP) and humanitarian
stakeholders, drawing upon data emanating from the WFP Vulnerability and Mapping (VAM)
Assessment (September 2010) and August 2010 Multi-Cluster Rapid Assessment Mechanism
(McRAM).

APPROACH
Information was collected by OCHA staff at the district, provincial and capital (Islamabad) levels
and reflects that which was articulated by Cluster Coordinators/Focal Points. Data emanating
from various assessments, including the WFP/FAO Floods Recovery Assessment (FRA), and
PDMA/UNICEF Nutrition Assessment was also included. Finally, in Punjab and Sindh, findings
from the Union Council Ranking were utilized to highlight geographical priorities. This
information was consolidated by OCHA’s Assessment, Information Management, Coordination
and Reporting Units in Islamabad.
Union Council (UC) Ranking
In response to the recognized need for a clearer understanding of needs and geographical
priorities, a ranking was undertaken of UCs in affected areas on the basis of a simple set of
indicators. Each provincial hub modified the exercise to meet the needs and realities of the
individual provinces.
In all provinces the exercise was led by OCHA, in consultation with partners. The indicators used
in the ranking matrix were agreed to by partners operating in the province and were broad in
nature, bearing in mind the fact that the ranking exercise was undertaken in advance of detailed
assessments which were planned.
A weight was assigned to each indicator, resulting in an overall ‘score’ for each UC which was
used to rank it against others. Indicators are grouped under eight headings:
1. number of IDPs (within defined ranges);
2. number of returnees (within defined ranges);
3. number of affectees (within defined ranges);
4. percentage of crops destroyed;
5. degree to which food assistance is required;
6. degree to which access to water and sanitation are concerns;
7. number of houses either damaged or destroyed (within defined ranges); and
8. incidence of disease and damage to health infrastructure.
In Punjab the highest (i.e worst-affected) UCs were then prioritized for a second stage, a village
profiling exercise utilizing the Multi-cluster Rapid Assessment Mechanism (McRAM) tool. In
Sindh the information of the worst affected UCs was shared with the PDMA Sindh and local
officials for additional assessments. The exercise has not yet been completed for Khyber
Pakhtunkhwa but is scheduled for late March.

PAKISTAN FLOODS RESPONSE
Onset of emergency: 22 July 2010 Date of Dashboard revision: 28 Feb 2011
PFERP* Strategic Priorities
1. Ensure adequate public health of the flood‐affected population through an integrated approach or “survival strategy” combining WASH, health and nutrition.
2. Provide food assistance and other social protection measures to offer a basic safety net, especially to the most vulnerable, until livelihoods are restored.
3. Support durable solutions through the provision of shelter assistance, prioritizing solutions that can span emergency, transitional and core shelter and housing needs.
4. Restore on‐ and off‐farm livelihoods, with a focus on agriculture, livestock, and protection and restoration of productive assets.
5. Restore basic community services and support re‐establishment of public administration, health and education systems. * PFERP: Pakistan Flood Emergency Response Plan
Situation Overview
2010 monsoon season saw worst floods in history, affecting 10% of the population. (Source: GOP 2010)
More than 1 700 people perished and at least 1.8 million homes destroyed. (Source: GOP 2010)
Over 2.4 million hectares of crops were lost and the primary means of livelihoods, agriculture, devastated. (Source: NDMA 2010)
High pre‐flood levels of mortality and morbidity adversely affect resilience and heighten fears over further deterioration.
Gap Analysis / Priority Areas
1. Only 66.5% of the Floods appeal has been funded. There is a critical need for funding, particularly in the areas of Health, Shelter, Nutrition and ER in every sector. (source: FTS)
2. 100,000 people, mainly in Sindh, remain displaced and in need of ongoing humanitarian assistance. (Source: PDMA Sindh 2011)
3. The nutrition situation in Sindh is critical with rates well above the emergency threshold.
4. Preparedness planning and risk mitigation are key priorities in the coming months prior to the June monsoon season.
5. Beneficiaries cite restoration of livelihoods and agriculture practices as main priorities. There is a lack of funding dedicated to such activities.
People in Need of Response Total population of country: 180 million Population affected: 18.1 million* *Information provided by Government of Pakistan
Estimated people in need of humanitarian assistance: 14 million (8% of total population of country)
Sindh, 7,274,250, 40%
P.A.K., 200,000, 1%
Khyber Pakhtunkhwa, 3,800,000, 21%
Gilgit Baltistan, 100,000, 1%
Balochistan, 700,000, 4%
Punjab, 6,000,000, 33%
Constraints on Flood Response
Funding Capacity Access Security Infrastructure / geographical Movement restriction
Severe constraints
Major Constraints
Minimal Constraints
No Constraints
People in Need of Sectoral Response*, Current Coverage*, and Funding**
Appeal issued: 17 September 2010 Appeal expires: July 2011
Other UN pooled funds: $36.6mCERF Contribution: $41.9m
Cluster target
no update provided
l
k
e
f
h
d
a
c
j
b
Cluster coveragereached
People in needof response
ReliableFairly reliableNot so reliable
Cluster target
* Provided by Cluster leads, ** PFERP as of 15 March 2011

PAKISTAN FLOODS RESPONSE
Flood Affected Districts Accountability of the Response to People Affected by the Disasters
Information provision to communities Community participation Access to complaint handling mechanisms
Access to complaint handling mechanisms Good Acceptable Inadequate Very poor
Gender and Special Needs Needs: Female beneficiaries cite lack of access to humanitarian goods and services, and security as primary concerns. Gender expertise, female staff to engage women beneficiaries, and gender equality programming such as analysis and targeted programming for population groups with special needs.
Coverage: 41% of projects have potential to contribute substantively to gender equality.
(Source: Gender Marker 2010) Gender Task Force established to support inter‐agency coordination and information sharing among humanitarian actors.
Gaps: Systematic collection, analysis and use of sex‐disaggregated data
Upcoming Events Contingency Planning Khalif Cyclones Monsoon
Mar Apr May Jun Jul Aug
Key Reference Data
(Source: PFERP) Current Situation Pre‐Floods Displaced 8.1m (source WFP) 1m
Refugees & Asylum Seekers 1.76m 1.76m
Under 5 Mortality N/A 90/1,000 (2010)
Global Acute Malnutrition (GAM) u‐5 N/A 13% (2009)
GDP per capita (PPP) N/A US$1,013 (2008) Human Development Index (HDI) 141 of 182

Agriculture
Overview
� Cluster efforts – including the 207 NGO partners – have focused
on maximizing agricultural production during the rabi planting
season while also providing livestock and cash assistance.
Attention now shifts to spring (kharif) planting season.
� Sindh remains a priority area as it has received the least
assistance.
� To date, the cluster has reached 536,500 households (HH) with
crop/vegetable and seed oil packages.
� Ongoing activities are addressing 297,000 HH with livestock
support packages (compound feed, de-wormer and material for
the construction of temporary shelters) and approximately 30,000
HH with cash for work interventions aiming at rehabilitating
irrigation infrastructures.
Sectoral Needs
� Collection of accurate data in the form of assessments and
surveys to identify gaps and priorities and to plan for kharif crop.
� Developing guidelines for Pakistan to guide next cropping season.
� Disaster preparedness.
� Gender mainstreaming.
Priorities
� Provision of livestock feed, medicines/vaccines and water.
� Restoration of agriculture productive resources, e.g. land
preparation, water courses and tube-wells through Cash/Food for
Work.
� Provision of seeds, fertilizers and implements for upcoming spring
kharif.
Capacity and coverage
� The Agriculture Cluster has assisted are 1,402,000 HHs in total
(Cluster and GoP) of which 864,000 HHs were reached by cluster
members.
Gap analysis
� Limited funding for early recovery interventions to take place for
kharif crop in 2011.
� Inadequate data on the impact of floods on agriculture based
livelihoods.
Strategy and Operational Implementation Plan
� Continue to restore productive capacity and assets of flood
affected households.
� Rehabilitate agriculture productive facilities, e.g. water courses
and tube-wells.
� Mainstream food and nutrition security (focusing on gender to
maximize impact).
� Enhance households and community resilience to shocks (DRR
and DRM).
� Strengthen evidence-based coordination and planning.
Early Recovery
� An early recovery program has been designed for the next 24
months to rebuild agriculture based livelihoods, strengthen
support services and rehabilitate small scale water management
facilities in the most severely affected districts.
Table 1: Overall Needs and Coverage Estimates and Targets
Table 2: ESTIMATING NEEDS: Standards, assumptions, population data and key
humanitarian indicators used.
Table 3: ESTIMATING COVERAGE – key assumptions and datasets used
Overall figures on need & coverage 11 Aug
(flood
onset)
17 Sept
(revised
appeal)
Current
Status
Number of people in need of sectoral
response (Households)
n/a n/a 2.02
million
Per cent covered
n/a n/a 61%
Key standard used
Sphere
Description of population of concern
Number
Agriculture-based HHs adversely affected by July/August 2010
floods (total)
- Sindh
- KPK
- Punjab
2.02 m
885,000
475,000
660,000
Key humanitarian indicators used
Covered
n/a n/a
Key assumption used
Key dataset used
See sources of information below.
Information provided by FAO drawing upon:
Cluster 3w Matrix
Information provided by Cluster members
GoP/ADB/WB Disaster Needs Assessment (August 2010)
WFP/FAO Flood Recovery Assessment (September 2010)
Source: FAO 2011
Community Restoration
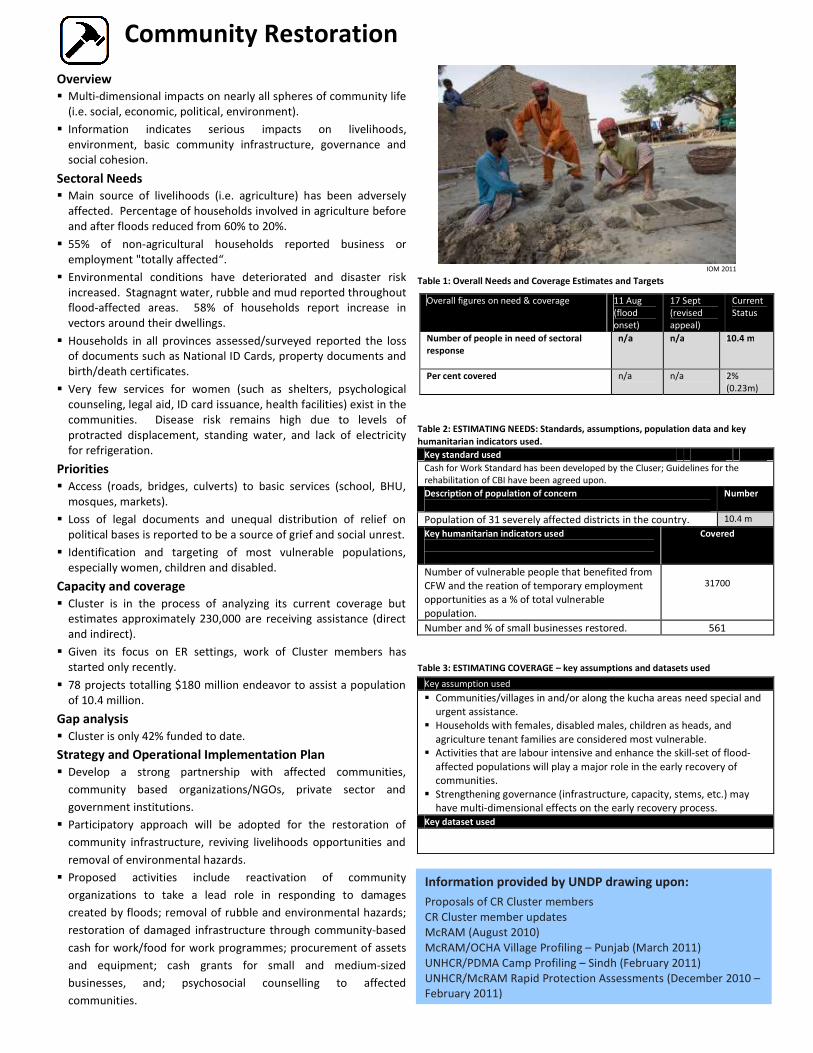
Overview
� Multi-dimensional impacts on nearly all spheres of community life
(i.e. social, economic, political, environment).
� Information indicates serious impacts on livelihoods,
environment, basic community infrastructure, governance and
social cohesion.
Sectoral Needs
� Main source of livelihoods (i.e. agriculture) has been adversely
affected. Percentage of households involved in agriculture before
and after floods reduced from 60% to 20%.
� 55% of non-agricultural households reported business or
employment "totally affected“.
� Environmental conditions have deteriorated and disaster risk
increased. Stagnagnt water, rubble and mud reported throughout
flood-affected areas. 58% of households report increase in
vectors around their dwellings.
� Households in all provinces assessed/surveyed reported the loss
of documents such as National ID Cards, property documents and
birth/death certificates.
� Very few services for women (such as shelters, psychological
counseling, legal aid, ID card issuance, health facilities) exist in the
communities. Disease risk remains high due to levels of
protracted displacement, standing water, and lack of electricity
for refrigeration.
Priorities
� Access (roads, bridges, culverts) to basic services (school, BHU,
mosques, markets).
� Loss of legal documents and unequal distribution of relief on
political bases is reported to be a source of grief and social unrest.
� Identification and targeting of most vulnerable populations,
especially women, children and disabled.
Capacity and coverage
� Cluster is in the process of analyzing its current coverage but
estimates approximately 230,000 are receiving assistance (direct
and indirect).
� Given its focus on ER settings, work of Cluster members has
started only recently.
� 78 projects totalling $180 million endeavor to assist a population
of 10.4 million.
Gap analysis
� Cluster is only 42% funded to date.
Strategy and Operational Implementation Plan
� Develop a strong partnership with affected communities,
community based organizations/NGOs, private sector and
government institutions.
� Participatory approach will be adopted for the restoration of
community infrastructure, reviving livelihoods opportunities and
removal of environmental hazards.
� Proposed activities include reactivation of community
organizations to take a lead role in responding to damages
created by floods; removal of rubble and environmental hazards;
restoration of damaged infrastructure through community-based
cash for work/food for work programmes; procurement of assets
and equipment; cash grants for small and medium-sized
businesses, and; psychosocial counselling to affected
communities.
Table 1: Overall Needs and Coverage Estimates and Targets
Table 2: ESTIMATING NEEDS: Standards, assumptions, population data and key
humanitarian indicators used.
Table 3: ESTIMATING COVERAGE – key assumptions and datasets used
Overall figures on need & coverage 11 Aug
(flood
onset)
17 Sept
(revised
appeal)
Current
Status
Number of people in need of sectoral
response
n/a n/a 10.4 m
Per cent covered
n/a n/a 2%
(0.23m)
Key standard used
Cash for Work Standard has been developed by the Cluser; Guidelines for the
rehabilitation of CBI have been agreed upon.
Description of population of concern
Number
Population of 31 severely affected districts in the country. 10.4 m
Key humanitarian indicators used
Covered
Number of vulnerable people that benefited from
CFW and the reation of temporary employment
opportunities as a % of total vulnerable
population.
31700
Number and % of small businesses restored. 561
Key assumption used
� Communities/villages in and/or along the kucha areas need special and
urgent assistance.
� Households with females, disabled males, children as heads, and
agriculture tenant families are considered most vulnerable.
� Activities that are labour intensive and enhance the skill-set of flood-
affected populations will play a major role in the early recovery of
communities.
� Strengthening governance (infrastructure, capacity, stems, etc.) may
have multi-dimensional effects on the early recovery process.
Key dataset used
Information provided by UNDP drawing upon:
Proposals of CR Cluster members
CR Cluster member updates
McRAM (August 2010)
McRAM/OCHA Village Profiling – Punjab (March 2011)
UNHCR/PDMA Camp Profiling – Sindh (February 2011)
UNHCR/McRAM Rapid Protection Assessments (December 2010 –
February 2011)
IOM 2011

Education
Overview
� 3,067 temporary learning centers (TLCs) benefiting 284,745
children (39% girls).
� 5,554 teachers trained, including 1,940 female teachers, in DRR,
emergency education and psychosocial support.
� Educational supplies provided to 347,549, including 137,292 girls.
� 169 Adult Literacy Centers assisting 4,332 adults.
� Cluster trained 909 parent teacher council members, including
168 female members, in Sindh and Punjab.
� Validation and verification of damaged schools is underway;
10,490 schools to date reported damaged by floods.
Sectoral Needs
� Extension of educational support to additional 816,343
beneficiaries.
� Rehabilitation of 7,000 partially affacted schools and provision of
transitional structures to 2500 schools.
� Provision of educational materials and teacher training with a
focus first on schools previously used as IDP shelters.
Priorities
� Continuation and expansion of existing services.
� Applicatin of INEE standards and checklists for mainstreaming
gender into all district response plans.
� Strengthen education in DRR efforts and Emergency Preparedness
Planning, as well as front line responder training.
Capacity and Coverage
� 61% of those in need have not yet received educational support.
Gap analysis
� Cluster support to date has reached only 512,139 or 39% of those
in need.
� Education Cluster is one of the most underfunded clusters – only
37% of $83 million requested has been secured through the
Floods Appeal; two projects out of 22 projects have received
funding .
Strategy and Operational Implementation Plan
� Ensure continuation of education during the rehabilitation/
reconstruction period.
� Establisment of TLCs that are safe and child-friendly, including
identification of risks and safety en route to and from
school/learning sites.
� Rehabilitation of schools affected by the floods or as a result of
being used as IDP shelters.
� Provision of temporary selter structures for partially or
completely damaged schools.
� Strengthen linkages with other sectors and cross cutting issues to
ensure convergence of activities within the education system.
� Conduct teachers’ training on coping skills, emergency
preparedness and DRR skills, using participatory, gender and
learner-centered teaching methodology.
� Reactivate and strengthen Parent Teacher Committees and
training in disaster management .
Early Recovery
� Restore education system, both formal and informal components,
though continuation of current activities and those outlined in
Operaitonal Implementation Plan.
� Strengthen policy framework for education in emergencies,
including DDR at national, provincial and district levels.
BENEFICIARIES REACHED AND EXISTING GAPS
Table 1: Overall Needs and Coverage Estimates and Targets
Table 2: ESTIMATING NEEDS: Standards, assumptions, population data and key
humanitarian indicators used.
Table 3: ESTIMATING COVERAGE – key assumptions and datasets used
Overall figures on need & coverage 11 Aug
(flood
onset)
17 Sept
(revised
appeal)
Current
Status
Number of people in need of sectoral
response
n/a 1.3m 1.3m
Per cent covered
n/a 2% 39%
Key standard used
Inter-Agency Network for Educaiton in Emergencies (INEE) Minimum
Standard
Description of population of concern
Number
Children and adults who have no access to education meeting
INEE standards and are at risk of serious disruption to
education and longer-term development.
1.3 m
Key humanitarian indicators used
Baseline
Aug’10
Current
Status
Number of educational insitutions damaged due
to floods
n/a 10,490
% of children not attending school
Key assumption used
Education provision is primarily the responsibility of the government.
Educaiton cluster will provide support in filling gaps in the most vulnerable
areas.
Key dataset used
Information provided by UNICEF, drawing upon:
Pakresponse.info

Shelter
Overview
� The GoP estimates nearly 1.6 million homes were damaged or
destroyed houses, and 805,695 houses completely destroyed.
� To date, emergency shelter has been delivered to 1,038,279
households or 65% of the caseload; existing commitments
bring this to 73%.
� Other Non-Food Items distributed are 2,315937 blankets, 407,587
bedding sets, 576,696 kitchen sets and 91,605 tool kits.
Sectoral Needs
� Cost of building materials has increased significantly.
� To increase availability of building materials alternative cost
effective solutions are being evaluated (e.g. cement stabilised
earth bricks).
� District level coordination will be key during the ER phase to avoid
duplications and to ensure proper targeting.
Priorities
� In order to provide more durable solution for flood affectees,
cluster members will support construction of one room shelters
(ORS) and transitional shelters and implement cash for work and
training programs. Flood-affectees will be supported to construct
their own shelters and projects will also inject much needed
finance into the local economy.
Capacity and coverage
� 360 active cluster members nationally and provincially operating
in all flood affected areas.
� 65% coverage for emergency shelter. Coverage
on-going commitments for additional 25%.
� District coordination is being established in all severely affected
districts with the appointments of focal points from local NGOs
where possible.
Gap analysis
� Funding is at 46%; increased funding is required to meet the
identified ER needs.
� National granular gap analysis required still required to assess
needs at Union Council level.
� Requirement for technical guidance on specific issues (i.e. shelter
construction, environmental issues, beneficiary selection and land
rights).
Strategy and Operational Implementation Plan
� The Shelter Cluster aims to help the most vulnerable affectees
build one disaster resistant room. The Shelter Cluster Technical
Working Group provides input to ensure she
good construction practices and disaster risk reduction (DRR)
techniques.
� 4w information is regularly compiled and shared regarding
members ER activities in order to maximise collaboration and
minimise duplication.
The GoP estimates nearly 1.6 million homes were damaged or
destroyed houses, and 805,695 houses completely destroyed.
To date, emergency shelter has been delivered to 1,038,279
households or 65% of the caseload; existing commitments will
Food Items distributed are 2,315937 blankets, 407,587
bedding sets, 576,696 kitchen sets and 91,605 tool kits.
Cost of building materials has increased significantly.
terials alternative cost
effective solutions are being evaluated (e.g. cement stabilised
District level coordination will be key during the ER phase to avoid
In order to provide more durable solution for flood affectees,
cluster members will support construction of one room shelters
(ORS) and transitional shelters and implement cash for work and
affectees will be supported to construct
their own shelters and projects will also inject much needed
360 active cluster members nationally and provincially operating
65% coverage for emergency shelter. Coverage for ER is 2% with
District coordination is being established in all severely affected
districts with the appointments of focal points from local NGOs
ng is required to meet the
National granular gap analysis required still required to assess
Requirement for technical guidance on specific issues (i.e. shelter
beneficiary selection and land
Strategy and Operational Implementation Plan
The Shelter Cluster aims to help the most vulnerable affectees
build one disaster resistant room. The Shelter Cluster Technical
Working Group provides input to ensure shelters comply with
good construction practices and disaster risk reduction (DRR)
4w information is regularly compiled and shared regarding
members ER activities in order to maximise collaboration and
Shelter Needs, Committed and Gaps
Table 1: Overall Needs and Coverage Estimates and Targets
Table 2: ESTIMATING NEEDS: Standards, assumptions, population data and key
humanitarian indicators used.
Table 3: ESTIMATING COVERAGE – key assumptions and datasets used
IOM provided this information, drawing upon:
McRAM (August 2010)
Government of Pakistan/PDMAs
WFP Vulnerability and Mapping Assessment (September 2010)
UNIFEM Rapid Gender Assessment (September 2010)
Various assessments which may be accessed via:
https://sites.google.com/site/shelterpak2010/assessments
Gap
589,670 ,
(73%)
Committed
Shelters,
216,024 ,
Overall figures on need & coverage
Number of people in need of sectoral
response (HHs)
Per cent covered
Key standard used
Sphere
Description of population of concern
The floods have affected 77 districts out
districts in Pakistan, and more than 20 million people
tenth of Pakistan’s population – devastating villages from the
Himalayas to the Arabian Sea. More than
and children have lost their lives, and at least 1.6 mill
homes have been damaged or destroyed.
Key humanitarian indicators used
Number and proportion of people with destroyed
or severly damaged homes receiving support to
rebuild homes.
Key assumption used
Different scenarios require different implementation strategies for Shelter
Response, all of which are applicable to the Pakistan floods context:
1. Possibility of return – when families may go back to their original
locations, e.g. land owners or tenants, in non flood
2. Extended displacement - when families may not return to their original
locations, e.g. due to land rights issues, permanence of stagna
other reasons.
3. Seasonal flood migrants – when families live in seasonal flood areas and
are displaced frequently.
Key dataset used
Needs, Committed and Gaps
Table 1: Overall Needs and Coverage Estimates and Targets
Table 2: ESTIMATING NEEDS: Standards, assumptions, population data and key
key assumptions and datasets used
IOM provided this information, drawing upon:
/PDMAs
Vulnerability and Mapping Assessment (September 2010)
UNIFEM Rapid Gender Assessment (September 2010)
Various assessments which may be accessed via:
https://sites.google.com/site/shelterpak2010/assessments
Completed,
38,631 (5%)
In Pipeline,
177,393
(22%)
Committed
Shelters,
216,024 ,
(27%)
11 Aug
(flood
onset)
17 Sept
(revised
appeal)
Current
Status
Number of people in need of sectoral 281,000 1.8 m 1.6 m
n/a 17% 65%
Description of population of concern Number
The floods have affected 77 districts out of a total of 139
districts in Pakistan, and more than 20 million people – one-
devastating villages from the
Himalayas to the Arabian Sea. More than 1,700 men, women
and children have lost their lives, and at least 1.6 million
or destroyed.
Covered
Number and proportion of people with destroyed
or severly damaged homes receiving support to
65% of destroyed or
damaged HHs
Different scenarios require different implementation strategies for Shelter
Response, all of which are applicable to the Pakistan floods context:
when families may go back to their original
locations, e.g. land owners or tenants, in non flood-prone areas.
when families may not return to their original
locations, e.g. due to land rights issues, permanence of stagnant water or
when families live in seasonal flood areas and

Food
Overview
� At least 10.1 million people were in need of emergency assistance
in the wake of devastating floods;
� Fears of a potential pipeline break due to funding shortfalls.
Sectoral Needs
� 10.1 million individuals in need of immediate assistance, as
indicated by the September 2010 WFP Flood Impact Assessment.
3.6 million require long term assistance.
� A WFP/FAO Floods Recovery Assessment is ongoing with the
support of UN Women and Oxfam. The assessment, coordinated
with a UNICEF nutrition survey, will allow for final adjustments to
early recovery programming.
Priorities
� Extended relief distributions to around 6
including those that are still displaced by standing water
and Baluchistan.
� Transition to Early Recovery.
Capacity and coverage
� Since the beginning of the floods, distributions have been carried
out by the Government (PDMA), Military, Red Cross/Red Crescent
Movement, WFP and national and international NGOs
� Over 480,000 mt of food has been distributed as of Feb 23
� 65 districts in 7 provinces/regions have been reached
� WFP and partners have been providing monthly rations to the
beneficiaries, in accordance with SPHERE standards for food
security, nutrition and food aid.
Gap analysis
� An estimated 8.8 million people have been assist
by the Food Cluster; while on average 6 million people
monthly rations on a regular basis.
� Funding shortfalls in the food sector may lead to breaks in the
food pipeline. In the event of pipeline breaks, beneficiaries will
resort to distress coping mechanisms and the risk of nutritional
deterioration will increase.
Strategy and Operational Implementation Plan
� Continue to provide extended relief assistance
of Sindh and Balochistan through general food
� Transition to recovery through return packages
recovery activities.
Early Recovery
� Food/cash for work assistance for rehabilitation of community
(schools, health centers) and agricultural infrastructure
� Provision of fortified biscuits in public, primary schools in flood
affected areas.
� Targeted nutritional support to moderately malnourished children
under-five years of age and to malnourished pregnant and
lactating women.
� Rehabilitation of community assets.
� Floods Recovery Assessment under revision will inform planning
Activities will be phased-in at different times depending on
geographical area: altitude, prolonged flooding areas
assistance highest during sowing season to combat any negative
coping strategies that might adversely affect the next harvest.
in need of emergency assistance
al pipeline break due to funding shortfalls.
10.1 million individuals in need of immediate assistance, as
indicated by the September 2010 WFP Flood Impact Assessment.
A WFP/FAO Floods Recovery Assessment is ongoing with the
Oxfam. The assessment, coordinated
with a UNICEF nutrition survey, will allow for final adjustments to
million individuals,
that are still displaced by standing water in Sindh
Since the beginning of the floods, distributions have been carried
out by the Government (PDMA), Military, Red Cross/Red Crescent
ational and international NGOs.
as of Feb 23.
7 provinces/regions have been reached.
monthly rations to the
in accordance with SPHERE standards for food
assisted at least once
; while on average 6 million people received
Funding shortfalls in the food sector may lead to breaks in the
food pipeline. In the event of pipeline breaks, beneficiaries will
sort to distress coping mechanisms and the risk of nutritional
Strategy and Operational Implementation Plan
relief assistance in selected districts
ough general food distributions.
return packages and early
Food/cash for work assistance for rehabilitation of community
(schools, health centers) and agricultural infrastructure.
biscuits in public, primary schools in flood
Targeted nutritional support to moderately malnourished children
five years of age and to malnourished pregnant and
will inform planning.
in at different times depending on
, prolonged flooding areas with
assistance highest during sowing season to combat any negative
coping strategies that might adversely affect the next harvest.
Food Cluster: Population in Need of Food Assistance and Coverage b
Table 1: Overall Needs and Coverage
Table 2: ESTIMATING NEEDS: Standards, assumptions, population data and key
humanitarian indicators used.
Table 3: ESTIMATING COVERAGE – key assumptions and datasets used
Information provided by WFP drawing upon:
WFP Flood Impact Assessment
Food Cluster 3Ws
Food Cluster 3-month R/ER plan
Information from Cluster members
2.9
6.3
7.2
3.8
-
2
4
6
8
10
12
Aug-10 Sep-10
Mil
lio
ns
Overall figures on need & coverage
Number of people in need of sectoral
response
Per cent covered
Key standard used
Sphere 2100kcal per day per person
Description of population of concern
denominator for the indicators below)
Food insecure populations or at risk of becoming
food insecure;
Flood affected populations ( IDPs
stayees);
Populations residing in cut-off areas.
Key humanitarian indicators used
(percent of people in need of sectoral
response—see above)
GAM prevalence
Household Food Consumption Score
Number of men/women/children receiving
food
Tonnage of food distributed
Key assumption used
WFP reporting and partner regular reporting on distribution figures;
Food Cluster 3Ws database.
Assessments carried out since flood.
Food Cluster coordination platforms (Isld, KPK, Sindh)
Key dataset used
Households reached (1.25 million) and tonnages distributed
Food Cluster: Population in Need of Food Assistance and Coverage by Month
Table 1: Overall Needs and Coverage Estimates and Targets
Standards, assumptions, population data and key
key assumptions and datasets used
Information provided by WFP drawing upon:
(September 2010)
month R/ER plan
Information from Cluster members
7.05.7 5.4
4.4
3.14.4 4.7
5.7
Oct-10 Nov-10 Dec-10 Jan-11
Gap Beneficiaries Reached
s on need & coverage 11 Aug (flood onset)
17 Sept (revised appeal)
Current Status
Number of people in need of sectoral 10.1 M 10.1 M 10.1 M
40% 60% 70%
Sphere 2100kcal per day per person
Description of population of concern (to be used as
denominator for the indicators below)
Number
populations or at risk of becoming
IDPs, returnees,
off areas.
10.1 million
20 million
0.5 million.
sectoral
Baseline
Aug’10
Current Status
13% 22% Sindh
13.9% Punjab
Household Food Consumption Score N/A Poor=2.4%
Borderline=34.2%
Acceptable=63.4 Source: FRA 2011
Number of men/women/children receiving - 8.8 million
- 480,000 mt
WFP reporting and partner regular reporting on distribution figures;
out since flood.
Food Cluster coordination platforms (Isld, KPK, Sindh)
and tonnages distributed (480,000MT)

Health
Overview
� 8 million, including 1.4 million children under 5 years, and 1.4
million women, need access to health care.
� High pre-floods rates of malnutrition, maternal and <5 mortality.
� One-fifth of newborns are of low birth weight and 38% of <5
children are underweight
� High rates of malaria, tuberculosis and acute watery diarrhea.
Sectoral Needs
� Enhancement of Disease Early Warning System into remaining
flood affected districts
� Routine Immunization - Due to rising cases of Malaria, Measles
and Polio, more funds and a more comprehensive approach needs
to be developed
� Reproductive Health – Interventions to minimize NNT and
ensuring availability of female medical doctors and gynecologists
� Interventions to minimize vector borne diseases
� Establishment of sentinel sites and facility based
management of severe acute malnutrition
� Water source testing to minimize water contamination and
incidence of disease
Priorities
� Greater focus on normalization of health service provision in 29
most flood affected districts
� Requesting of release of Rs. 760 million from the Japanese
Embassy grant for procurement of vaccines
� Restoration and rehabilitation of non functional
flood affected areas through provision of temporary structures,
supplies, medicines and human resource support, especially
female medical staff.
� Greater intervention for facility based management of sever acute
malnutrition in Sindh
� Contingency planning for provision of PHC in conflict affected
areas of North Waziristan
� Supporting diarrhea treatment units in government health
facilities in areas of high incidence of acute watery diarrhea
� Malaria preventive activities – provision of LLINs and RDTs
mitigate cases of malaria in the prevailing monsoon season
� Testing of water sources in health facilities in 29 prioritized
districts to ensure provision of clean drinking water
Capacity
� Health sector partners efficiently providing PHC, MNCH and
psycho social support in all target districts
� Need for capacity building of LHWs for better performance
� Capacity building of nursing staff and doctors and government run
health facilities as an exit strategy
� Capacity building of government for coordination and
preparedness as per mandate of UN for exit strategy
� Collaboration with Religious scholars for dissemation of health
related messages in communities
Coverage
� A total of 20,116,053 consultations were reported by March 2011,
through DEWS. Currently, 70 out of 78 flood affected districts are
reporting to the DEWS.
� During the flood response WHO provided for essential medicine
cover to approximately 12 million population.
� The health sector partners have started operations across all
flood affected districts and are providing PHC and MNCH in all
flood affected districts; psycho-social support and community
based provision of health services in a select few places.
on children under 5 years, and 1.4
floods rates of malnutrition, maternal and <5 mortality.
fifth of newborns are of low birth weight and 38% of <5
High rates of malaria, tuberculosis and acute watery diarrhea.
Enhancement of Disease Early Warning System into remaining
Due to rising cases of Malaria, Measles
Polio, more funds and a more comprehensive approach needs
Interventions to minimize NNT and
ensuring availability of female medical doctors and gynecologists
Interventions to minimize vector borne diseases
nt of sentinel sites and facility based case
Water source testing to minimize water contamination and
Greater focus on normalization of health service provision in 29
Requesting of release of Rs. 760 million from the Japanese
Restoration and rehabilitation of non functional health facilities in
through provision of temporary structures,
supplies, medicines and human resource support, especially
Greater intervention for facility based management of sever acute
planning for provision of PHC in conflict affected
Supporting diarrhea treatment units in government health
facilities in areas of high incidence of acute watery diarrhea
provision of LLINs and RDTs for
mitigate cases of malaria in the prevailing monsoon season
Testing of water sources in health facilities in 29 prioritized
districts to ensure provision of clean drinking water
Health sector partners efficiently providing PHC, MNCH and
Need for capacity building of LHWs for better performance
Capacity building of nursing staff and doctors and government run
Capacity building of government for coordination and
preparedness as per mandate of UN for exit strategy
Collaboration with Religious scholars for dissemation of health
consultations were reported by March 2011,
flood affected districts are
During the flood response WHO provided for essential medicine
The health sector partners have started operations across all
districts and are providing PHC and MNCH in all
social support and community
in a select few places.
Gap analysis
� 10 – 15 % of the poplation are receiving no health services due
to the inaccessibility of some areas.
� Inability to scale up response due to lack of human and financial
resources.
Strategy and Operational Implementation Plan
� Provision of prefabricated structures for damaged/destroyed
health facilities, and essential medicines
health facilities.
� Capacity-building and training of Health Cluster partners and
Health Department officials.
� Activate and/or enhance support by Reproductive Health
partners to address pre- and post
children.
� Close coordination with Food, Nutrition and WASH clusters via
Survival Strategy approach.
� Contingency planning for monsoon season across Pakistan.
Contingency planning for FATA due to the expected military
operation in North Waziristan.
Early Recovery:
� The NDMA has endorsed the Early Recovery Plan (ERP) for the
Health sector response in floods affected areas of the country.
WHO is waiting for the Federal Government final comment and
suggestions in order to finalize the ERP.
� WHO is now working to find out a consensual way to
operationalize the ERP and facilitate the integration of projects,
actions and funds of all partners under a commonly agreed
agenda and the Ministry of Health (MoH)’s stewardship.
Table 1: Overall Needs and Coverage Estimates and Targets
Table 2: ESTIMATING NEEDS: Standards, assumptions, population data and key
humanitarian indicators used.
Table 3: ESTIMATING COVERAGE – key assumptions and datasets used
Information provided by WHO
DEWS
Overall figures on need & coverage
Number of people in need of
sectoral response
Baluchistan
Khyber Pakhtunkhwa
Punjab
Sindh
Key humanitarian indicators used
(percent of number of people in need of sectoral
response—see above)
Number of health facilities with comprehensive
emergency obstetric care/500,000 population, by
admin unit
Number of alerts/outbreaks of communicable
disease reported and averted
Number of health kits provided
% of health facilities without stock, out of selected
essential drugs in 4 groups of drugs, by admin
Number of water sources tested
Total consultation in the last 6 months in areas of
response
Essential medicines supplied in flood affected
districts in the past 6 months
Key assumption used
Health is for everyone, therefore the total floods
provided for health assistance on a priority basis.
15 % of the poplation are receiving no health services due
naccessibility of some areas.
Inability to scale up response due to lack of human and financial
Strategy and Operational Implementation Plan
Provision of prefabricated structures for damaged/destroyed
health facilities, and essential medicines and supplies to affected
building and training of Health Cluster partners and
Health Department officials.
Activate and/or enhance support by Reproductive Health
and post-natal care for mothers and
Close coordination with Food, Nutrition and WASH clusters via
Contingency planning for monsoon season across Pakistan.
Contingency planning for FATA due to the expected military
operation in North Waziristan.
The NDMA has endorsed the Early Recovery Plan (ERP) for the
Health sector response in floods affected areas of the country.
WHO is waiting for the Federal Government final comment and
suggestions in order to finalize the ERP.
WHO is now working to find out a consensual way to
facilitate the integration of projects,
actions and funds of all partners under a commonly agreed
agenda and the Ministry of Health (MoH)’s stewardship.
and Coverage Estimates and Targets
Table 2: ESTIMATING NEEDS: Standards, assumptions, population data and key
key assumptions and datasets used
WHO drawing upon:
11 Aug
(flood
onset)
17 Sept
(revised
appeal)
Current
Status
20,000,000 8,000,000 8,000,000
1,370,000 548,000 548,000
4,100,000 1,640,000 1,640,000
8,200,000 3,280,000 3,280,000
7,000,000 2,800,000 2,800,000
(percent of number of people in need of sectoral
Baseline
Aug’10
Current
Status
Number of health facilities with comprehensive
00 population, by
Number of alerts/outbreaks of communicable 800 940
1000 1193
of health facilities without stock, out of selected
ups of drugs, by admin unit
5% 0%
3,000 3,500
Total consultation in the last 6 months in areas of 18,000,000 20,116,053
Essential medicines supplied in flood affected 10,000,000 12,104,700
Health is for everyone, therefore the total floods-affected population will be
provided for health assistance on a priority basis.

Nutrition
Overview
� Population displacement, risk of diarrhea outbreaks and other
water borne diseases, poor infant feeding and loss of livelihoods
have predisposed the population to increased risk of acute and
chronic malnutrition.
� High pre-floods levels of malnutrition (GAM 13.2%, SAM 3%)
exacerbate malnutrition risk factors.
� Recent survey revealed a critical situation in Sindh where GAM is
26% in the south and 22.9% in the north, far exceeding the 15%
emergency threshold. Chronic malnutrition is prevalent (high).
� 14% (2.8 million) of the overall flood-affected population are
children under five years of age (U5) and 8% are pregnant and
lactating women who require urgent nutritional support.
Sectoral Needs
� The Cluster and Ministry of Health is targeting 75,600 severely
malnourished children and 180,000 moderately malnourished
children for assistance the next 12 months.
� 857,000 children aged 6-23 are at increased risk of acute
malnutrition and will be reached through blanket feeding.
� 376,065 children age 6-36 months and 123,200 pregnant and
lactating women (PLWs) are in need of micronutrient
supplementation.
Priorities
� Community based management of malnutrition.
� Preventative blanket feeding to avert incidence of acute
malnutrition.
� Micronutrient supplementation and promotion of appropriate
infant and young child feeding practices.
� Geographical priorities in order of caseload: Punjab, Sindh, KPK
and Balochistan.
Capacity and coverage
� 35+ active members with 26 (including supporting UN agencies –
UNICEF, WFP and WHO) currently involved in emergency nutrition
interventions.
� 625 therapeutic centers, including 597 Outpatient Therapeutic
Feeding Programmes (OTPs) and 28 Stabilization Centers (SCs)
established.
� Over 1.29 million children U5 and over 492,000 PLW have been
screened for malnutrition in flood affected areas to date. Of
them, 53,000 U5 children SAM, 143,000 children moderately
malnourished and 95,000 PLW are currently enrolled in feeding
programs.
Gap analysis
� Absence of strong emergency nutrition partners in flood affected
areas, translating to low in-country capacity. To address this, the
cluster is collaborating with UNICEF and WFP for the provision of
essential nutrition supplies, as well as identifying and training
partners to cover critical gaps in the field. A cluster capacity
development programme is under implementation.
� Punjab and Sindh are the key gap areas.
� Tracking the malnourished cases as IDPs return is presenting a
unique challenge. Low reporting on response is also delaying up
dated coverage analysis.
Strategy and Operational Implementation Plan
� Community based management of acute malnutrition inclusive of
stabilization centres, OTP and SFP to treat severely and
moderately malnourished children.
� Preventative blanket feeding to avert incidence of acute
malnutrition among the at-risk groups.
� Micronutrient supplementation and promotion of appropriate
infant and young child feeding practices.
� Pakistan Integrated Nutrition strategy (PINS) is under
development to enhance integration and address immediate and
medium term nutrition concerns.
Early Recovery
� Current cluster targets cover a period of 12 months for both the
response and recovery phases. A combination of CMAM,
micronutrient and infant feeding is under implementation to treat
the malnourished and prevent malnutrition.
Table 1: Overall Needs and Coverage Estimates and Targets
Table 2: ESTIMATING NEEDS: Standards, assumptions, population data and key
humanitarian indicators used.
Table 2: ESTIMATING COVERAGE – key assumptions and datasets used
Overall figures on need & coverage 11 Aug
(flood
onset)
17 Sept
(revised
appeal)
Current
Status
Number of people in need of sectoral
response.
- 13.3 m 13.2m
% coverage (as above) - 3.6% 12%
Key standards used
� Sphere
� OTP/SC aim at >75% cure rate, <10% death rate, <15% for default rate; SFP: <3%,
>75% cured, <15% defaulter.
Description of population of concern
Number
� Target number of under-five children with severe acute
malnutrition in the flood affected provinces for 1 year.
� Target number of under-five children with moderate acute
malnutrition in the flood affected provinces for 1 year.
� Target number of 6-23 months children at risk of malnutrition
� Target number of children (6-36 months) in need of
micronutrient supplementation
� Target number PLW in need of micronutrient supplementation.
155,000
446,000
857,000
376, 065
123,200
Key humanitarian indicators used
Baseline
Aug’10
Current
Status
% of women have reduced breast feeding do the
floods
n/a 50%
% of acute malnutrition among under five children 13.2 Survey
underway
% of multiple micronutrient supplementation in the
target population (P/L women)
90 Survey
underway
Key assumption used for coverage analysis
# of beneficiaries reached by feeding programs against target (% reached)
# of children (6-23) reached with blanket feeding
# of P/L women reached with multiple micronutrient
The nutrition situation before the floods was serious and there are some hot spots
that could be worse. The flood s could have worsened the situation.
Infants, pregnant and lactating women are at increased risk of deterioration of
nutrition status
Key dataset used
Community Management of Acute Malnutrition (CMAM) standard reporting forms
(OTP/SC/ SFP) admissions/discharges; MUAC screening data
Pakistan Nutrition Cluster Weekly Brief (www. pakresponse.info)
Information provided by UNICEF drawing upon:
• Partner CMAM reporting to Subcluster = consolidated Field
Cluster Reports; National Nutrition Cluster Brief
• McRam Assessment report (August 2010)
• 2002 National Nutrition Survey
• UNICEF/PDMA FANS (January 2011)

WASH
Overview
� Continued effort dedicated to improving information on needs,
coverage and gaps. Analysis in the form of reports and WASH
specific maps are being generated and disseminated.
� 3 and 6 month plans are being compiled to strategically plan
comprehensive ER activities.
� WASH cluster partners will promote the safe disposal of human
excreta within the overall framework of the National Sanitation
Policy and the NDMA WASH strategy, employing a mix of
appraoches which will include social mobiliziationand hygiene
education to promote sustainability.
Sectoral Needs
� 13.3 million in need of WASH services.
Priorities
� Coordinated ER activities aimed at those most in need of
continued WASH services. Targeted assistance to most affected
populations still in relief phases and effective coordination of ER
to target those most in need.
� Priorities in ER consist primarily of the rehabilitation and /or
installation of permanent improved WASH facilities (via JMP (Joint
Monitoring Programme) standards)
� Priorities are restoring and exceeding pre-flood WASH coverage
levels through intensive hygiene promotion activies, PATS
(Pakistan Approach to Total Saniation) and other mechanisms.
Capacity and coverage
� Cluster includes 145 implementing partners active nationwide.
� Cluster funding stands at 47%.
Gap analysis
� 3 – 6 month plans are being used to identify strategic gaps and
coverage for Early Recovery.
� Geographical mapping of IP’s is being regularly undertaken to
identify geographical gaps and locations of persistent needs.
Limited cluster funding needs only funded at 49%.
Strategy and Operational Implementation Plan
� Comprehensive 3 – 6 month planning is being undertaken and
mapped with the review of plans being sent to partners for
confirmation and increased specification of activities.
� Relief is continuing in 5 districts agreed by NDMA while ER
planning is being rolled out nationwide.
� Agencies will focus on the 29 severely flood-affected districts for
programming on the safe disposal of human excreta through the
use of hygienic toilets/latrines - mostly private and some public.
� Public sanitation facilities will be brought back into operation in
close consultation with the community representative bodies that
will be responsible for the maintenance of such facilities.
Households and community bodies will be encouraged/educated
on how to make their toilets/latrines disaster-resilient.
Early Recovery
� ER plans focus on support to returnees at place of origin.
WASH Coverage by
Province
Table 1: Overall Needs and Coverage Estimates and Targets
Table 2: ESTIMATING NEEDS:
Table 3: ESTIMATING COVERAGE
Overall figures on need & coverage 11 Aug
(flood
onset)
17 Sept
(revised
appeal)
Current
Status
Number of people in need of sectoral
response
7.4 6.7 13.3
Per cent covered
n/a n/a n/a
Key standard used
Sphere Standards
Description of population of concern Number
People in need of WASH interventions 13.3 m
Key humanitarian indicators used Baseline
Aug’ 10
Current
Status
Average water use for drinking, cooking and personal
hygience of >15 litres/day
n/a n/a
Maximum distance from any water source is 500 m n/a n/a
Key assumption used
During initial phase, priority was to address urgent survival needs of those affected
so as to mitigate increased vulnerability to disease. In order to avoid pull factor into
camp settings, it is recommended that host populations also be provided services.
Key dataset used
n/a
Information provided by UNICEF drawing upon:
3W Reporting
Maps
Cluster Reports
Baseline data from 2006/7 Pakistan Social Living Measurement
Survey
MCRAM (August 2010)
PFERP
PHRP

Protection
Overview
� Rapid assessments report increased harrasment of women and
girls at aid distributions, cases of domestic violence, early and
forced marraige due to economic and social pressure, and sexual
violence. Some of the latter further result in harmful practices
such as honor killings.
� Implementing partners report discrimination in aid distribution,
particularly for female-headed households, increased child sexual
exploitation, and forced prostitution.
� Cluster is advocating for adherance to humanitarian principles,
includig non-discrimination in provision of assesistance.
Sectoral Needs
� Availability and capacity of services for GBV survivors, including
health care, psychosocial support services and legal aid,
particularly in Sindh.
� Increase the number of individuals with access to legal
documentation.
� Lack of information and understanding of GBV among affected
population and service providers .
� Establishment and strengthening of referral systems for GNV
cases including prevention and awareness-raising on GBV.
Sector Priorities
� Systematic disaggregated data collection and analysis on
protection access and interventions.
� Establishing a referral system for GBV survivors at provincal level.
� DRR and Preparedness for implementing protection interventions
at community/local government level.
� Awareness-raising among affected population and service
providers on GBV prevention and response.
� Mainstream protection into other sectors through capacity
bulding and awareness activities with relevant partners, including
government.
Capacity and coverage
� Current capacity is very limited. Support will be provided by the
GBV Subcluster in capacity building to partners.
� Coverage is maximized by working closely with other sectors,
particularly Health.
� All provinces – security permitting- are covered through the
cluster and its partners.
Gap analysis
� Gaps in services for GBV survivors in Health, Psychosocial, Legal,
Safety and Security remain across all provinces.
� Funding and human resources gaps remain a challenge in reaching
affected populations.
Strategy and Operational Impelementation Plan
� Capacity building to partners to support expansion of coverage.
� Ensure continuing access to cash compensation scheme through
ongoing monitoring and reporting, impelementation of lessons
learned and ongoing identification of those previously excluded to
redress.
Table 1: Overall Needs and Coverage Estimates and Targets
Table 2: ESTIMATING NEEDS: Standards, assumptions, population data and key
humanitarian indicators used.
Table 3: ESTIMATING COVERAGE – key assumptions and datasets used
Overall figures on need & coverage 11 Aug
(flood
onset)
17 Sept
(revised
appeal)
Current
Status
Number of people in need of sectoral
response
n/a 10.1m n/a
Per cent covered
n/a n/a n/a
Key standard used
Guidelines for Gender-based Violence Interventions in Humanitarian Settings, IASC,
2005
Description of population of concern (to be used as denominator for
the indicators below)
Number
Flood affected women, men, boys and girls with a focus on
marginalized groups.
14m
Key humanitarian indicators used
(percent of number of people in need of sectoral
response—see above)
Baseline
Aug’10
Current
Status
Number of beneficiaries with official documentation
recovered
n/a n/a
Number of referrals made and followed up through
Social Welfare Centers and other mechanisms
n/a n/a
Number of children with access to Child Friendly
Spaces, psycho-social support and other services
n/a n/a
Number of survivors of GBV referred and followed up
through health facilities , legal assistance and psycho-
social support
n/a n/a
Key assumption used
n/a
Key dataset used
n/a
Information provided by UNFPA drawing upon:
McRAM/UNHCR Rapid Protection Assessments
McRAM (August 2010)
UNHCR/PDMA Sindh Camp Profiling (February 2011)
McRAM/OCHA Punjab Village Profiling (March 2011)
Cluster member thematic monitoring (i.e. Save the Children,
Handicap International)
Stacey Winston, OCHA 2011

CCCM
NO INFORMATION
PROVIDED

KHYBER PAKHTUNKHWA PROVINCE
� Total Population (Estimates for 2010) 25,234,144
� Flood Affected Population 3,820,170
� Total Area (Sq Km) 79,054
� Area Under Max. Flood Extent (16 Sep 2010) Sq Km 5,043
� Total Districts 30
� Affected Districts 24
� Total Union Councils 870
� Affected Union Councils 533
Flood Affected Population and Damages
Affected Population Number of Damaged Houses Number of Damaged Health Facilities Number of Damaged Schools Crop Area Destroyed (Acres)
Total: 3,820,170 Total: 827,176 Total: 169 Total: 885 Total: 507,423
Situation Overview
� An estimated 3.8 million people were affected
and 1,198 people lost their lives (Source: GOP)
� Over 285,000 houses were either damaged or
destroyed (Source: GOP)
� There are over 1.1 million conflict-displaced
persons spread across KPK (Source: GOP)
� Over 700 km of roads and 141 bridges were
washed away in the northern districts (Source: GOP)
Coverage and Gaps by Cluster Percentage of Coverage and Gaps by Cluster
Balochistan
FATA
Sindh
Punjab
Khyber
Pakhtunkhwa
Islamabad
Jammu andKashmir
INDIA
PAKISTAN
AFGHANISTAN
TAJIKISTANTURKMENISTAN
CHINA
0 500250
kms
84
149
210
395
464
500
503
635
0 400 800
Shangla
Tank
Upper Dir
DI Khan
Kohistan
Nowshera
Charasada
Swat
Thousands
20
30
31
143
93
112
98
98
0 50 100 150
Shangla
Tank
Upper Dir
DI Khan
Kohistan
Nowshera
Charasada
Swat
Thousands
5
14
11
11
13
0 5 10 15
Shangla
Tank
Upper Dir
DI Khan
Kohistan
Nowshera
Charasada
Swat
36
3
19
311
107
137
32
69
0 100 200 300 400
Shangla
Tank
Upper Dir
DI Khan
Kohistan
Nowshera
Charasada
Swat
25
180
41
34
0 100 200
Shangla
Tank
Upper Dir
DI Khan
Kohistan
Nowshera
Charasada
Swat
Thousands
386
51 36 29
89
124 12 88
0
200
400
600
Agriculture Education Nutrition Shelter
Th
ou
san
ds
Coverage Gap
0%
20%
40%
60%
80%
100%
Food Agriculture Nutrition WASH Education Shelter
Gap Coverage
Source: GOP and Cluster Source: GOP and Cluster

KHYBER PAKHTUNKHWA PROVINCE
Overview
Khyber Pakhtunkhwa (KPK) was the first part of the country to be affected by the floods. Flash
flooding in the province’s mountainous terrain was intense, concentrated and highly
destructive. 1,198 people lost their lives – a death toll far higher relative to the number of
people affected than either Sindh or Punjab. 285,000 houses were either damaged or
destroyed. Over 900,000 people were displaced from their homes. Countless roads and
bridges were washed away or blocked by landslides.
Many of the worst-affected districts in KPK were already hosting large numbers of conflict-
displaced persons. Jalozai camp, which continues to be home to approximately 100,000 IDPs,
is located in Nowshera district, where the damage caused by the floods was greatest. In total
it was estimated that when the floods struck there were over 1.1 million conflict-displaced
persons spread across KPK. In Swat and Lower Dir, two other severely affected districts, over
1.4 million recently-returned IDPs were in the process of rebuilding their lives after the
massive displacement that took place from these areas in 2009.
Key priorities in KPK have included food assistance, WASH, emergency and early recovery
shelter and non food items and health interventions, particularly in response to diarrheal
disease and acute respiratory infections. Winterisation support was particularly important
during the winter months, when temperatures in many areas of the province dipped below
zero degrees Celsius.
The security situation in parts of the province and the extensive damage that the floods
caused to infrastructure have meant that access has been a significant challenge in KPK
throughout the response.
Remaining challenges
� Continuing insecurity.
� Repairing infrastructure, particularly roads and bridges in the northern districts.
� Repair and improvement of flood defences in advance of the 2011 monsoon season.
� Restoration of basic services, especially health and education.
� Transitioning from emergency shelter to permanent shelter solutions
� Restoration of livelihoods – including repair of irrigation channels that are essential
for farming
� Replacement of official documents lost – including land ownership and CNICs

PUNJAB PROVINCE
� Total Population (Estimates for 2010)
� Flood Affected Population
� Total Area (Sq Km)
� Area Under Max. Flood Extent (16 Sep 2010) Sq Km
� Total Districts
� Affected Districts
� Total Tehsils
� Affected Tehsils
Flood Affected Population and Damages
Affected Population Number of Damaged Houses
Total: 5,163,613 Total: 278,009
Situation Overview
� An estimated 6 million people were affected
across 11 districts
� Over 300,000 houses were destroyed and
200,000 more were badly damaged
� An estimated 1.85 million acres of acres of arable
land were lost.
� The majority of the affected population have
returned to their villages (Source: GOP)
Balochistan
FATA
Sindh
Punjab
Khyber
Pakhtunkhwa
Islamabad
Jammu andKashmir
INDIA
PAKISTAN
AFGHANISTAN
TAJIKISTANTURKMENISTAN
CHINA
0 500250
kms
67
264
361
395
672
946
1,755
0 1,000 2,000
Bhakkar
DG Khan
Layyah
RY Khan
Mianwali
Rajanpur
Muzaffargarh
Thousands
5.58
36.00
18.57
26.49
17.93
11.79
0 50 100
Bhakkar
DG Khan
Layyah
RY Khan
Mianwali
Rajanpur
Muzaffargarh
Thousands
0
200
400
600
800
Th
ou
san
ds
Total Population (Estimates for 2010) 99,440,760
Flood Affected Population 5,163,613
Total Area (Sq Km) 205,700
Area Under Max. Flood Extent (16 Sep 2010) Sq Km 15,119
Total Districts 36
Affected Districts 12
Total Tehsils 130
Affected Tehsils 36
Number of Damaged Houses Number of Damaged BHUs Number of Damaged Schools
Total: 43 Total: 2,070
Coverage and Gaps by Cluster Percentage of Coverage and Gaps by Cluster
131.29
100 150
6
12
5
7
8
15
0 5 10 15 20
Bhakkar
DG Khan
Layyah
RY Khan
Mianwali
Rajanpur
Muzaffargarh
26
240
37
85
137
0 500 1,000
Bhakkar
DG Khan
Layyah
RY Khan
Mianwali
Rajanpur
Muzaffargarh
592
202 70 66
68
235
33 236
0
200
400
600
800
Agriculture Education Nutrition Shelter
Coverage Gap
0%
20%
40%
60%
80%
100%
Food
(Source: GOP and Cluster)
Number of Damaged Schools Crop Area Destroyed (Acres)
Total: 1,853,875
Percentage of Coverage and Gaps by Cluster
1,107
1,000 1,500
99.06
148.15
143.50
136.05
31.95
355.98
400.26
0 400
Bhakkar
DG Khan
Layyah
RY Khan
Mianwali
Rajanpur
Muzaffargarh
Thousands
Agriculture Nutrition Education WASH Shelter
Gap Coverage
342IDPs
in 3 camps in 2 districts
(Source: GOP and Cluster)

PUNJAB PROVINCE
Humanitarian Hotspots
(Source: UC Ranking 2011)
Overview
Punjab experienced a combination of intense flash flooding in the mountainous west of the province
and slower onset, but economically highly destructive, riverine flooding in flatter, agriculturally
productive areas, particularly around the meeting point o
six million people were affected across 11 districts (six percent of the total population of the province,
or almost 19 percent of the population of the 11 affected districts). Estimates indicate that over
300,000 houses were destroyed across the province; while almost 200,000 more were badly damaged.
1.85 million acres of crops, mainly cotton, pulses, sugarcane, rice and fodder, were affected. Overall,
Muzaffargarh and Rajanpur districts were hardest hit, though
Layyah were amongst the worst affected in the province.
Displacement caused by the floods in Punjab was for the most part of limited duration. By October the
vast majority of displaced persons had returned to their ar
remained vast given the level of destruction of homes and disruption of basic services and livelihoods.
Approximately 550 persons are reported to remain displaced in Layyah and Muzaffargarh districts.
Food assistance, emergency shelter and WASH have been the major priorities of relief providers in
Punjab. Agriculture has also been a critical sector, given Punjab’s position as the breadbasket of the
country. A range of health, education and protection support has also be
geographical coverage of the humanitarian response has been uneven, due in part to a shortage of
partners across the flood-affected area. Most assistance has gone to Muzaffargarh and Rajanpur,
followed by D.G. Khan, Layyah and Rahim Yar Khan. Bhakkar, Mianwali and Khushab districts are
reported to have received little or no support.
Access has been a challenge in parts of the province, due to a range of factors including security
concerns and damaged infrastructure. Affected communi
the most vulnerable, given their distance from government facilities and services. This is particularly
the case for women and girls. Across the province, the floods have exacerbated underlying structural
problems in relation to factors such as access to basic services and land tenure.
Remaining challenges
� Ensuring equitable geographical distribution of assistance and access to the most vulnerable.
� Addressing the huge need for early recovery shelter support.
� Re-establishing livelihood opportunities.
� Repairing infrastructure, particularly road, water supply systems and irrigation schemes.
� Addressing underlying issues related to land tenure.
� Accessing communities in hard-to-reach parts of the province, includi
(Source: UC Ranking 2011)
Punjab experienced a combination of intense flash flooding in the mountainous west of the province
and slower onset, but economically highly destructive, riverine flooding in flatter, agriculturally
productive areas, particularly around the meeting point of the Indus and Chenab rivers. Approximately
six million people were affected across 11 districts (six percent of the total population of the province,
or almost 19 percent of the population of the 11 affected districts). Estimates indicate that over
00 houses were destroyed across the province; while almost 200,000 more were badly damaged.
1.85 million acres of crops, mainly cotton, pulses, sugarcane, rice and fodder, were affected. Overall,
Muzaffargarh and Rajanpur districts were hardest hit, though union councils in Rahim Yar Khan and
Layyah were amongst the worst affected in the province.
Displacement caused by the floods in Punjab was for the most part of limited duration. By October the
vast majority of displaced persons had returned to their areas of origin. Their needs, however,
remained vast given the level of destruction of homes and disruption of basic services and livelihoods.
Approximately 550 persons are reported to remain displaced in Layyah and Muzaffargarh districts.
emergency shelter and WASH have been the major priorities of relief providers in
Punjab. Agriculture has also been a critical sector, given Punjab’s position as the breadbasket of the
country. A range of health, education and protection support has also been delivered. However,
geographical coverage of the humanitarian response has been uneven, due in part to a shortage of
affected area. Most assistance has gone to Muzaffargarh and Rajanpur,
Yar Khan. Bhakkar, Mianwali and Khushab districts are
Access has been a challenge in parts of the province, due to a range of factors including security
concerns and damaged infrastructure. Affected communities in hard-to-reach areas are now among
the most vulnerable, given their distance from government facilities and services. This is particularly
the case for women and girls. Across the province, the floods have exacerbated underlying structural
in relation to factors such as access to basic services and land tenure.
Ensuring equitable geographical distribution of assistance and access to the most vulnerable.
Addressing the huge need for early recovery shelter support.
Repairing infrastructure, particularly road, water supply systems and irrigation schemes.
Addressing underlying issues related to land tenure.
reach parts of the province, including tribal areas.

SINDH PROVINCE
� Total Population (Estimates for 2010) 40,220,547IDPs in Camps
� Functional Camps: 132
� Closed Camps: 4,701
� Flood Affected Population 7,254,355
� Total Area (Sq Km) 140,927
� Area Under Max. Flood Extent (16 Sep 2010) Sq Km 16,694
� Total Districts 23
� Affected Districts 17
� Total Tehsils 98
� Affected Tehsils 58
Flood Affected Population and Damages
Affected Population Number of Damaged Houses % of Damaged Health Facilities Number of Damaged Schools Crop Area Destroyed (Acres)
Total: 7,254,355 Total: 876,249 Total: 43% Total: 5,209 Total: 2,482,158
Balochistan
FATA
Sindh
Punjab
Khyber
Pakhtunkhwa
Islamabad
Jammu andKashmir
INDIA
PAKISTAN
AFGHANISTAN
TAJIKISTANTURKMENISTAN
CHINA
0 500250
kms
105,083IDPs
in 132 camps in 16 districts
4,788 4,205
696211 188 154 132
0
2,500
5,000
Sep Oct Nov Dec Jan Feb Mar
Number of Camps
1,023 989
222133 128 110 105
0
500
1,000
Sep Oct Nov Dec Jan Feb Mar
Th
ou
san
ds
Population in Camps
396
490
615
790
893
895
920
939
0 400 800
Jamshoro
Larkhana
Kashmore
Shikarpur
Qambar Shadad …
Thatta
Dadu
Jacobabad
Thousands
84.09
22.00
75.84
64.56
74.95
107.98
168.11
156.44
0 100 200
Jamshoro
Larkhana
Kashmore
Shikarpur
Qambar Shadad …
Thatta
Dadu
Jacobabad
Thousands
37
60
37
79
40
60
60
64
0 50 100
Jamshoro
Larkhana
Kashmore
Shikarpur
Qambar Shadad …
Thatta
Dadu
Jacobabad
132
44
576
323
212
1,160
806
581
0 1,000
Jamshoro
Larkhana
Kashmore
Shikarpur
Qambar Shadad …
Thatta
Dadu
Jacobabad
25.03
400.12
110.19
497.38
177.80
224.63
457.85
0 400
Jamshoro
Larkhana
Kashmore
Shikarpur
Qambar Shadad …
Thatta
Dadu
Jacobabad
Thousands
� An estimated 7.2 million people, almost half
the rural population of the province, were
affected (Source: GOP)
� Over 875,000 homes were either damaged or
destroyed (Source: GOP)
� An estimated 2.5 million acres of arable land
were lost (Source: GOP)
� Approximately 100,000 people remain in
camps and spontaneous settlements
� The nutrition situation is critical far exceeding
the 15% emergency threshold (Source: UNICEF)
Coverage and Gaps by Cluster Percentage of Coverage and Gaps by Cluster
272 141 74 79
613
414
18 268
0
200
400
600
800
1,000
Agriculture Education Nutrition Shelter
Th
ou
san
ds
Coverage Gap
0%
20%
40%
60%
80%
100%
Food Nutrition WASH Agriculture Education Shelter
Gap Coverage
(Source: GOP and Cluster) (Source: GOP and Cluster)
Situation Overview

SINDH PROVINCE
Overview
The direct impact of the floods has been most protracted in Sindh. Vast swathes of the
province were left under water as the Indus broke through protective dykes, first in
Kashmore district in the north of the province and then in Thatta in the south. By mid-
August a huge offshoot of the river had formed, reaching into Qambar Shahdadkot and
eventually extending into Dadu and Jamshoro. Millions were either evacuated or forced to
flee their homes. An estimated 7.2 million people, representing close to half of the rural
population of the entire province, were affected. Over 875,000 homes were either damaged
or destroyed and 2.5 million acres of arable land were lost, in a province where the vast
majority of the rural population depends upon agriculture for its survival. This compounded
and exacerbated already limited access to clean water, inadequate basic hygiene and poor
health facilities.
Patterns of movement were highly complex. An estimated 1.5 million persons were in camps
or spontaneous settlements at the peak of the crisis. As floodwaters began to recede, large
scale return began, though the extent of the damage meant that a large proportion of the
returnees were without the most basic necessities and services. Many were forced into
secondary displacement.
Today in Sindh it is estimated that as many as 100,000 people may remain in camps and
spontaneous settlements. Many more continue to require comprehensive assistance in
return areas, spanning both relief and early recovery. A recent assessment by FAO and WFP
indicates that 2.5 million people in the province are food insecure. Added to this the
nutrition situation in Sindh is critical with a GAM rate of 26% in Southern Sindh and 22.9% in
Northern Sindh, far exceeding the 15% emergency threshold. The damage sustained by flood
defence structures and irrigation systems, and the heavily waterlogged soil, have left Sindh
extremely vulnerable to future disasters.
Remaining challenges
• Ensuring durable solutions for persons who remain in camps and spontaneous
settlements, and continued support in the meantime.
• Repair and improvement of flood defences in advance of the 2011 monsoon season.
• Addressing underlying structural issues including in relation to land rights and access to
basic services for the most vulnerable.
• Rehabilitation of damaged irrigation systems.
• Re-establishment of livelihoods across flood affected areas.
(Source: UC Ranking 2011)