Pakistan Economic Forum IV Economic Forum IV IV. Availability & Cost Competitiveness of Energy Mr....
80
Pakistan Economic Forum IV 2018
Transcript of Pakistan Economic Forum IV Economic Forum IV IV. Availability & Cost Competitiveness of Energy Mr....
PakistanEconomic Forum IV2 0 1 8
2 0 1 8
PakistanEconomic Forum IV
AcknowledgementThe PBC would like to acknowledge the contributions made by the following
members of the PEF panels in the preparation of this document.
I. Sustainable Macro-Economic GrowthDr. Ishrat Husain (Panel Chair)
Mr. Arshad Zuberi
Mr. Bashir Ali Mohammad
Mr. Shaukat Tarin S.I.
Syed Salim Raza
Mr. Sakib Sherani
Senator Osman Saifullah Khan
Mr. Sayem Ali
II. Equitable Fiscal PolicyS.M. Shabbar Zaidi (Panel Chair)
Mr. Abrar Hasan
Mr. Haider Patel
Mr. Irfan Chawala
Mr. Iqbal Ali Lakhani
Mr. Masoud Naqvi
Mr. Nasim Beg
Ms. Naz Khan
III. Make in Pakistan1.
2.
3.
4.
5.
6.
7.
8.
9.
10
11.
12.
13.
14.
15.
16.
Mr. Ali Suleman Habib (Panel Chair)
Mr. Abdul Razzak Dawood
Mr. Almas Haider
Mr. Azam Faruque
Mr. Bashir Ali Mohammad
Mr. Iqbal Lakhani
Mr. Murad Saigol
Mr. Parvez Ghias
Mr. Saquib Shirazi
Mr. Shabbir Diwan
Mr. Shahid Hussain
Mr. Sikandar Mustafa Khan
Mr. Sohail P. Ahmed
Mr. Shahid Soorty
Syed Yawar Ali
Mr. Towfiq Habib Chinoy
1.
2.
3.
4.
5.
6.
7.
8.
1.
2.
3.
4.
5.
6.
7.
8.
Pak
ista
n E
con
om
ic F
oru
m I
V

Pak
ista
n E
con
om
ic F
oru
m I
V
IV. Availability & Cost Competitiveness of EnergyMr. Khalid Mansoor (Panel Chair)
Mr. Javed Akbar
Mr. Muhammad Saqib
Mr. Mumtaz Hasan Khan
Mr. Nadeem Babar
Syed Muhammad Ali
Mr. Tayyab Tareen
Mr. Yacoob Sattar
V. Pakistan’s Agriculture, Dairy and Livestock PotentialSyed Yawar Ali (Panel Chair)
Mr. Aamir Mahmood Mirza
Mr. Afaq A. Tiwana
Mr. Ahmed Sajjad
Dr. Asif Ali Shah
Mr. Khalil Sattar
Mr. Rana Sohail Sharif
Mr. Sajid Iqbal Sindhu
Mr. Usman Javaid
Mr. Abdul Wahab
Mr. Afzaal Rizvi
Capt. Arif Nadeem
Mr. Arshad Uddin Ahmed
Mr. Bilal Tata
Mr. Rashid Haleem
Mr. Saboor Ahmed
Mr. Samie Cashmiri
Mr. Saud Pasha
Mr. Sikandar Mustafa Khan
Mr. Sulaiman Monnoo
Syed Faisal Hasan
1.
2.
3.
4.
5.
6.
7.
8.
9.
10
11.
12.
13.
14.
15.
16.
17.
18.
19
20.
21.
1.
2.
3.
4.
5.
6.
7.
8.
THE PAKISTANBUSINESSCOUNCILPROFILE
01

The Pakistan Business Council (PBC) is a business policy advocacy platform, established in 2005 by 14 (now 72) of Pakistan’s largest private-sector businesses and conglomerates, including multinationals. PBC businesses cover nearly all sectors of the formal economy. It is a professionally-run organization headed by a full-time chief executive o�cer.
The PBC is a not-for-profit entity, registered under Section 42 of the Companies Ordinance 1984. Though it is not required under the law to do so, the PBC follows to the extent possible, the Code of Corporate Governance as applicable to listed companies.
The PBC is a pan-industry advocacy group. It is not a trade body nor does it advocate for any specific business sector. Rather, its key advocacy thrust is on easing barriers to allow Pakistani businesses to compete in regional and global arenas. The PBC conducts research and holds conferences and seminars to facilitate the flow of relevant information to all stakeholders in order to help create an informed view on the major issues faced by Pakistan.
The PBC works closely with the relevant government departments, ministries, regulators and institutions, as well as other stakeholders including professional bodies, to develop consensus on major issues which impact the conduct of business in and from Pakistan. The PBC has submitted key position papers and recommendations to the government on legislation and other government policies a�ecting businesses. It also serves on various taskforces and committees of the Government of Pakistan as well as those of the State Bank, SECP and other regulators with the objective to provide policy assistance on new initiatives and reforms.
The Pakistan Business Council:An Overview
THE PAKISTAN BUSINESS COUNCIL - PROFILE
Pak
ista
n E
con
om
ic F
oru
m I
V
The PBC’s Founding Objectives
To provide for the formation and exchange of views on any question connected with the conduct of business in and from Pakistan.
To conduct, organize, set up, administer and manage campaigns, surveys, focus groups, workshops, seminars and field works for carrying out research and raising awareness in regard to matters a�ecting businesses in Pakistan.
To acquire, collect, compile, analyze, publish and provide statistics, data analysis and other information relating to businesses of any kind, nature or description and on opportunities for such businesses within and outside Pakistan.
To promote and facilitate the integration of businesses in Pakistan into the World economy and to encourage in the development and growth of Pakistani multinationals.
To interact with governments in the economic development of Pakistan and to facilitate, foster and further the economic, social and human resource development of Pakistan.
Pak
ista
n E
con
om
ic F
oru
m I
V
THE PAKISTAN BUSINESS COUNCIL - PROFILE
0
Pak
ista
n E
con
om
ic F
oru
m I
V
The Board of Directors
Mr. Muhammad Ali Tabba (Chairman) Lucky Cement Limited
Mr. Towfiq Chinoy (Vice-Chairman) International Industries Limited
Mr. Abdul Razak DawoodDescon Engineering
Mr. Abrar HasanNational Foods Limited
Mr. Ali S. HabibIndus Motor Company Limited
Mr. Arif HabibPakArab Fertilizer Limited
Mr. Bashir Ali MuhammadGul Ahmed Textile Mills Limited
Mr. Iqbal LakhaniColgate Palmolive (Pakistan) Limited
Mr. Nauman AnsariBank Alfalah Limited
Mr. Muhammad AurangzebHabib Bank Limited
Mr. Shabbir DiwanGatron Industries Limited
Ms. Shazia SyedUnilever Pakistan Limited
Syed Yawar AliNestle Pakistan Limited
Dr. Zeelaf MunirEnglish Biscuit Manufacturers Limited
Mr. Ehsan Malik (CEO)The Pakistan Business Council
THE PAKISTAN BUSINESS COUNCIL - PROFILE
The PBC is neither a trade nor is it a representative body for a specific industry. It does not
advocate sector and industry specific issues; instead, its advocacy thrust is on improving the
general business environment of the country.
The PBC represents private businesses in Pakistan, with substantial investments in
manufacturing and the financial / services sectors. To ensure quality of membership, the
qualifying threshold for membership has been deliberately kept high, so that no more than
approx. 100 of existing private sector businesses can potentially qualify. To ensure ‘frontline
business intellectual input’, the authorized representative invariably has to be the Chairman /
President / CEO / MD of the member company.
The current qualifying threshold for a non-financial sector company to be a member is to have
an equity of at least Rs. 1.0 billion, or Net Fixed Assets equivalent to this value. For a financial
sector company, the qualifying requirement is a paid-up capital of at least Rs. 2.0 billion.
Qualifying thresholds are for individual companies, and group companies’ paid-up capitals and
group companies’ fixed assets cannot be clubbed together for meeting the qualification criteria.
To further ensure participation of only serious businesses, the joining fee and the annual
subscription fee have been kept at premium levels of Rs. 3.0 million and Rs. 2.0 million
respectively. Finally, the membership criteria also stipulate that meeting the financial qualifying
threshold is not a guarantee for acceptance; companies desirous of PBC membership have to
be invited to join the PBC, and membership is subject to Board approval.
Membership Criteria
Pak
ista
n E
con
om
ic F
oru
m I
V
THE PAKISTAN BUSINESS COUNCIL - PROFILE

06
Sector
Total Members in Large-Scale Manufacturing
Member Companies
Agro Industries
Cement
Chemicals / Fertilizer
Energy
Engineering
Fast Moving Consumer Goods
Packaging Material
Pharmaceuticals and Healthcare
Textiles
1
2
9
2
6
17
3
5
9
54
Large-Scale Manufacturing
Total Members in the Services Sector
Financial Services
Hospitality
Logistics / Courier
Utilities
Telecommunication
11
1
2
3
1
18
Services
PBC currently has 72 members, whose businesses cover nearly all sectors of the formal econo-
my. The sector wise representation (in alphabetical order) is detailed below:
The PBC Members by Sector
THE PAKISTAN BUSINESS COUNCIL - PROFILE

The PBC’s Member Companies
Pak
ista
n E
con
om
ic F
oru
m I
V
THE PAKISTAN BUSINESS COUNCIL - PROFILE
The PBC’s Member Companies
Pak
ista
n E
con
om
ic F
oru
m I
V
THE PAKISTAN BUSINESS COUNCIL - PROFILE

09
27 MNC’s from 13 Countries
USA
UK
UAE
Switzerland
Japan
THE PAKISTAN BUSINESS COUNCIL - PROFILE
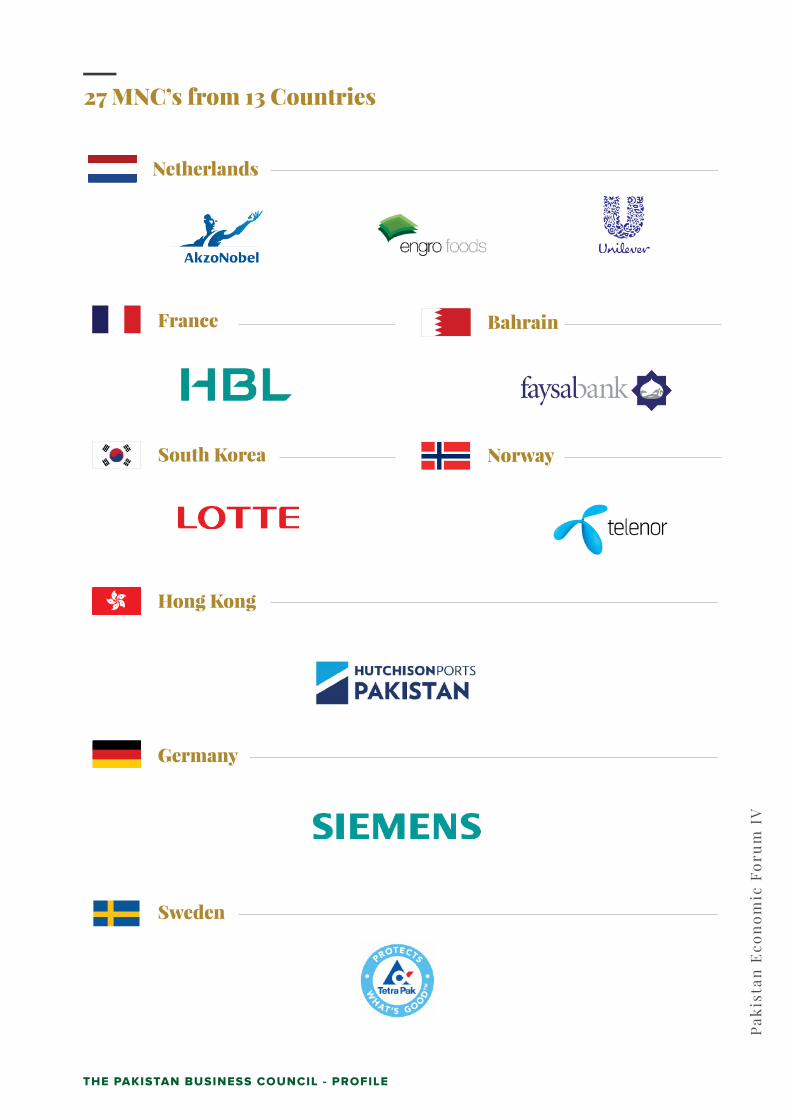
27 MNC’s from 13 Countries
BahrainFrance
South Korea
Hong Kong
Germany
Sweden
Netherlands
Norway
Pak
ista
n E
con
om
ic F
oru
m I
V
THE PAKISTAN BUSINESS COUNCIL - PROFILE

11
Nominated Representatives of Member Companies
Abbott Laboratories Pakistan
AkzoNobel Pakistan Limited
AlliedBankLtd.
Amreli Steels Limited
Artistic Milliners (Pvt) Limited
Asian Food Industries
Bank Alfalah Limited
Bank AL Habib Limited
Cherat Cement Company Ltd.
Colgate Palmolive
Dalda Foods Limited
Dawood Hercules Corporation Ltd.
Descon
EFU General Insurance
English Biscuit Manufacturers
Engro Corporation
Engro Foods Limited
Faysal Bank
Ferozsons Laboratories
Gatron (Industries) Limited
Getz Pharma
GlaxoSmithKline Pakistan
Gul Ahmed
Habib Bank Ltd.
Hascol Petroleum Limited
Hub Power Company Limited
ICI Pakistan
Indus Dyeing & Manufacturing
Indus Motor Company
Interloop (Pvt.) Limited
International Industries Ltd.
JDW Sugar Mills Ltd.
JS Bank Limited
K-Electric
K&N’s Foods (Pvt.) Limited
Lotte Chemicals
Syed Anis Ahmed (MD)
Jehanzeb Khan (CEO)
Mohammad Naeem Mukhtar (Chairman)
Abbas Akberali (Chairman)
Yaqoob Ahmed (Chairman)
Shahid Iqbal (CEO)
Nauman Ansari (CEO)
Mansoor A. Khan (CEO)
Azam Faruque (Chief Executive)
Iqbal Lakhani (Chairman)
Perwaiz Khan (CEO)
Inam ur Rehman (CEO)
Abdul Razak Dawood (Chairman)
Saifuddin Zoomkawala (Chairman)
Dr. Zeelaf Munir (MD & CEO)
Ghias Khan (President & CEO)
Ali Ahmed Khan (CEO)
Yousuf Hussain (CEO)
Osman Khalid Waheed (CEO)
Shabbir Diwan (Director)
Khalid Mahmood (Managing Director)
Azizul Huq (Managing Director)
Bashir Ali Mohammed (Chairman)
Muhammad Aurangzeb
Mumtaz Hasan Khan (Chairman)
Khalid Mansoor (CEO)
Asif Jooma (Chief Executive)
Imran Ahmed (Director)
Ali S. Habib (Chairman)
Musadaq Zulqarnain (CEO)
Towfiq Chinoy (Managing Director)
Jahangir Khan Tareen (CEO)
Khalid Imran (President & CEO)
Muhammad Tayyab Tareen (CEO)
Khalil A. Sattar (CEO)
Humair Ijaz (CEO)
Abbott Laboratories
AkzoNobel NV
IbrahimGroup
Amreli Steels
Artistic Milliners
Mayfair
Abu Dhabi Group
Dawood Habib Group & Friends/Associates
Ghulam Faruque Group
Lakson Group
Dalda Foods
Dawood Group
Descon Group
EFU
English Biscuit Manufacturers
Engro Corporation
FrieslandCampina Holdings
Ithmaar Bank B.S.C (Bahrain)
Ferozsons Laboratories
Gani & Tayub / Gatron Group
Getz Group
GlaxoSmithKline
Gul Ahmed Group
Habib Bank Limited
Hascol
Hub Power Company Limited
Yunus Brothers Group
Indus Group
The House of Habib
Interloop
IIL Group
JDW Group
JS Group
KES Power Limited
K&N’s Foods
Lotte
PBC Executive Member Representative and Designation Group Company
THE PAKISTAN BUSINESS COUNCIL - PROFILE

Nominated Representatives of Member Companies
Lucky Cement
Martin Dow Limited
Mega Conglomerate
Millat Tractors Ltd
National Foods Ltd
Nestlé Pakistan Limited
Nishat Mills Ltd.
Packages Limited
Pakarab Fertilizers Ltd.
Pakistan Services Limited
Pakistan TelecommunicationCompany Limited
Pakistan Tobacco Company Ltd.
Philip Morris (Pakistan) Ltd.
Reckitt Benckiser
Saif Textile Mills
Sapphire Textile
Shan Foods (Pvt) Limited
Soorty Enterprises (Pvt.) Limited
South Asia Pakistan Terminals
SICPA Inks Pakistan (Pvt.) Limited
Shirazi Investments
Siemens Pakistan Engineering
Soneri Bank Limited
Standard Chartered Bank
Synthetic Products Enterprises
Tapal Tea Ltd
TCS (Private) Limited
Telenor Pakistan (Pvt) Limited
Tetra Pak Pakistan
The Coca-Cola Export Corporation
TPL Trakker Limited
Tufail Chemicals
United Bank Limited
Unilever Pakistan Limited
Muhammad Ali Tabba (CEO)
Jawed Akhai (Chairman & CEO)
Habib Ullah Khan (Chairman)
Sikandar Mustafa Khan (Chairman)
Abrar Hasan (CEO)
Syed Yawar Ali (Chairman)
Mian Umer Mansha (CEO)
Syed Hyder Ali (Managing Director)
Arif Habib (Chairman)
Murtaza Hashwani (CEO)
Dr. Daniel Ritz (CEO)
Graeme Amey (Managing Director)
Alexander Reisch (Managing Director)
Fahad Ashraf (CEO)
Osman Saifullah Khan (Chief Executive)
Nadeem Abdullah (Chief Executive)
Sikander Tiwana (Chief Executive)
Shahid Rashid Soorty (CEO)
Syed Rashid Jamil (CEO)
Asif Ikram (CEO)
Saquib Shirazi (Director)
Helmut Von Struve (MD & CEO)
Mohammad Aftab Manzoor (CEO)
Shahzad Dada (CEO)
Zia Hyder Naqi (CEO)
Aftab F. Tapal (CEO)
Khalid Nawaz Awan (CEO)
Irfan Wahab Khan (CEO)
Jorge Montero (Managing Director)
Rizwan Ullah Khan (Country Head)
Ali Jameel (CEO)
Zubair F. Tufail (CEO)
Sima Kamil (President & CEO)
Shazia Syed (Chairperson & CEO)
Yunus Brothers Group
Seatle (Private) Limited
Mega Group
Millat Group
National Food
Nestlé
Nishat Group
Packages / Ali Group
Fatima Group
Hashoo Group
Etisalat International Pakistan
British American Tobacco
Philip Morris International
Reckitt Benckiser
Saif Group
Sapphire Group
Shan Foods
Soorty Group
Hutchison Port Holdings
SICPA SA.
Shirazi Group
Siemens
Rupali Group
Standard Chartered Bank
SPEL Group
Tapal Tea
TCS (Private) Limited
Telenor/Telenor Pakistan B.V.
Tetra Laval Group
Coca-Cola Export Corporation
TPL Trakker Limited
Tufail Group
Bestway Group (UK)
Unilever
PBC Executive Member Representative and Designation Group Company
Pak
ista
n E
con
om
ic F
oru
m I
V
THE PAKISTAN BUSINESS COUNCIL - PROFILE
1
2014
10.1%10.6%
16.2%
18.4%
13.1%
18.1%
PBC’s contribution as a percentage of
National GDP
PBC’s contribution as a percentage of
National Tax Receipts
PBC’s contribution as a percentage of
Pakistan’s Exports
2015
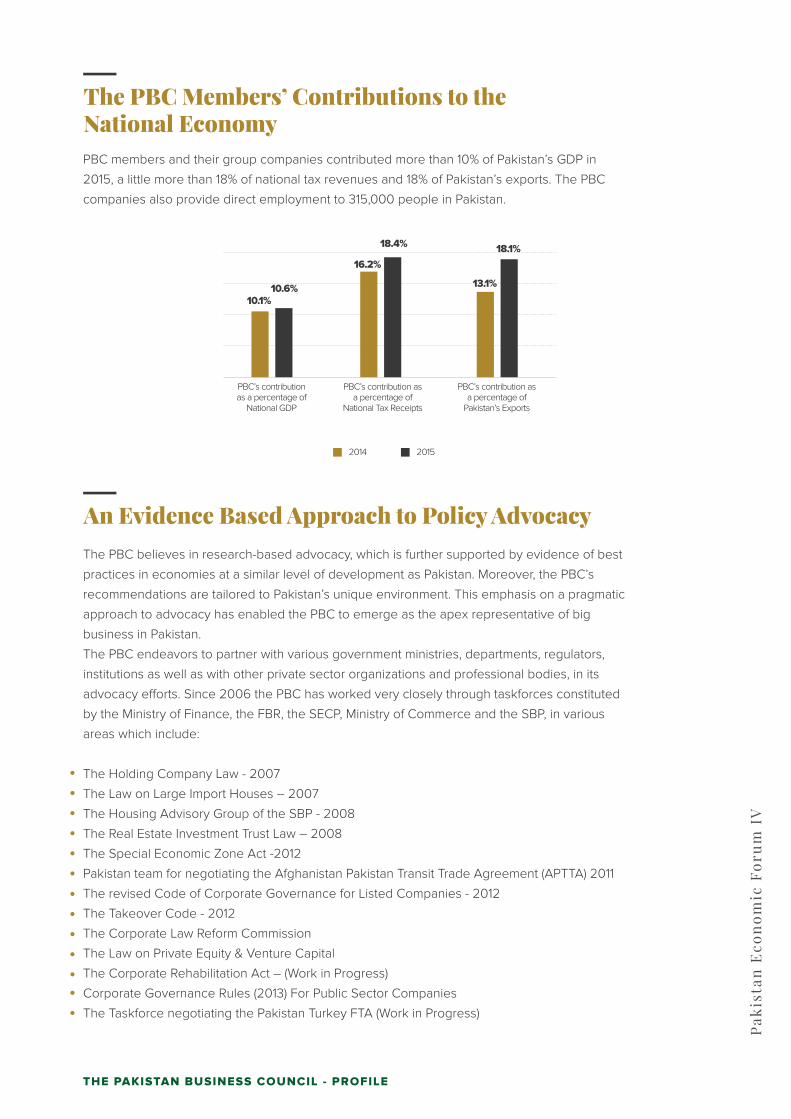
PBC members and their group companies contributed more than 10% of Pakistan’s GDP in
2015, a little more than 18% of national tax revenues and 18% of Pakistan’s exports. The PBC
companies also provide direct employment to 315,000 people in Pakistan.
The PBC Members’ Contributions to theNational Economy
The PBC believes in research-based advocacy, which is further supported by evidence of best
practices in economies at a similar level of development as Pakistan. Moreover, the PBC’s
recommendations are tailored to Pakistan’s unique environment. This emphasis on a pragmatic
approach to advocacy has enabled the PBC to emerge as the apex representative of big
business in Pakistan.
The PBC endeavors to partner with various government ministries, departments, regulators,
institutions as well as with other private sector organizations and professional bodies, in its
advocacy e�orts. Since 2006 the PBC has worked very closely through taskforces constituted
by the Ministry of Finance, the FBR, the SECP, Ministry of Commerce and the SBP, in various
areas which include:
The Holding Company Law - 2007
The Law on Large Import Houses – 2007
The Housing Advisory Group of the SBP - 2008
The Real Estate Investment Trust Law – 2008
The Special Economic Zone Act -2012
Pakistan team for negotiating the Afghanistan Pakistan Transit Trade Agreement (APTTA) 2011
The revised Code of Corporate Governance for Listed Companies - 2012
The Takeover Code - 2012
The Corporate Law Reform Commission
The Law on Private Equity & Venture Capital
The Corporate Rehabilitation Act – (Work in Progress)
Corporate Governance Rules (2013) For Public Sector Companies
The Taskforce negotiating the Pakistan Turkey FTA (Work in Progress)
An Evidence Based Approach to Policy Advocacy
Pak
ista
n E
con
om
ic F
oru
m I
V
THE PAKISTAN BUSINESS COUNCIL - PROFILE
The Pakistan Business Council first developed in 2011 a National Economic Agenda (NEA)
which covered five areas of vital importance for the socio-economic uplift and development of
Pakistan. The PBC has worked with major stakeholders, including political parties, in an e�ort
to achieve a consensus on a common national agenda which cuts across the political divide.
As part of these e�orts, in April 2011 the PBC convened a meeting in Islamabad at which
senior leadership of the five major political parties agreed to work to develop a common
national agenda. In 2013 the NEA was revisited by the PBC in order to update it and to use it
as an advocacy tool with the new government which took o�ce in May 2013. With elections
scheduled to be held in mid-2018, the PBC is currently in the process of updating the NEA and
scheduling preliminary contacts with the major stakeholders.
Building National Consensus on Major Issues
The Pakistan Economic Forum (PEF) is an annual event hosted by the PBC. The inaugural event
of the PEF was held in 2011. The PEF brings together the best available intellectual capital in the
country, to debate on major issues which are confronting Pakistan. The panels of the Forum,
headed by Chairs and Co-Chairs and comprising sector specialists, debate various issues and
come up with pragmatic recommendations. These recommendations are then shared with a
wider audience in the form of PBC position papers. The 4th Edition of the PEF was held on
January 17th, 2018 in Islamabad. The Prime Minister of Pakistan led the Government delegation
to the Forum and also spoke on the occasion. He assured the audience of working closely with
the private sector and the PBC to support the “Make in Pakistan” initiative. He also announced
the setting up of a Committee comprising of representatives of the private sector and the
government to resolve issues which are hampering domestic manufacturing.
Following panels shared their recommendations at the 4th PEF:
Macroeconomic Stability & Growth
Fiscal Policy Reform
The Make in Pakistan Initiative
Towards Pakistan’s Energy Security & Competitiveness
Improving Competitiveness of Pakistan’s Agriculture, Dairy & Livestock Sectors
The Pakistan Economic Forum
Pak
ista
n E
con
om
ic F
oru
m I
V
THE PAKISTAN BUSINESS COUNCIL - PROFILE
The PBC’s e�orts to improve the business climate and its emphasis on improving the
competitiveness of Pakistani businesses has led to the PBC being recognized as the apex
representative body of the private sector in Pakistan. In pursuing its objectives, the PBC has
partnered with various institutions and policy- making forums, such as:
The PBC has signed an MOU with MEDEF (Movement of the French Enterprises)
The PBC has signed an MOU with the Confederation of India Industry (CII).
The PBC has signed an MOU with the Indian Council for Research on International
Economic Relations (ICRIER).
The PBC has signed an MOU with the Federation of Korean Industry (FKI).
The PBC has signed an MOU with the International Finance Corporation (IFC).
The PBC has signed an MoU with the Association of Chartered Certified Accountants (ACCA).
The PBC has signed an MoU with Institute of Chartered Accountants of Pakistan (ICAP).
The CEO of the PBC serves as a director on board of the Board of Investment (BOI).
The CEO of PBC serves on the Trade Policy Advisory Committee.
The CEO and a previous Chairman of the PBC were the only private sector representatives
on the Committee set up for the development of Special Economic Zones in Pakistan.
The PBC is represented by its CEO on the Taskforce constituted by the Planning Commission
for the Development of the Private Sector.
The CEO of PBC has been nominated on the Implementation Committee on Expo 2020.
The Director Research of the PBC was part of the Pakistani team that negotiated the current
Afghanistan Pakistan Transit Trade Agreement.
The PBC has been nominated by the Ministry of Commerce as the Secretariat in Pakistan for
the Pakistan India Joint Business Forum (PIJBF).
The PBC has been nominated by the Ministry of Commerce as the Secretariat in Pakistan for
the Afghanistan Pakistan Joint Business Council (APJBC).
Two representatives of the PBC serve on the Taskforce constituted to negotiate the
proposed Pakistan Turkey Free Trade Agreement.
PBC is represented on PSQCA’s Halal Technical Committee by its Company Secretary.
PBC is represented on the PBC-SEPA Joint Technical Committee formed to review the
Biodegradable Plastics Rules in Sindh.
PBC is represented by its Company Secretary on the Technical Committee formed to finalize
Rules for the Sindh Food Authority.
Recognition of the PBC’s E�orts
Pak
ista
n E
con
om
ic F
oru
m I
V
THE PAKISTAN BUSINESS COUNCIL - PROFILE
16
PBC advocates a national consensus around a 'Make in Pakistan' thrust to deliver jobs, value
added exports and import substitution of goods and services and for the equitable broadening of
the tax base, consolidation of Pakistani businesses to promote scale and develop global
competitiveness.
Reversing the current premature deindustrialization of Pakistan with an emphasis on using the
manufacturing sector for creating jobs, value added exports and revenue.
A complete moratorium on the signing of new Free Trade Agreements (FTA) pending a review of
the existing FTAs which have been signed by Pakistan.
Broadening the tax base through equitable and e�ective taxation policies and practices.
Creating an environment to ensure that CPEC leads to incremental jobs and growth for Pakistan.
The simplification of government processes to ease (and bring down the cost of) doing
business
An environment to reposition Pakistan in the Information, Communications and Technology
Sector
Greater market access for Pakistani exports in the major markets of the world.
Constant monitoring of the industrial and trade policies being pursued by the Government of
Pakistan with the aim ensuring a level playing field for Pakistani businesses.
Greater regional economic integration and especially trade with India but subject to a level
playing field.
Current Areas of Policy Advocacy
THE PAKISTAN BUSINESS COUNCIL - PROFILE

Major Accomplishments since 2013
The PIJBF has been notified by the governments of India & Pakistan with the mandate to
pursue recommendations for the normalization of India Pakistan trade. Both governments have
nominated 15 top business persons from their respective countries. Since its inception in 2013,
the PIJBF has met ‘5’ times.
Appointed secretariat in Pakistan for the Pakistan India Joint Business Forum (PIJBF)
The PBC worked with the MoC to develop a list of items which should be on Pakistan’s
Sensitive List for trade with India under SAFTA. PBC is lobbying with the MoC to ensure that
industry’s concerns vis-à-vis opening up of trade with India and a level playing field for
Pakistan’s exports to India are addressed.
Worked with the Ministry of Commerce to Develop Pakistan’s SAFTA Sensitive List
The APJBC has been notified by the governments of Afghanistan and Pakistan with the
objective to help facilitate trade and investment between the two countries.
Appointed secretariat in Pakistan for the Afghanistan Pakistan Joint Business Council (APJBC)
The Chairman FBR has formed a Joint Working Group (JWG) of the PBC & Senior Islamabad
based Members of the FBR. The JWG has been tasked with helping the FBR plug revenue
leakages as well as work to remove the operational issues faced by businesses in general and
PBC members in particular.
PBC / FBR Joint Working Group
PBC is acting as the “Think Tank” to the Ministry of Commerce as it negotiates the 2nd Phase
of the Pak China FTA. Major shortcomings in the first Phase of the China Pakistan FTA were
highlighted by the PBC and the government as a result is taking a more cautious approach to
the 2nd Phase of the FTA.
Providing input to the Ministry of Commerce as it Negotiates the 2nd Phase of the Pak China FTA
PBC along with the BOI and the French Embassy in Pakistan organized a Business Delegation
in June 2014.
Organizing a Pakistan Business Delegation to France
The PBC has recommended to the Government of Pakistan to not sign the proposed BIT in its
present form as proposed by the US as it can potentially harm the interests of Pakistani
businesses. The PBC has made specific recommendations on how the terms of this BIT can be
improved to better ensure that interests of Pakistan is not compromised.
Review of the proposed Pak-USA BIT Agreement for Board of Investment
Pak
ista
n E
con
om
ic F
oru
m I
V
THE PAKISTAN BUSINESS COUNCIL - PROFILE

Vision
Centre of Excellence in Responsible Business (CERB)
The Centre of Excellence in Responsible Business (CERB) is the first of the Pakistan
Business Council’s (PBC) outreach initiatives to build capacity and capability of
businesses in Pakistan.
To be a multi-sector business coalition assisting Pakistani enterprises to pursue
sustainable value creation in the short, medium and long term.
Mission
To engage with businesses and industry leaders and enable the transformation towards
the conduct of responsible business in Pakistan
To leverage private sector growth for inclusive development, poverty reduction and
sustainability by following the UN Sustainable Development Goals (SDG) framework.
CERB will leverage global and local best practices to inculcate a change in mind-set
among businesses including small and medium-sized enterprises. It will have knowledge
partners with researched resources to contribute to its mission.
CERB comprises of Online Research & Innovation Initiative and two inter-dependent
business units.
Online Research and Innovation Initiative
This will be developed as an online research portal with a determined e�ort to integrate the business
research community with industry to develop world class research to support CERB’s strategic
objectives outlined in its Mission.
Ethics, Values and Governance Forum
This forum promotes responsible practices which strengthen the formal sector in pursuit of sustainable
value creation.
Inclusive and Sustainable Development Forum
This forum focuses on generating livelihoods, promoting women’s empowerment and
decoupling growth from its impact on the environment.
CERB’s outcomes
CERB aims to impact private sector to create wealth through the conduct of responsible
business in a competitive global economy. It will assist businesses to maintain a competitive
edge through high value research and dissemination of knowledge. It will use real time
business knowledge and will turn it into sustainable competitive advantage for the private
sector.
Pak
ista
n E
con
om
ic F
oru
m I
V
THE PAKISTAN BUSINESS COUNCIL - PROFILE
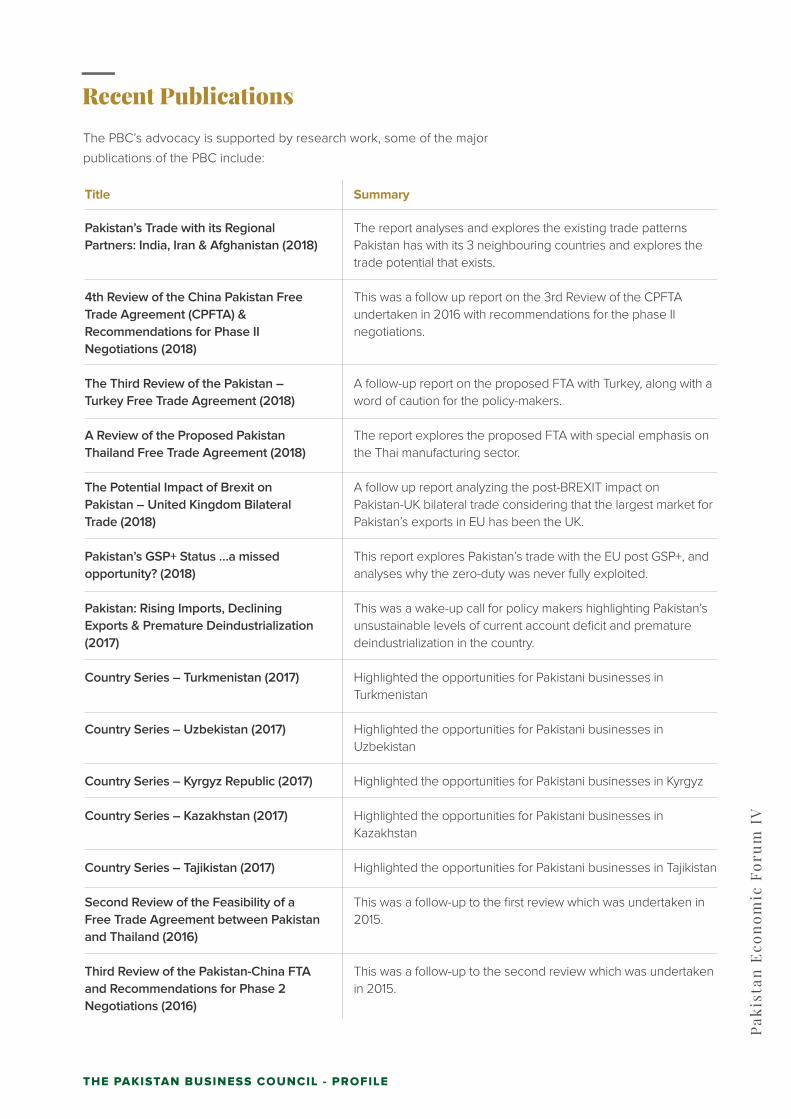
Recent Publications
The PBC’s advocacy is supported by research work, some of the major
publications of the PBC include:
Pakistan’s Trade with its Regional Partners: India, Iran & Afghanistan (2018)
4th Review of the China Pakistan Free Trade Agreement (CPFTA) & Recommendations for Phase II Negotiations (2018)
The Third Review of the Pakistan – Turkey Free Trade Agreement (2018)
A Review of the Proposed Pakistan Thailand Free Trade Agreement (2018)
The Potential Impact of Brexit on Pakistan – United Kingdom Bilateral Trade (2018)
Pakistan’s GSP+ Status …a missed opportunity? (2018)
Pakistan: Rising Imports, Declining Exports & Premature Deindustrialization (2017)
Country Series – Turkmenistan (2017)
Country Series – Uzbekistan (2017)
Country Series – Kyrgyz Republic (2017)
Country Series – Kazakhstan (2017)
Country Series – Tajikistan (2017)
Second Review of the Feasibility of a Free Trade Agreement between Pakistan and Thailand (2016)
Third Review of the Pakistan-China FTA and Recommendations for Phase 2 Negotiations (2016)
The report analyses and explores the existing trade patterns Pakistan has with its 3 neighbouring countries and explores the trade potential that exists.
This was a follow up report on the 3rd Review of the CPFTA undertaken in 2016 with recommendations for the phase II negotiations.
A follow-up report on the proposed FTA with Turkey, along with a word of caution for the policy-makers.
The report explores the proposed FTA with special emphasis on the Thai manufacturing sector.
A follow up report analyzing the post-BREXIT impact on Pakistan-UK bilateral trade considering that the largest market for Pakistan’s exports in EU has been the UK.
This report explores Pakistan’s trade with the EU post GSP+, and analyses why the zero-duty was never fully exploited.
This was a wake-up call for policy makers highlighting Pakistan’s unsustainable levels of current account deficit and premature deindustrialization in the country.
Highlighted the opportunities for Pakistani businesses in Turkmenistan
Highlighted the opportunities for Pakistani businesses in Uzbekistan
Highlighted the opportunities for Pakistani businesses in Kyrgyz
Highlighted the opportunities for Pakistani businesses in Kazakhstan
Highlighted the opportunities for Pakistani businesses in Tajikistan
This was a follow-up to the first review which was undertaken in 2015.
This was a follow-up to the second review which was undertaken in 2015.
Title Summary
Pak
ista
n E
con
om
ic F
oru
m I
V
THE PAKISTAN BUSINESS COUNCIL - PROFILE
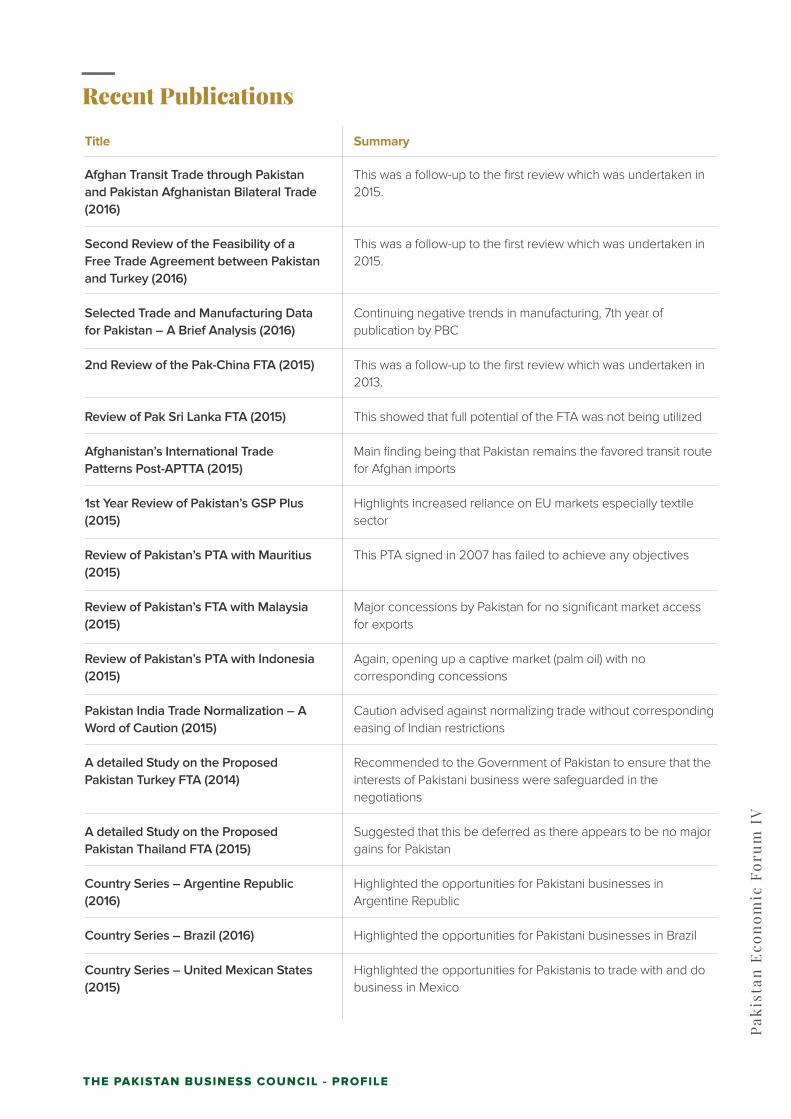
Recent Publications
Afghan Transit Trade through Pakistan and Pakistan Afghanistan Bilateral Trade (2016)
Second Review of the Feasibility of a Free Trade Agreement between Pakistan and Turkey (2016)
Selected Trade and Manufacturing Data for Pakistan – A Brief Analysis (2016)
2nd Review of the Pak-China FTA (2015)
Review of Pak Sri Lanka FTA (2015)
Afghanistan’s International Trade Patterns Post-APTTA (2015)
1st Year Review of Pakistan’s GSP Plus (2015)
Review of Pakistan’s PTA with Mauritius (2015)
Review of Pakistan’s FTA with Malaysia (2015)
Review of Pakistan’s PTA with Indonesia (2015)
Pakistan India Trade Normalization – A Word of Caution (2015)
A detailed Study on the Proposed Pakistan Turkey FTA (2014)
A detailed Study on the Proposed Pakistan Thailand FTA (2015)
Country Series – Argentine Republic (2016)
Country Series – Brazil (2016)
Country Series – United Mexican States (2015)
This was a follow-up to the first review which was undertaken in 2015.
This was a follow-up to the first review which was undertaken in 2015.
Continuing negative trends in manufacturing, 7th year of publication by PBC
This was a follow-up to the first review which was undertaken in 2013.
This showed that full potential of the FTA was not being utilized
Main finding being that Pakistan remains the favored transit route for Afghan imports
Highlights increased reliance on EU markets especially textile sector
This PTA signed in 2007 has failed to achieve any objectives
Major concessions by Pakistan for no significant market access for exports
Again, opening up a captive market (palm oil) with no corresponding concessions
Caution advised against normalizing trade without corresponding easing of Indian restrictions
Recommended to the Government of Pakistan to ensure that the interests of Pakistani business were safeguarded in the negotiations
Suggested that this be deferred as there appears to be no major gains for Pakistan
Highlighted the opportunities for Pakistani businesses in Argentine Republic
Highlighted the opportunities for Pakistani businesses in Brazil
Highlighted the opportunities for Pakistanis to trade with and do business in Mexico
Title Summary
Pak
ista
n E
con
om
ic F
oru
m I
V
THE PAKISTAN BUSINESS COUNCIL - PROFILE

Recent Publications
Country Series – Ghana (2015)
Country Series – Chile (2016)
Country Series – Mozambique (2015)
Country Series – Iran (2015)
Country Series – The Russian Federation (2016)
Country Series – Ethiopia (2015)
Country Series – Nigeria (2015)
Country Series – South Africa (2016)
Country Series – Angola (2015)
Highlighted the opportunities for Pakistani businesses in Ghana
Highlighted the opportunities for Pakistani businesses in Chile
Highlighted the opportunities for Pakistani businesses in Mozambique
Highlighted the opportunities for Pakistani businesses in Iran
Highlighted the opportunities for Pakistani businesses in Russia
Highlighted the opportunities for Pakistani businesses in Ethiopia
Highlighted the opportunities for Pakistani businesses in Nigeria
Highlighted the opportunities for Pakistani businesses in South Africa
Highlighted the opportunities for Pakistani businesses in Angola
Title Summary
Pak
ista
n E
con
om
ic F
oru
m I
V
THE PAKISTAN BUSINESS COUNCIL - PROFILE
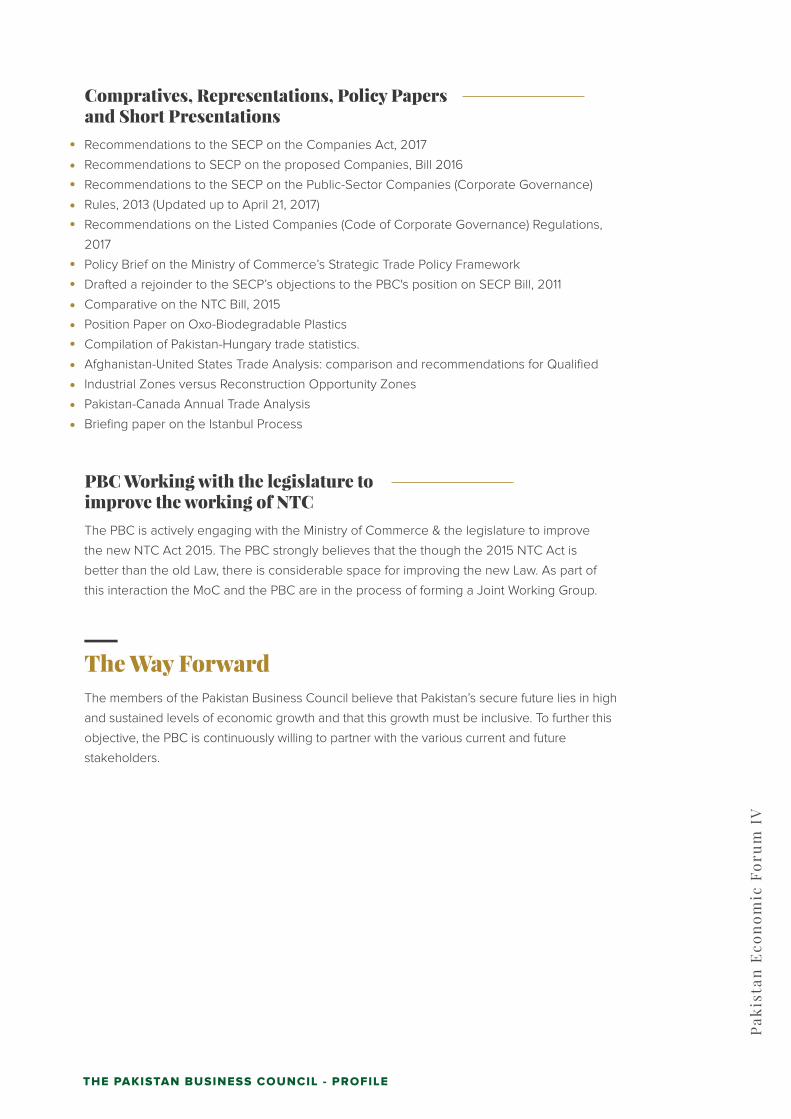
Compratives, Representations, Policy Papersand Short PresentationsRecommendations to the SECP on the Companies Act, 2017
Recommendations to SECP on the proposed Companies, Bill 2016
Recommendations to the SECP on the Public-Sector Companies (Corporate Governance)
Rules, 2013 (Updated up to April 21, 2017)
Recommendations on the Listed Companies (Code of Corporate Governance) Regulations,
2017
Policy Brief on the Ministry of Commerce’s Strategic Trade Policy Framework
Drafted a rejoinder to the SECP’s objections to the PBC's position on SECP Bill, 2011
Comparative on the NTC Bill, 2015
Position Paper on Oxo-Biodegradable Plastics
Compilation of Pakistan-Hungary trade statistics.
Afghanistan-United States Trade Analysis: comparison and recommendations for Qualified
Industrial Zones versus Reconstruction Opportunity Zones
Pakistan-Canada Annual Trade Analysis
Briefing paper on the Istanbul Process
The Way Forward
PBC Working with the legislature toimprove the working of NTCThe PBC is actively engaging with the Ministry of Commerce & the legislature to improve
the new NTC Act 2015. The PBC strongly believes that the though the 2015 NTC Act is
better than the old Law, there is considerable space for improving the new Law. As part of
this interaction the MoC and the PBC are in the process of forming a Joint Working Group.
The members of the Pakistan Business Council believe that Pakistan’s secure future lies in high
and sustained levels of economic growth and that this growth must be inclusive. To further this
objective, the PBC is continuously willing to partner with the various current and future
stakeholders. P
akis
tan
Eco
no
mic
Fo
rum
IV
THE PAKISTAN BUSINESS COUNCIL - PROFILE

Pak
ista
n E
con
om
ic F
oru
m I
V
AGENDA FORTHE ECONOMY02

Pak
ista
n E
con
om
ic F
oru
m I
V
The principal objectives of the Pakistan Business Council (PBC) are to foster growth and promote:
JOBS
VALUE ‐ADDED EXPORTS
IMPORT SUBSTITUTION
EQUITABLE BROADENING OF THE TAX BASE
SUSTAINABLE DEVELOPMENT
The central premise of the PBC’s Agenda for the Economy is that industry in a country with a
consumer base of over 200 million can with the right policies, gain the critical mass to o�er
goods and services on competitive terms in both, the domestic and the global markets. Thus a
strong domestic industry can deliver all the aforementioned objectives. PBC’s stance on “Make in
Pakistan” is all the more relevant today as many developed & developing countries move to
protect their domestic markets. The term “Make in Pakistan” encompasses the maximization of
local manufacturing and all services within the extended value‐chains. Regretfully, lack of political
will, unaligned and unpredictable policies, a weak and fragmented bureaucracy, vested and
short‐term interests have together worked to convert Pakistan into a nation of import‐reliant
traders, costing jobs, creating repeated cycles of pressure on the external account and resulting
in the loss of tax revenue necessary to fund social development.
The Pakistan Business Council’sAgenda for the Economy
AGENDA FOR THE ECONOMY

Pak
ista
n E
con
om
ic F
oru
m I
V
The Background
Pakistan is deindustrializing prematurely – manufacturing as % of GDP in Pakistan is
declining;
private consumption at ~ 80% remains the dominant part of GDP, in excess of peer Asian
countries;
import reliance has grown and exports and remittances are stagnating, creating recurring
pressure on the external account;
The Pakistan Rupee has lost competiveness vs. the country’s main competitors in the global
market;
investment lags peer countries. Policies discourage corporatization, capital formation and
investment;
the narrow formal sector is increasingly burdened with higher taxes and at the same time
forced to work as unpaid tax collector of 75 di�erent types of with‐holding taxes. This engine
of jobs, exports and tax revenue has lost faith in the fiscal policy which does not promote
capital accumulation, consolidation or investment;
manufacturing, which represents 13.5% of GDP carries 58% of the tax burden. Agriculture and
retail/wholesale, which together represent 40% of the economy contribute less than 2%;
reliance on presumptive taxes encourages trading rather than manufacturing, impacting jobs;
productivity in agriculture, which represents 20% of GDP, is well below global best, crop
support price results in unsustainable surpluses, whilst cotton shortage impacts the textiles
industry which is the backbone of exports. Pakistan, an agrarian economy is now a net
importer of food with a $2 Bn deficit;
private sector credit as % of GDP is down from 28% in 2007 to 16% in 2016 vs. Bangladesh’s
44%. Banks prefer risk‐averse lending to the government. The SME sector su�ers the most;
share of world exports has declined, whilst Bangladesh and Vietnam’s grew two and
seven‐fold respectively in the last two decades. Pakistan’s exports are narrow in range (65%
textiles), low in value‐ addition, sophistication and import incorporation and are targeted
mainly at the EU and USA (50% of total);
in Ease of Doing Business, as well as in most other global rankings, Pakistan fares badly even
against its South Asian peers. More alarmingly, the same is the case in most Social
Development Indicators;
The Information, Communications and Technology sector is under‐supported and over‐taxed;
The formal retail sector faces an uneven playing field vs informal trade;
Pakistan ranks lowest in credit ratings in South Asia.
And in the backdrop of the above is a vibrant, tech connected urban youth cohort with
aspirations for goods and services but with limited access to decent secure jobs in the
absence of a dynamic formal sector
AGENDA FOR THE ECONOMY
Pak
ista
n E
con
om
ic F
oru
m I
V
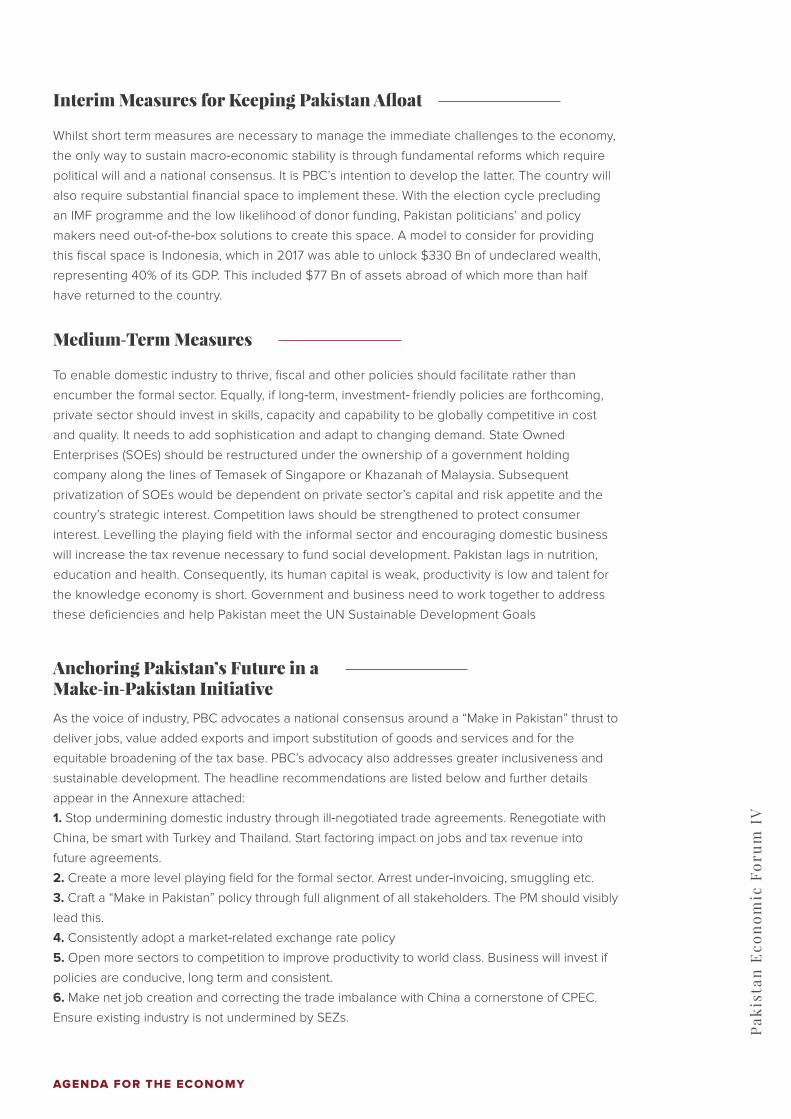
Interim Measures for Keeping Pakistan Afloat
Whilst short term measures are necessary to manage the immediate challenges to the economy,
the only way to sustain macro‐economic stability is through fundamental reforms which require
political will and a national consensus. It is PBC’s intention to develop the latter. The country will
also require substantial financial space to implement these. With the election cycle precluding
an IMF programme and the low likelihood of donor funding, Pakistan politicians’ and policy
makers need out‐of‐the‐box solutions to create this space. A model to consider for providing
this fiscal space is Indonesia, which in 2017 was able to unlock $330 Bn of undeclared wealth,
representing 40% of its GDP. This included $77 Bn of assets abroad of which more than half
have returned to the country.
Medium‐Term Measures
To enable domestic industry to thrive, fiscal and other policies should facilitate rather than
encumber the formal sector. Equally, if long‐term, investment‐ friendly policies are forthcoming,
private sector should invest in skills, capacity and capability to be globally competitive in cost
and quality. It needs to add sophistication and adapt to changing demand. State Owned
Enterprises (SOEs) should be restructured under the ownership of a government holding
company along the lines of Temasek of Singapore or Khazanah of Malaysia. Subsequent
privatization of SOEs would be dependent on private sector’s capital and risk appetite and the
country’s strategic interest. Competition laws should be strengthened to protect consumer
interest. Levelling the playing field with the informal sector and encouraging domestic business
will increase the tax revenue necessary to fund social development. Pakistan lags in nutrition,
education and health. Consequently, its human capital is weak, productivity is low and talent for
the knowledge economy is short. Government and business need to work together to address
these deficiencies and help Pakistan meet the UN Sustainable Development Goals
Anchoring Pakistan’s Future in aMake‐in‐Pakistan Initiative
As the voice of industry, PBC advocates a national consensus around a “Make in Pakistan” thrust to
deliver jobs, value added exports and import substitution of goods and services and for the
equitable broadening of the tax base. PBC’s advocacy also addresses greater inclusiveness and
sustainable development. The headline recommendations are listed below and further details
appear in the Annexure attached:
1. Stop undermining domestic industry through ill‐negotiated trade agreements. Renegotiate with
China, be smart with Turkey and Thailand. Start factoring impact on jobs and tax revenue into
future agreements.
2. Create a more level playing field for the formal sector. Arrest under‐invoicing, smuggling etc.
3. Craft a “Make in Pakistan” policy through full alignment of all stakeholders. The PM should visibly
lead this.
4. Consistently adopt a market‐related exchange rate policy
5. Open more sectors to competition to improve productivity to world class. Business will invest if
policies are conducive, long term and consistent.
6. Make net job creation and correcting the trade imbalance with China a cornerstone of CPEC.
Ensure existing industry is not undermined by SEZs.
AGENDA FOR THE ECONOMY
Pak
ista
n E
con
om
ic F
oru
m I
V
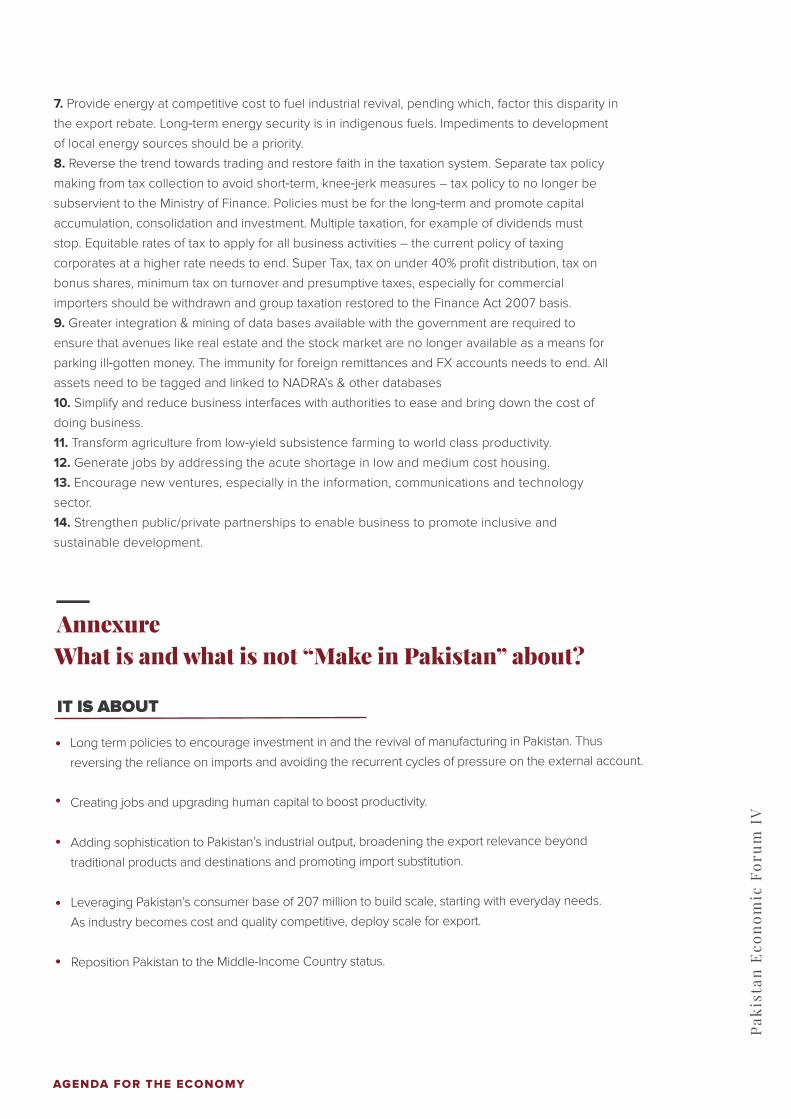
7. Provide energy at competitive cost to fuel industrial revival, pending which, factor this disparity in
the export rebate. Long‐term energy security is in indigenous fuels. Impediments to development
of local energy sources should be a priority.
8. Reverse the trend towards trading and restore faith in the taxation system. Separate tax policy
making from tax collection to avoid short‐term, knee‐jerk measures – tax policy to no longer be
subservient to the Ministry of Finance. Policies must be for the long‐term and promote capital
accumulation, consolidation and investment. Multiple taxation, for example of dividends must
stop. Equitable rates of tax to apply for all business activities – the current policy of taxing
corporates at a higher rate needs to end. Super Tax, tax on under 40% profit distribution, tax on
bonus shares, minimum tax on turnover and presumptive taxes, especially for commercial
importers should be withdrawn and group taxation restored to the Finance Act 2007 basis.
9. Greater integration & mining of data bases available with the government are required to
ensure that avenues like real estate and the stock market are no longer available as a means for
parking ill‐gotten money. The immunity for foreign remittances and FX accounts needs to end. All
assets need to be tagged and linked to NADRA’s & other databases
10. Simplify and reduce business interfaces with authorities to ease and bring down the cost of
doing business.
11. Transform agriculture from low‐yield subsistence farming to world class productivity.
12. Generate jobs by addressing the acute shortage in low and medium cost housing.
13. Encourage new ventures, especially in the information, communications and technology
sector.
14. Strengthen public/private partnerships to enable business to promote inclusive and
sustainable development.
IT IS ABOUT
AnnexureWhat is and what is not “Make in Pakistan” about?
Long term policies to encourage investment in and the revival of manufacturing in Pakistan. Thus
reversing the reliance on imports and avoiding the recurrent cycles of pressure on the external account.
Creating jobs and upgrading human capital to boost productivity.
Adding sophistication to Pakistan’s industrial output, broadening the export relevance beyond
traditional products and destinations and promoting import substitution.
Leveraging Pakistan’s consumer base of 207 million to build scale, starting with everyday needs.
As industry becomes cost and quality competitive, deploy scale for export.
Reposition Pakistan to the Middle-Income Country status.
AGENDA FOR THE ECONOMY

Pak
ista
n E
con
om
ic F
oru
m I
V
FTAs to date have not had a significant impact on reducing Pakistan’s trade deficit.
Under the FTA signed with China, Pakistan’s trade deficit grew 5‐fold to over $15 Bn.
Largest increase in exports from Pakistan to China was of commodities and low value‐added items,
generating very few jobs. Imports were however of value‐added items, undermining local industry,
jobs and tax revenue.
Negotiators failed to secure access for several items of export potential from Pakistan.
Subsequent to the FTA with Pakistan, China granted more favorable terms to ASEAN,
Australia and New Zealand. The China Pakistan FTA did not require China to o�er similar
terms to Pakistan.
Pakistan availed of just 5% of the concessional lines under the FTA. Many of the
concessional lines Pakistan had no capability of availing; others it couldn’t due to energy shortage and
cost. China on the other hand availed of 57% of the concessional lines, mostly finished goods.
Whilst renegotiation of the FTA with China has yet to be concluded, Pakistan has opened talks with
Thailand and Turkey on fresh FTAs. There is significant mismatch between Pakistan’s export capability
and those of Turkey and Thailand. For every additional $ increase in Pakistan’s exports to Turkey,
Turkish imports to Pakistan would increase by roughly $3. Similarly, for every potential $ increase in
Pakistan’s exports to Thailand, imports from Thailand would increase by $4.
Pakistan already enjoys relatively low tari� access to both countries for the items it can export
Both Thailand and Turkey aspire to get access to Pakistan’s automobile, auto‐parts, chemicals, plastics
and rubber markets, which would undermine existing industry
Turkey is one of the highest users of trade defences, even against its FTA partners.
Presently Turkey has anti‐dumping, countervailing and safeguard levies on Pakistan’s
cotton yarn, made‐ups, PET.
IT IS NOT ABOUT
Providing a captive market for ine�cient industry at the expense of consumer choice.
Supporting a tari� structure which prevents access to raw materials and intermediate goods at
competitive prices to export industries.
Creating monopolies in the name of “minimum economic size.”
Encouraging industry currently at the bottom of the value-added chain to continue producing
basic raw materials and low value intermediate products.
Allowing the exploitation of labor in the name of “cost equalization” with regional competitors.
Renegotiate the FTA with China and move with caution on proposed agreements with Turkey
and Thailand. FTAs must deliver:
a. More local employment ‐ 3 million additional people need to find gainful employment
every year;
b. Additional tax revenue from improved profitability of domestic industry;
c. Higher value‐added exports of a broader product range with greater geographical spread.
The PBC’s detailed recommendations are as follows:
01
i.
ii.
iii.
iv.
v.
vi.
vii.
viii.
ix.
x.
xi.
AGENDA FOR THE ECONOMY
Pak
ista
n E
con
om
ic F
oru
m I
V
Under the presumptive tax regime, commercial importers pay a ‘full and final” tax on the value
declared/assessed, after which they are liberated from further tax accountability of profit. As the
declared value is often under‐invoiced, not only does it deny the government revenue, it severely
undermines local manufacturing. Presumptive or “full and final” tax regime for commercial importers
should be replaced by a minimum tax on import value to ensure that the government does not su�er
from revenue shortfall. Commercial importers should thereafter be obliged to file tax returns like
others and pay tax, including GST on value addition. An unholy alliance of vested interests argues
against this change.
Import duty in general is charged ad‐valorem. To curb under‐declaration of imports on items that are
prone to this practice, duty should be levied on the higher of ad‐valorem or specific duty based on
pieces, volume, weight, etc.
There are anomalies in calculation of import duty. Import duties for example on auto spare parts,
which are value added, are being levied purely on weight. This should be corrected to bring duty to
the proper value.
In some cases, import duty on finished goods is being levied at the same or lower rate than on raw
and intermediate materials. This needs to be corrected to promote local production. However, where
some manufacturer’s finished goods are another’s intermediate item, then exception should be made
through SROs to create a level playing field for local manufacturing.
The combination of import duties, GST (especially when levied on the final sales price to consumer)
and advance income tax provide a good incentive to misuse the Afghan transit arrangements. Not
only must goods imported for transit be charged all government levies (not just import duty), physical
controls need to be a tightened to prevent evasion.
In many cases the quantities of goods “transiting” Pakistan are not commensurate with the size of
Afghanistan’s population; the types “imported” are not in line with consumer tastes/preferences; and
in some cases, Afghanistan lacks industrial capacity to convert raw & intermediate material into
finished goods. Such items are either smuggled back to or never leave Pakistan. There should be a
sharper focus on such items.
Porous borders facilitate movement from both Afghanistan and Iran into Pakistan. Unless physical
controls are tightened, it is feared that goods imported via Chabahar and Bandar Abbas in Iran for
Afghanistan will continue to find their way into Pakistan.
Many markets in Pakistan brazenly deal in smuggled goods. Local authorities must cooperate with
Customs to stop this.
The National Tari� Commission must give benefit of the doubt to local manufacturing. Presently the
law works to delay e�ective protection of domestic industry against dumping.
Level the playing field with the informal sector by curbing under‐invoicing by introducing
specific duties (by unit/ weight/ pieces/size) on sensitive items. Replace the “full and final”
presumptive tax regime for commercial importers with a minimum tax and seek full tax
accountability from all. Ensure that finished goods attract higher duty than
RM/intermediates. Limit the misuse of Afghan Transit Trade and stop the brazen sale of
smuggled products. Empower the National Tariff Commission to give benefit of doubt to local
manufacturing.
02
i.
ii.
iii.
iv.
v.
vi.
vii.
viii.
ix.
AGENDA FOR THE ECONOMY
Pak
ista
n E
con
om
ic F
oru
m I
V
Pakistan needs one holistic and aligned policy to promote Make in Pakistan. This needs to address
the growing fragmentation of authority between federal ministries and the federation and provinces.
Examples are:
FBR is driven by the immediate need of tax revenue to meet immediate deficit targets rather than the
long‐term impact of these on the economy or business. In the context of trade, import incorporation,
excluding energy, into exports in Pakistan is less than 10% vs. 40% in Vietnam and Thailand and over
60% in Bangladesh. The latter produces no cotton, yet leads Pakistan 2:1 in textile exports by
deploying its labour to convert cloth to apparel.
Ministry of Finance is occupied in juggling the fiscal deficit by delaying tax refunds, impacting
exporters’ ability to fund business
Ministry of Commerce is motivated by exports through Free Trade Agreements, oblivious to the
impact on imports, trade deficit, local industry, jobs or tax revenue.
The provinces do not take account of global competitiveness in setting minimum wage rates or
providing world class infrastructure to promote domestic industry or exports.
Post devolution, the provinces are responsible for agriculture. However, they do not spend
enough on research, with the result, for example that cotton seed in Pakistan is outdated, yield is low,
crops are vulnerable to pest attacks and the supply is denied to the Textiles industry which represents
60% of Pakistan’s exports. Exports or agricultural yields is not seen as a KPI of provincial governments.
Some provinces are pushing for food and environment standards at variance from others. There is an
acute need for a harmonized national standard aligned with global standards to allow companies to
gain scale and be globally competitive.
Trade with China, Afghanistan, Iran, the Gulf States & East Africa should be a priority of the Make in
Pakistan strategy. It should also be the basis of preparing for trade with India when relations allow.
The government crowds out the private sector in bank lending, which as % of GDP has fallen to 16%
vs. 44% in Bangladesh. SMEs fare even worse with just 3.4% of small and 6.7% of medium sized
businesses availing bank credit. The corresponding figures for Bangladesh for small and medium
sized businesses availing bank credit are 27.5% and 33.6% respectively. SBP refinancing; credit
guarantees; lending on cash flow rather than physical collateral; special bank branches to evaluate
risk; Prudential Regulations that dynamically adjust to changes in the marketplace; minimum lending
targets; etc., are some solutions to boost credit to SMEs.
Craft a “Make in Pakistan” policy that addresses the fragmented and often conflicting
policies of federal ministries and provinces in respect of industry and exports. The long term
“Make in Pakistan” strategy should align manufacturing with trade and must be overseen by
the PM to put Pakistan on par with value‐addition and export powerhouses like Vietnam.
03
AGENDA FOR THE ECONOMY

Pak
ista
n E
con
om
ic F
oru
m I
V
Businesses will benefit from healthy competition from new entrants. It will not only stir improvements
in productivity, value‐addition, sophistication and quality, but also ensure competitive pricing. With
conducive and consistent, long‐term policies, more players will add scale, bring down cost and
improve quality. In time, Pakistan would become competitive in exports as it starts meeting global
standards. The Auto sector, hitherto protected and now opening up is a case in point. Introduction of
private airlines has benefited travelers. Opening life insurance to the private sector has accelerated
its penetration. E‐banking and E‐commerce, benefiting from a�ordable and more widely available
broadband, will promote greater financial inclusiveness as well as productivity and e�ciency. There is
substantial room to improve in Logistics. Port handling, inland transportation and warehousing need
to be world class in quality and cost. Pakistan can leverage its location as a storage and transit hub.
Within Textiles, Pakistan’s mainstay is cotton whereas global industry is evolving to man‐made fabrics
and technical textiles. Pakistan needs to build capability and capacity to adapt. This will require a
comprehensive value‐chain change.
State Owned Enterprises (SOEs), presently a drain on the economy should be restructured under the
ownership and guidance of a government‐owned but private sector resourced holding company
along the lines of Temasek and Khazanah of Singapore and Malaysia respectively. Subsequent
privatization should be determined by the private sector’s capital and risk appetite, balanced with the
nation’s strategic priorities. An example of the latter could be risk‐intensive oil exploration for which
the private sector may have limited appetite.
Policies should di�erentiate in favour of FDI, which brings technology, adds jobs, generates either
value‐added exports or promotes import substitution. Presently much of FDI is premised on short
payback leveraging on Pakistan’s large and growing middle class consumption rather than the impact
on the external account. The Board of Investment should focus on both local as well as foreign
investment, rather than just the latter. JVs and technical agreements with foreign investors may be
preferable to the current 100% FDI regime.
Open up more sectors to fresh competition from new investors to encourage greater
productivity. Sharpen the focus of FDI to technology, value‐added exports, import
substitution and job creation.
04
CPEC will no doubt be a game changer for Pakistan and there is hardly a facet of the economy that
will not be touched by it. However, there needs to be greater transparency on how CPEC will impact
the competitiveness of existing domestic industries and the safeguards that will be deployed to
prevent it becoming a channel for cheap imports.This is a concern as reportedly industries established
in Special Economic Zones under CPEC will enjoy extensive concessions. It is important to ensure that
such ventures add incrementally to jobs and exports and don’t displace existing sources in the
country. Pakistan should leverage CPEC to attract a meaningful percentage of the millions of jobs that
Make correcting the trade imbalance with China and the creation of jobs integral parts of
CPEC. Concessions to SEZ’s must be conditional on jobs and exports which are incremental to
and not at the cost of existing industry.
05
AGENDA FOR THE ECONOMY

Pak
ista
n E
con
om
ic F
oru
m I
V
Provision of electricity and gas at regionally competitive cost is an issue broader than just to sustain
exports. Supply of energy to domestic industry at competitive cost helps in withstanding the onslaught
of imports. Pakistan’s value‐added export sector is encumbered by energy and labour costs that are
twice those of Bangladesh, India and Sri Lanka. The narrative on energy should now move from
availability to a�ordability. As production ramps up, industry must not continue to be used to subsidize
private consumers. Instead, industry should be allowed to create livelihoods.
The government’s package to support value‐added exports should be for a 5 – 10‐year term to
encourage investment into value‐addition, capacity expansion and productivity. Until energy costs are
brought down, it should also compensate for energy cost disparity against the main sourcing
competitors. Whilst a sharp correction in the value of the Rupee which has lost competitiveness in the
destination markets and against competing sourcing countries is not recommended, due reflection of
this in the export rebate is necessary. Further, banks should be allowed to credit the export rebates
immediately upon realization of export proceeds instead of having to wait. The export package
should be broadened to encompass all exports instead of just the main sectors. It should continue to
be skewed to value addition with rebates gradually being withdrawn from commodities. The
conditionality of linking rebates to growth in exports should take account of the prevailing global trade
trends. Where rebates need to be linked to growth, then the period for determining growth should not
be an entire year. Finally, holding on to exporters’ tax refunds puts unnecessary cash flow burden.
Provide Industry access to energy at regionally competitive cost. Pending this an export
package should dynamically offset the cost disparities. A 5‐10‐year package (rather than a
12‐18‐month programme) will promote investment into value‐addition. Additionally,
exporter’s cash flow must be liberated from delays in settling rebates and refunds.
06
are likely to move out of China given the rising labour and conversion cost there. Indeed, that and
getting Chinese industries to add value in Pakistan to redress the trade deficit should be integral parts
of CPEC. Pakistan has a poor record of managing leakages from transit trade. A repeat of the
experience with the Afghan Transit Treaty on transit of Chinese goods could wipe o� many industries.
Unless the tax policy role is removed from the Ministry of Finance/FBR, the tax regime will remain
knee‐jerk, ad‐hoc and revenue, rather than reform oriented. Government’s target for tax collections
does not di�erentiate between taxes raised from existing and new tax payers. This drives the FBR to
extract more from the already taxed, sometimes through actions bordering on harassment, risking the
Separate tax policy making from tax collection to reduce uncertainty of ad hoc and knee‐jerk
changes. Address FBR’s talent and technology gaps and curb its discretionary powers,
misuse of which thwarts the growth of the tax base. Make taxes collected from new taxpayers
a main KPI for FBR. Taxes need to be equitable, regionally competitive, promote investment
and consolidation. Higher tax rate than regional peers, super tax, tax on retained earnings,
tax on bonus shares, tax on dividends from already taxed profits, especially inter‐corporate
dividends, restrictions on surrender of losses within a group are all retrogressive. Minimum
tax on turnover, rather than profit discourages investment. Making the formal sector an
unpaid tax collector adds to the cost of doing business.
07
AGENDA FOR THE ECONOMY

Pak
ista
n E
con
om
ic F
oru
m I
V
long‐term health of business. Indeed, harassment is the biggest turn‐o� for those not in the tax base
to join. FBR is not currently structured with talent and capacity to deploy technology to broaden the
tax base. Here are some facts:
Total taxes grew by 60% in the last 3 years but most of this came from existing tax payers
Manufacturing which represents 13.5% of GDP carries 58% of the tax burden
Withholding taxes accounted for 70% of total tax revenue. These are collected by the formal sector
as unpaid tax collectors.
Tax rates in Pakistan are not regionally or globally competitive:
Not only is the corporate tax rate higher than the global average of 22%, shareholders in companies
su�er taxes on dividends from already taxed profits. The e�ective tax rate of shareholders thus is 47%
whilst that of holding company shareholders is 55%. High VAT rate provides incentive to evade and
makes it di�cult for tax compliant businesses to compete. The formal retail sector is particularly
impacted. The tax regime also does not encourage capital accumulation, formation and consolidation.
Examples are: tax on undistributed reserves, tax on bonus shares, super tax, tax on inter‐corporate
dividends and the curtailment of group loss relief. These are retrogressive measures as is the
imposition of a minimum tax on turnover irrespective of whether a company makes a profit or not. This
in particular discourages investment as it negatively impacts a new entity’s cash flow in the early years
when it is trying to survive. Fiscal incentives to deal with the formal sector were also recently
withdrawn, sending a wrong signal.
E�orts to formalize the real estate sector and to bring those not filing tax returns into the tax base are
to be applauded. However, the withholding taxes placed on non‐filers are not high enough to
encourage them to join the tax base. They have become a source of revenue for the government.
Unless FBR is able to locate potential taxpayers and enforce the writ of law, there will be no significant
expansion of the tax base. It is recognized that without su�ciently strong political will, none of the
reforms suggested would work.
Pakistan
Singapore
Sri Lanka
Bangladesh
Vietnam
CorporateTax %
VAT %
38*
17
15
25
22
17
7
12
15
10
*Incl. WPPF&WWF and Super Tax.
AGENDA FOR THE ECONOMY

Pak
ista
n E
con
om
ic F
oru
m I
V
Pakistan ranks poorly in virtually every global ranking, in many cases well below its immediate
neighbors, who also don’t fare all that well against best in class globally:
Fragmentation of authority creates complexity for business. A simpler, technology‐driven, one‐ window operation would considerably ease doing business and bring down the cost. A unified tax
return and collection system would save time, e�ort and money. Multiple agencies and authorities
of the federal and provincial governments are responsible for tax collection in Pakistan. In the city
of Karachi, a medium‐sized enterprise needs to pay 47 di�erent federal, provincial and local taxes
(vs. 25 in India) (SINGAPORE BEING A CITY STATE MIGHT NOT BE A GOOD EXAMPLE TO
QUOTE) The formal sector is also burdened by responsibility to collect 75 di�erent types of
with‐holding taxes. Due to complexity and multiple taxes and agencies, Pakistan stands at 172 of
190 countries in the World Bank/PwC Paying Taxes Ranking, down from 155th.
The Companies Act 2017 duplicates power and authority of other bodies, placing further burden
on the corporate, tax‐compliant sector instead of making it easier to do business. For example, the
Section 452 requirement for directors and major shareholders to disclose foreign shareholdings
duplicates existing powers of the State Bank of Pakistan and the Federal Board of Revenue. The
SECP will under this Section act merely as a post box. There is no global precedent of a similar
registry of assets. As those outside the corporate sector will not be required to report, this is
discriminatory against the corporate sector. Section 456 (2) (a) requires real estate developers to
seek SECP’s permission prior to announcement of projects when they are already required to
obtain requisite sanctions, NOCs, etc., from authorities that regulate the real estate sector. Section
208 defines related parties so widely that it is di�cult to implement. With these and other
anomalies, there is a strong case to revise some sections of the Companies Act 2017.
Simplify laws, reduce interfaces with authority and address silo management and
conflicts between ministries, federation & provinces to reduce cost and enhance ease of
doing business. Replace multiple taxes/agencies with a unitary system. Amend
08
Ease of Doing Business Index
Human Capital Index
Global Competitiveness Index
Global Innovation Index
Economic Freedom Index
Global Youth Development Index
TotalCountries
Indices Ranking
Bangladesh Bhutan India Pakistan Sri Lanka
190
130
138
128
166
183
177
104
106
117
137
146
75
91
97
96
97
69
100
105
39
66
123
133
147
118
122
119
126
154
111
50
71
91
93
31
Nepal
105
108
80
115
151
77
AGENDA FOR THE ECONOMY

Pak
ista
n E
con
om
ic F
oru
m I
V
Most of Pakistan’s agriculture, dairy and livestock operates on a subsistence basis. Land
fragmentation has eroded productivity with the result that per hectare output of most crops is well
below global best:
Transform agriculture, livestock and dairy from subsistence farming to world class
standards so that it can fuel industrial growth, jobs and exports.
09
Wheat
Cotton
Sugar Cane
Maize
Rice
Crop PakistanTons/hectare
3.1
2.5
63.4
4.6
2.7
8.1 (France)
4.8 (China)
125.1 (Egypt)
11.1 (France)
9.2 (USA)
38%
52%
51%
41%
29%
Best in worldTons/hectare
Pakistan as %of best
Less than 40% of seeds used are certified. Cotton output is now a third of India’s – India benefited
from GM seeds, whilst crops in Pakistan continue to su�er from pest attacks. Absence of land
levelling, salinity, poor water management, indiscriminate application of fertilizers and pesticides are
other factors impacting output and economics of farming. Supply chain, especially the cold chain for
fruits and vegetables is poor. Dairy and livestock is mostly an addendum rather than a mainstream
activity. Government guaranteed purchase price for wheat and sugarcane has led to
unmanageable surpluses and it discourages diversification of crops. Comprehensive value chain
analysis should redirect incentives to optimize output. Growing imports of edible oils and lentils is a
concern. Until FY2014 Pakistan had a trade surplus in food. By FY2017 it had slipped to a deficit of
$2 Bn.
Informal financing intermediaries erode farmer yields. Poor information flow is partly due to low
illiteracy but is not helped by poor reach and high cost of broadband. Cooperative farming and
rental options would facilitate mechanization. Drip irrigation, utilizing Chinese technology would
benefit yield. Pakistan is regionally well placed to supply agricultural, horticultural and meat products
to China and the ME.
The National Water Policy pending with the Council of Common Interests seeks to address the
potential:
Agriculture uses 95% of the nation’s water and represents 20% of the economy
A $1 Bn potential addition to the economy is estimated for each additional million acre‐feet of water
storage
22 mn more acres could be irrigated in Southern Punjab, Sindh, Southern KP and Eastern
Baluchistan
Our canal e�ciency is just 33% vs. global average of 90%
AGENDA FOR THE ECONOMY
Pak
ista
n E
con
om
ic F
oru
m I
V
Pakistan’s reservoirs can store only 10% vs. 40% global norm. Some $23 Bn per year of economic
potential is lost as water flows into the sea. The frequency of floods is rising.
Additionally, securing supply under the Indus Water Treaty and from the Kabul River are also
important.
Generate jobs by addressing the acute shortage in low and medium cost housing by
incentivizing developers, lenders and owners through supportive tax, long‐term financing and
other policies.
10
i.
ii.
iii.
iv.
v.
vi.
vii.
Pakistan su�ers from a housing backlog of 10 million units which is growing at the rate of approx.
500,000 units per annum. Meeting just the annual shortfall could create 10 million direct jobs with a
significant multiplier impact on cement, steel and other parts of the construction industry. Steps to
address this would include:
An early activation of the government mortgage refinance bank to provide revolving tranches of
long‐term funding. The deposit tenors of commercial banks do not match the long‐term lending
horizons of housing. As a result, currently commercial lending to housing is well below global norms.
Title visibility through automation of registration records
Laws that strengthen title security and repossession and resale in the event of default
Valuation transparency
Incentives for developers and fiscal relief on mortgage loan cost for borrowers
Allow collateralization of up to Rs. 5 m of property without wealth accountability for tax
Fiscal regime for development REITS should be reviewed.
Internet connectivity is key for developing the ICT sector. 80% of Pakistanis do not have access to
broadband. The main reason is incidence of high taxes on cellular equipment and services. 90% of cellular
users are levied advance income tax when the highest estimate of potential tax payers is 10 million.
E‐commerce is being thwarted due to poor connectivity.
Reduction in tax rates on cellular/internet services in other countries has proven to lead to more use,
greater productivity and e�ciency, higher GDP growth and improvement in social welfare. The net result
over time is higher tax revenue. The UN’s International Telecommunications Union estimates that a 10%
increase in broadband penetration leads to an increase of 1.4% in GDP growth and the GSM Association
estimates that every 1000 new broadband subscribers lead to 33 direct and indirect jobs.
A�ordable and reliable fixed line and wireless access to internet is fundamental to people’s empowerment
and a key enabler of ICT. More inclusive and democratized web access will boost education, agriculture,
health, mobile payments and e‐commerce. Besides, it will boost employment, particularly of women,
disseminate knowledge across a very wide spectrum of socially and economically relevant areas. There is
also an acute need for government to deploy IT to simplify and make doing business easy. This is an
Encourage new ventures, especially in the Information, Communications and Technology
sector to create jobs, promote greater inclusion and encourage self‐sufficiency/export of
services.
11
AGENDA FOR THE ECONOMY

Pak
ista
n E
con
om
ic F
oru
m I
V
opportunity for local software houses to develop or to partner global companies to digitize the
government.
Prudential Regulations of the banking sector need to be reviewed to make lending against the collateral of
software possible. Private Equity investment by banks is currently restricted to 10% of investee capital rather
than the lending bank’s capital. This also needs to be reviewed.
With 43% of children su�ering from stunting and 40% not attending school on a daily basis, nutrition
and education rank amongst the highest social priorities for the country. Poor healthcare, paucity of
safe drinking water, untreated e�uent discharge, ine�cient garbage handling, inadequate recycling,
pollution, low inclusion of women in the workforce, weak skill levels for both manufacturing and
service industries and poor employment opportunities due to high reliance on imports are some of
the other issues that need to be tackled. Fortunately, there are some successful models of
public/private partnerships. Businesses can play a more meaningful role in society by promoting
inclusive and sustainable development to improve quality of life, secure livelihoods, address gender
balance and decouple growth from impact on the environment. Of the 17 UN Sustainable
Development Goals that Pakistan is a signatory, there are 6 that fiscal incentives can help businesses
fast forward.
Strengthen public/private partnerships to promote inclusive and sustainable development by
improving quality of life; securing livelihoods; addressing gender balance; and decoupling
growth from impact on the environment
12
AGENDA FOR THE ECONOMY
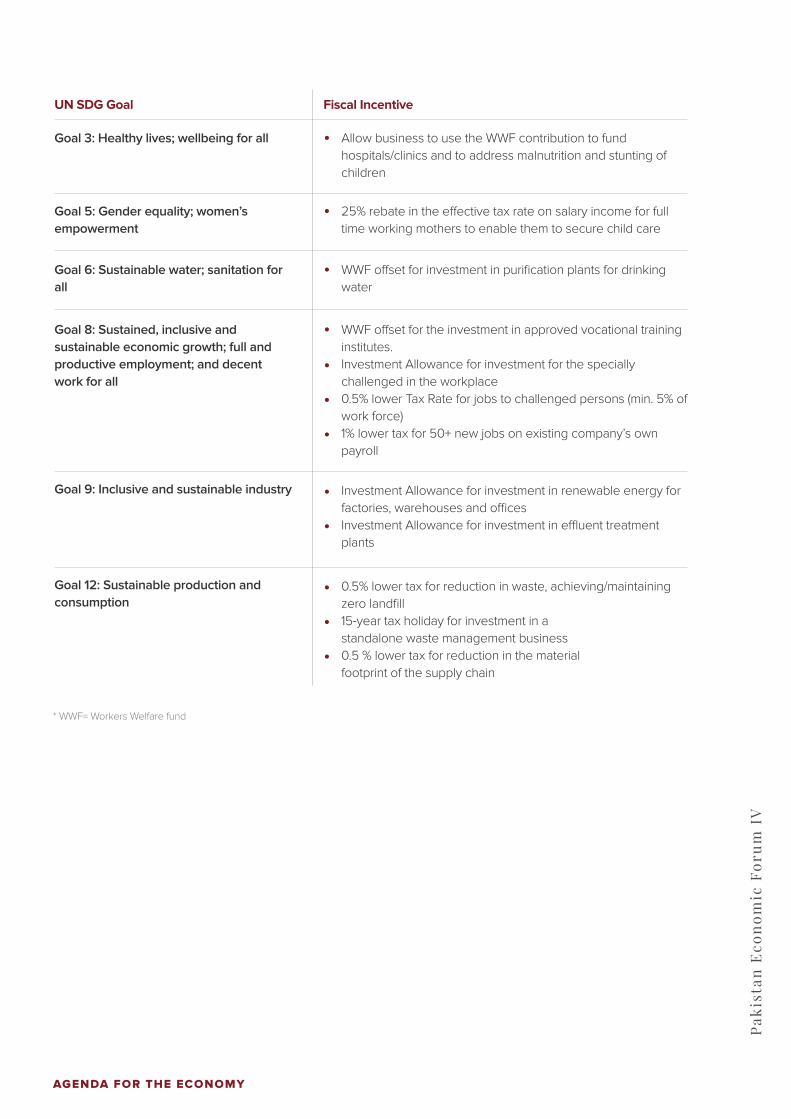
Pak
ista
n E
con
om
ic F
oru
m I
V
Goal 3: Healthy lives; wellbeing for all Allow business to use the WWF contribution to fund hospitals/clinics and to address malnutrition and stunting of children
UN SDG Goal Fiscal Incentive
Goal 5: Gender equality; women’s empowerment
25% rebate in the e�ective tax rate on salary income for full time working mothers to enable them to secure child care
Goal 6: Sustainable water; sanitation for all
WWF o�set for investment in purification plants for drinking water
Goal 8: Sustained, inclusive and sustainable economic growth; full and productive employment; and decent work for all
WWF o�set for the investment in approved vocational training institutes.Investment Allowance for investment for the specially challenged in the workplace0.5% lower Tax Rate for jobs to challenged persons (min. 5% of work force)1% lower tax for 50+ new jobs on existing company’s own payroll
Goal 9: Inclusive and sustainable industry Investment Allowance for investment in renewable energy for factories, warehouses and o�cesInvestment Allowance for investment in e�uent treatment plants
Goal 12: Sustainable production and consumption
0.5% lower tax for reduction in waste, achieving/maintaining zero landfill15‐year tax holiday for investment in astandalone waste management business0.5 % lower tax for reduction in the materialfootprint of the supply chain
* WWF= Workers Welfare fund
AGENDA FOR THE ECONOMY

Pak
ista
n E
con
om
ic F
oru
m I
V
A CASE FOR“MAKE INPAKISTAN”
03

Pak
ista
n E
con
om
ic F
oru
m I
VHIGHER TAXESFROM ABROADER BASE
“Make in Pakistan”
VALUE-ADDEDEXPORTSAND IMPORTSUBSTITUTION
Pakistan’s three acute needs, one solution
JOBS INMANUFACTURING& SERVICES
Strong domestic industry with a consumer base of 207 mn
A CASE FOR “MAKE IN PAKISTAN”
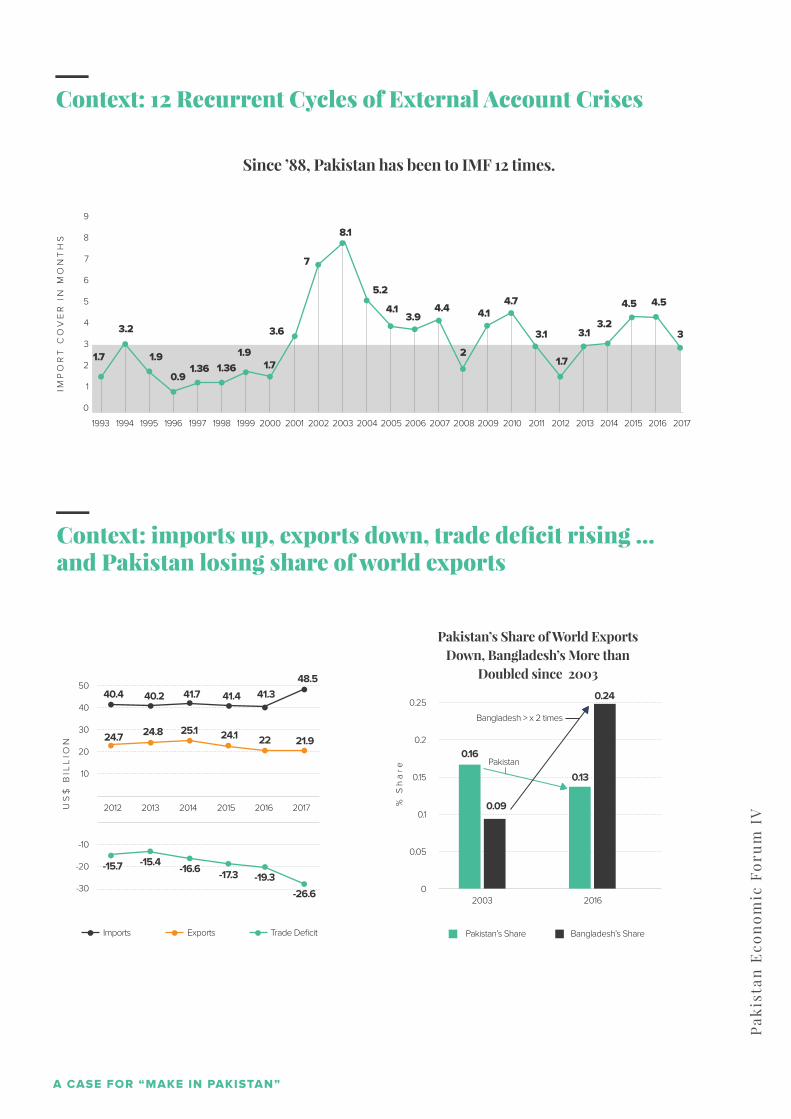
Pak
ista
n E
con
om
ic F
oru
m I
V
1.7
3.2
1.9
0.91.36 1.36
1.91.7
3.6
7
8.1
5.2
4.13.9
4.4
2
4.14.7
3.1
Context: 12 Recurrent Cycles of External Account Crises
IMP
OR
T C
OV
ER
IN
MO
NT
HS
1993 1994 1995 1996 1997 1998 1999 2000 2001 2002 2003 2004 2005 2006 2007 2008 2009 2010 2011 2012 2013 2014 2015 2016 2017
9
8
7
6
5
4
3
2
1
0
1.7
3.13.2
4.5 4.5
3
Since ’88, Pakistan has been to IMF 12 times.
Context: imports up, exports down, trade deficit rising …and Pakistan losing share of world exports
2012
-10
0.25
0.2
0.15
0.1
0.05
0
10
20
30
40
50
-20
-30
2013 2014 2015 2016
20162003
Bangladesh > x 2 times
2017
-15.7
24.7
40.4 40.2 41.7 41.4 41.3
0.16
0.09
0.13
0.24
48.5
24.8 25.1 24.1 22 21.9
-15.4-16.6 -17.3 -19.3
-26.6
Imports Exports Trade Deficit
Pakistan
Pakistan’s Share Bangladesh’s Share
Pakistan’s Share of World Exports Down, Bangladesh’s More than
Doubled since 2003
% S
ha
re
US
$ B
ILL
ION
A CASE FOR “MAKE IN PAKISTAN”

Pak
ista
n E
con
om
ic F
oru
m I
V
15
14
13
12
11
10
9
8
7
1999 - 2000
2000 - 2
001
2001 -
2002
2002 -
2003
2003 -
2004
2004 -
2005
2005 -
2006
2006 - 2
007
2007 -
2008
2008 -
2009
2009 - 2
010
2010
- 2011
2011 -
2012
2012
- 2013
2013
- 2014
2014
- 2015
2015
- 2016
2016 - 2
017
% S
HA
RE
IN
GD
P
MFG Share LSM Share
Fact: manufacturing and its share in exports is declining
11.7
10.710.7
Country De‐Industrializing Prematurely
Share of Manufacturing in Exports Declining
Is Pakistan becoming a
nation of traders?Can we a�ord to o�shore
our jobs?
Why do we export
commodities and not add
value?
Are the policies conducive
to Import substitution?
10.811.3
12.3
10.2
9.1
10.4
11.3
12.4
13.8
14.4
13.613.2
13.613.5 13.5
8.3
14
12
10
8
6
4
2
0
EX
PO
RT
S (
% O
F G
DP
)
2012 2013 2014 2015 2016
12.40% 13.28%12.24%
10.59%
8.70%
A CASE FOR “MAKE IN PAKISTAN”

Pak
ista
n E
con
om
ic F
oru
m I
V
Fact: manufacturing is over‐taxed and itsgrowth lags neighbours
Agriculture
Manufacturing
Retail/Whole.
Services Total
% of GDP % of GDP
19.5%
13.5%
18.5%
18.5%
<1%
58%
1%
37%
% Tax Rev Pakistan’s tax base is narrow
Manufacturing carrying a disproportionate burden.
Formal sector faces an uneven playing field vs.
smugglers, counterfeiters, under-invoicers and
those who misuse the Afghan transit treaty.
Tax system is complex with 47 types of levies
Withholding tax on non-filers has become a revenue
raising tool rather one that incentivizes more to join
the tax base.
Industry Carries Disproportionate Burden of Taxes
Pakistan Lags Behind South Asia in Manufacturing Growth
14%
12%
10%
8%
6%
4%
2%
0%
2.09%
5.45%
9.05%
9.96%
11.90%
11.69%
7.90%
4.99%
2012 2013 2014 2015 2016
MA
NU
FAC
TU
RIN
G S
EC
TOR
-GR
OW
TH
RA
TE
Pakistan BangladeshIndia Vietnam
A CASE FOR “MAKE IN PAKISTAN”

Pak
ista
n E
con
om
ic F
oru
m I
V
Fact: FTAs are not supportive
Year SignedCountry Trade Balancethen
Trade Balance2016
Sri Lanka
China
Malaysia
Indonesia
Mauritius
2005
2006
2008
2013
2007
$0.094 Bn
$(3.2) Bn
$(1.55) Bn
$(1.06) Bn
$0.035 Bn
$0.24 Bn
$(15.32) Bn
$(1.0) Bn
$(1.86) Bn
$0.17 Bn
Poorly Negotiated Trade Agreements
Imports 2007*US$ Mn
Items Imports 2016*US$ Mn
GrowthMultiple
Footwear
Pumps
Glassware
Tiles
Blankets
Fans
34
47
13
50
17
25
103
171
74
170
46
69
3x
3.6x
5.6x
3.4x
2.7x
2.7x
90%
61%
90%
75%
98%
80%
Est. % fromChina
Growth in Import Reliance, Mainly on China
Significant mismatch
between Pakistan’s export
capability with those of
Turkey (1:3) and Thailand
(1:4)
Pakistan already enjoys
relatively low tari� access
to both countries
Both countries desire
access to Pakistan’s
automobile, auto‐parts,
chemicals, plastics and
rubber markets, which
would undermine existing
industry
Turkey is one of the
highest users of trade
defenses, even against its
FTA partners!
Caution with Proposed FTAs with Turkey and Thailand
A CASE FOR “MAKE IN PAKISTAN”

Pak
ista
n E
con
om
ic F
oru
m I
V
Super Tax
Tax on retained profits > 40%
Cascading tax on inter‐corporate dividends
E�ective Tax Rate of 55% for shareholders of
holding companies
Restricted group loss relief
Minimum tax on turnover, even in initial years
Corporate tax higher than tax on sole
traders/AOPs
Fact: Taxes are high, fiscal regime complex and notsupportive of scale
Doing Business‘18 PayingTaxes Rank(Out of 190)
Countries Payments(NumberPer Year)
Time(HoursPer Year)
Pakistan
India
Bangladesh
Srilanka
Vietnam
172
119
152
158
86
47
13
33
47
14
3,115
214
435
168
498
Complex Tax System
Corp Tax %Countries VAT/GST%
Pakistan
India
Bangladesh
Srilanka
Vietnam
38%*
17%
15%
25%
22%
17%
7%
12%
15%
10%
High Tax Rates
Fiscal Policy Not Supportive of Scale
* Includes WWF/WPFF/Super Tax
A CASE FOR “MAKE IN PAKISTAN”

Pak
ista
n E
con
om
ic F
oru
m I
V
Consumption, fueled byimports, dominates theeconomy and exceedsIndia’s by 2060 bps
FDI mostly Motivated by Consumption
Fact: tax revenue is reliant on imports andpresumptive taxes
Fact: consumption, not investment drives the economy…….. and FDI
1600
1400
1200
1000
800
600
400
200
02006 2007 2008 2009 2010 2011 2012 2013 2014 2015 2016 2017
Indirect on Income (FTR*) Customs Sales Excise
TA
X C
OL
LE
CT
ION
PK
R (
BIL
LIO
N)
16%
24%
51%
10%
21%
20%48%
11%
29%
49%
12%
20%
17%
50%
13%
21%
16%
51%
12%
20%15%
53%
11%
21%
15%
56%
9%
20%
16%
56%
8%
20% 21%
16%
55%
20%
17%
55%
23%
15%
53%14%
58%
8% 8% 8% 8%
19%
64.4
68.2
61.8
76.2
55.9
81.2
80.1
59.4
2011
1991
2001
2016
Pakistan
India
Nestle $ 450 Mn
investment in milk chain
2016: Friesland Campina
(NL) acquired 51% of Engro
Foods for approx.
US $ 442 Mn
2016: Lotte (S Korea)
buying substantial share in
Pepsi Lahore bottler
2013: Unilever (GB) parent
bought out minority
(c.24%) for US $ 530 Mn
2016: Arcelik of Turkey
acquired Dawlance
Appliances for $ 250 Mn
Coca Cola $ 380 Mn
expansion
A CASE FOR “MAKE IN PAKISTAN”
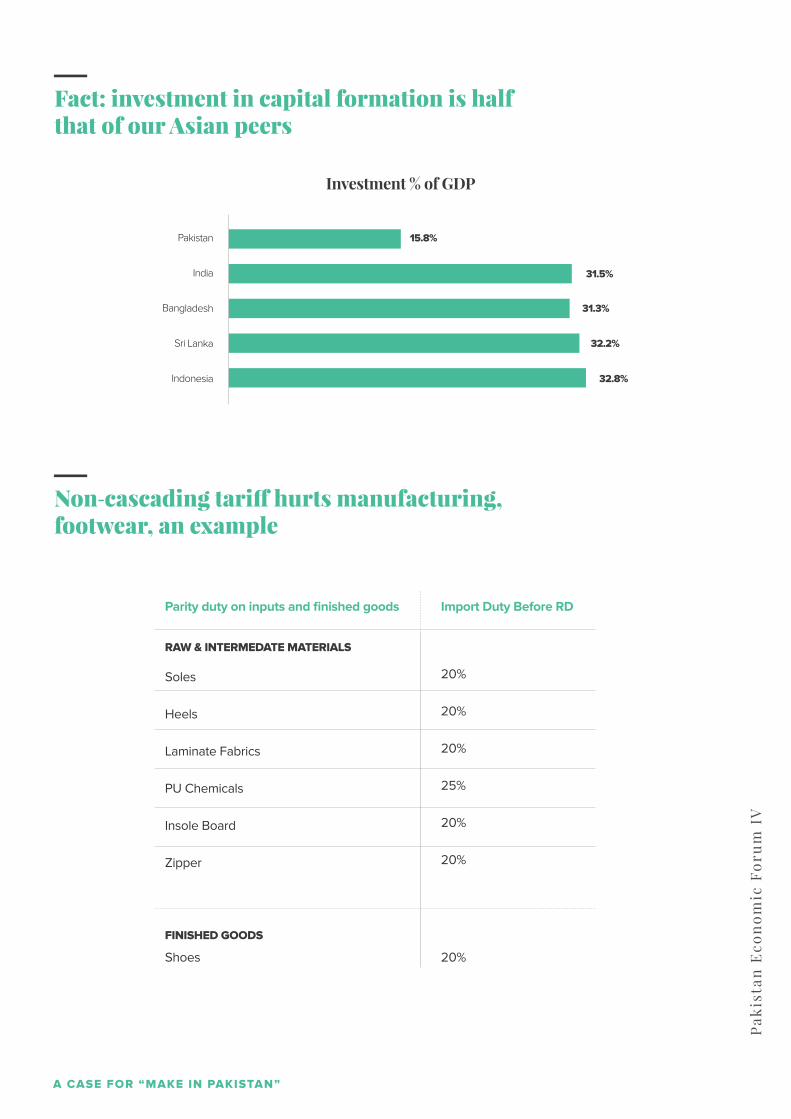
Pak
ista
n E
con
om
ic F
oru
m I
V
Fact: investment in capital formation is halfthat of our Asian peers
Non‐cascading tari� hurts manufacturing, footwear, an example
15.8%
31.5%
31.3%
32.2%
32.8%
Sri Lanka
Bangladesh
India
Pakistan
Indonesia
Investment % of GDP
Parity duty on inputs and finished goods
RAW & INTERMEDATE MATERIALS
FINISHED GOODS
Import Duty Before RD
Soles
Heels
Laminate Fabrics
PU Chemicals
Insole Board
Zipper
20%
20%
20%
25%
20%
20%
Shoes 20%
A CASE FOR “MAKE IN PAKISTAN”

Pak
ista
n E
con
om
ic F
oru
m I
V
Fact: tax revenue is reliant on imports andpresumptive taxes
Inappropriate tari�s for commercial importers hurtsmanufacturing & government revenue
41%
40%
RD, 30CD, 11
CD, 20 RD, 20
Raw Mat
Finished Goods
36%
41%RD, 30CD, 11
CD, 36
Raw Mat
Finished Goods
Welding Electrodes
Shock Absorbers
41%
21%
RD, 30CD, 11
CD, 21
Raw Mat
Finished Goods
Brake Drums
Shoes
45%Soles & Heels
Shoes
CD, 20 RD, 25
45%CD, 20 RD, 25
RD CD
Assessed on value Assessed on weight
OEMs assessedon value
Total Levy/unit Rs. Total Levy/unit Rs. Di�erence in Levies Rs.
Commercial assessedon weight
Loss to theExchequer
Basis of assessing
EXAMPLES
Oil Pumps
Water Pumps
Lamps
Spark Plugs
15.73
29.93
44.02
74.55
3.80
1.22
3.18
18
11.93
28.71
40.94
56.66
CD 35% to 50%S Tax 17% Income Tax 5%TOTAL LEVIES 70%-89%
A CASE FOR “MAKE IN PAKISTAN”

Pak
ista
n E
con
om
ic F
oru
m I
V
Manufacturer’s ST ImpactActivity Com Importer’s ST Impact
RM Import
Conversion
Warehousing
Distribution
Marketing
Profit
Sales Price
None
None
None
None
None
None
None
None
None
None
None
None
ST 21% on
import value
only
ST 17% on
final price
covering ALL
elements of
value
addition
Manufacturers pay sales tax on entire value addition vs.importers only on import value
Under-invoicing is di�erential between Pakistan’s reported imports vs the exporting country’s reported exports to Pakistan.
Import Source Extent of Under-Invoicing* US$ Mn(2016)
China
EU
UAE (non-oil trade)
UK
USA
Thailand
Turkey
3,552
1,006
324
220
100
88.4
86.8
Under-Invoicingas % of Pakistan’sReported Imports
26
21
35
35
5
10
33
Under‐invoicing of Imports is Rampant and Significant
A CASE FOR “MAKE IN PAKISTAN”

Pak
ista
n E
con
om
ic F
oru
m I
V
Tax Evasion at Point of Entry 100% CompliantRs.
Full value
Declared/assessed value
Customs Duty
Regulatory Duty
S Tax on duty paid value
Presumptive tax
Total Tax Levy at import stage
Tax evaded at import stage
Tax evaded at import stage as % of Tax due
100
100
20
25
29
10
84
Rs.
Rs.
20%
25%
20%
6%
Rs.
Rs.
60% Under-invoicerRs.
100
40
8
10
12
4
34
-51
-60
Under‐invoicing is a major drain on tax revenueAnd undermines manufacturing
Tax Evasion as a result of presumptive Tax Regime Manufacturer
Landed cost in the books without input sales tax
Assume 50% mark up
Sales Value before output sales tax
Output Sales Tax
Price to customer
Net Profit for Compliant Manufacturer
Tax at 30% thereon
Add di�erence of output and input sales tax
Total taxes and import levies
Extent of evasion/avoidance
Evasion/avoidance as % of tax liability
145
73
218
37
254
73
22
8
104
Rs.
Rs.
Rs.
17%
Rs.
Rs.
Rs.
Rs.
Rs.
Rs.
Rs.
60% Under-invoicerCommercial Importer
34
-70
-67%
Presumptive tax creates an uneven playing field formanufacturing and results in total tax loss of 67%
A CASE FOR “MAKE IN PAKISTAN”
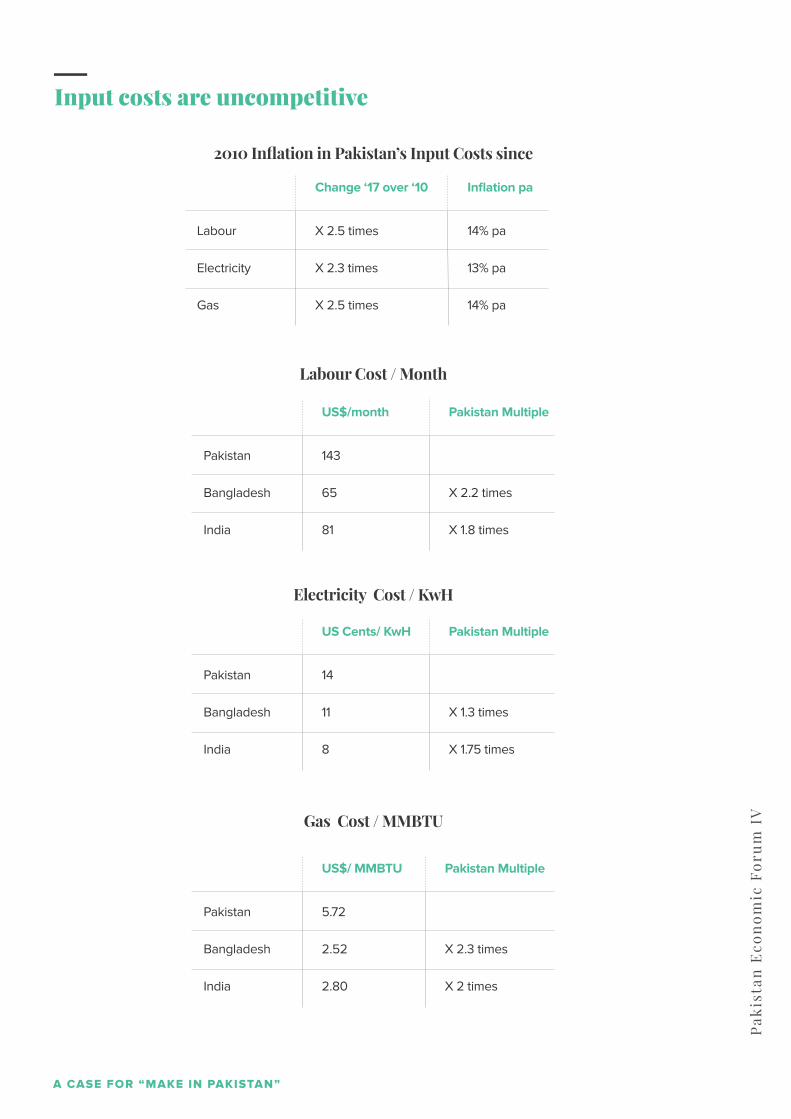
Pak
ista
n E
con
om
ic F
oru
m I
V
Input costs are uncompetitive
2010 Inflation in Pakistan’s Input Costs since
Change ‘17 over ‘10 Inflation pa
Labour
Electricity
Gas
X 2.5 times
X 2.3 times
X 2.5 times
14% pa
13% pa
14% pa
Gas Cost / MMBTU
US$/ MMBTU Pakistan Multiple
Pakistan
Bangladesh
India
5.72
2.52
2.80
X 2.3 times
X 2 times
Labour Cost / Month
US$/month Pakistan Multiple
Pakistan
Bangladesh
India
143
65
81
X 2.2 times
X 1.8 times
Electricity Cost / KwH
US Cents/ KwH Pakistan Multiple
Pakistan
Bangladesh
India
14
11
8
X 1.3 times
X 1.75 times
A CASE FOR “MAKE IN PAKISTAN”

Pak
ista
n E
con
om
ic F
oru
m I
V
The Rupee lost competitiveness against some sourcingand destination currencies over 5 years to end 2017
And it is not easy to manufacture/do business…
Gained Competitiveness Lost Competitiveness
Bangladesh
US$
Vietnam
Turkish
SL
India
Jap Yen
GBP
Euro
-10%
-5%
40%
5.20%
1.90%
12.30%
5%
-3.70%
-12.25%
ConstructionPermitsDays
GettingElectricityDays
Taxes Number
TaxesDays Taken
Time toExportDays
Time toImportDays
Karachi
South Asia Avg
260
194
311
277
406
369
129
113
215
137
47
28
A CASE FOR “MAKE IN PAKISTAN”

Pak
ista
n E
con
om
ic F
oru
m I
V
Solution:Aligned policies to promote domestic industry
Trade Policy
Fiscal Policy
Energy Policy
Bank Credit
Housing Policy
Agri Policy
DOMESTICINDUSTRY
A CASE FOR “MAKE IN PAKISTAN”

Pak
ista
n E
con
om
ic F
oru
m I
V
01
Thrusts Action Points Timeline
Stop undermining
domestic industry
through
ill-negotiated trade
agreements.
Complete the renegotiation of the Pak China FTA.
Move with caution on agreements with Turkey and
Thailand.
Factor impact on jobs and tax collection into future
agreements.
Encourage value-added exports, not just of commodities
Ongoing
Immediate
Immediate
Immediate
Salient Actions to Promote Domestic Industry
02
Thrusts Action Points Timeline
Create a more
level playing
field for
manufacturing
Withdraw the presumptive tax regime. All operating a
taxable activity must file returns.
Cascading tari�s on raw materials, intermediates and
finished goods with special provisions for manufacturers
who use high tari� inputs
Remove RD on raw materials and intermediates
Impose quantitative duties to check under‐valuation.
National Tari� Commission to be continuously functioning.
Levy import duty and GST on goods in transit to
Afghanistan, refundable on transit through Pakistan.
Immediate
Immediate
Immediate
Immediate
Ongoing
MT
A CASE FOR “MAKE IN PAKISTAN”

Pak
ista
n E
con
om
ic F
oru
m I
V
03
Thrusts Action Points Timeline
Provide reliable
energy at
competitive
cost. Energy cost
in Pakistan is
presently twice
that of the
region.
Pursue indigenization of fuel mix even if it takes time to
impact delivered cost. MT impact none, LT impact 2‐3
cents/KwH
Stem T&D losses currently at 19% to at least the non‐OECD
loss level of 10%. MT impact 1‐1.5 cents/KwH
Factor likely increase in cost of LNG as world demand shifts
to cleaner fuels. Could negate the shift from fuel oil.
Equalize energy costs between domestic and industrial
customers. Jobs from industry will provide disposable
income to domestic users.
Factor energy cost disparity into export rebates
MT
Immediate
04
Thrusts Action Points Timeline
A long‐term,
consistent,
export policy to
replace kneejerk,
short‐term
packages
Replace the 12‐18‐month export package with a 5‐year,
broad ‐based export policy to promote investment in
capacity and capability building.
Factor exchange rate and input cost disparity into export
rebates
Encourage value‐addition and export destination
diversification through more graduated rebates.
Automate rebates to ease cash flow.
MT
Immediate
Immediate
Immediate
A CASE FOR “MAKE IN PAKISTAN”

Pak
ista
n E
con
om
ic F
oru
m I
V
05
Thrusts Action Points Timeline
Fiscal policy
should
encourage
corporatization,
capital
formation,
accumulation,
consolidation
and investment
Withdraw Super Tax
Abolish tax on less than 40% profit distribution
Remove cascading tax on inter‐company dividends
Encourage risk‐taking by withdrawing minimum tax on
turnover for first three years of a business and then half the
rate for the following two years.
Promote corporatization through parity taxation of company
profits with individuals and AOPs in business.
Restore the group taxation regime enacted in the Finance
Act 2007 to promote holding companies and wider
shareholder participation.
Immediate
Immediate
Immediate
Immediate
Next budget
Next budget
06
Thrusts Action Points Timeline
Encourage low
and medium
cost housing to
address acute
shortage and to
generate
substantial
employment
Mortgage refinance to fund revolving tranches of long‐term
funding
Automate land records to create title visibility
Strengthen laws to facilitate repossession and resale in the
event of default
Create valuation transparency
Incentivize borrowers with fiscal relief on mortgage loan cost
Allow collateralization of up to Rs. 5 m of property without
wealth accountability for tax
Fiscal regime for development REITS be reviewed
MT
MT
MT
MT
Next budget
Next budget
Next budget
A CASE FOR “MAKE IN PAKISTAN”

Pak
ista
n E
con
om
ic F
oru
m I
V
07
Thrusts Action Points Timeline
Policies to
encourage new
ventures,
especially in IT.
Tax on the basis of profit rather than turnover
Make internet a�ordable by reducing incidence of taxes on
cellular equipment, cell-phone use and fixed line internet
Promote venture capital funds
Allow banks to take up to 5% exposure of their assets to
fund private equity/VC investments
Next budget
08
Thrusts Action Points Timeline
Grow private
sector credit,
especially to the
SME sector
Total private sector credit as % of GDP in Pakistan is
amongst the lowest in the world. SME credit is negligible
because banks prefer to lend risk-free to the government.
Credit guarantee scheme with a specified minimum
lending criterion, especially for the SME sector is required.
Banks should be encouraged to think of out-of-the-box
solutions to manage exposure.
The banking system needs to build appetite and resources
for long-term project finance.
MT
A CASE FOR “MAKE IN PAKISTAN”
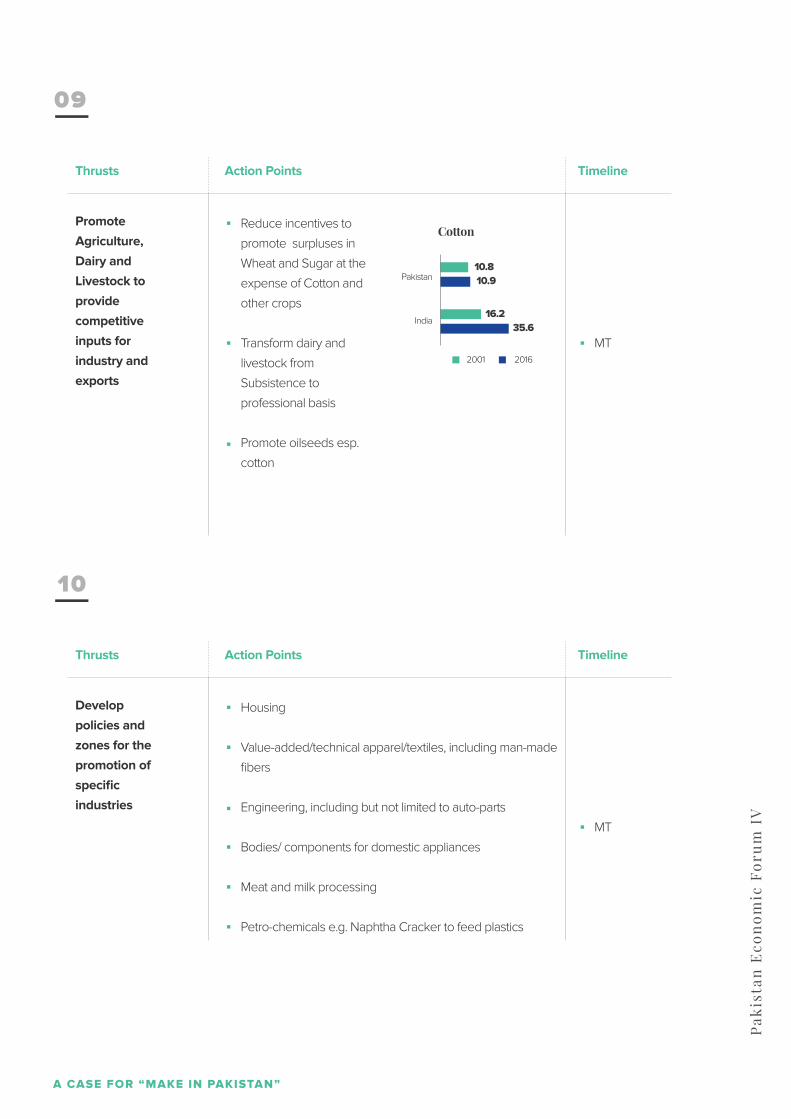
Pak
ista
n E
con
om
ic F
oru
m I
V
09
Thrusts Action Points Timeline
Promote
Agriculture,
Dairy and
Livestock to
provide
competitive
inputs for
industry and
exports
Reduce incentives to
promote surpluses in
Wheat and Sugar at the
expense of Cotton and
other crops
Transform dairy and
livestock from
Subsistence to
professional basis
Promote oilseeds esp.
cotton
MT
10
Thrusts Action Points Timeline
Develop
policies and
zones for the
promotion of
specific
industries
Housing
Value-added/technical apparel/textiles, including man-made
fibers
Engineering, including but not limited to auto-parts
Bodies/ components for domestic appliances
Meat and milk processing
Petro-chemicals e.g. Naphtha Cracker to feed plastics
MT
10.810.9
16.235.6
Pakistan
India
Cotton
2001 2016
A CASE FOR “MAKE IN PAKISTAN”
Pak
ista
n E
con
om
ic F
oru
m I
V P
akis
tan
Eco
no
mic
Fo
rum
IV
TOWARDSPAKISTAN’SENERGYSECURITY &COMPETITIVENESS
04
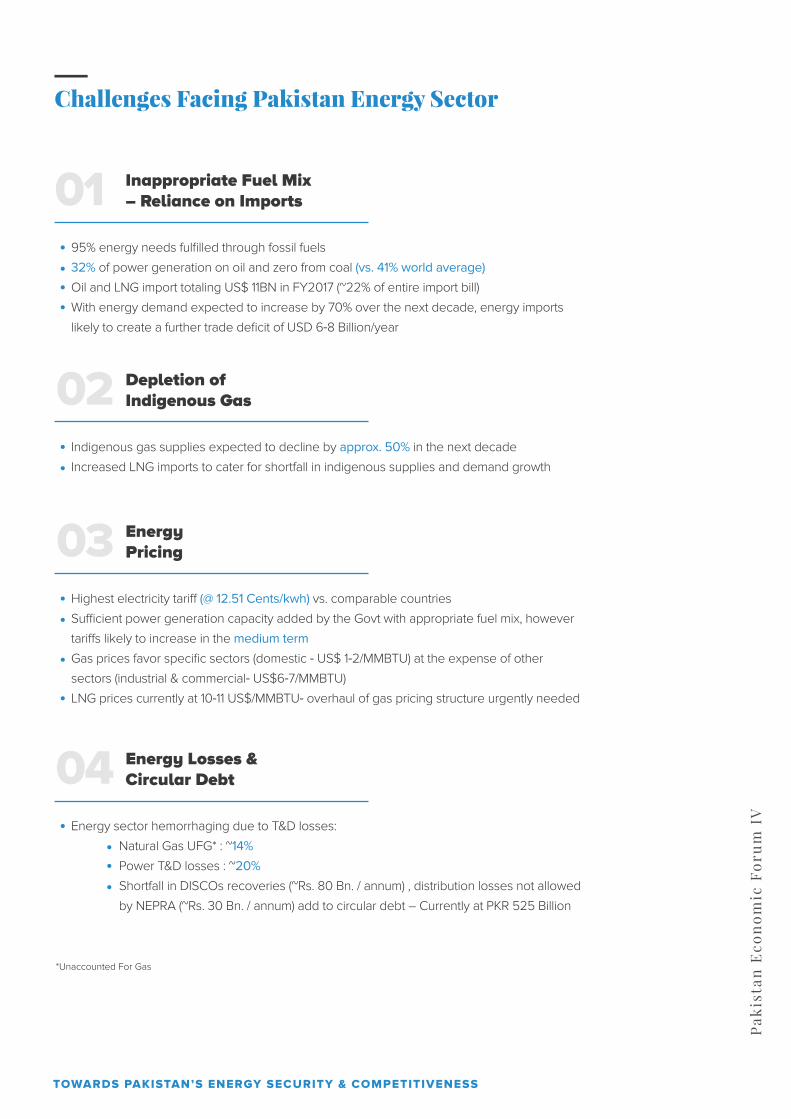
Pak
ista
n E
con
om
ic F
oru
m I
V
Challenges Facing Pakistan Energy Sector
Inappropriate Fuel Mix– Reliance on Imports01
95% energy needs fulfilled through fossil fuels
32% of power generation on oil and zero from coal (vs. 41% world average)
Oil and LNG import totaling US$ 11BN in FY2017 (~22% of entire import bill)
With energy demand expected to increase by 70% over the next decade, energy imports
likely to create a further trade deficit of USD 6‐8 Billion/year
Depletion ofIndigenous Gas02
Indigenous gas supplies expected to decline by approx. 50% in the next decade
Increased LNG imports to cater for shortfall in indigenous supplies and demand growth
EnergyPricing03
Highest electricity tari� (@ 12.51 Cents/kwh) vs. comparable countries
Su�cient power generation capacity added by the Govt with appropriate fuel mix, however
tari�s likely to increase in the medium term
Gas prices favor specific sectors (domestic ‐ US$ 1‐2/MMBTU) at the expense of other
sectors (industrial & commercial‐ US$6‐7/MMBTU)
LNG prices currently at 10‐11 US$/MMBTU‐ overhaul of gas pricing structure urgently needed
Energy Losses &Circular Debt04
Energy sector hemorrhaging due to T&D losses:
Natural Gas UFG* : ~14%
Power T&D losses : ~20%
Shortfall in DISCOs recoveries (~Rs. 80 Bn. / annum) , distribution losses not allowed
by NEPRA (~Rs. 30 Bn. / annum) add to circular debt – Currently at PKR 525 Billion
*Unaccounted For Gas
TOWARDS PAKISTAN’S ENERGY SECURITY & COMPETITIVENESS
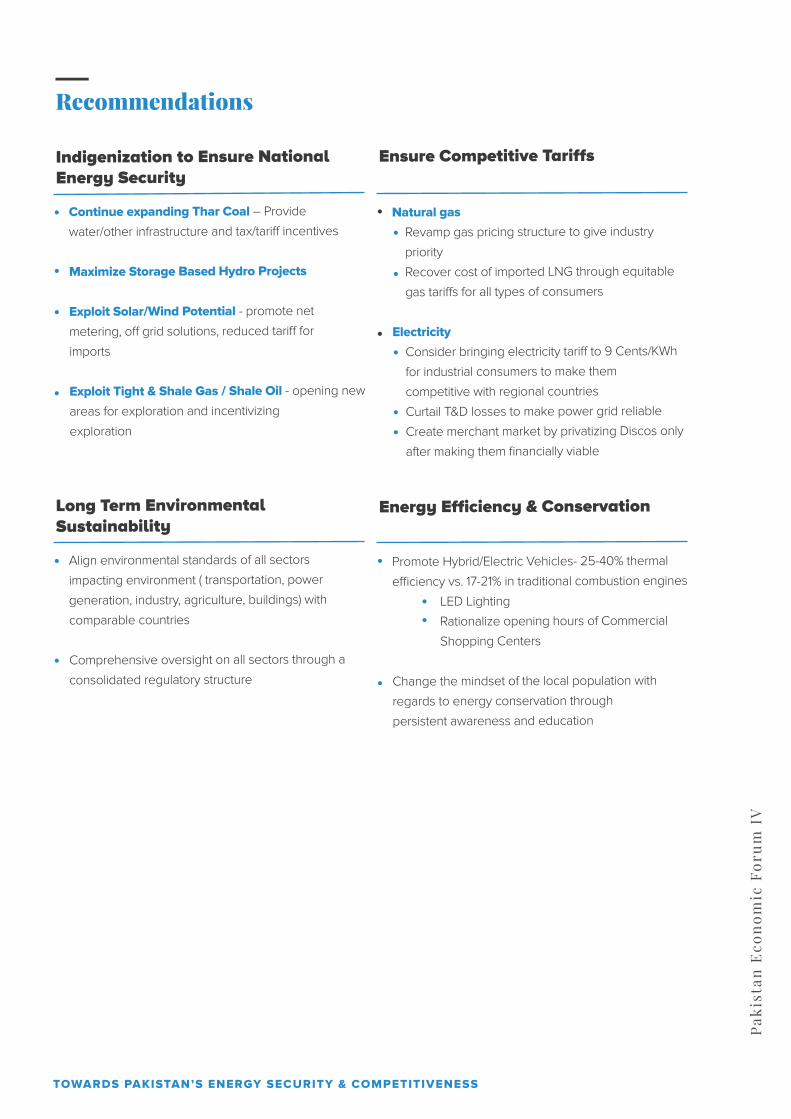
Pak
ista
n E
con
om
ic F
oru
m I
V
Recommendations
Indigenization to Ensure NationalEnergy Security
Continue expanding Thar Coal – Provide
water/other infrastructure and tax/tari� incentives
Maximize Storage Based Hydro Projects
Exploit Solar/Wind Potential - promote net
metering, o� grid solutions, reduced tari� for
imports
Exploit Tight & Shale Gas / Shale Oil - opening new
areas for exploration and incentivizing
exploration
Ensure Competitive Tariffs
Natural gas
Revamp gas pricing structure to give industry
priority
Recover cost of imported LNG through equitable
gas tari�s for all types of consumers
Electricity
Consider bringing electricity tari� to 9 Cents/KWh
for industrial consumers to make them
competitive with regional countries
Curtail T&D losses to make power grid reliable
Create merchant market by privatizing Discos only
after making them financially viable
Long Term EnvironmentalSustainability
Align environmental standards of all sectors
impacting environment ( transportation, power
generation, industry, agriculture, buildings) with
comparable countries
Comprehensive oversight on all sectors through a
consolidated regulatory structure
Energy Efficiency & Conservation
Promote Hybrid/Electric Vehicles- 25-40% thermal
e�ciency vs. 17-21% in traditional combustion engines
LED Lighting
Rationalize opening hours of Commercial
Shopping Centers
Change the mindset of the local population with
regards to energy conservation through
persistent awareness and education
TOWARDS PAKISTAN’S ENERGY SECURITY & COMPETITIVENESS
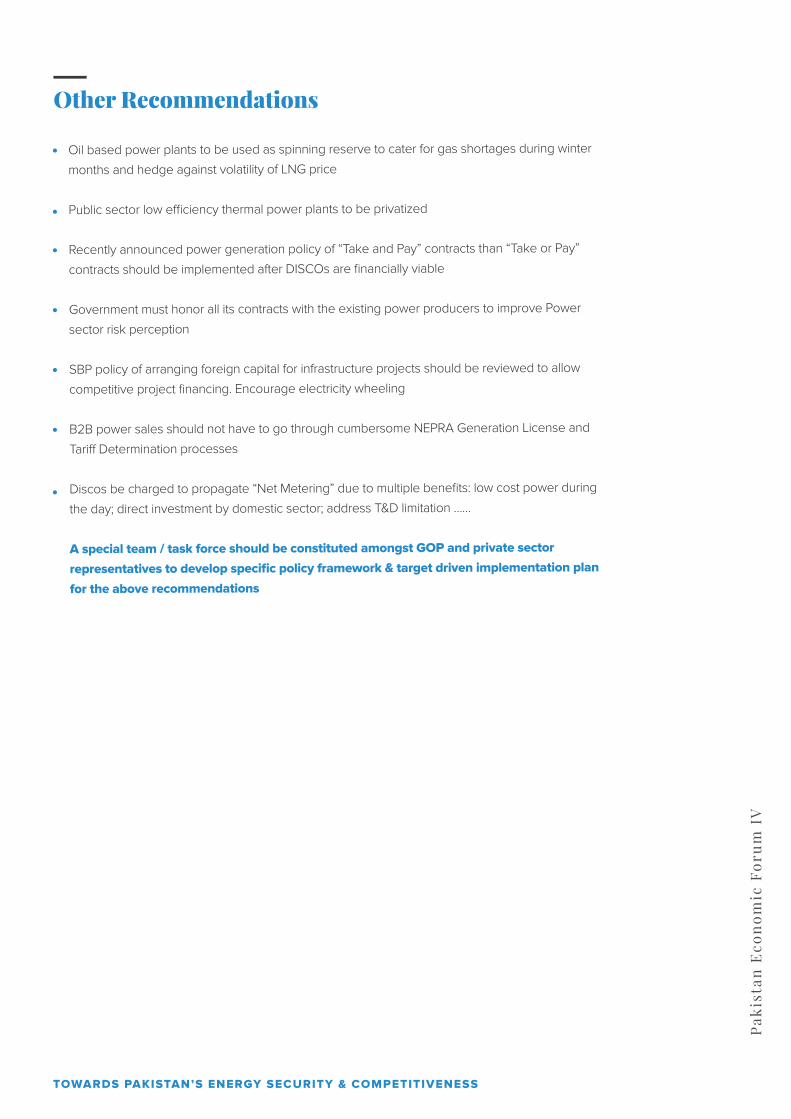
Pak
ista
n E
con
om
ic F
oru
m I
V
Other Recommendations
Oil based power plants to be used as spinning reserve to cater for gas shortages during winter
months and hedge against volatility of LNG price
Public sector low e�ciency thermal power plants to be privatized
Recently announced power generation policy of “Take and Pay” contracts than “Take or Pay”
contracts should be implemented after DISCOs are financially viable
Government must honor all its contracts with the existing power producers to improve Power
sector risk perception
SBP policy of arranging foreign capital for infrastructure projects should be reviewed to allow
competitive project financing. Encourage electricity wheeling
B2B power sales should not have to go through cumbersome NEPRA Generation License and
Tari� Determination processes
Discos be charged to propagate “Net Metering” due to multiple benefits: low cost power during
the day; direct investment by domestic sector; address T&D limitation ……
A special team / task force should be constituted amongst GOP and private sector
representatives to develop specific policy framework & target driven implementation plan
for the above recommendations
TOWARDS PAKISTAN’S ENERGY SECURITY & COMPETITIVENESS

Pak
ista
n E
con
om
ic F
oru
m I
V
Pakistan’s Power Generation Fuel mix is not sustainable due to the high
share of oil based power generation resulting in very high cost of electricity
BACKUP
Inappropriate Fuel Mix
31%
32%
31%
2%
0%
59%
9%
0%
2%
17%
41%
22%
4%
10%
17%
6%
13%
4%
Gas
Gas
Oil
Oil
Nuclear
Nuclear
Hydro
Hydro
Other/Rene Wable
Other/Rene Wable
Coal
Coal
Gas
Oil
Nuclear
Hydro
Other/Rene Wable
Coal
Pakistan
India
World
Sources:
- State of Industry Report, Pakistan (Figures as of 2016 )
‐ Growth of Electricity Sector in India, Ministry of Power, India, Key World Statistics,
International Energy Agency (Figures as of 2014)
According to SBP, the country imported approximately $10 Bn worth of oil and approximately $1 Bn worth of LNG in FY 17‐2016 – nearly 22% of the entire import bill!
Despite being a poor country, Pakistan has one of the most expensive choice of fuel mix for power generation
TOWARDS PAKISTAN’S ENERGY SECURITY & COMPETITIVENESS
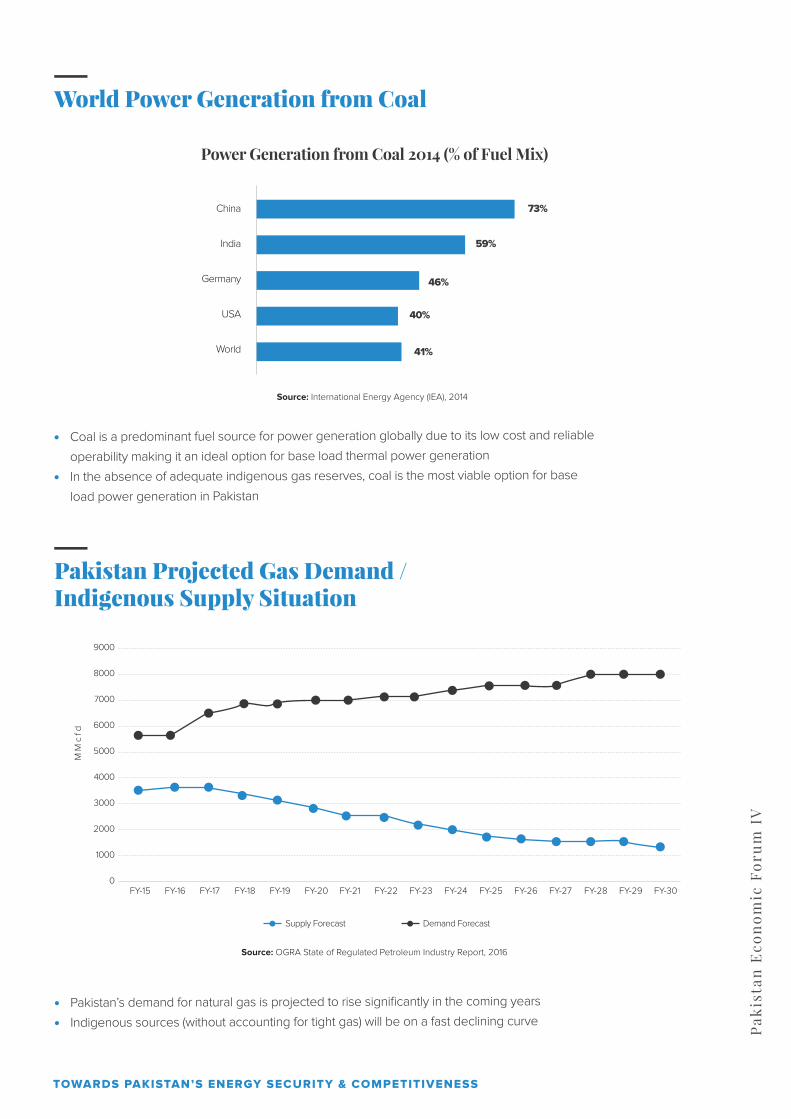
Pak
ista
n E
con
om
ic F
oru
m I
V
World Power Generation from Coal
Power Generation from Coal 2014 (% of Fuel Mix)
15.8% 73%
59%
46%
40%
41%
USA
Germany
India
China
World
Coal is a predominant fuel source for power generation globally due to its low cost and reliable
operability making it an ideal option for base load thermal power generation
In the absence of adequate indigenous gas reserves, coal is the most viable option for base
load power generation in Pakistan
Source: International Energy Agency (IEA), 2014
Pakistan Projected Gas Demand /Indigenous Supply Situation
MM
cfd
9000
8000
7000
6000
5000
4000
3000
2000
1000
0FY-15 FY-16 FY-17 FY-18 FY-19 FY-20 FY-21 FY-22 FY-23 FY-24 FY-25 FY-26 FY-27 FY-28 FY-29 FY-30
Supply Forecast Demand Forecast
Pakistan’s demand for natural gas is projected to rise significantly in the coming years
Indigenous sources (without accounting for tight gas) will be on a fast declining curve
Source: OGRA State of Regulated Petroleum Industry Report, 2016
TOWARDS PAKISTAN’S ENERGY SECURITY & COMPETITIVENESS
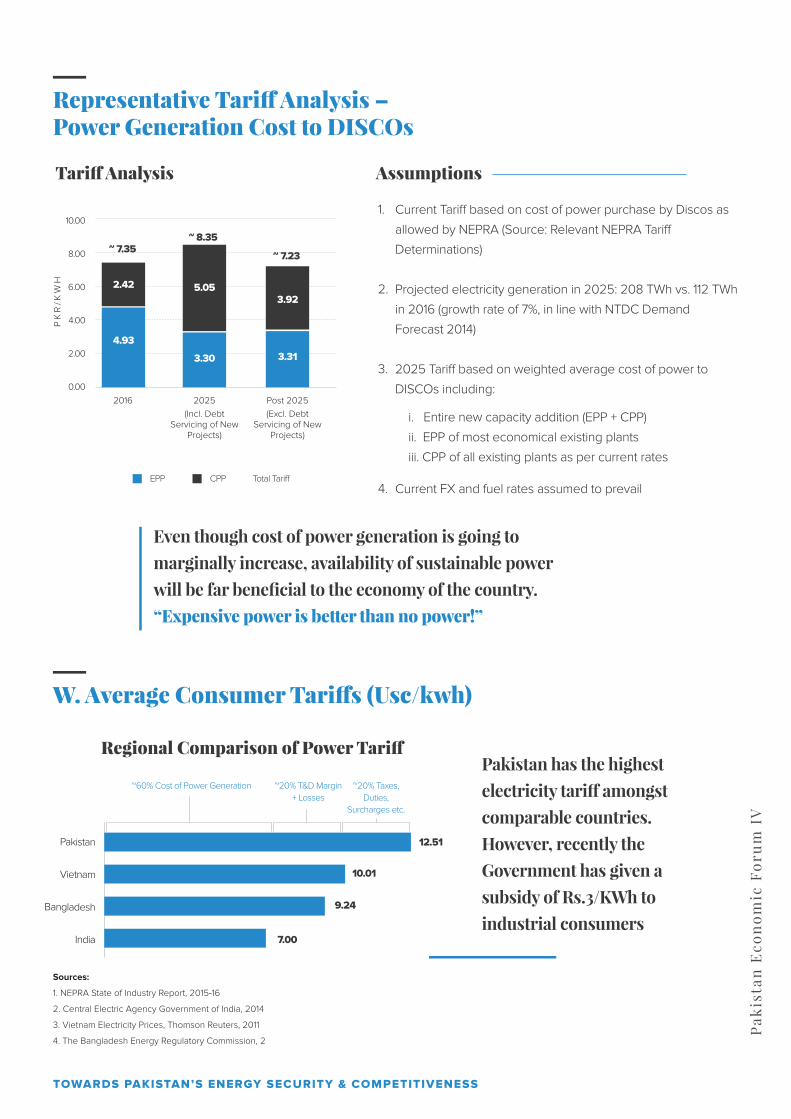
Pak
ista
n E
con
om
ic F
oru
m I
V
W. Average Consumer Tari�s (Usc/kwh)
~ 7.35~ 8.35
~ 7.23
12.51
10.01
9.24
7.00India
Bangladesh
Vietnam
Pakistan
Sources:
1. NEPRA State of Industry Report, 2015‐16
2. Central Electric Agency Government of India, 2014
3. Vietnam Electricity Prices, Thomson Reuters, 2011
4. The Bangladesh Energy Regulatory Commission, 2
Representative Tari� Analysis –Power Generation Cost to DISCOs
10.00
8.00
6.00
4.00
2.00
0.002016 2025 Post 2025
4.93
3.30
5.053.92
3.31
2.42
PK
R/K
WH
(Incl. Debt Servicing of New
Projects)
(Excl. Debt Servicing of New
Projects)
EPP CPP Total Tari�
AssumptionsTari� Analysis
Regional Comparison of Power Tari�
1.
2.
3.
4.
Current Tari� based on cost of power purchase by Discos as
allowed by NEPRA (Source: Relevant NEPRA Tari�
Determinations)
Projected electricity generation in 2025: 208 TWh vs. 112 TWh
in 2016 (growth rate of 7%, in line with NTDC Demand
Forecast 2014)
2025 Tari� based on weighted average cost of power to
DISCOs including:
Current FX and fuel rates assumed to prevail
i. Entire new capacity addition (EPP + CPP)
ii. EPP of most economical existing plants
iii. CPP of all existing plants as per current rates
Even though cost of power generation is going to marginally increase, availability of sustainable power will be far beneficial to the economy of the country. “Expensive power is better than no power!”
Pakistan has the highest electricity tari� amongst comparable countries. However, recently the Government has given a subsidy of Rs.3/KWh to industrial consumers
~60% Cost of Power Generation ~20% T&D Margin+ Losses
~20% Taxes,Duties,
Surcharges etc.
TOWARDS PAKISTAN’S ENERGY SECURITY & COMPETITIVENESS
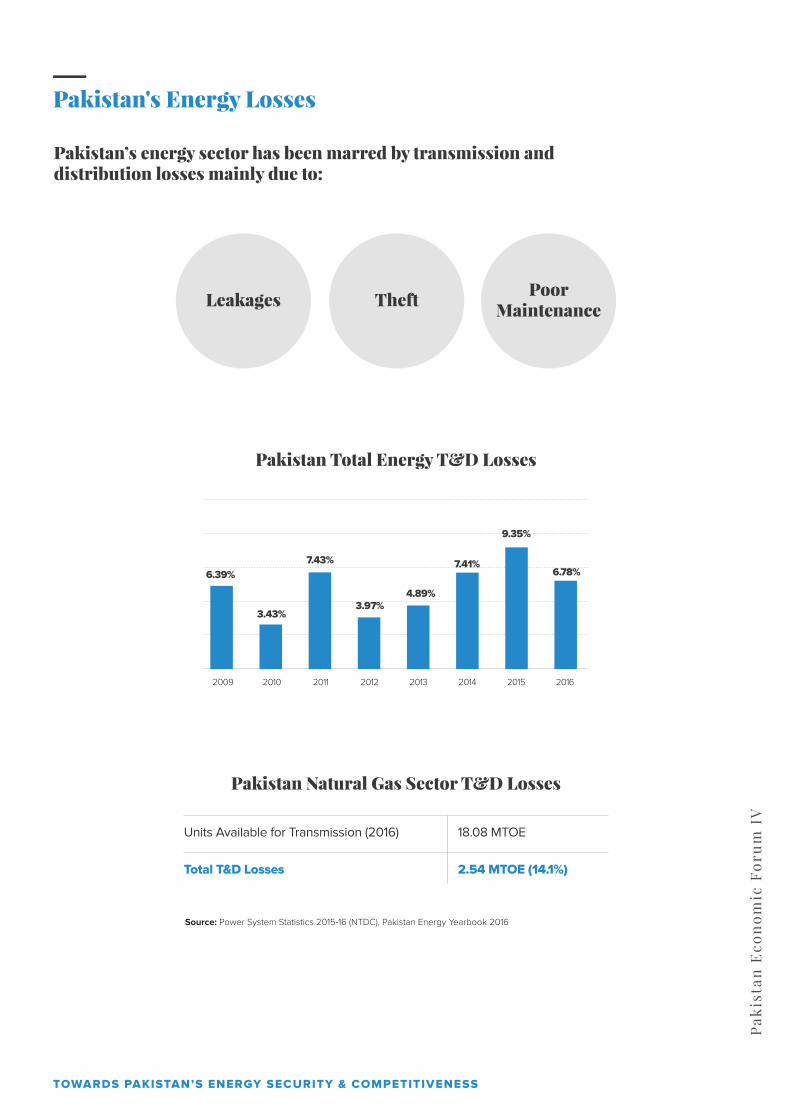
Pak
ista
n E
con
om
ic F
oru
m I
V
Pakistan’s energy sector has been marred by transmission anddistribution losses mainly due to:
Pakistan's Energy Losses
Theft PoorMaintenanceLeakages
Pakistan Total Energy T&D Losses
6.39%
3.43%
7.43%
3.97%
7.41%
9.35%
6.78%
4.89%
2009 2010 2011 2012 2013 2014 2015 2016
Source: Power System Statistics 2015‐16 (NTDC), Pakistan Energy Yearbook 2016
Pakistan Natural Gas Sector T&D Losses
Units Available for Transmission (2016)
Total T&D Losses
18.08 MTOE
2.54 MTOE (14.1%)
TOWARDS PAKISTAN’S ENERGY SECURITY & COMPETITIVENESS

Pak
ista
n E
con
om
ic F
oru
m I
V
Transmission and Distribution Losses
19.60%
18.46%
13.18%
8.95%
6.24%
India
Bangladesh
Vietnam
Thailand
Pakistan
Sources:
1. Power System Statistics 2015‐16 (NTDC)
2. International Energy Agency (IEA) Statistics, 2014
Regional Comparison of Power T&D Losses
Pakistan has the highest power T&D losses amongst comparable countries
Units Available for Transmission
Transmission Losses (NTDC)
Distribution Losses (DISCOs)
Total T&D Losses
100,871 GWh
2,623 GWh (2.60%)
16,762 GWh (17.02%)
19,385 GWh (19.6%)
DISCO’s T&D Losses FY 2016
38%
34%
27%24%
19%14%16%
11% 10% 9%
SEPCO PESCO HESCO QESCO TESCO MEPCO LESCO GEPCO FESCO IESCO
Degraded network and thefts contributing to high Transmission and Distribution Losses
TOWARDS PAKISTAN’S ENERGY SECURITY & COMPETITIVENESS
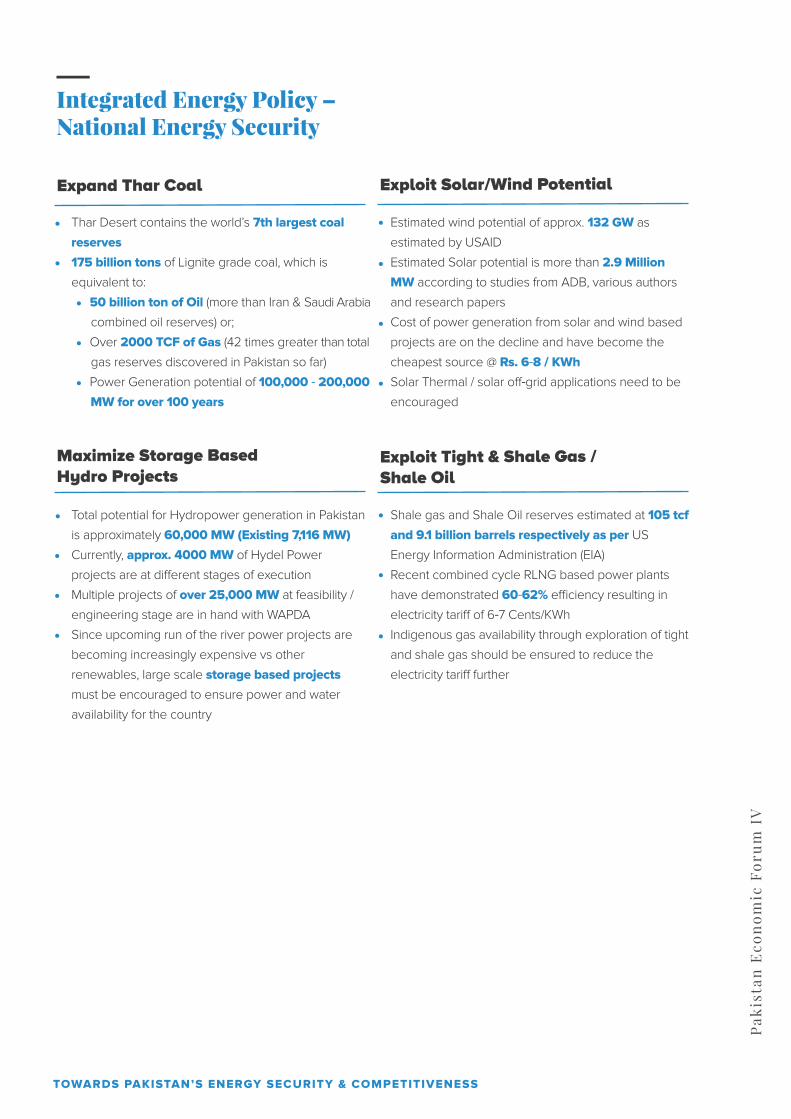
Pak
ista
n E
con
om
ic F
oru
m I
V
Integrated Energy Policy –National Energy Security
Expand Thar Coal Exploit Solar/Wind Potential
Maximize Storage BasedHydro Projects
Exploit Tight & Shale Gas /Shale Oil
Thar Desert contains the world’s 7th largest coal reserves175 billion tons of Lignite grade coal, which is
equivalent to:
50 billion ton of Oil (more than Iran & Saudi Arabia
combined oil reserves) or;
Over 2000 TCF of Gas (42 times greater than total
gas reserves discovered in Pakistan so far)
Power Generation potential of 100,000 ‐ 200,000 MW for over 100 years
Estimated wind potential of approx. 132 GW as
estimated by USAID
Estimated Solar potential is more than 2.9 Million MW according to studies from ADB, various authors
and research papers
Cost of power generation from solar and wind based
projects are on the decline and have become the
cheapest source @ Rs. 6‐8 / KWhSolar Thermal / solar o�‐grid applications need to be
encouraged
Total potential for Hydropower generation in Pakistan
is approximately 60,000 MW (Existing 7,116 MW)Currently, approx. 4000 MW of Hydel Power
projects are at di�erent stages of execution
Multiple projects of over 25,000 MW at feasibility /
engineering stage are in hand with WAPDA
Since upcoming run of the river power projects are
becoming increasingly expensive vs other
renewables, large scale storage based projects
must be encouraged to ensure power and water
availability for the country
Shale gas and Shale Oil reserves estimated at 105 tcf and 9.1 billion barrels respectively as per US
Energy Information Administration (EIA)
Recent combined cycle RLNG based power plants
have demonstrated 60‐62% e�ciency resulting in
electricity tari� of 6‐7 Cents/KWh
Indigenous gas availability through exploration of tight
and shale gas should be ensured to reduce the
electricity tari� further
TOWARDS PAKISTAN’S ENERGY SECURITY & COMPETITIVENESS
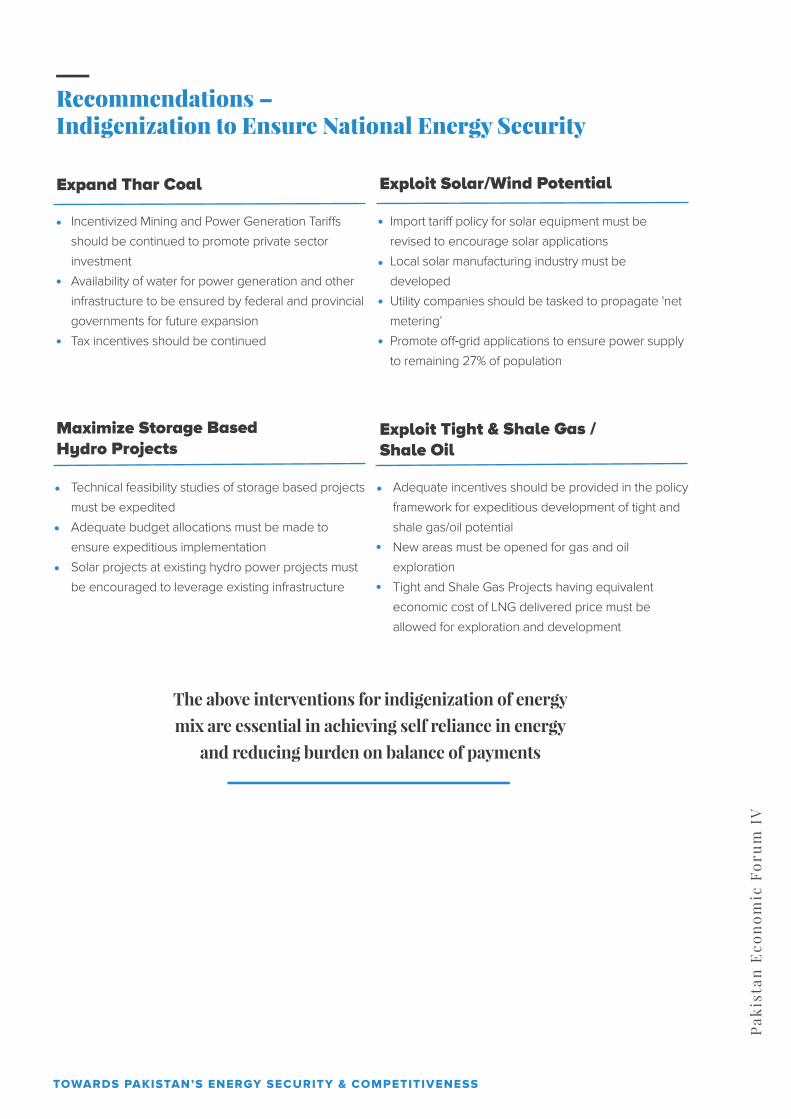
Pak
ista
n E
con
om
ic F
oru
m I
V
Recommendations –Indigenization to Ensure National Energy Security
Expand Thar Coal Exploit Solar/Wind Potential
Maximize Storage BasedHydro Projects
Exploit Tight & Shale Gas /Shale Oil
Incentivized Mining and Power Generation Tari�s
should be continued to promote private sector
investment
Availability of water for power generation and other
infrastructure to be ensured by federal and provincial
governments for future expansion
Tax incentives should be continued
Import tari� policy for solar equipment must be
revised to encourage solar applications
Local solar manufacturing industry must be
developed
Utility companies should be tasked to propagate 'net
metering’
Promote o�‐grid applications to ensure power supply
to remaining 27% of population
Technical feasibility studies of storage based projects
must be expedited
Adequate budget allocations must be made to
ensure expeditious implementation
Solar projects at existing hydro power projects must
be encouraged to leverage existing infrastructure
The above interventions for indigenization of energy mix are essential in achieving self reliance in energy
and reducing burden on balance of payments
Adequate incentives should be provided in the policy
framework for expeditious development of tight and
shale gas/oil potential
New areas must be opened for gas and oil
exploration
Tight and Shale Gas Projects having equivalent
economic cost of LNG delivered price must be
allowed for exploration and development
TOWARDS PAKISTAN’S ENERGY SECURITY & COMPETITIVENESS

Pak
ista
n E
con
om
ic F
oru
m I
VBuildings andOther Energy
Industry
Environmental impact must be viewed holistically.
Power sector contributes only 25% whereas
agriculture, transportation, industry and buildings
contribute the remaining 75% of global emissions
Environmental standards of all sectors must be
revisited and aligned with benchmarks of comparable
countries
Regulatory structure for environmental compliance
must be reviewed to ensure comprehensive
oversight on all sources of emissions
Long Term Environmental Sustainability
Agriculture, Forestryand Other Land Use24%
Transportation14%
Electricity andHeat Production25%
21%
16%
Source:
Intergovernmental Panel on Climate Change (IPCC), 2014
Share of Global Emissions
TOWARDS PAKISTAN’S ENERGY SECURITY & COMPETITIVENESS

Pak
ista
n E
con
om
ic F
oru
m I
V
Comparison of Upcoming Imported Coal PlantsEmissions with NEQS and IFC Standards
1400
1200
1000
800
600
400
200
0
MG
/NM
3
Nox Sox Particulate Matter
NEQS IFC Standard Proposed Limit
1200
510400
500
850
220
500
50 50
Significant Investment as part of project cost being made to ensure compliance with NEQS and IFC Emissions Standards
Environmental Impact of Change in Fuel Mix
Source: The World Bank, 2013
12,000
10,000
8,000
6,000
4,000
2,000
0
MG
/NM
3
Pakistan
153 198 457
2,035
5,186
10,249
PakistanProjected
UK India USA China
Total CO2 Emissions
TOWARDS PAKISTAN’S ENERGY SECURITY & COMPETITIVENESS
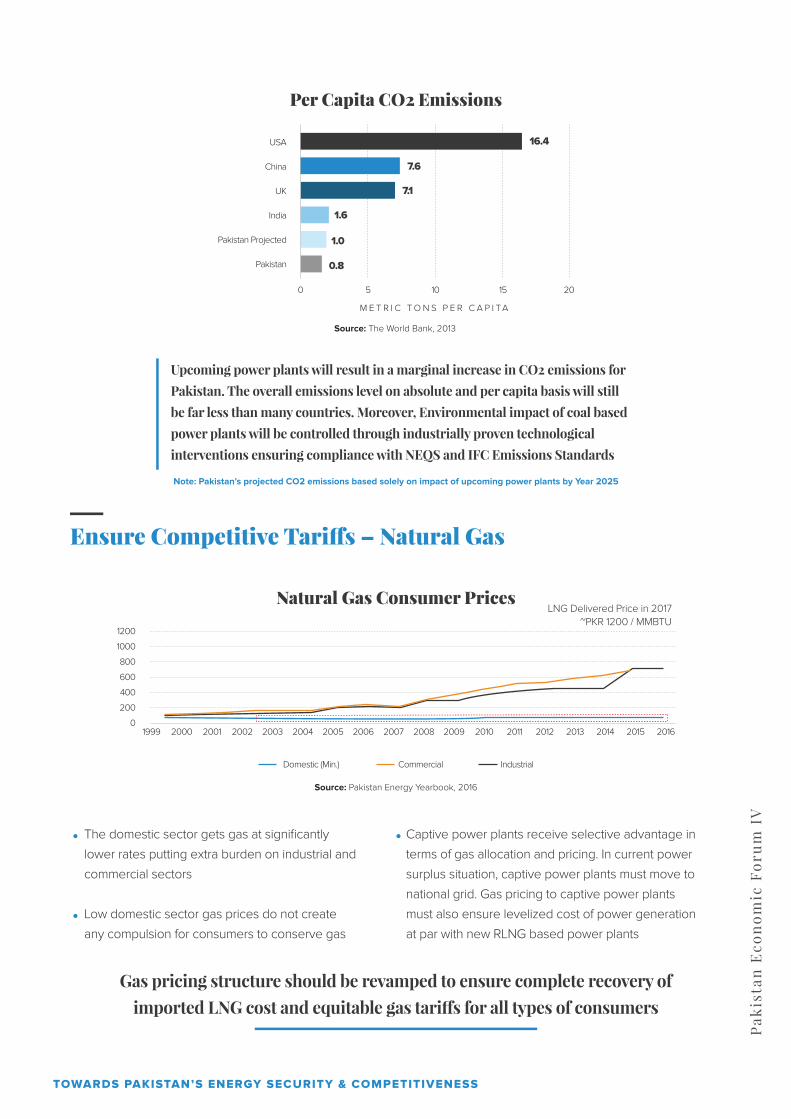
Pak
ista
n E
con
om
ic F
oru
m I
V
Gas pricing structure should be revamped to ensure complete recovery of imported LNG cost and equitable gas tari�s for all types of consumers
Per Capita CO2 Emissions
Natural Gas Consumer Prices
Source: The World Bank, 2013
M E T R I C T O N S P E R C A P I T A
Pakistan
16.4
7.6
7.1
1.6
1.0
0.8
Pakistan Projected
UK
India
USA
China
0 5 10 15 20
Note: Pakistan’s projected CO2 emissions based solely on impact of upcoming power plants by Year 2025
Upcoming power plants will result in a marginal increase in CO2 emissions for
Pakistan. The overall emissions level on absolute and per capita basis will still
be far less than many countries. Moreover, Environmental impact of coal based
power plants will be controlled through industrially proven technological
interventions ensuring compliance with NEQS and IFC Emissions Standards
Ensure Competitive Tari�s – Natural Gas
The domestic sector gets gas at significantly
lower rates putting extra burden on industrial and
commercial sectors
Low domestic sector gas prices do not create
any compulsion for consumers to conserve gas
Captive power plants receive selective advantage in
terms of gas allocation and pricing. In current power
surplus situation, captive power plants must move to
national grid. Gas pricing to captive power plants
must also ensure levelized cost of power generation
at par with new RLNG based power plants
Source: Pakistan Energy Yearbook, 2016
1200
1000
800
600
400
200
01999 2000 2001 2002 2003 2004 2005 2006 2007 2008 2009 2010 2011 2012 2013 2014 2015 2016
Domestic (Min.) Commercial Industrial
LNG Delivered Price in 2017~PKR 1200 / MMBTU
TOWARDS PAKISTAN’S ENERGY SECURITY & COMPETITIVENESS
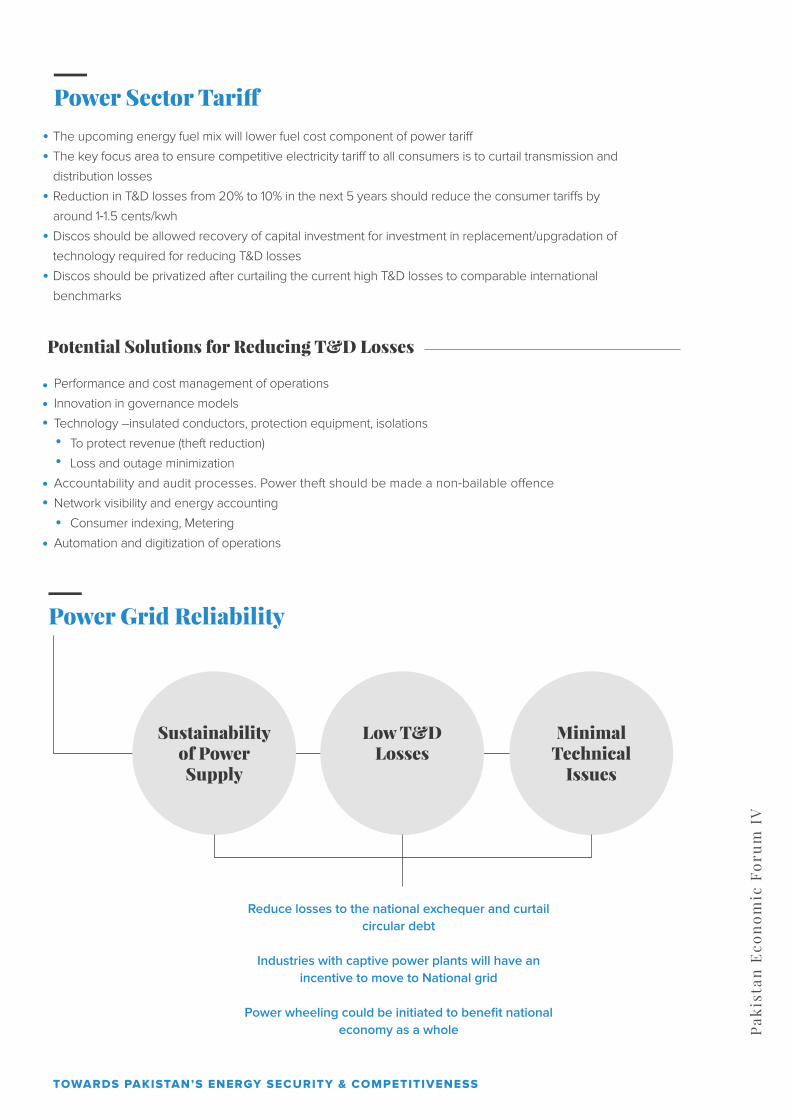
Pak
ista
n E
con
om
ic F
oru
m I
V
Power Sector Tari�
Reduce losses to the national exchequer and curtail circular debt
Industries with captive power plants will have an incentive to move to National grid
Power wheeling could be initiated to benefit national economy as a whole
Potential Solutions for Reducing T&D Losses
Performance and cost management of operations
Innovation in governance models
Technology –insulated conductors, protection equipment, isolations
To protect revenue (theft reduction)
Loss and outage minimization
Accountability and audit processes. Power theft should be made a non‐bailable o�ence
Network visibility and energy accounting
Consumer indexing, Metering
Automation and digitization of operations
Power Grid Reliability
Low T&DLosses
MinimalTechnical
Issues
Sustainabilityof PowerSupply
The upcoming energy fuel mix will lower fuel cost component of power tari�
The key focus area to ensure competitive electricity tari� to all consumers is to curtail transmission and
distribution losses
Reduction in T&D losses from 20% to 10% in the next 5 years should reduce the consumer tari�s by
around 1‐1.5 cents/kwh
Discos should be allowed recovery of capital investment for investment in replacement/upgradation of
technology required for reducing T&D losses
Discos should be privatized after curtailing the current high T&D losses to comparable international
benchmarks
TOWARDS PAKISTAN’S ENERGY SECURITY & COMPETITIVENESS

Pak
ista
n E
con
om
ic F
oru
m I
V
Integrated Energy Policy –Energy E�ciency & Conservation
Hybrid/Electric Vehicles
Conventional gasoline vehicles
only convert about 17%–21% of the
energy
Hybrid vehicles improve energy
e�ciency and consumption of
gasoline
EVs improve thermal e�ciency to
25‐40% vs. 17‐21% using gasoline
EVs also do not cause any
emissions
Hybrid & Electrical Vehicles should be promoted /incentivized in the new Auto Policy including installation of battery charging stations
LED Lighting
LED bulbs are approximately
50‐80% more e�cient than other
alternates
Import duties and sales tax on LED bulbs should be removed
Building codes andCommercial ShoppingCenters
Building codes should be revised
to achieve energy conservation
Shopping centers in big cities of
Pakistan do not fully utilize day
light, start businesses by midday
and remain open till midnight
Resultantly, there is a stress on
the electricity grid during peak
hours of the day
Strict adherence to business timings should be ensured for commercial centers
There is a need to change the mindset of the local population with regards to energy conservation through persistent awareness and education
TOWARDS PAKISTAN’S ENERGY SECURITY & COMPETITIVENESS
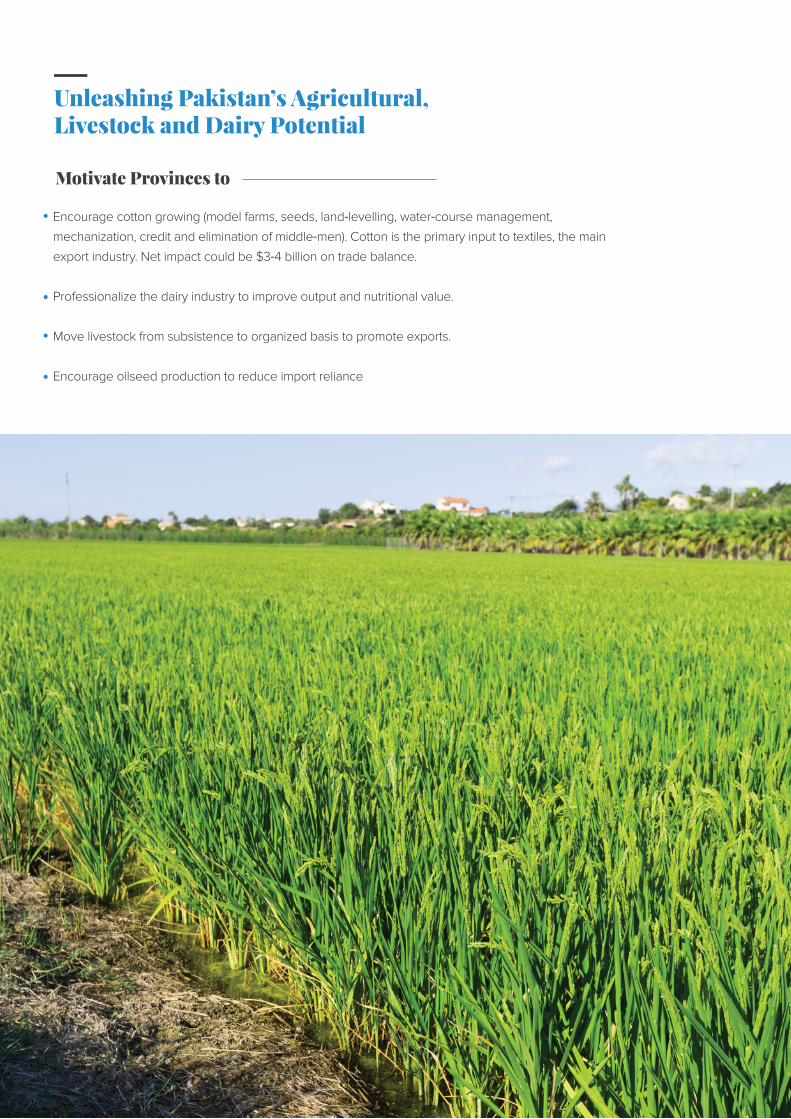
Pak
ista
n E
con
om
ic F
oru
m I
V
Unleashing Pakistan’s Agricultural,Livestock and Dairy Potential
Motivate Provinces to
Encourage cotton growing (model farms, seeds, land‐levelling, water‐course management,
mechanization, credit and elimination of middle‐men). Cotton is the primary input to textiles, the main
export industry. Net impact could be $3‐4 billion on trade balance.
Professionalize the dairy industry to improve output and nutritional value.
Move livestock from subsistence to organized basis to promote exports.
Encourage oilseed production to reduce import reliance

8th Floor, Dawood Center,M.T. Khan Road,Karachi, Pakistan
T - +92 21 3563 0528 - 29
F - +92 21 3563 0530
www.pbc.org.pk