PAKISTAN - ALHASAN SYSTEMS(PRIVATE) LIMITED | … District... · 2018-05-08 · District Badin...
77
Transcript of PAKISTAN - ALHASAN SYSTEMS(PRIVATE) LIMITED | … District... · 2018-05-08 · District Badin...

FATA
DISTRICT BADIN
EW
S
NPAKISTAN EMERGENCY SITUATIONAL ANALYSIS

SAHIBAN MAHAL (PALACE)Khadaro, District Badin, Sindh

PAKISTAN EMERGENCY SITUATIONAL ANALYSIS
“Disaster risk reduction has been a part of USAID’s work for decades. ……..we strive to do so in ways that better assess the threat of hazards, reduce losses, and ultimately protect and save
more people during the next disaster.”
Acting Director of the Disaster Response and Mitigation Division of USAID’s O�ce of U.S. Foreign Disaster Assistance (OFDA)
District Badin October 2012
“Disasters can be seen as often as predictable events, requiringforward planning which is integrated in to broader
development programs.”Helen Clark, UNDP Administrator, Bureau of Crisis Prevention and Recovery. Annual Report 2011

©Copyright 2012 ALHASAN SYSTEMS PRIVATE LIMITED 205-C 2nd Floor, Evacuee Trust Complex, Sector F-5/1, Islamabad, 44000 Pakistan 195-1st Floor, Deans Trade Center, Peshawar Cantt; Peshawar, 25000 Pakistan For information: Landline: +92.51.282.0449, +92.91.525.3347 Email: [email protected] Facebook: http://www.facebook.com/alhasan.com Twitter: @alhasansystems Website: www.alhasan.com ALHASAN SYSTEMS is registered with the Security & Exchange Commission of Pakistan under section 32 of the Companies Ordinance 1984 (XL VII of 1984). ALHASAN is issuing this Pakistan Emergency Situational Analysis – PESA® series free of cost in digital for general public benefit and informational purposes only. Should you have any feedback or require for further details and Metadata information please call us at Landline: +92.51.2820449, Fax: +92 51 835 9287 or email at [email protected] LEGAL NOTICES The information in this publication, including text, images, and links, are provided "AS IS" by ALHASAN SYSTEMS solely as a convenience to its clients and general public without any warranty of any kind, either expressed or implied, including, but not limited to, the implied warranties of merchantability, fitness for a particular purpose, or non-infringement. ALHASAN SYSTEMS assumes no responsibility for errors or omissions in this publication or other documents which are referenced by or linked to this publication. This publication could include technical or other inaccuracies, and not all information/ services referenced herein are available in all areas. Changes are periodically added to the publication, and ALHASAN may change the information or services described in this publication at any time. Should you choose to respond directly to ALHASAN SYSTEMS with comments, questions, suggestions, ideas or the like relating to this publication and ALHASAN SYSTEMS other services and products, you agree that such information shall be deemed as non-confidential and ALHASAN SYSTEMS shall have no obligation to respond and be free to reproduce, use, disclose and distribute the information to others without limitation, including but not limited to developing, manufacturing, and marketing products incorporating such information. For further explanation of these legal notices please contact [email protected].

ALHASAN SYSTEMS is publishing this series of Pakistan Emergency Situational Analysis – PESA® district profiles in digital format free of cost as its effort to enhance Crisis Response Knowledge Management and Disaster Risk Management [DRM] capacity in Pakistan.
Thanks to my team that has contributed tirelessly and at many times voluntarily; under extreme emergency pressure, to consistently deliver their best on time since 2010. Thanks to our Director Technical Mr. Naeem Ahmad for his solid believe in our contributions, which we both started with extremely limited resources. Thanks to Mr. Fayyaz Ali Khan our Advisor on this series of PESA® profiles.
My sincere respect and salute to Mr. Sarfaraz Ayub Meher Din, Mr. Farooq Laghari, Mr. Qassim Jan, Ms. Imra Shaheen, Mr. Naveed Alam, Mr. Mutee ul Rehman, Mr. Pervaiz Ahmed, Ms Hadya Ali. Ms. Shazia Kanwal, Mr. Zohaib Fazal, Ms. Sumbal Kazmi, Mr. Salman Mulk, Mr. Muneeb Muzamil, Mr. Muhammad Javed Iqbal, Ms. Mahwish Muzamil, Ms. Maryum Sheikh, Ms. Fatima Ali, Dr. Ahmad Ali Malik, Mr. Mubashir Hussain, Ms. Fatima Gilani, Ms. Rabeea Wajheeha, Mr. Naseer Ahmad, Mr. Zeeshan Ahmad, Mr. Nouman Ali, Mr. Muhammad Akhtar, Mr. Umar Ashraf, Mr. Muhammad Wajid, Mr. Abid Ali, Fazl-e-Khaliq, and Mr. Zohaib Khan.
Mehdi Bokhari Chief Executive Officer
ALHASAN SYSTEMS
Credits


1 Table of Contents District Badin at Glance ......................................................................................................................... i Badin Reference Map........................................................................................................................... ii Acronyms ............................................................................................................................................ iii 1 Background Information
1.1 Introduction................................................................................................................ 1 1.1.1 History ................................................................................................................. 1 1.1.2 Geography ........................................................................................................... 1 1.1.3 Culture (Ethnicity, Religion, Languages and politics): ......................................... 2 1.1.4 Administrative Division: ...................................................................................... 3 1.1.5 Road Network Infrastructure .............................................................................. 3 1.1.6 Irrigation.............................................................................................................. 4 1.1.7 Solid Waste Management ................................................................................... 5
1.2 Demography ............................................................................................................... 6 1.2.1 Population Characteristics .................................................................................. 6 1.2.2 Population Growth Pattern ................................................................................. 7 1.2.3 Population Distribution by Age and Gender ....................................................... 7 1.2.4 Dependent Population ........................................................................................ 8
1.3 Population Density Map ............................................................................................. 9 1.4 Livelihood ................................................................................................................. 10
1.4.1 Main Sources of Livelihood/Income ................................................................. 10 1.4.2 Agriculture ........................................................................................................ 11 1.4.3 Industry ............................................................................................................. 15 1.4.4 Livestock ............................................................................................................ 15 1.4.5 Fishing ............................................................................................................... 15 1.4.6 Oil Production ................................................................................................... 16
1.5 Food Security ............................................................................................................ 17 1.5.1 Availability ......................................................................................................... 17 1.5.2 Access ................................................................................................................ 17 1.5.3 Utilization .......................................................................................................... 19
1.6 Health ....................................................................................................................... 22 1.6.1 Details of Health Facilities ................................................................................. 22 1.6.2 Badin Health Facilities Map .............................................................................. 23
1.7 Education .................................................................................................................. 24 1.7.1 Highlights .......................................................................................................... 24 1.7.2 District School Enrolment Ratio ........................................................................ 24 1.7.3 Gender and Level Wise Details ......................................................................... 25
2 Disaster History and Its Impact 2.1 Disasters in Badin ..................................................................................................... 27
2.1.1 Disaster History ................................................................................................. 27

2.1.2 Risk Analysis Map of District Badin .................................................................. 29 2.1.3 Badin Safe Location Map .................................................................................. 31
2.2 2011 Flood’s Impact ................................................................................................. 32 2.2.1 Demography ...................................................................................................... 32 2.2.2 Affected Population Density Map ..................................................................... 34 2.2.3 Livelihood .......................................................................................................... 35 2.2.4 Health ................................................................................................................ 39 2.2.5 Education .......................................................................................................... 41 2.2.6 Infrastructure Damage ...................................................................................... 42
3 Hazard, Vulnerability and Capacity Analysis 3.1 Hazard Vulnerability and Capacity Analysis ............................................................. 44
3.1.1 Hazard ............................................................................................................... 44 3.1.2 Vulnerability ...................................................................................................... 45 3.1.3 Capacity ............................................................................................................. 48 3.1.4 Badin Hazard Analysis Map ............................................................................... 51 3.1.5 Badin Irrigation Vulnerability Map ................................................................... 52
4 Coordination and Support Services Annexures 4.1 Annexure 1: List of Health Facilities ......................................................................... 53
4.1.1 List of Rural Health Centre (RHC) ...................................................................... 53 4.1.2 List of Basic Health Units (BHU) ........................................................................ 53 4.1.3 List of Dispensaries ........................................................................................... 54 4.1.4 BHU Rooms by Type and Number .................................................................... 54 4.1.5 Furniture and other material in BHUs .............................................................. 55 4.1.6 Availability of Instruments in Health Units ....................................................... 55 4.1.7 Present Staff in Health Units ............................................................................. 55
4.2 Annexure 2: List of Physical Assets and Infrastructure ............................................ 56 4.2.1 Machinery & Equipment available in the District with different stakeholders 56 4.2.2 List of NGOs working in Badin........................................................................... 56 4.2.3 List of Departmental Focal Points For Emergency Response ........................... 58 4.2.4 List of Control Rooms used in Emergency ........................................................ 58 4.2.5 List of Police Stations/Police Posts ................................................................... 59
4.3 Annexure 3: List of Road Network by National Highway Authority......................... 60 4.3.1 List of Road Networks Available in Badin District ............................................. 60

List of Tables and Maps List of Tables
Sr. No. Name Page 1.1.1 Administrative Division of District Badin 3 1.1.2 Road network Infrastructure of Badin 3 1.1.3 Entry-Exit Points for District Badin 3 1.2.1 Estimated Population of District Badin 5 1.2.2 Population Details by Taluka for 2010 7 1.3.1 Number of Mouzas Reporting Sources of Employment 9 1.3.2 Food and Cash Crops Cultivated in District Badin 10 1.3.3 Area of Major Crops Sown in District Badin in 2011 13 1.4.1 Distance of Mouzas from Markets 16 1.4.2 Prices of commodities Across the Markets and the Change Compared to Pre-Flood Period 16 1.4.3 Mouza Reporting Credit Facility by Type of Institution and by Gender 17 1.4.4 Water Delivery at Household Level 17 1.4.5 Sanitation Facilities at Household Level 17 1.4.6 Percent Distribution of Household with Sanitation Facility by Type 18 1.4.7 Percent Distribution of Household by Status of Sanitation Facility 18 1.6.1 Gross and Net Enrolment Rates by Gender and Locality at Different levels 22 1.6.2 Enrolment and Educational Facilities by level and Gender 23 2.1.1 Disaster history and losses in Badin 24 2.1.2 Details of Disaster Prone UCs 27 2.2.1 Demographic Losses and Damages 28 2.2.2 Taluka wise affected population 30 2.2.3 Livestock Losses 33 2.2.4 Area Inundated and Crop Area Damaged 33 2.2.5 Major Crops Damage reported by FAO 33 2.2.6 Major Crops Damage reported by Multi-Cluster Needs Assessment 34 2.2.7 Activities Performed by the Education Cluster 38 2.2.8 Government Infrastructure Damage 39 2.2.9 Roads Damage
List of Maps 1 Badin Reference Map iv 2 Population Density Map 8 3 Badin Health Facilities Map 20 4 Risk Analysis Map 26 5 Badin Possible Safe Location Map 28 6 Affected Population Density Map 31 7 Badin Hazar Analysis Map 48 8 Badin Irrigation Vulnerability Map 49

District Badin at Glance
1 Current area of Badin district after administrative changes is 6,527 km2 2 Updates of National Rural Support Programme’s (NRSP) Response to Floods as of 13 November, 2011 3 Election Commission of Pakistan (http://www.ecp.gov.pk/VoterStats/Sindh.aspx)
Area 6,7261 km2
Population - 1998 1,136,044 persons Male 597,573 (52.60 %) Female 538,471 (47.40 %) Sex Ratio (males per 100 females) 111 Population Density 168.9 per Km2
Urban Population 186,488 (16.42 %) Rural Population 949,556 (83.58 %) Average Household Size 5.3 Literacy Ratio (10 +) 24.60% Male 35.07% Female 12.90% Total Fertility Rate (TFR) 4.90% Contraceptive Prevalence Rate (CPR) 15.10% Population (60 and above) 5.10% Population - 1981 776,614 persons Average Annual Growth Rate (1981 - 98) 2.26% Total Housing Units 211,354 Pakka Housing Units 34,201 (16.18 %) Housing Units having Electricity 74,268 (35.14 %) Housing Units having Piped Water 27,485 (13.00 %) Housing Units using Gas for Cooking 7,184 (3.40 %) Administrative Units Talukas2 5 Union Councils 46 Mauzas 511 Municipal Committee 2 Town Committees 8 Registered Voters (Gross)3 618,445 Male 331,654 Female 286,791

Aza
dK
ashm
ir
Bal
ochi
stan
Dis
pute
dTe
rrito
ryFa
ta
Gilg
itB
altis
tan
Khy
ber
Pak
htun
khw
aP
unja
b
Sin
dh
Ara
bian
Sea
" u" u
j" u
" u"'
-"'
" u" u
" u" u
" u" u
"'" u
" u" u
-"'
" u" u
" u-
" u"'
" u" u
" u-
" u" u
j" u
j" u
"'" u
" u"'
" u-
" u" u
"'"'"'
"'"'
®v" uj
" u"'
" u" u
" u"'
"'"'
" u-" u
" u
" u" u" u
!.
!.!.
!.
!.!.!.
!.!.
!.!.!.!.!.
!.!.!.!.
!.
!.!.
!.!.!.
!.!.!.!.!.
!.!.!.
!.!.
!.!.!.
!.!.
!.
!.!.!.
!.
!.!.!.
!.
!.!.!.!.
!.!.
!.!.!.!.
!.!.
!.!.!.
!.!.!.
!.!.
!.!.!.!.!.
!.!.!.!.!.
!.!.
!.!.!.
!.!.!.!.
!.!.!.!.
!.!.
!.
!.!.!.!.
!.!.
!.!.
!.!.!.!.!.
!.!.!.
!.!.!.
!.!.!.
!.
!.!.!.
!.
!.!.
!.!.
!.
!.!.
!.
!.!.!.
!.!.
!.!.
!.!.!.!.
!.!.
!.!.
!.!.!.!.!.!.!.!.!.
!.!.
!.!.!.
!.!.!.
!.!.!.
!.!.!.
!.!.!.!.
!.!.
!.!.!.
!.!.!.
!.!.!.!.
!.!.!.!.
!.!.
!.!.
!.!.
!.!.!.!.!.
!.!.
!.
!.!.
Bad
in
Hyd
erab
ad
Jam
shor
o
Mir
purk
has
Tand
o A
llah
Yar
Tand
oM
uham
mad
Kha
n
Thar
park
ar
That
ta
Um
erko
t
Bad
in
Mat
li
Sha
heed
Faza
lR
ahu
Talh
ar
Tand
oB
ago
Map
dat
a so
urce
(s):
Log
Clu
ster
-Wor
ld F
ood
Pro
gram
(WFP
): R
oads
, Rai
lway
Net
wor
kN
atio
nal G
eosp
atia
l Age
ncy-
US
A (N
GA
): S
ettle
men
tsP
opul
atio
n C
ensu
s O
rgan
izat
ion
(PC
O):
Adm
in b
ound
arie
sTh
e Lo
uis
and
Ber
ger
Gro
up (L
BG
) :
LBO
Ds
Uni
ted
Nat
ions
Ope
ratio
nal S
atel
lite
(U
NO
SAT
) : F
lood
Ext
ents
Wor
ld H
ealth
Org
aniz
atio
n (
WH
O)
: H
ealth
Fac
ilitie
s
Dis
clai
mer
s:Th
e de
sign
atio
ns e
mpl
oyed
and
the
pres
enta
ti on
of m
ater
ial o
n th
is m
ap d
ono
t im
ply
the
expr
essi
on o
f any
opi
nion
wha
tsoe
ver o
n th
e pa
rt of
iMM
AP
or
US
AID
con
cern
ing
the
lega
l sta
tus
of a
ny c
ount
ry, t
errit
ory,
city
or
area
or o
fits
aut
horit
ies,
or c
once
rnin
g th
e de
limita
tion
of it
s fr
ontie
rs o
r bo
unda
ries.
Map
Doc
Nam
e:
Cre
atio
n D
ate:
Pro
ject
ion/
Dat
um:
Web
Res
ourc
es:
iM
MA
P_P
AK
_Bad
int r
efer
ence
Map
_A4L
_v01
_061
912
June
19,
201
2W
GS
84ht
tp://
ww
w.im
map
. org
Mai
n M
ap
Bad
in -
Ref
eren
ce M
ap
Lege
nd!.
Set
tlem
ents
(N
GA
)H
ealth
Fac
ilitie
s (W
HO
)" u
Bas
ic H
ealth
Uni
t
"'D
ispe
nsar
y
jH
ospi
tal
®vM
ater
nal&
Chi
ld H
ealth
Cen
tre-
Rur
al H
ealth
Cen
treR
oads
(WFP
)R
ailw
ays
(PC
O)
Left
Ban
k O
utfa
ll D
rain
age(
LBG
)Fl
ood
Ext
ent 2
010
(UN
OS
AT)
Floo
d E
xten
t 201
1 (U
NO
SAT
)Te
hsil
boun
dary
(PC
O)
Bad
in (P
CO
)D
istri
ct b
ound
ary
(PC
O)
010
205
Kilo
met
ers
Afg
hani
stan
Indi
aIra
n
Indi
a
BHU Basic Health Unit CPR Contraceptive Prevalence Rate CFW Cash For Work DDRMP District Disaster Risk Management Plan ECP Election Commission of Pakistan FAO Food and Agricultural Organization GER Gross Enrolment Rate GOS Government of Sindh Hh Household LBOD Left Bank Outfall Drain LHDP Laar Humanitarian & Development Programme NADRA National Database and Registration Authority NDMA National Disaster Management Authority NDP National Drainage Programme NER Net Enrolment Rate NFIs Non-Food Items NGA National Geospatial Agency USA NGO Non-Governmental Organization NHA National Highway Authority NRSP National Rural Support Programme PBS Pakistan Bureau of Statistics PCO Population Census Organization PDMA Provincial Disaster Management Authority PLW Pregnant and Lactating Women PSLM Pakistan Social and Living Standard Measurement Survey RHC Rural Health Centre SDPI Sustainable Development Policy Institute SPO Strengthening Participatory Organization SUPARCO Space and Upper Atmosphere Research Commission TFR Total Fertility Rate TLC Temporary Learning Centres TSS Transitional School Structure UNDP United Nations Development Programme UNICEF United Nations Children's Fund UNOCHA United Nations Office for the Coordination of Humanitarian Affairs WFP World Food Programme WHO World Health Organization

1 Background Information 1.1 Introduction
1.1.1 History Badin is among one of the most important coastal districts of the Sindh Province. Though, a major district of Sind, its history, in particular, is related with the history of lower Sindh. This area was the centre of the ancient Indus Valley Civilization. According to Wikipedia, the free encyclopaedia, “some of the places in Sindh have been inhabited as early as the 3rd millennium BC. A large number of Indus valley sites have been found in Sindh. Sindh was ruled by local Hindu and Buddhist rulers until 712 CE, when it was invaded by the Arabs and incorporated into part of the Umayyad Caliphate.” The area remained under the rule of the caliphate until its control was taken over by the Ghaznavids, a Muslim dynasty of Turkic slave origin. In 1592, Sindh came under the direct rule of the Mughal Empire4. However, after the advent of the British in the subcontinent and as the Mughal Empire started to disintegrate, Sind was made part of British India's Bombay Presidency, in 1847. The Government of India Act 1935 made the Bombay Presidency into a regular province, and made Sind a separate province in 1936. Subsequently, as a result of the partition of subcontinent, Sind became part of Pakistan. Badin was announced as a district in 19755, by the then Prime Minister, Mr Zufiqar Ali Bhutto.
1.1.2 Geography Badin district is situated between latitude 24o 13’ to 25o 12’ North and longitude 68o 21’ to 69o 20’ East. The district is bounded in the north by Hyderabad, in the east by Mirpurkhas and Tharparker districts, in the south by the Arabian Sea and Rann6 of Kutch, which also forms the international boundary with India, and in the west it borders Thatta and Hyderabad districts. The total area of the district is 6,527 square kilometres and the district consists of five talukas, namely, Badin, Matli, Tando Bago, Golarchi and Talhar. With the
4http://www.badin.gov.pk/index.php?option=com_content&view=article&id=1:about-badin&catid=1:a-badin&Itemid=7 5 District Census Report of Badin: 1998 6 Rann is derived from Sanskrit means desert. Rann of Kutch is large barren area of salt marshes and mud flats, mostly in western India in the state of Gujarāt but also extending into Pakistan. The area is largely treeless and arid, although it can flood during the monsoon season. Very few tourists visit the area, and there are few settlements. - Encarta 2009
DISTRICT BADIN

introduction of the Devolution System7, the talukas have been sub-divided into 46 union councils, 109 tapas and 511 dehs8. Badin has a mild climate. Rainfall is highly erratic and unpredictable with an average rainfall of 258.8 mm9. “… The district is part of the Lower Indus Plain formed by the alluvial deposits of the Indus River. Thus, its land is very uniform in character and it is not diversified by hills or rivers; in fact, there are no rivers or streams in the district. The climate of Badin is relatively mild. The sea breezes keep the summers relatively cool. During the monsoon period the sky is cloudy, but there is very little precipitation. The climate in summer is generally moist and humid. The cold weather in Badin starts from the beginning of November, where there is a sudden change in temperature. There are very few plants other than trees and grasses in the region.” (Human Development Foundation).
1.1.3 Culture (Ethnicity, Religion, Languages and politics): The population of the district is mainly Muslim, constituting 79.43 per cent of the total population. Hindus form an important minority at 19.9 per cent in the district followed by Christians at 0.3 per cent. Important tribes include the Halaypotras and the Hingoras. However there are also Syed, Soomra, Talpur, Leghari, Bhurghri, Memon, Mandhra, Maheri, Ansari, Sama, Juneja, Sheedi and Mallah. New settlers come mainly from the Punjab and Baluchistan. Sindhi is the primary language in the district, spoken by 89.8 per cent of the total population. The language is spoken predominantly in the rural areas at 92.2 per cent as compared to 77.7 per cent in the urban areas. The next widely spoken languages are Urdu with 1.2 per cent, Seraiki with 0.6 per cent and Balochi with 0.21 per cent. Sind is the land of Shah Abdul Latif Bhithai and Sachal Sarmast, the two great Sufi poets. Sindis love music and dance and their music is deeply influenced by Sufism. In Badin district there are numerous shrines of the Sufis and saints, which are visited by hundreds of people daily, not only from parts of the district, but also from other parts of the country. The shrines include that of Saman Shah, one of the greatest saints of Sindh of the last century, as well as the shrines of 22 Pirs of Lowari Sharif, including famous poet of the Sindhi language, Khowaja Muhammad Zaman and others. Other famous saints who graced this part of Sindh and who have their last resting place in Badin are, Raj Shaheen, Ghulam Shah, 7 Decentralization of administrative powers to local bodies. 8 Deh/Mouza: is a territorial unit with a separate name area precisely measured into plots/khasras/survey numbers Tapa: is territorial boundry in Sindh equivilant to what is called Patwar Circle (a revenue area pertaining to the lowest land administrator called Patwari) in Punjab 9 http://www.badin.gov.pk
BACJKGROUND INFORMATION

DISTRICT BADIN
Ahmed Rajo, Sajan Sawai, MahWali, Shah Qadri, Miyoon Mooso, Shah Gariyo, Syed Tajuddin. Pakistan People’s Party (PPP) is the most potent political force in the district. Since 1970, candidates of PPP have been successful more or less in all the elections. In the 2008 elections, all the five provincial seats and the two national assembly seats were secured by the PPP candidates. In the last decade, the Mirza Family has demonstrated great influence and succeeded in the 2008 election with a large margin. Dr. Fehmida Mirza was elected as Speaker of the national assembly, whereas Dr. Zulfiqar Mirza became the Home Minister of Sindh Province. The total voters registered by Election Commission of Pakistan, in Badin, are 564,700.
1.1.4 Administrative Division: District Badin is divided into four talukas, namely: Badin, Tahlahr, Shaheed Fazal Rahu (Golarchi), Matli and tando Bago. There are 103 patwar circles and 497 Mouzas (Revenue Villages) in the district. Most of the mouzas are rural i.e. 466 while only 16 mouzas are declared urban. 14 mouzas are partly urban and only one mouza comprises of the forests. Table1.1.1: Administrative Division of District Badin BADIN KANUNGO
CIRCLES/ SUPERVISORY TAPAS
PATWAR CIRCLES/ TAPAS
NUMBER OF MOUZAS TOTAL RURAL URBAN PARTLY
URBAN FOREST UN-
POPULATED BADIN TALUKA 3 25 140 128 7 4 1 - TALHAR TALUKA 2 10 54 50 4 - - - SHAHEED FAZAL RAHU 3 22 95 87 3 5 - - MATLI TALUKA 3 27 98 95 2 4 - - TANDO BAGO TALUKA 3 29 110 106 - 1 - - TOTAL 14 103 497 466 16 14 1 - Source: Mouza Statistics of Sindh: 2008, ACO, Government of Pakistan
1.1.5 Road Network Infrastructure There are 7 main road networks which connect Badin District to the rest of the country. The below table describes the main routes and Entry-Exit points of these routes from Badin District. These routes can be taken in to account in case of Emergency or disaster Situations. According to National Highway Authority, a total of 105 road schemes are present in Badin district with the longest being Sajawal-Badin road with a length of 77 km. The main points of the road are Badin, Golarchi, Khorwah Chowk and Sajawal. According to the same source the shortest road scheme in Badin is Manak Laghari with a length of 0.50 km. (See annexure 3)

BACKGROUND INFORMATION4
Table1.1.2: Road Network Infrastructure of District Badin DISTRICT
ROUTE VIA TALUKA / TEHSIL
ENTRY POINT DISTANCE FROM BADIN
BADIN THATTA NATIONAL HIGHWAY VIA SAJAWAL
SAJAWAL BADIN ROAD TALUKA GOLARCHI
GOLARCHI 100KM
BADIN Thatta National Highway Via Sajawal
Mirpur Bathoro-KarioGanwar-Golarchi-Badin Road
Taluka Golarchi Khorwah (Settlements )
110km
BADIN Tando Muhammad Khan
Matli-Talhar-Badin Road Matli Matli 75km
BADIN From Digri-Murpukhas Dambalo-Tnado-Ghulam Ali-Matli-Talhar-Badin Road
Tando Bago Dambalo 110km
BADIN from Jhuddo Mirpurkahs
Nabisar Road-Malkani Sharif
Tando Bago Malikani Sharif 70km
BADIN From Tando Allahyar SheroShahani-TnadoGhulam Ali-Matli-Talhar-Badin Road
Matli Tando Ghulam Ali
130km
Source: PDMA Sindh
Table 1.1.3: Entry-Exit points for District Badin 1 Kadhan 5 Khoski 9 Sangi Pharho 13 Ahmed Rajo 2 Seerani 6 Nindo Shahar 10 Dei 14 Khorwah 3 Bhugra Memon 7 Pangrio 11 Dumbalo 15 Tarai 4 Shadi Large 8 Malkani Sharif 12 Tando Ghulam Ali 16 Golarchi Source: District Badin Contingency Plan 2012 for Cyclones, Rains and Flood
1.1.6 Irrigation The major sources of irrigation in district Badin are Akram Wah, Phuleli and Guni Canals of Kotri Barrage and Nasir Canal of Sukkur Barrage. The district is at the extreme tail end of the irrigation system. The Left Bank Outfall Drain (LBOD) is composed of KPOD (Kadhan Patheji Outfall Drain), Spinal Drain, Cholri weir, Tidal link and other doro’s dhands, canals. The drainage of effluent from Kotri command area is carried through 18 major drainage systems. These drainage systems are carrying drainage effluent into the sea, except for three drains which are discharging into the river Indus. One of these drainage systems, Kadhan Pateji Outfall Drain (KPOD), is connected to LBOD and Tidal Link for discharge into the sea. During the construction of the Tidal Link and the Cholri Weir, according to SIDA report10 the local communities of Badin district opposed the project, terming it as dangerous. They were opposing the project on the basis of its unnatural design; which would choke the natural flow of drainage in the area. However, the implementing agencies did not think it necessary to take the view of the local community into account and carried out the project. The communities in Badin district reported that since their natural resource base has degraded, support is needed to increase their farm productivity. It was suggested
10 Preparation Of Regional Plan For The Left Bank Indus, Delta And Coastal Zone, Final Report Phase Ii, March,2012

5DISTRICT BADIN
that if they are given access to the drainage water through public lift pumps, they would be able to grow salt tolerant crops. The coastal villages, other than those living in the creek area, depend on the irrigation channels and minor canals for drinking water, which is also stored in the ponds for use when the supplies are low. As the carrying capacity of the irrigation system has been reduced due to poor maintenance, the availability of drinking water is constrained in the tail reaches.
1.1.7 Solid Waste Management Six agro-based industries and 23 sugar mills are contributing pollutants to surface drains as well as nearby depressions. Besides, in urban areas of the district, the supply of contaminated water, unsafe disposal of municipal waste and solid waste, unsafe disposal of infectious medical wastes and congested housing create environmental degradation. There are no water treatment plants installed at sugar industries. Flying ash emitted from the chimneys contain particle size ranging from 38 um 10 1000 um24 flying. The wastewater of all the sugar mills is dumped into Left Bank Outfall Drain (LBDO) through small drains and small irrigation channels at some places. The wastewater of 09 other Sugar Mills belonging to districts Nawab Shah, Sanghar, Mirpur Khas and Hyderabad is released into LBOD through small drains. The sewerage water of Badin main city is contaminating irrigation channels which is also the source of water supply for the entire population of district Badin and reaches up to coastal stretches. Four union councils i.e. Tarai, Garho, Khorwah, Ahmed Rajo and Bhugra Memon are directly affected11.
11 DDRMP District Badin; UNDP, NDMA and PDMA, July 30, 2008
DEMOGRAPHY6
Source: Profile of District Badin, South Asia Partnership-Pakistan, December 2009
1.2 Demography
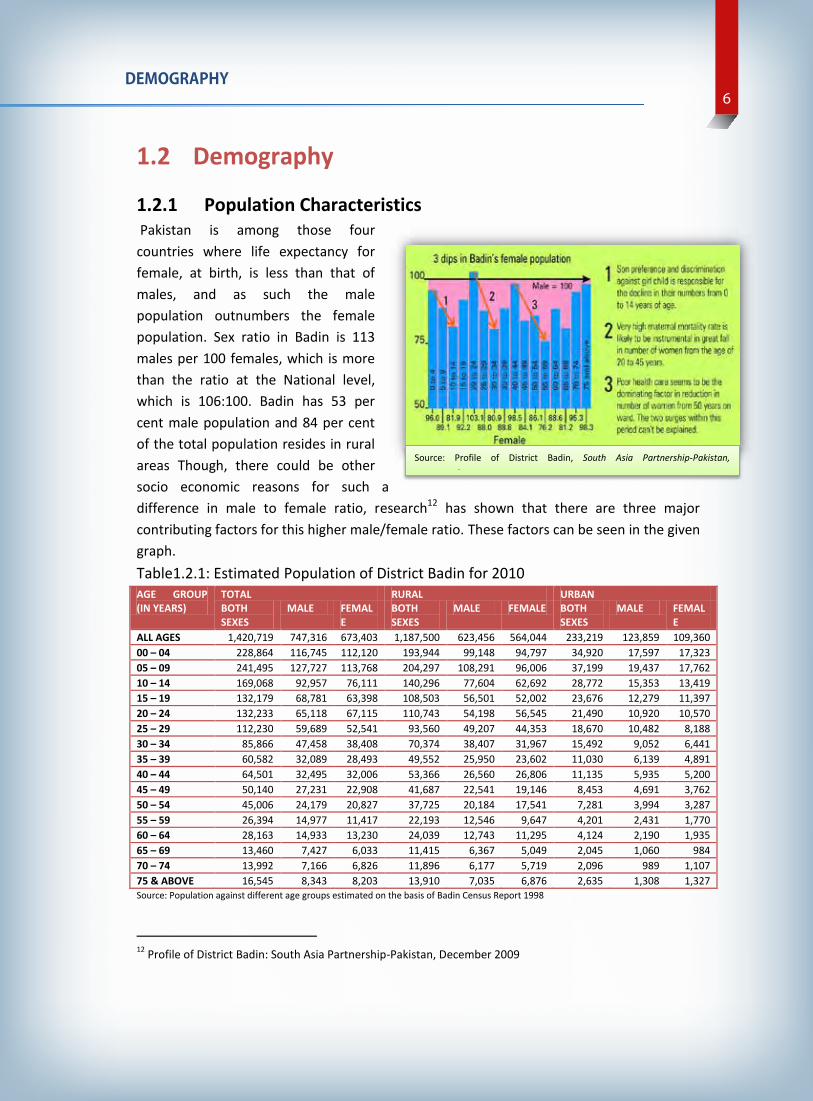
1.2.1 Population Characteristics Pakistan is among those four countries where life expectancy for female, at birth, is less than that of males, and as such the male population outnumbers the female population. Sex ratio in Badin is 113 males per 100 females, which is more than the ratio at the National level, which is 106:100. Badin has 53 per cent male population and 84 per cent of the total population resides in rural areas Though, there could be other socio economic reasons for such a difference in male to female ratio, research12 has shown that there are three major contributing factors for this higher male/female ratio. These factors can be seen in the given graph. Table1.2.1: Estimated Population of District Badin for 2010 AGE GROUP (IN YEARS)
TOTAL RURAL URBAN BOTH SEXES
MALE FEMALE
BOTH SEXES
MALE FEMALE BOTH SEXES
MALE FEMALE
ALL AGES 1,420,719 747,316 673,403 1,187,500 623,456 564,044 233,219 123,859 109,360 00 – 04 228,864 116,745 112,120 193,944 99,148 94,797 34,920 17,597 17,323 05 – 09 241,495 127,727 113,768 204,297 108,291 96,006 37,199 19,437 17,762 10 – 14 169,068 92,957 76,111 140,296 77,604 62,692 28,772 15,353 13,419 15 – 19 132,179 68,781 63,398 108,503 56,501 52,002 23,676 12,279 11,397 20 – 24 132,233 65,118 67,115 110,743 54,198 56,545 21,490 10,920 10,570 25 – 29 112,230 59,689 52,541 93,560 49,207 44,353 18,670 10,482 8,188 30 – 34 85,866 47,458 38,408 70,374 38,407 31,967 15,492 9,052 6,441 35 – 39 60,582 32,089 28,493 49,552 25,950 23,602 11,030 6,139 4,891 40 – 44 64,501 32,495 32,006 53,366 26,560 26,806 11,135 5,935 5,200 45 – 49 50,140 27,231 22,908 41,687 22,541 19,146 8,453 4,691 3,762 50 – 54 45,006 24,179 20,827 37,725 20,184 17,541 7,281 3,994 3,287 55 – 59 26,394 14,977 11,417 22,193 12,546 9,647 4,201 2,431 1,770 60 – 64 28,163 14,933 13,230 24,039 12,743 11,295 4,124 2,190 1,935 65 – 69 13,460 7,427 6,033 11,415 6,367 5,049 2,045 1,060 984 70 – 74 13,992 7,166 6,826 11,896 6,177 5,719 2,096 989 1,107 75 & ABOVE 16,545 8,343 8,203 13,910 7,035 6,876 2,635 1,308 1,327 Source: Population against different age groups estimated on the basis of Badin Census Report 1998
12 Profile of District Badin: South Asia Partnership-Pakistan, December 2009

7DISTRICT BADIN
8.8% 9.5%
7.3% 4.9%
3.9% 3.4%
2.9% 2.3% 1.9%
1.6% 1.5%
1.0% 1.0%
0.6% 0.6% 0.6%
7.9% 8.0%
5.4% 4.5%
4.7% 3.7%
2.7% 2.0% 2.3%
1.6% 1.5%
0.8% 0.9%
0.4% 0.5% 0.6%
1-45-9
10-1415-1920-2425-2930-3435-3940-4445-4950-5455-5960-6465-6970-74
75+
Population Pyramid FEMALE MALE
1,1
36,0
44
1,1
57,4
12
1,1
79,1
82
1,2
01,3
61
1,2
23,9
57
1,2
46,9
78
1,2
70,4
33
1,2
94,3
28
1,3
18,6
73
1,3
43,4
76
1,3
68,7
45
1,3
94,4
90
1,4
20,7
19
1,4
47,4
41
1,4
74,6
66
-
200,000
400,000
600,000
800,000
1,000,000
1,200,000
1,400,000
1,600,000
1998
1999
2000
2001
2002
2003
2004
2005
2006
2007
2008
2009
2010
2011
2012
Population Growth Pattern
1.2.2 Population Growth Pattern Population of District Badin is categorized by a high growth rate of 2.26% per annum, which simply means that the population will double itself in the next 31 years13. 45 % of the population is below 15 years and 3 percent is 65 years or above. The estimated population of 2010 is 1,420,719, which shows that population of the district increased by 29% in 12 years. (1998 to 2010)
1.2.3 Population Distribution by Age and Gender Out of the total population, 53 percent are males and 47 percent are females. 45.01% of the population is below 15 years of age; whereas 51.90% is of the working age group i.e. 15-64. 65 years and above population is 3.10% of the total population. The maximum population lies in the cohort of 5-9 which is 17% of the total population. Though, in all age groups male population out numbers female population, exception can be seen in the age group of 20-24
13 Rule of 70 http://controlgrowth.org/double.htm

DEMOGRAPHY8
<15 years 45.01%
15-64 years 51.90%
65 years> 3.10%
Dependent Population Percent
1.2.4 Dependent Population The economically dependent population comprises of the population that is less than 15 years and more than 65 years of age. In addition to these age groups, widowed, and/or divorced women are also considered part of the dependent population. Dependent population, in the case of Badin District, is 48.10 percent of the total population whereas the working population is 51.90 percent only. Which shows that dependency ratio14 in the district is 93 percent. Table 1.2.2: Population Details by Taluka for 2010
TEHSIL AREA POPULATION MALE FEMALE POP DENSITY
SEX RATIO
AVERAGE HH SIZE
ESTIMATED15 HOUSEHOLDS
BADIN 1812.8 353,734 186,068 167,666 195.13 111 5.2 68,026 MATLI 1073.1 351,496 184,891 166,605 327.55 111 5.6 62,767 SH. FAZAL RAHU 1771.3 264,642 139,205 125,437 149.41 111 5.5 48,117 TALHAR 402 136,456 71,778 64,678 339.44 111 5.3 25,746 TANDO BAGO 1467.9 314,391 165,374 149,017 214.18 111 5.2 60,460 Total 6,527.1 1,420,719 747,316 673,403 204 111 5.36 309,040 Source: Estimated on the basis of Table 1 District Census Report 1998 and data available in Updates of National Rural Support Programme’s (NRSP) Response to Floods as of 13 November, 2011
14 Dependency Ratio= (Population < 15 Years + Population > 65 Years)/ Population 15-65 Years 15 Population and Households are estimated for 2010
9DISTRICT BADIN
Lege
nd Dis
trict
bou
ndar
yA
ffec
ted
Pop
ulat
ion
Den
sity
No/
Sq.
Km
1 -
100
101
- 200
201
- 300
Bad
in
Hyd
erab
adJa
msh
oro
Mat
iari
Mir
purk
has
T. A
Yar
T. M
Kha
n
Thar
park
ar
That
ta
Um
erko
t
BA
DIN
MAT
LI
Gol
arch
i(S
FU)
TALH
AR
TAN
DO
BA
GO
Bad
in -
Aff
ecte
d P
opul
atio
n D
ensi
ty M
ap
May
201
2
Pun
jab
Bal
ochi
stan
Sin
dh
Dis
pute
d Te
rrito
ryFA
TA
Gilg
it B
altis
tan
Khy
ber P
akht
unkh
wa
Aza
d K
ashm
ir
Map
dat
a so
urce
(s):
Adm
in
boun
darie
s:
P
opul
atio
n C
ensu
s O
rgan
izat
ion
(PC
O)
Affe
cted
Pop
ulat
ion:
PD
MA
Sin
dh
Dis
clai
mer
s:Th
e de
sign
atio
ns
empl
oyed
an
d th
e pr
esen
tatio
n of
mat
eria
l on
thi
s m
ap d
o no
t im
ply
the
expr
essi
on o
f an
yop
inio
n w
hats
oeve
r on
the
par
t of
the
US
AID
and
iMM
AP
conc
erni
ng th
e le
gal s
tatu
s of
any
cou
ntry
, ter
ritor
y, c
ity o
rar
ea o
r of
its
auth
oriti
es,
or c
once
rnin
g th
e de
limita
tion
ofits
fron
tiers
or
boun
darie
s.
Map
Doc
Nam
e:
Cre
atio
n D
ate:
Proj
ectio
n/D
atum
:W
eb R
esou
rces
:
iM
MA
P_P
AK
_Bad
in H
ealth
Fac
ilitie
s_A
4L_v
1_05
2612
May
26,
201
2W
GS
84ht
tp://
ww
w.im
map
.org
010
205
Kilo
met
ers
Ara
bian
Sea
Indi
a
Afg
hani
stan
Chi
na
Iran
Pak
ista
n
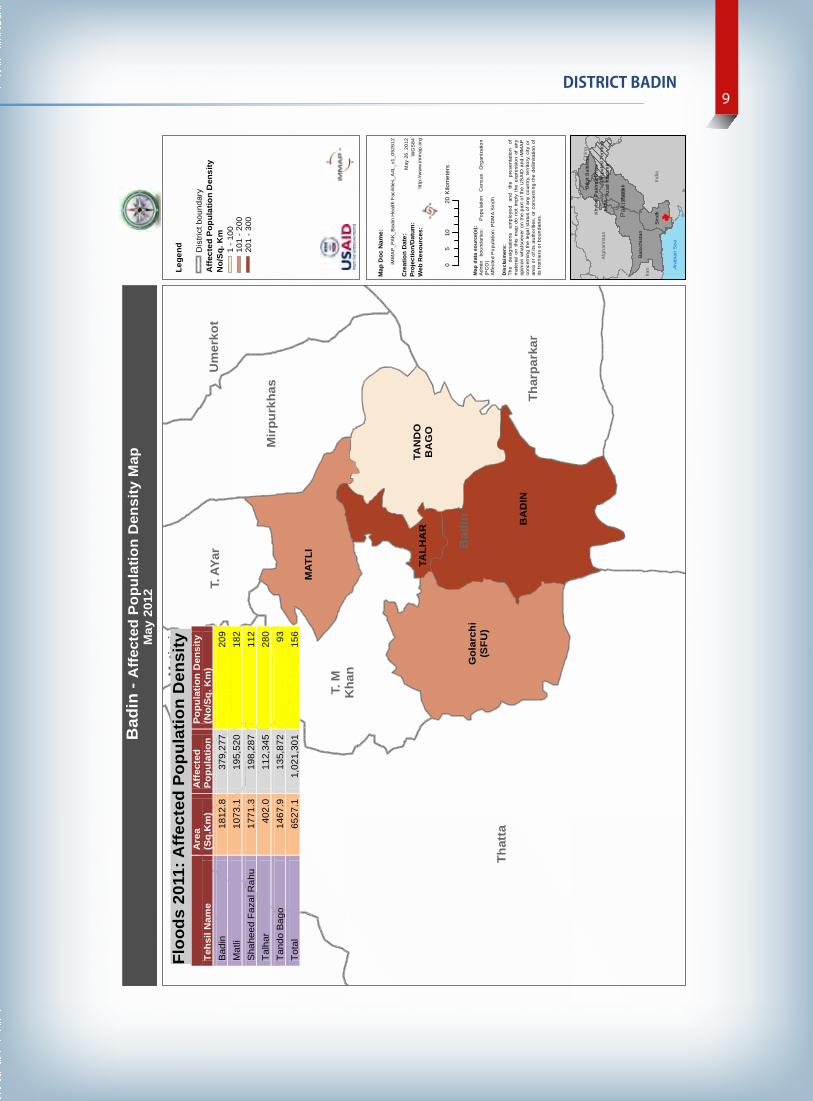
Tehs
il N
ame
Are
a (S
q.K
m)
Aff
ecte
d Po
pula
tion
Popu
latio
n D
ensi
ty
(No/
Sq. K
m)
Bad
in
1812
.8
379,
277
209
Mat
li 10
73.1
19
5,52
0 18
2 S
hahe
ed F
azal
Rah
u 17
71.3
19
8,28
7 11
2 Ta
lhar
40
2.0
112,
345
280
Tand
o B
ago
1467
.9
135,
872
93
Tota
l 65
27.1
1,
021,
301
156
Floo
ds 2
011:
Aff
ecte
d P
opul
atio
n D
ensi
ty

LIVELIHOOD10
1.4 Livelihood
1.4.1 Main Sources of Livelihood/Income Badin district can be broadly divided into two distinct economic zones. One zone supports purely agricultural income and the other one has a mixed economy, having fisheries along with agriculture as its main stay. The upper part of the district, comprising of Taluka Tando Bago, Matli and Talhar, falls in the first zone whereas, Taluka Golarchi (Shaheed Fazil Rahoo) and Badin up to Taluka Diplo of district Tharparker constitutes the mixed economic zone. At present, sugarcane is the major cash crop in the district. However, after 2003 floods, due to shortage of water, the cultivation pattern changed and people have started growing sunflower as an alternate crop. The entire land is irrigated by water coming from Sukkur and Kotri barrages. The irrigation network mainly comprises Gooni, Phulali, Akram Wah and Nasir canals16. Table 3.1 shows the number of Mouzas reporting different occupations. Table 1.3.1: Number of Mouzas Reporting Sources of Employment GENDER QUANTIFICATION SERVICE AGRICULTURE TRADE INDUSTRY PERSONAL
BUSINESS OVERSEAS EMPLOYEMENT
LABOUR
MALE MOSTLY 4 366 - - 5 _ 22 SOME 389 109 84 50 307 12 444 NONE 87 5 396 430 168 468 14
FEMALE MOSTLY 2 87 - - 11 1 90 SOME 140 242 28 31 183 11 336 NONE 338 151 452 449 286 468 54
Source: Mouza Statistics of Sindh 2008, Agriculture Census Organization Table 1.3.1 shows that 76 per cent of the Mouzas reported agriculture production as the main occupation for most of their male population. The next major source of livelihood is labour where 93 per cent of the Mouzas reported that around 50 percent of their male work force
16 DDRMP Revision July 30, 2008

11DISTRICT BADIN
0%10%20%30%40%50%60%70%80%90%
100%
MOSTLY SOME NONE MOSTLY SOME NONE
MALE FEMALE
Percent of Mouzas Reporting Certain Source of Livelihood
SERVICE AGRICULTURE TRADE INDUSTRY PERSONAL BUSSINESS OVERSEAS EMPLOYEMENT LABOUR
depends on labour for their livelihood. Only three percent of the Mouzas reported a small number of their male workforce working as oversees employees. Most of the female population is engaged in labour activity as reported by 19 percent of the Mouzas.
1.4.2 Agriculture Bulk of the population resides in rural areas of which 65 percent is engaged in farming and livestock rearing, and depends on these as their main sources of livelihood17. While the farming sector provides a major source of employment for the people in District Badin, land ownership is much skewed. There are either large cultivators/absentee landlords or very small cultivators (mainly small owners-cum tenants and sharecroppers) or labourers. For majority of the population most agriculturally related income comes from labour on other people's farms, which easily outweighs income from crop sales18. Main Crops are Sugar Cane, Rice, Wheat and sunflower. Crops cultivated in Badin can be divided into two main categories:
Food Crops Cash Crops
Area sown and production of food and cash crops in 2008-09 are reported in the table 1.3.2.
17 Badin; Hazard, Livelihood and Vulerability Baseline and Contingeny Plan, 2009: Food and Agriculture Organization 18 Socio-Economic Study and Proposal for Livelihood Improvements, 2005: Badin and Thatta Districts, Sindh, Pakistan: World Bank Pakistan

LIVELIHOOD12
Table 1.3.2: Food and Cash Crops Cultivated In District Badin Type Crop Area Sown in 2008-09
(000 Hectares) Production in 2009 (000 Tonnes)
Area Sown in 2011 (000 Hectares) FAO
Food
Wheat 33.30 93.00 N/A Rice 80.50 270.70 87.360 Maize 0.10 - N/A Jowar 1.20 0.60 N/A Bajra 0.80 0.60 N/A Barley 1.20 0.70 N/A
Cash
Sugarcane 53.60 2,730.50 61.710 Cotton 13.60 15.36 28.672 Guar seed 98.00 63.00 N/A
Source: Crop Area and Production by Districts for 28 Years; 2008-09 Pakistan Bureau of Statistics (PBS)
Over the last 28 years total area sown for food and cash crops has shown a drastic change. It is to be noted that the production of cotton is shown in tonnes instead of bales using a standard conversion factor19 and the numbers reported are rounded off to nearest decimal places.
19 5.879 Bales = 1 MT

13DISTRICT BADIN
-
20
40
60
80
100
1981
-82
1983
-84
1985
-86
1987
-88
1989
-90
1991
-92
1993
-94
1995
-96
1997
-98
1999
-00
2001
-02
2003
-04
2005
-06
2007
-08
Area (000 Hectares) and Production (000 Tonnes) for Wheat
Area (000 Hectares) Production (000 Tonnes)
- 50
100 150 200 250 300
1981
-82
1983
-84
1985
-86
1987
-88
1989
-90
1991
-92
1993
-94
1995
-96
1997
-98
1999
-00
2001
-02
2003
-04
2005
-06
2007
-08
Area (000 Hectares) and Production (000 Tonnes) for Rice
Area (000 Hectares) Production (000 Tonnes)
Wheat Area cultivated for wheat, in the last 28 years, in Badin fluctuates around 30,000 hectares. Maximum area cultivated in Badin was in the year 1993-94, which was 43,000 hectares and minimum was in 2002-03, which was only 18,000 hectares. Whereas production of wheat increased over the years, starting from 49,000 tonnes in 1982-83 the minimum production was recorded in the year 2002-03, which was 25,000 tonnes. The highest recorded production of wheat was in the year 2008-09, which was 93,000 tonnes. .
Rice The figure shows area cultivated and production of rice. Over the years, there are no drastic changes in the area cultivated for rice but it has decreased gradually. Maximum area cultivated for rice in Badin was 106,000 hectares in the years 1982-83 and 1984-85. Then it continued to decrease and the minimum area cultivated was 59,000 hectares in 2002-03 and 2007-08. Afterwards it started increasing again. On the other side, production of rice shows drastic changes and it fluctuated a lot. The minimum recorded production was in the year 1993, which is 50,000 tonnes and it reached to its maximum in 2008-09, which was 271,000 tonnes.

LIVELIHOOD14
-
5
10
15
20
25
1981
-82
1983
-84
1985
-86
1987
-88
1989
-90
1991
-92
1993
-94
1995
-96
1997
-98
1999
-00
2001
-02
2003
-04
2005
-06
2007
-08
Area (000 Hectares) and Production (000 Tonnes) for Cotton
Area (000 Hectares) Production (000 Tonnes)
- 50
100 150 200 250 300 350 400 450
1981
-82
1983
-84
1985
-86
1987
-88
1989
-90
1991
-92
1993
-94
1995
-96
1997
-98
1999
-00
2001
-02
2003
-04
2005
-06
2007
-08
Area (000 Hectares) and Production (000 Tonnes) for Sugarcane
Area (000 Hectares) Production (0000 Tonnes)
Cotton
In the initial years, both area and production for cotton decreased and in the year 1994-95, both area and production of cotton reached their lowest limits. Only 300 tonnes of cotton was produced in that year and area cultivated was 900 hectares. In the following years both, area cultivated and production of cotton increased. The highest production in all the reported 28 years was recorded in 2008-09, which was 15,300 tonnes. Highest area covered was recorded in 2007-08, which was 15,000 hectares.
Sugarcane For area, sugarcane also shows more or less constant trend and stays around 50,000 hectares. But production of sugarcane has drastic changes. Up to the year 1986 it continues to decrease then onwards up to 1998-99 it continues increasing with fluctuations. In the year 1998-99 it reached to its maximum of 4,091,000 tonnes but then in later years it started decreasing again.
15DISTRICT BADIN
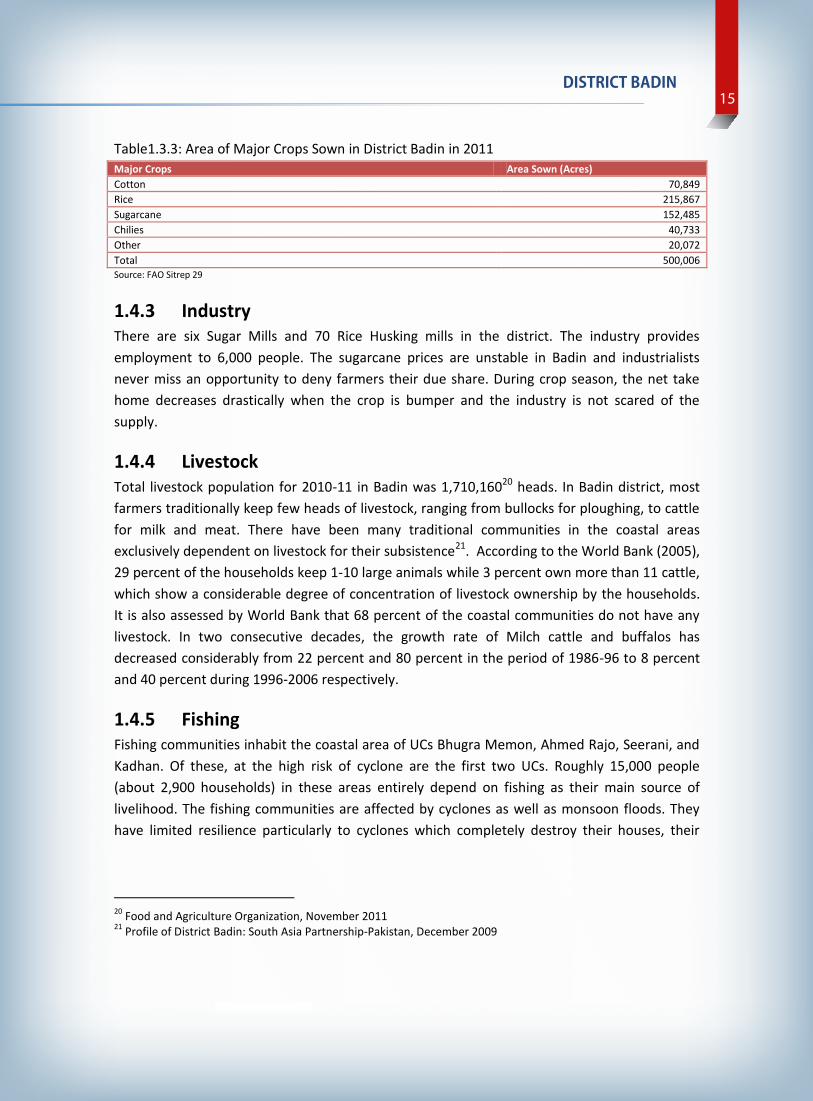
Table1.3.3: Area of Major Crops Sown in District Badin in 2011 Major Crops Area Sown (Acres) Cotton 70,849 Rice 215,867 Sugarcane 152,485 Chilies 40,733 Other 20,072 Total 500,006 Source: FAO Sitrep 29
1.4.3 Industry There are six Sugar Mills and 70 Rice Husking mills in the district. The industry provides employment to 6,000 people. The sugarcane prices are unstable in Badin and industrialists never miss an opportunity to deny farmers their due share. During crop season, the net take home decreases drastically when the crop is bumper and the industry is not scared of the supply.
1.4.4 Livestock Total livestock population for 2010-11 in Badin was 1,710,16020 heads. In Badin district, most farmers traditionally keep few heads of livestock, ranging from bullocks for ploughing, to cattle for milk and meat. There have been many traditional communities in the coastal areas exclusively dependent on livestock for their subsistence21. According to the World Bank (2005), 29 percent of the households keep 1-10 large animals while 3 percent own more than 11 cattle, which show a considerable degree of concentration of livestock ownership by the households. It is also assessed by World Bank that 68 percent of the coastal communities do not have any livestock. In two consecutive decades, the growth rate of Milch cattle and buffalos has decreased considerably from 22 percent and 80 percent in the period of 1986-96 to 8 percent and 40 percent during 1996-2006 respectively.
1.4.5 Fishing Fishing communities inhabit the coastal area of UCs Bhugra Memon, Ahmed Rajo, Seerani, and Kadhan. Of these, at the high risk of cyclone are the first two UCs. Roughly 15,000 people (about 2,900 households) in these areas entirely depend on fishing as their main source of livelihood. The fishing communities are affected by cyclones as well as monsoon floods. They have limited resilience particularly to cyclones which completely destroy their houses, their
20 Food and Agriculture Organization, November 2011 21 Profile of District Badin: South Asia Partnership-Pakistan, December 2009
LIVELIHOOD16
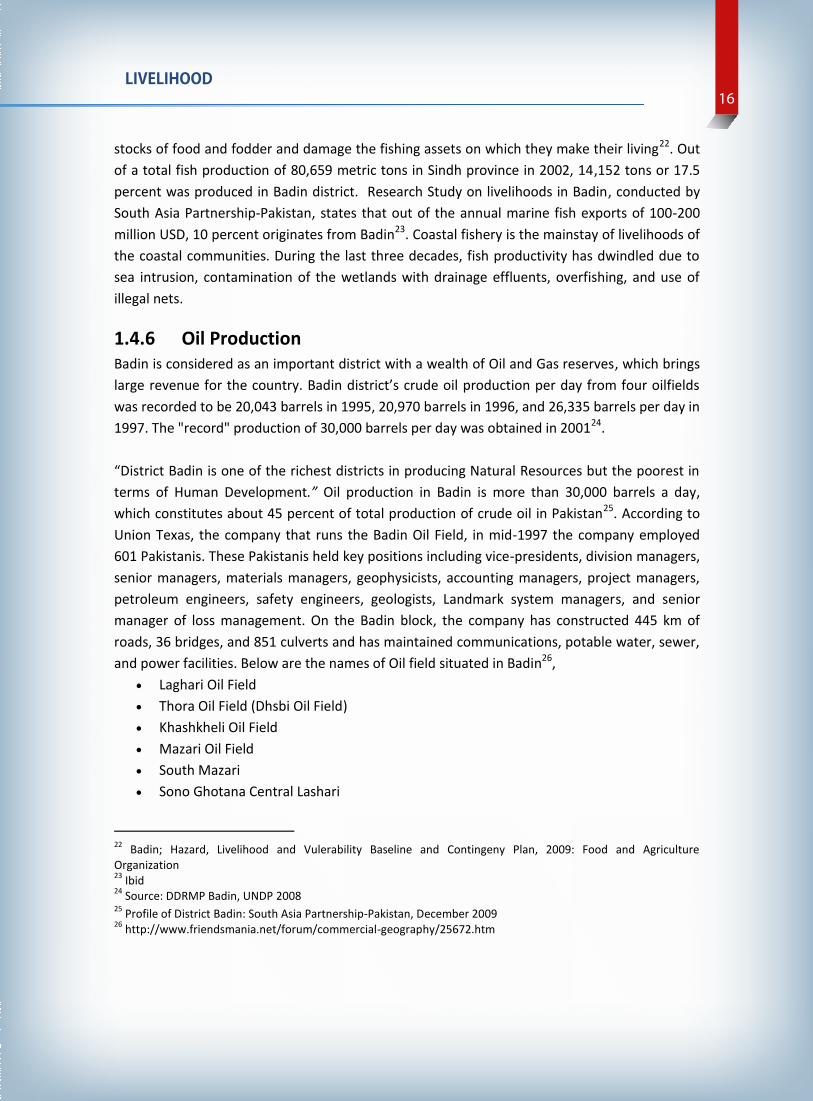
stocks of food and fodder and damage the fishing assets on which they make their living22. Out of a total fish production of 80,659 metric tons in Sindh province in 2002, 14,152 tons or 17.5 percent was produced in Badin district. Research Study on livelihoods in Badin, conducted by South Asia Partnership-Pakistan, states that out of the annual marine fish exports of 100-200 million USD, 10 percent originates from Badin23. Coastal fishery is the mainstay of livelihoods of the coastal communities. During the last three decades, fish productivity has dwindled due to sea intrusion, contamination of the wetlands with drainage effluents, overfishing, and use of illegal nets.
1.4.6 Oil Production Badin is considered as an important district with a wealth of Oil and Gas reserves, which brings large revenue for the country. Badin district’s crude oil production per day from four oilfields was recorded to be 20,043 barrels in 1995, 20,970 barrels in 1996, and 26,335 barrels per day in 1997. The "record" production of 30,000 barrels per day was obtained in 200124. “District Badin is one of the richest districts in producing Natural Resources but the poorest in terms of Human Development.” Oil production in Badin is more than 30,000 barrels a day, which constitutes about 45 percent of total production of crude oil in Pakistan25. According to Union Texas, the company that runs the Badin Oil Field, in mid-1997 the company employed 601 Pakistanis. These Pakistanis held key positions including vice-presidents, division managers, senior managers, materials managers, geophysicists, accounting managers, project managers, petroleum engineers, safety engineers, geologists, Landmark system managers, and senior manager of loss management. On the Badin block, the company has constructed 445 km of roads, 36 bridges, and 851 culverts and has maintained communications, potable water, sewer, and power facilities. Below are the names of Oil field situated in Badin26,
Laghari Oil Field Thora Oil Field (Dhsbi Oil Field) Khashkheli Oil Field Mazari Oil Field South Mazari Sono Ghotana Central Lashari
22 Badin; Hazard, Livelihood and Vulerability Baseline and Contingeny Plan, 2009: Food and Agriculture Organization 23 Ibid 24 Source: DDRMP Badin, UNDP 2008 25 Profile of District Badin: South Asia Partnership-Pakistan, December 2009 26 http://www.friendsmania.net/forum/commercial-geography/25672.htm

17DISTRICT BADIN
1.5 Food Security Food security can be broadly divided into four components:
Availability of food in terms of sufficient quantity available through domestic production or imports
Access to adequate resources given the socio-political and economic arrangements of the community
Utilization refers to the body’s ability to make use of the nutrients provided. This requires clean water, sanitation, and health care.
Stability includes an all-time access and utilization of food without any fear of losing it due to any shock (natural calamity, economic shock). This component points out to sustainability of food in an area.
1.5.1 Availability Agricultural yield/production has already been covered in the previous section, where structure of agriculture output in Badin and its vulnerability against different disasters have been discussed in detail. Before the floods of 2010-11, district Badin was self-sufficient as far as food availability is concerned. According to the reports, district Badin was self-sufficient in crops and animal based food production. The surplus production of sugarcane and rice along with livestock production ensured food availability in this district27. But this scenario changed after the floods of 2011 since 100% Cotton, 83% Rice and 43% Sugarcane were damaged. Also, 59% of the livestock was also lost or sold. This situation has made this district vulnerable to food insecurity because the availability of all food (cereals & meat) has been affected by the floods.
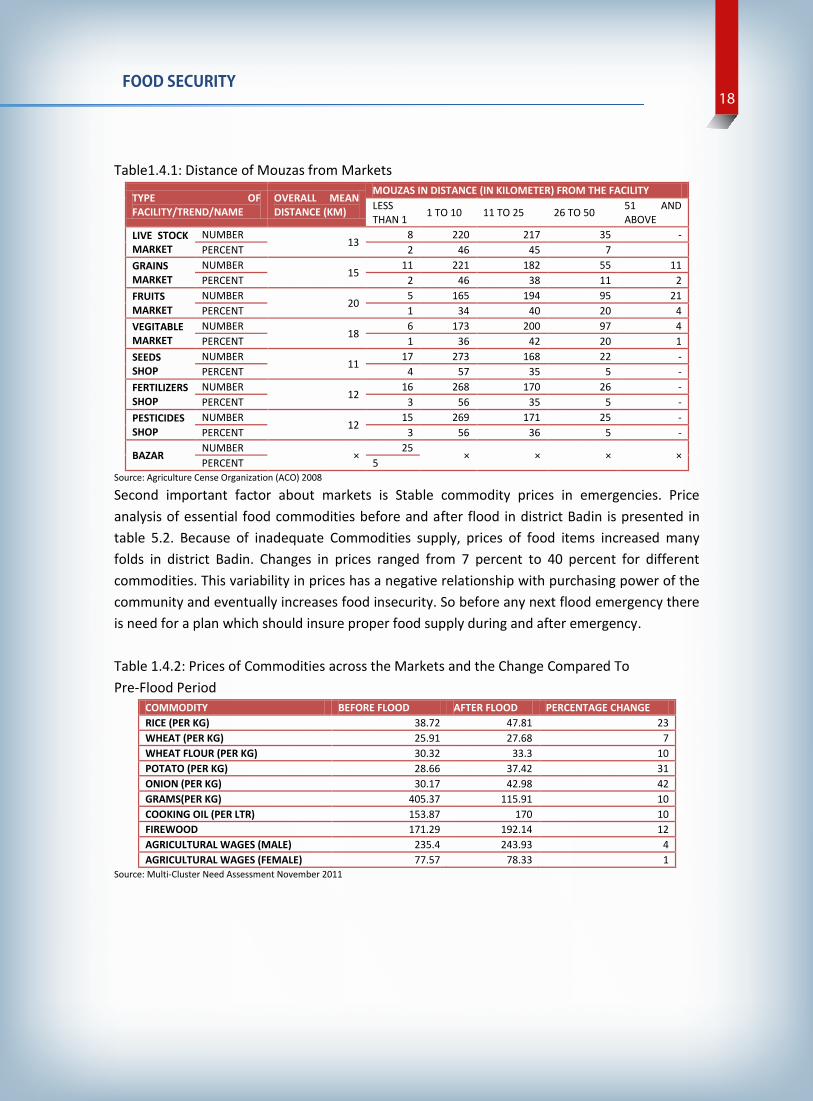
1.5.2 Access It is evident from table 1.4.2 that average distance (AD) of any market (listed in the table) from Mouzas is more than 10Km. Although AD of markets from Mouzas in Badin is less than the AD of entire Sindh, this measurement along with less developed means of transportation depicts vulnerability and constraint for physical access to food. In 2011 flood emergency, 4,143 Km of road network (inclusive of main highways, provincial & districts roads and kucha pukka roads (unpaved roads) and 13 Km of railway network have been affected. After the floods, the community took more than three months for the markets to be partially functional and accessible. Collectively all these factors affected availability of food in 2011 emergency and increased food insecurity level in district Badin.
27 Food Insecurity in Pakistan (2009), Sustainable Development Policy Institute, Islamabad
FOOD SECURITY18
Table1.4.1: Distance of Mouzas from Markets
TYPE OF FACILITY/TREND/NAME
OVERALL MEAN DISTANCE (KM)
MOUZAS IN DISTANCE (IN KILOMETER) FROM THE FACILITY LESS THAN 1 1 TO 10 11 TO 25 26 TO 50 51 AND
ABOVE LIVE STOCK MARKET
NUMBER 13
8 220 217 35 - PERCENT 2 46 45 7
GRAINS MARKET
NUMBER 15
11 221 182 55 11 PERCENT 2 46 38 11 2
FRUITS MARKET
NUMBER 20
5 165 194 95 21 PERCENT 1 34 40 20 4
VEGITABLE MARKET
NUMBER 18
6 173 200 97 4 PERCENT 1 36 42 20 1
SEEDS SHOP
NUMBER 11
17 273 168 22 - PERCENT 4 57 35 5 -
FERTILIZERS SHOP
NUMBER 12
16 268 170 26 - PERCENT 3 56 35 5 -
PESTICIDES SHOP
NUMBER 12
15 269 171 25 - PERCENT 3 56 36 5 -
BAZAR NUMBER
× 25
× × × × PERCENT 5
Source: Agriculture Cense Organization (ACO) 2008
Second important factor about markets is Stable commodity prices in emergencies. Price analysis of essential food commodities before and after flood in district Badin is presented in table 5.2. Because of inadequate Commodities supply, prices of food items increased many folds in district Badin. Changes in prices ranged from 7 percent to 40 percent for different commodities. This variability in prices has a negative relationship with purchasing power of the community and eventually increases food insecurity. So before any next flood emergency there is need for a plan which should insure proper food supply during and after emergency. Table 1.4.2: Prices of Commodities across the Markets and the Change Compared To Pre-Flood Period
COMMODITY BEFORE FLOOD AFTER FLOOD PERCENTAGE CHANGE RICE (PER KG) 38.72 47.81 23 WHEAT (PER KG) 25.91 27.68 7 WHEAT FLOUR (PER KG) 30.32 33.3 10 POTATO (PER KG) 28.66 37.42 31 ONION (PER KG) 30.17 42.98 42 GRAMS(PER KG) 405.37 115.91 10 COOKING OIL (PER LTR) 153.87 170 10 FIREWOOD 171.29 192.14 12 AGRICULTURAL WAGES (MALE) 235.4 243.93 4 AGRICULTURAL WAGES (FEMALE) 77.57 78.33 1
Source: Multi-Cluster Need Assessment November 2011

19DISTRICT BADIN
As mentioned earlier, the major source of income in Badin is agriculture, where more than 50 percent of households are associated with this sector, in 366 Mouzas of district Badin. So major portion of aggregate income in Badin comes from agriculture but this sector is exposed to many hazards like droughts, floods and cyclones. Other reporting sources have been discussed in section 4. It is reported in PSLM 2011 that economic situation of 26.04 percent of households in Badin has become poorer compared to the year 2010. Availability of credit facility is reported in 95 percent of Mouzas in Badin and specialized credit is the major share of this facility. See table 4.3 for details. Table1.4.3: Mouzas Reporting Credit Facility by Type of Institution And By Gender
Source: Agriculture Cense Organization 2008
1.5.3 Utilization Food availability and access to economic resources alone cannot ensure food security as proper food absorption or utilization is equally important. This food utilization process requires favourable milieu in terms of access to Proper health facilities, clean water and sanitation. Health facilities and residents of Badins’ acces to these will be discussed in section 2.1. Relative to other districts, access to drinking water in district Badin is not satisfactory. As given in the following table, only 18 percent of the households are using Tap water, 56 percent are using Hand pumps and 17 percent are using other sources. Table 1.4.4: Water Delivery system at Household level
Water Delivery system at Hh level (Percent ) Tap WATER HAND PUMP MOTOR PUMP DUG WELL OTHER YEAR SOURCE 18 56 7 1 17 2010-2011 PSLM
Sanitation facilities at household level are reported in table 1.4.5 Table 1.4.5: Sanitation Facilities at Household level TYPE FUNCTIONAL PARTIALLY DAMAGED NON-
FUNCTIONAL Unprotected Source (Canals / Ponds/Rivers) 35 40 25 Protected Sources (Springs, Wells, Hand Pumps) 50 41 9 Piped Water 26 49 25 Tanker Water Source 38 - 63 Source: PSLM 2010-11
GENDER
MOUZAS REPORTING CREDIT FACILITY ZTBL Co-op bank Commercia
l bank Micro finance bank
NGO RSPs Government
Arthi/commission agent
Others
MALE Number 450 9 352 3 59 3 60 261 126 Percent 94 2 68 1 12 1 13 54 26
FEMALE Number 407 3 293 2 39 3 62 92 153 Percent 85 1 61 8 1 13 19 32

FOOD SECURITY20
Sanitation facilities in urban areas of district Badin are far better than rural areas of the district, where 84 percent of urban households have reported Flush facility at their homes and only 9 percent of rural households have reported flush facility. 24 percent of rural households have no toilet facility of any kind. Situation gets worse when we see that more than 84 percent of population of Badin district is living in the rural areas.

21DISTRICT BADIN
Table 1.4.6: Percent Distributions of households with Sanitation Facility by type FLUSH NON FLUSH NO TOILET Urban Rural Total Urban Rural Total Urban Rural Total 84 9 21 16 67 59 0 24 20 Source: PSLM 2010-11
Sanitation facility was not satisfactory even prior to the floods but after floods the situation has become worse. Damages to this facility are reported in table 4.8
Table 1.4.7: Percent Distribution of households by Status of Sanitation Facility STATUS OF SANITATION FACILITY –PERCENT OF HOUSEHOLDS
Type FUNCTIONAL PARTIALLY DAMAGED NON-FUNCTIONAL Improved Dry Pit Latrine 38 38 25 Poor Flush/Soaked Pit/Latrine 62 15 23 Septic Tank/Sewer 8 46 46
Source: PSLM 2010-11

HEALTH22
1.6 Health
1.6.1 Details of Health Facilities A survey was conducted by Helping Hands and SPO (Strengthening Participatory Organization) in April 2010 in the district of Badin that mainly focused on the Health Facilities in Badin and resources available in them. According to the survey report, there were 11 RHCs, 37 BHUs, 17 Dispensaries and 1 District Headquarters Hospital in district Badin. The Survey showed that average distance of vicinity from a health facility is 3.74 KM, whereas the maximum distance is 15 km. The average number of rooms in a BHU is 6.68 and for females the average number is 2.16. The Health Management Information System is available in 28 Health Units. However 2 Health Units have no HMIS record available. Out of the 31 BHUs surveyed, the following facilities are available in a number of BHUs
Consultation rooms in 25 BHUs Consultation Room in Health Units for female Patients in 23 BHUs Check-up Rooms for Patients in 30 BHUs Screen Facility for Female Patients in 28 BHUs Waiting Room in 29 BHUs Latrines for Patients within BHU Compound in 27 BHUs Latrines for Male Patients in 26 BHUs Latrines for Female Patients in 27 BHUs Drinking Water in 22 BHUs Electricity Facility in Health Units in 26 BHUs
Immunization28 In district Badin around 47% pregnant women have received tetanus toxoid injections. In urban areas this percentage is 48% and in rural areas it is 47%29. Record based30 immunization data of district Badin shows that 37% (Male 40%: Female 34%) of the children aged 12-23 months have received full immunization. In urban areas this percentage is 38 percent (Male 45%: Female 33%) and in rural areas it is 37% (Male 40%: Female 35%).
28 Table 3.4 b and 3.11: Pakistan Social and Living Standards Measurement Survey (PSLM)2010-2011 29 Pakistan Social and Living Standards Measurement Survey (PSLM)2010-2011 30 Based on record: Children who reported having received full immunization who also have an immunization card, expressed as a percentage of all children aged 12-23 months. Also immunizations to be classed as fully immunized a child must have received: ‘BCG’, ‘DPT1’, ‘DPT2’, ‘DPT3’, ‘Polio1’, ‘Polio2’,

23DISTRICT BADIN
Lege
nd
Hea
lth F
acili
ties
CB
HU
CD
ispe
nsar
y
CH
ospi
tals
CM
ater
nal&
Chi
ld H
ealth
Cen
ter
CR
HC
Tehs
il bo
unda
ryD
istri
ct b
ound
ary
Bad
in
CC
CC
CC
CC
CC
CC
CC
CC
CC
CC
CC
CC
CC
CC
CC
CC
C
CC
C
CC
CC
C
CC
CC
CC
CC
CC
CC
CC
CCC
C
CCC
Ahm
adR
ajo
Mat
aro
Men
dhar
o
CIV
ILH
OS
PIT
AL,
BA
DIN
Beh
dmi
Pun
jab
Cha
k-2
BA
GH
LI
KA
DH
AN
*S
EE
RA
NI
Lal B
uxN
otka
ni
Ghu
lam
Hus
sain
Par
hyar
Arti
llary
Cha
k N
o. 1
Ali
M.
Boo
har
Cho
udar
yFa
teh
M. Ali
Mur
adC
hand
io
CH
AK
NO
. 5A
bdul
lah
Sha
h
Sye
d A
liB
ux S
hah
KH
OS
KI
SA
WA
ND
AS
TI
Sae
ed K
han
Bhu
rgar
iYo
usaf
Soo
mro
Mol
vi A
liM
. Mah
eri
KH
AN
AN
IJA
TTa
rai
Yous
afS
hah
Kha
lifo
Qas
im
Kho
rwah
PAN
GR
IO *
Rah
oki
Gha
ro
TALU
KA
HO
SP
ITA
L,TA
ND
O B
AG
OR
ip
ME
DIC
AL
CE
NT
RE
, KA
RIO
GA
NH
WE
R
Ghu
lam
Sha
h M
ori
Wal
i M.
Mal
kani
SU
LTA
NS
AH
AR
O
Sae
edP
urD
EI
MO
TAN
CH
AN
DIO
Dad
ah
Boh
roS
hahi
bK
han
SO
RA
DI
BE
ER
OLA
NJW
AN
IM
OH
D K
HA
NJA
NW
AR
IM
ATLI
*N
azar
pur
TALU
KA
HO
SP
ITA
L, M
ATLI
Thar
i
HA
JI J
AN
MO
HA
MM
AD
Nab
i Bux
Pun
jabi
Mir
M.
Niz
aman
iH
aji
Niz
amud
din
Alla
hdad
Kha
nB
hurg
ri
GH
AN
O K
HA
NLE
GH
AR
IB
UX
UC
HA
ND
IO
Tand
oG
hula
mH
yder
TAN
DO
GH
ULA
MA
LI *
Pha
lkar
a
Haj
i Dod
oK
han
Gis
hkor
i
Ghu
lab
Lagh
ari
Juna
Kap
riM
ori
Bad
in
Hyd
erab
ad
Jam
shor
o
Mirp
urkh
as
T. A
Yar
T. M
Kha
n
Thar
park
ar
That
ta
Um
erko
t
BA
DIN
MA
TLI
Gol
arch
i(S
FU)
TALH
AR
TAN
DO
BA
GO
Bad
in -
Hea
lth F
acili
ties
Map
Apr
il 20
12
Pun
jab
Bal
ochi
stan
Sin
dh
Dis
pute
d Te
rrito
ryFA
TA
Gilg
it B
altis
tan
Khy
ber P
akht
unkh
wa
Aza
d K
ashm
ir
Map
dat
a so
urce
(s):
PC
O, W
HO
, Hel
ping
Han
d an
d S
PO
Dis
clai
mer
s:Th
e de
sign
atio
ns
empl
oyed
an
d th
e pr
esen
tatio
n of
mat
eria
l on
thi
s m
ap d
o no
t im
ply
the
expr
essi
on o
f an
yop
inio
n w
hats
oeve
r on
the
par
t of
the
US
AID
and
iMM
AP
conc
erni
ng t
he le
gal s
tatu
s of
any
cou
ntry
, te
rrito
ry,
city
or
area
or
of it
s au
thor
ities
, or
con
cern
ing
the
delim
itatio
n of
its fr
ontie
rs o
r bo
unda
ries.
Map
Doc
Nam
e:
Cre
atio
n D
ate:
Proj
ectio
n/D
atum
:W
eb R
esou
rces
:
iM
MA
P_P
AK
_Bad
in H
ealth
Fac
ilitie
s_A
4L_v
1_03
3012
Apr
il 19
, 201
2W
GS
84ht
tp://
ww
w.im
map
.org
010
205
Kilo
met
ers
Ara
bian
Sea
Indi
a
Afg
hani
stan
Chi
na
Iran
Pak
ista
n
Div
isio
n In
divi
dual
s at
V. l
ow
Ris
k In
divi
dual
s
at lo
w R
isk
Indi
vidu
als
at M
ediu
m
Ris
k
Indi
vidu
als
at H
igh
Ris
k
Indi
vidu
als
at V
. Hig
h R
isk
Kal
at
- 10
6663
6 61
0980
38
6289
-
Mek
ran
- 33
0647
-
5740
26
1948
81
Nas
iraba
d 64
4038
46
0826
-
- 31
0228
Q
uetta
18
3264
0 41
0466
-
- -
Sib
i 44
2510
27
0096
-
2734
76
- Zh
ob
- 95
3650
47
0054
-
-
Map
Loc
ator
Pres
ent S
taff
in H
ealth
Uni
ts a
s of
Apr
il 20
10
M
ale
Fem
ale
Tota
l
Doc
tors
31
31
62
Para
med
ics
133
40
173
Oth
er
50
8 58

EDUCATION24
1.7 Education
1.7.1 Highlights
Literacy Rate (10 years and above) 39% Adult Literacy Rate (15 years and above) 36% GPI 0.65 GPI Primary 0.73 GPI Middle 0.68 GPI Matric/Secondary 0.48 GPI Higher Secondary 0.18 Population that has ever attended School 41% Male 56% Female 23% Population that has completed primary level or higher 32% Male 45% Female 18% Student Teacher Ratio 33 Primary 30 Middle 31 Matric 31 Higher Secondary 31
Source: Statistical Education Bulletin 2011, RSU, GoS
1.7.2 District School Enrolment Ratio The education status is quite poor in District Badin. The literacy rate (10 years and above) for the whole district is 39 percent; for male it is 54 and female it is 22 percent. For the urban rural comparison, urban literacy rate is higher, which is 56 percent (male 69% and female 42%); whereas the rural literacy rate is 35 percent (51% and female 18%). Adult literacy rate (> 15 years) is 36 percent. Gross Enrolment Rate (GER) at the primary level in all of BADIN is 65% (Male: 78%, Female: 51%). In the urban community it is 84% (Male: 97%, Female: 72%) and in the rural community it is 62% (Male: 75%, Female: 48%). Net Enrolment Rate (NER) at the primary level is 41 per cent (Male: 45%, Female: 37%), in the urban community it is 46 percent (Male: 44%, Female: 47%) and in the rural community it is 40 (Male: 45%, Female: 35%). Table 1.6.1 shows details of Gross and Net Enrolment Rates by Rural/ Urban and Gender at different levels:

25DISTRICT BADIN
Table 1.6.1: Gross and Net Enrolment Rates by Gender and Locality at Different levels
URBAN/ RURAL/ DISTRICT GENDER
GROSS ENROLMENT RATES NET ENROLMENT RATES Primary Group (5-9)
Middle Group (10-13)
Matric Group (13-14)
Primary Group (5-9)
Middle Group (10-12)
Matric Group (13-14)
URBAN Male 97% 66% 47% 44% 29% 16% Female 72% 41% 62% 47% 21% 8% Total 84% 55% 53% 46% 26% 13%
RURAL Male 75% 37% 41% 45% 13% 6% Female 48% 17% 11% 35% 10% 4% Total 62% 28% 25% 40% 12% 5%
TOTAL Male 78% 41% 42% 45% 16% 8% Female 51% 20% 19% 37% 12% 4% Total 65% 32% 30% 41% 14% 6%
1.7.3 Gender and Level Wise Details The total male enrolment of District BADIN is 185,282 wherein the total enrolment for males is 112,368 and the total female enrolment is 73,460. Out of a total of 6,105 teachers 5,067 are male and 1,038 are female teachers. This illustrates that, on average, one teacher is teaching 30 students. There are 472 boys’ schools, 449 schools for females in District Badin and the mixed gender schools are 2,238. Thus the total number of schools is 3,159. This means that on average every school has teaching staff of around two31.
1.7.3.1 Primary The total number of primary level schools in the district is 2,967. The total enrolment at the primary level is 145,568 of whom 84,347 are boys and 61,221 are girls. The total number of teachers at the primary level is 4,875 out of which 4,041 are male and 834 are female teachers. Thus on an average, each primary school has an enrolment of 49 students with teaching staff of 2. However the student to class ratio is 36 and each school has averagely around 1 class room.
1.7.3.2 Middle There are 133 middle schools reported. The total enrolment at the middle level is 9,927 of which 5,912 are boys and 4,015 are girls. The total number of teachers at the middle level is 331, out of which 283 are male teachers, while 48 are female teachers. Thus on an average each middle school has an enrolment of 75 students with a teaching staff of 2. However the student/class ratio is 26 and each school has averagely around 3 class rooms.
1.7.3.3 Matric There are a total of 50 secondary schools in the district. The total enrolment at the secondary level is 20,914 of which 14,104 are boys’ and 6,810 are girls’. The total
31 Statistical Education Bulletin, Reform Support Unit, Sindh Government.

EDUCATION26
number of teachers at the secondary level is 673, out of which male teachers are 537 and female teachers are 136. Thus on an average, each secondary school has an enrolment of 418 students with teaching staff of 13. However the student/class ratio is 26 and each school has averagely around 7 class rooms.
1.7.3.4 Higher Secondary There are a total of 9 higher secondary schools. The total enrolment at the higher secondary level is 9,419; out of which 8,005 are boys’ and 1,414 are girls. The total number of teachers at the higher secondary level is 241 out of which 206 are male teachers and 35 are female teachers. Thus on an average, each higher secondary school has an enrolment of 1,046 students with a teaching staff of 27. However the student/class ratio is 73 and each school has averagely around 14 class rooms. Table 1.6.2: Enrolment and Educational Facilities by level and Gender
Level Enrolment School Facilities Teachers Boys Girls Mixed Total Boys Girls Mixed Total Boys Girls Mixed Total
Elementary 371 1,818 2,189 3 9 12 8 55 63 Higher Secondary 6,584 1,098 1,737 9,419 5 2 2 9 158 36 47 241 Middle 1,024 1,535 5,179 7,738 19 37 65 121 53 40 174 267 Primary 21,372 33,095 91,101 145,568 438 396 2,133 2,967 843 890 3,128 4,861 Secondary 7,026 4,866 9,022 20,914 10 11 29 50 215 146 312 673 Grand Total 36,006 40,965 108,857 185,828 472 449 2,238 3,159 1,269 1,120 3,716 6,105
Source: Educational MIS 2011, RSU, GoS

27DISTRICT BADIN
2 Disaster History and Its Impact 2.1 Disasters in Badin
2.1.1 Disaster History Badin is a highly disaster prone area and disasters of different types have occurred in the history of Badin. The most frequent and damaging disasters are the floods. Table 7.1 chronologically shows a brief history of the disasters that have affected Badin and the effects of these on humans, livelihood and infrastructure. Table 2.1.1: Disaster History and Losses in Badin
Disaster Year Impact/Losses Deaths Houses
Destroyed Land Degraded in Acres
Livestock People Affected
Cyclone 1964-65 90 1,650 20,000 80,000 170,000 Heavy Rainfall 1973 20 1,400 30,000 40,000 250,000 Flood 1976 40 2,000 3,000 98,000 210,000 Flood 1988 15 1,000 10,000 20,000 160,000 Heavy Rainfall 1994 20 1,200 15,000 60,000 225,000 Cyclone 1999 176 56,678 263,055 17,289 452,000 Earthquake 2001 5 800 28,000 5,000 171,000 Flood 2003 115 22,567 80,937 85,000 560,000 Flood 2006 2 500 5,000 3,599 45,000 Cyclone 2007 - 1,500 - - 25,000 Flood 2011 73 382,562 375,718 1,060 1,021,301 Source: DDRMP, UNDP 2008, PDMA Sindh 2011
Disaster Comparison and Vulnerability Profile from 1964 to 2011 A comparison has been made to see what the aggregate extent of these disasters is from 1964 to 2011. It can be clearly seen that in all instances, except deaths where cyclones were most lethal, floods proved to be the most damaging disaster for the population of Badin. The following graphs show the casualties and damages against different types of disasters.

DISASTER HISTORY AND ITS IMPACT28
Badin Floods’ Historical Perspective32 Badin Floods Historical Perspective Southern Sindh area is usually affected by floods due to precipitation and poor drainage. Badin’s July 2003 precipitation was 303.9 mm, which caused major flooding and destruction, and was estimated to have a 66 years return period. In 2011, on the 11th and 12th of August, the precipitation recorded in Badin, added together, was 297 mm which when looked as one 48-hour event the corresponding return period is near 100 years. Also, the highest ever monthly precipitation record in Badin was surpassed in August 2011 with 331 mm corresponding to more than 80 years return period. Moreover, if a 30-day period is observed from 10 August to 9 September 2011, Badin experienced 512 mm of rainfall in one month. Badin is in the coastal region of Pakistan, with maximum elevation about of 16.7 meters on the North West side near the Indus River, while minimum elevation is in the south approaching zero metres. Badin is exposed to riverine floods from the North West.
32 Preparation of Regional Plan for the Left Bank Indus Delta and Coastal Zone: Sindh Irrigation and Drainage Authority, 2012
-
1
2
3
4
5
Earthquake Heavy Rainfall Flood Cyclone
Frequency of Disasters
- 50
100 150 200 250 300
Earthquake Heavy Rainfall Flood Cyclone
Number of Deaths
-
100,000
200,000
300,000
400,000
500,000
Earthquake Heavy Rainfall Flood Cyclone
Number of Affected Houses
-
100,000
200,000
300,000
400,000
500,000
Earthquake Heavy Rainfall Flood Cyclone
Area Affected (hectares)
-
50,000
100,000
150,000
200,000
250,000
Earthquake Heavy Rainfall Flood Cyclone
Number of Affected Livestock
-
500,000
1,000,000
1,500,000
2,000,000
2,500,000
Earthquake HeavyRainfall
Flood Cyclone
Population Affected)
Disaster history and losses in Badin during a period of 47 years (1964 – 2011)

29DISTRICT BADIN
Map
dat
a so
urce
(s):
PC
O, L
BG
, AS
TER
Dis
clai
mer
s:Th
e de
sign
atio
ns
empl
oyed
an
d th
e pr
esen
tatio
n of
mat
eria
l on
thi
s m
ap d
o no
t im
ply
the
expr
essi
on o
f an
yop
inio
n w
hats
oeve
r on
the
part
of
iMM
AP
con
cern
ing
the
lega
l sta
tus
of a
ny c
ount
ry,
terr
itory
, ci
ty o
r ar
ea o
r of
its
auth
oriti
es, o
r co
ncer
ning
the
delim
itatio
n of
its
front
iers
or
boun
darie
s.
Map
Doc
Nam
e:
Cre
atio
n D
ate:
Proj
ectio
n/D
atum
:W
eb R
esou
rces
:N
omin
al S
cale
at A
3:1:
30,0
00,0
00
iM
MA
P_B
adin
_Ris
k_A
naly
sis_
Map
A3L
_v1_
01
May
31,
201
2W
GS
84ht
tp://
ww
w.im
map
.org
!
!
!
!
!!
!!!
!!
!!
!
!!
!!
!!
!!
!!
!!
!!
!!
!!
!!
!!
!!
!!
!
!!
!!
!!
!!
!!
!!
!!
!!
!!
!!
!!
!!
!!
!!
!!
!!
!!
!!
!!
!!!
!!
!!
!!!!
!!
!!
!!
!!
!!
!!
!!
!!
!!
!!
!!
!!
!!
!!
!!
!!
!!
!!
!!
!!
!!
!!
!!
!!
!!
!!
!!
!!
!!
!!
!!
!!
!!
!!
!!
!!
!!
!!
!!
!!
!!
!!
!!
!!
!!
!!
!!
!!
!!
!!
!!
!!
!!
!!
!!!
!!
!!
!!
!!
!!
!!
!!
!!
!!
!!
!!
!!
!!
!!
!!
!!
!!
!!
!!
!!
!!
!!!
!!
!!
!!
!!
!!
!!
!!
!!
!!
!!
!!
!!
!!
!!
!!
!!
!!
!!
!!
!!
!!
!!
!!
!!
!!
!!
!!
!!
!!
!!
!!
!!
!!
!!
!!
!!
!!
!!
!!
!!
!!
!!
!!
!!
!!
!!
!!
!!
!!!
!!
!!
!!
!!
!!
!!
!!
!!
!!
!!
!!
!!!
!!
!!
!!
!!
!!
!!
!!!
!!
!!!
!!
!!
!!
!!
!!
!!
!!
!!
!!
!!
!!
!!!
!!
!!!
!!
!!
!!
!!
!!
!!
!!
!!
!!
!!
!!
!!
!!
!!
!!
!!
!!
!!
!!
!!
!!
!!
!!
!!
!!!
!!
!!
!!
!!
!!
!!
!!
!!
!!
!!
!!
!!
!!
!!!
!!
!!
!!
!!
!!
!!
!!
!!
!!
!!
!!
!!
!!
!!
!!
!!!
!!
!!
!!
!!
!!
!!
!!
!!
!!
!!
!!
!!
!!
!!
!!
!!
!!
!!
!!
!!
!!
!!
!!
!!
!!
!!!
!!
!!
!!
!!!
!!
!!
!!
!!
!!
!!
!!
!!
!!
!!
!!
!!
!!
!!
!!
!!
!!
!!
!!
!!
!!
!!
!!
!!
!!
!!
!!
!!
!!
!!
!!
!!
!!
!!
!!!
!!
!!
!!
!!
!!
!!
!!
!!
!!
!!
!!
!!!
!!
!!
!!
!!
!!
!!
!!
!!
!!
!!
!!
!!
!!
!!
!!
!!
!!
!!
!!
!!
!!
!!
!!
!!
!!
!!
!!!
!!
!!
!!
!!
!!
!!
!!
!!
!!
!!
!!
!!
!!
!!
!!
!!
!!
!!
!!
!!
!!
!!
!!
!!
!!
!!
!!
!!!
!!
!!
!!
!!
!!
!!
!!
!!
!!
!!
!!
!!
!!
!!!
!!
!!
!!
!!
!!
!!
!!
!!
!!!
!!
!!
!!
!!
!!
!!
!!
!!
!!
!!
!!
!!
!!
!!
!!
!!
!!
!!
!!
!!
!!
!!
!!
!!
!!
!!
!!
!!
!!
!!
!!
!!
!!
!!
!!
!!
!!
!!
!!
!!
!!
!!
!!
!!
!!
!!
!!
!!
!!
!!
!!
!!
!!
!!
!!
!!
!!
!!
!!
!!
!!
!!
!!
!!
!!!
!!
!!
!!
!!
!!
!!
!!
!!
!!
!!
!!
!!
!!
!!
!!!!
!!
!!
!!
!!
!!
!!
!!
!!!
!!
!!
!!
!!
!!
!!
!!
!!
!!
!!
!!
!!
!!
!!
!!
!!!
!!
!!
!!
!!
!!
!!
!!
!!
!!
!!
!!
!!
!!
!!
!!
!!
!!
!!
!!!
!!
!!
!!
!!
!!
!!
!!
!!
!!
!!
!!
!!
!!
!!
!!!
!!
!!
!!
!!
!!
!!
!!
!!
!!
!!
!!
!!
!!
!!
!!
!!
!!
!!
!!
!!
!!
!!
!!
!!
!!
!!
!!
!!
!!
!!
!!
!!
!!
!!
!!
!!
!!
!!
!!
!!
!!
!!!
!!
!!
!!
!!
!!
!!!
!!
!!
!!
!!
!!
!!
!!
!!
!!!!!
! !
!
!
!
!
!
!!
!
!
!
!
!
!
!
!
!
! !
!
!
!
!!
!
!
! !
!
!
!! !!
!
!
!
! !
!
!
!!!
!
! !
! !!
!
! !
!
!
!
!
!
!
!
!
! ! !!
!
!
!!
Bad
in
Sha
heed
Faza
lR
ahu
Mat
li
Tand
oB
ago
Talh
arIn
form
ati
on
Ma
na
ge
me
nt
Un
itIn
form
ati
on
Ma
na
ge
me
nt
Un
it
iMM
AP
Pa
kis
tan
iMM
AP
Pa
kis
tan Indi
a
Pak
ista
n
Iran
Afg
hani
stan
Uzb
ekis
tan
Turk
men
ista
n
Ara
bian
Sea
Tajik
ista
n
Dis
pute
d Te
rrito
ry
Pun
jab
Bal
ochi
stan
Sin
dh
Fata
Chi
na
Gilg
it B
altis
tan
KP
K Aza
d K
ashm
ir
Map
Loc
ator
Ris
k A
naly
sis
Bad
in D
istri
ctJu
ne, 2
012
Lege
nd
Hea
lth F
acili
ties
Den
sity
Dis
tanc
e fro
m L
BO
D C
anal
s (k
m)
Dis
tanc
e fro
m In
dus
Riv
er in
(km
)10 20 30 5040B
adin
Teh
sil B
ound
ary
LBO
D D
rain
age
Sys
ytem
Can
als
1 2 3 Riv
er In
dus
Bun
dIn
dus
Riv
erTh
ar D
eser
t
Bad
in is
on
the
coas
tal r
egio
n of
Pak
ista
nM
axim
um e
leva
tion
abou
t 17.
6 m
eter
son
NW
sid
e ne
ar In
dus
river
Min
imum
ele
vatio
n is
on
sout
hap
proa
chin
g ze
ro.
Bad
in is
exp
osed
to ri
verin
e flo
odfro
m n
orth
wes
t by
Indu
s riv
eran
d ea
ster
n si
de m
ay fl
oode
d du
e to
Left
Ban
k O
utfa
ll D
rain
age
Sys
tem
Cyc
lone
, sea
intru
sion
from
sou
th a
ndP
ossi
ble
drou
ght f
rom
sou
th e
ast.
Set
tlem
ents
LBO
D: L
eft B
ank
Out
fall
Dra
inag
eP
CO
: Pak
ista
n C
ensu
s O
rgan
izat
ion
LBG
: Lui
se B
urge
r G
roup
Low
Hig
h

DISASTER HISTORY AND ITS IMPACT30
Causes of 2011’s flood 1. Unprecedented heavy rains. 2. Breaches in LBOD. 3. Breaches in Irrigation Canals. 4. High tide in Sea. 5. LBOD drain
Most Disaster Prone UCs FAO has reported that out of a total of 45 UCs of Badin, 11 UCs are most disaster prone. Two of these UCs are both cyclones and flood vulnerable and 9 are flooding prone UCs. Details of these US are given in table 7.2. Table 2.1.2: Details of Disaster Prone UCs
UCs At Risk Total Male Female High Risk Of Cyclone And Flooding
Bhugra Memon (Badin) 34,521 18,241 16,280 Ahmad Rajo (Golarchi) 31,778 17,024 14,754 Sub Total 66,299 35,265 31,034
High Risk Of Flooding Mithi Ill (Badin) 32,927 17,450 15,477 Kadhan (Badin) 29,415 15,703 13,712 Seerani (Badin) 33,491 17,543 15,948 Lowari Sharif (Badin) 27,206 14,198 13,008 Abdullah Shah (Badin) 28,085 14,934 13,151 Nindo Shaher (Badin) 31,318 16,421 14,897 Khoski (Tando Bago) 35,422 19,125 16,297 Dai Jarkas (Tando Bago) 33,210 17,693 15,517 Khalifo Kasim (Tando Bago) 31,779 16,978 14,801 Sub Total 282,853 150,045 132,808 Grand Total 349,152 185,310 163,842
Source: Badin; Hazard, Livelihood and Vulnerability Baseline and Contingency Plan, 2009: Food and Agriculture Organization
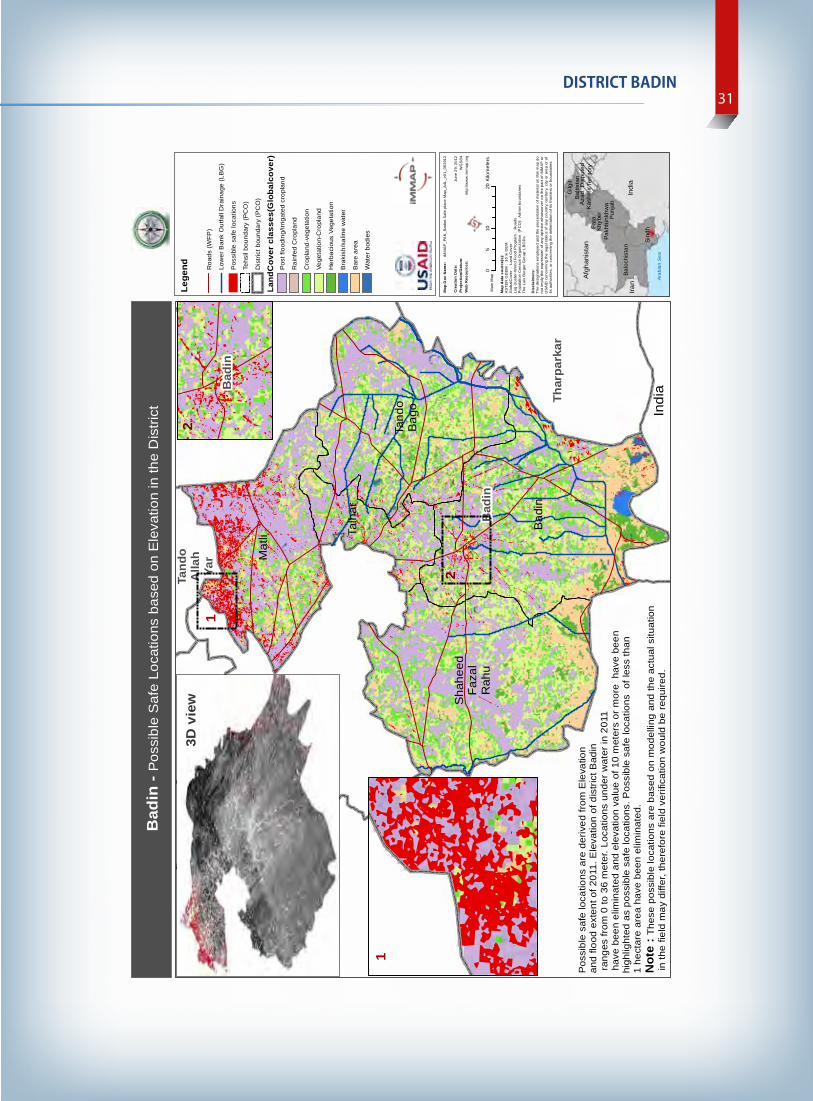
31DISTRICT BADIN
Aza
dK
ashm
ir
Bal
ochi
stan
Dis
pute
dTe
rrito
ryFa
ta
Gilg
itB
altis
tan
Khy
ber
Pak
htun
khw
aP
unja
b
Sin
dh
Ara
bian
Sea
Bad
in
Hyd
erab
ad
Jam
shor
o
Mir
purk
has
Tand
oA
llah
Yar
Tand
oM
uham
mad
Kha
n
Thar
park
ar
That
ta
Um
erko
t
Bad
in
Mat
li
Sha
heed
Faza
lR
ahu
Talh
ar
Tand
oB
ago
Map
dat
a so
urce
(s):
AS
TER
GD
EM
: 3
0 m
DE
MG
loba
lCov
er :
Lan
d C
over
Log
clus
ter-
Wor
ld F
ood
Pro
gram
: R
oads
Pop
ulat
ion
Cen
sus
Org
aniz
atio
n (P
CO
): A
dmin
bou
ndar
ies
The
Luis
Bur
ger G
roup
: LB
OD
s
Dis
clai
mer
s:Th
e de
sign
atio
ns e
mpl
oyed
and
the
pres
enta
tion
of m
ater
ial o
n th
is m
ap d
ono
t im
ply
the
expr
essi
on o
f any
opi
nion
wha
tsoe
ver o
n th
e pa
rt of
iMM
AP
or
US
AID
con
cern
ing
the
lega
l sta
tus
of a
ny c
ount
ry, t
errit
ory,
city
or
area
or o
fits
aut
horit
ies,
or c
once
rnin
g th
e de
limita
tion
of it
s fr
ontie
rs o
r bo
unda
ries.
Map
Doc
Nam
e:
Cre
atio
n D
ate:
Pro
ject
ion/
Dat
um:
Web
Res
ourc
es:
iM
MA
P_P
AK
_Bad
int S
afe
plac
e M
ap_A
4L_v
01_0
6291
2
June
29,
201
2W
GS
84ht
tp://
ww
w.im
map
.org
Mai
n M
ap
Bad
in -
Pos
sibl
e S
afe
Loca
tions
bas
ed o
n E
leva
tion
in th
e D
istri
ct
010
205
Kilo
met
ers
Afg
hani
stan
Indi
aIra
n
Indi
a
Pos
sibl
e sa
fe lo
catio
ns a
re d
eriv
ed fr
om E
leva
tion
and
flood
ext
ent o
f 201
1. E
leva
tion
of d
istri
ct B
adin
rang
es fr
om 0
to 3
6 m
eter
. Loc
atio
ns u
nder
wat
er in
201
1 h
ave
been
elim
inat
ed a
nd e
leva
tion
valu
e of
10
met
ers
or m
ore
hav
e be
en
high
light
ed a
s po
ssib
le s
afe
loca
tions
. Pos
sibl
e sa
fe lo
catio
ns o
f les
s th
an
1 he
ctar
e ar
ea h
ave
been
elim
inat
ed.
Not
e : T
hese
pos
sibl
e lo
catio
ns a
re b
ased
on
mod
ellin
g an
d th
e ac
tual
situ
atio
n in
the
field
may
diff
er, t
here
fore
fiel
d ve
rific
atio
n w
ould
be
requ
ired.
1
1
3D v
iew
Bad
in
2
2Le
gend R
oads
(W
FP
)
Low
er B
ank
Out
fall
Dra
inag
e (L
BG
)
Pos
sibl
e sa
fe lo
catio
ns
Tehs
il bo
unda
ry (
PC
O)
Dis
tric
t bou
ndar
y (P
CO
)
Land
Cov
er c
lass
es(G
loba
lcov
er)
Pos
t flo
odin
g/irr
igat
ed c
ropl
and
Rai
nfed
Cro
plan
d
Cro
plan
d-ve
geta
tion
Vege
tatio
n-C
ropl
and
Her
baci
ous
Veg
etat
ion
Bra
kish
/sal
ine
wat
er
Bar
e ar
ea
Wat
er b
odie
s

DISASTER HISTORY AND ITS IMPACT32
43%
31%
57%
41%
Percent of Affected
Percent of Total
Population Affected
Male Female
2.2 2011 Flood’s Impact
2.2.1 Demography Badin has a long history of disasters as has been discussed in the previous section. The Monsoon floods of 2011 in Badin are marked as the most disastrous floods in the history of Badin. These floods affected all the 46 UCs and 72 percent of the total Population i.e. 1,021,301 persons in district Badin. A total of 382,562 Houses were damaged out of which 172,155 houses were partially damaged and 210,407 houses were completely destroyed33. Out of the destroyed houses, 54 percent of the total mud houses, 53 percent of the total bamboo-straw houses and 9 percent of the total concrete houses were destroyed34. Table 8.1 shows the losses and damages summary
Table 2.2.1: Demographic Losses and Damages Attribute Figure Percent Of Total
Affected Reporting Source
Estimated Total Households 2010 265116 Estimated Vulnerable Households 116,271 44% MCNANovember 2011 Total Houses Affected 382,562 Partially Damaged 172,155 45% NDMA Losses And Damages
30th November, 2011 Destroyed 210,407 55% Affected Population 1,021,301 72% Male 438,099 43% Female 583,202 57% Deaths 73 Male 36 Female 17 Children 20 Injuries 10 Male 4 Female 6 Children -
According to the Multi-Cluster Needs Assessment (November 2011), more than 36 percent of the households reported that their houses were fully destroyed and cannot be used for living purpose. Displaced households were more than 32 percent and economic activities of 62.8 percent of the households were totally disrupted.
33 NDMA Losses and Damages: 30th November 2011 34 Multi-Cluster Need Assessment Novmebr: 2011

33DISTRICT BADIN
Population affected, broken down by Taluka is shown in table 2.2.2. Table 2.2.2: Taluka wise affected population35 TALUKA TOTAL
POPULATION36 AFFECTED POPULATION37
TOTAL POPULATION38
AFFECTED POPULATION39
NRSP PERCENT
PDMA PERCENT
Badin 353,734 281,970 378,893 379,277 80% 100% Matli 351,496 199,008 372,464 195,520 57% 52% Sh. Fazal Rahu 264,642 227,220 239,426 198,287 86% 83% Talhar 136,456 77,108 139,518 112,345 57% 81% Tando Bago 314,391 269,267 318,569 135,872 86% 43% Total 1,420,719 1,054,573 1,448,870 1,021,301 75% 70%
35 Due to estimation, affected population may be greater than total population 36 Updates of NRSP's response Floods as of November 13, 2011 37 Ibid 38 Estimated on the basis of Total Population Reported in UC Ranking Report by UNOCHA 39 http://www.pdma.rain.pk/rain2011/FrmpdBadinlosses.aspx
50,820
50,412
46,251
39,605
27,852
Matli
Badin
Sh. Fazal Rahu
Tando bago
Talhar
Crop Area Damaged
UNOCHA Badin District Profile: Jan-Feb 2012
80%
57%
86%
57%
86%
83%
43%
100%
52%
57%
Sh. Fazal Rahu
Tando bago
Badin
Matli
Talhar
Percentage of affected Population
PDMA Percent NRSP Percent
Comparison of Percentage reported by NRSP and PDMA

DISASTER HISTORY AND ITS IMPACT34
Lege
nd Dis
trict
bou
ndar
yA
ffec
ted
Pop
ulat
ion
Den
sity
No/
Sq.
Km
1 -
100
101
- 200
201
- 300
Bad
in
Hyd
erab
adJa
msh
oro
Mat
iari
Mir
purk
has
T. A
Yar
T. M
Kha
n
Thar
park
ar
That
ta
Um
erko
t
BA
DIN
MAT
LI
Gol
arch
i(S
FU)
TALH
AR
TAN
DO
BA
GO
Bad
in -
Aff
ecte
d P
opul
atio
n D
ensi
ty M
ap
May
201
2
Pun
jab
Bal
ochi
stan
Sin
dh
Dis
pute
d Te
rrito
ryFA
TA
Gilg
it B
altis
tan
Khy
ber P
akht
unkh
wa
Aza
d K
ashm
ir
Map
dat
a so
urce
(s):
Adm
in
boun
darie
s:
P
opul
atio
n C
ensu
s O
rgan
izat
ion
(PC
O)
Affe
cted
Pop
ulat
ion:
PD
MA
Sin
dh
Dis
clai
mer
s:Th
e de
sign
atio
ns
empl
oyed
an
d th
e pr
esen
tatio
n of
mat
eria
l on
thi
s m
ap d
o no
t im
ply
the
expr
essi
on o
f an
yop
inio
n w
hats
oeve
r on
the
par
t of
the
US
AID
and
iMM
AP
conc
erni
ng th
e le
gal s
tatu
s of
any
cou
ntry
, ter
ritor
y, c
ity o
rar
ea o
r of
its
auth
oriti
es,
or c
once
rnin
g th
e de
limita
tion
ofits
fron
tiers
or
boun
darie
s.
Map
Doc
Nam
e:
Cre
atio
n D
ate:
Proj
ectio
n/D
atum
:W
eb R
esou
rces
:
iM
MA
P_P
AK
_Bad
in H
ealth
Fac
ilitie
s_A
4L_v
1_05
2612
May
26,
201
2W
GS
84ht
tp://
ww
w.im
map
.org
010
205
Kilo
met
ers
Ara
bian
Sea
Indi
a
Afg
hani
stan
Chi
na
Iran
Pak
ista
n
Tehs
il N
ame
Are
a (S
q.K
m)
Aff
ecte
d Po
pula
tion
Popu
latio
n D
ensi
ty
(No/
Sq. K
m)
Bad
in
1812
.8
379,
277
209
Mat
li 10
73.1
19
5,52
0 18
2 S
hahe
ed F
azal
Rah
u 17
71.3
19
8,28
7 11
2 Ta
lhar
40
2.0
112,
345
280
Tand
o B
ago
1467
.9
135,
872
93
Tota
l 65
27.1
1,
021,
301
156
Floo
ds 2
011:
Aff
ecte
d P
opul
atio
n D
ensi
ty

35DISTRICT BADIN
2.2.3 Livelihood In the last two decades, sources of livelihood, in district Badin, have been continuously shrinking. Till 1980, people of Badin had many options, having, agriculture, livestock and fisheries as major sources of livelihood. However, over the years, situation changed and many had to migrate to other areas. The following are some of the issues, which adversely affected the livelihood means of the people of district Badin:
Total uncultivable land due to water logging and salinity is 184,850 acres which constitutes 16.4 percent of the total cultivable land.
Decreased fresh water availability diverted livelihood means from crops and livestock to fishing. Livestock has been badly affected as a result of the degradation of Indus delta. Due to fresh water decline and salinity prevailing in the delta region; vegetation around lakes and mangroves forest have degraded or have been lost. The rate of increase in uncultivable land is directly related to the decreased fresh water availability. Left Bank Outfall Drain (LBOD), though built with positive intensions, proved to be a disaster for the people of Badin in the long run. LBOD passing from Badin was designed to lower the water table and remove salinity in 1.27 million acres of Mirpurkhas, Sanghar and Shaheed Benazirabad districts.
Instead, the Left Bank Outfall Drain has increased the vulnerability of Badin to cyclones and floods40. LBOD was not designed to carry water from heavy floods as was proved in 2003 and 2011. In 2005, the World Bank investigated the program failures at the request of local leaders. Its inspection panel concluded in a July 2006 report that the bank violated six safeguard policies and in the process caused heavy damage in the coastal areas. "Throughout design, construction and operation of LBOD and NDP," the investigators wrote, "social and environmental aspects were largely overlooked or downplayed. In particular, the Panel found that the Project paid inadequate attention to the people and environment downstream of the irrigation and drainage system in southern Sindh." Perhaps most damning was the finding that significant technical mistakes were made during the design of the Tidal Link41.
40 Badin Hazard Livelihood and Vulnerability Baseline Report, 2009: Food and Agriculture Organization 41 South Asia Partnership-Pakistan

DISASTER HISTORY AND ITS IMPACT36
In 2011 floods, all the 46 UCs were affected with the flood water. According to Food and Agriculture Organization (FAO), the whole cotton cultivated land, 83 percent of the rice cultivated area and 43 percent of the sugarcane area was inundated. 99 percent of the area with other crops was affected too. In all the UCs, agriculture, fisheries, livestock, and personal businesses, were adversely affected. Growers of cotton were rendered most disadvantaged by the floods as a whole harvest of cotton was wasted. Besides, the sugar and rice industries were adversely affected due to the non-availability of the inputs for these industries which rendered more than 6,000 households vulnerable. Livestock and Agriculture Affected Agriculture and livestock, as mentioned above, are the major sources of livelihood in District Badin. A considerable damage was reported in livestock and agriculture sectors. 8,077 livestock heads were lost during 2011 floods. Table 2.2.3: Livestock Losses ATTRIBUTE NUMBER PERCENT Livestock Population 1,710,160 Livestock Loss 8,077 0.5% Livestock Lost Sold % 59 Source: FAO Sitrep 29
Total area of Badin district in acres calculated to the nearest acres is 1,662,031 and out of this total area 59% area was sown before 2011 floods. 38% of the sown area was damaged and the standing crops on that area were lost. Below table gives details of area damaged Table 2.2.4: Area Inundated and Crop Area Damaged ATTRIBUTE NUMBER PERCENT Total Area (Acres) 1,662,031 Area Sown (Acres) 984,805 59% of Total Area Area Affected (Acres) 500,004 Crop Area Affected (Acres) 375,718 38% of Sown Area Source: FAO Sitrep 29
According to FAO, cotton was affected 100% as the total area sown for cotton was inundated. Rice was affected up to 83% and loss to sugarcane was 43%. Following table gives details of area cultivated and percentage of damage caused. Table 2.2.5: Major Crops Damage reported by FAO MAJOR CROPS AREA SOWN AREA AFFECTED PERCENT Cotton 70,849 70,849 100% Rice 215,867 179,169 83% Sugarcane 152,485 65,569 43% Other 60,804 60,132 99% Source: FAO Sitrep 29

37DISTRICT BADIN
In terms of number of households that suffered crop losses due to floods, Multi-Cluster Need Assessment (MCNA) provided details in terms of percentage of households against different crop loss. Again, the highest reported damage was to the cotton crop of 96 percent and 51.7 households bore this loss. The following Table provides details of losses to crops and percentage of households affected: Table 2.2.6: Major Crops Damage reported by Multi-Cluster Needs Assessment Percentages Paddy Cotton Maize Pulses Orchards Sugarcane Percent Of HH 43.2 51.7 2.9 1.4 16.2 19.8 Percent Of Loss 86 96 70 100 98 66 Source: Multi-Cluster Needs Assessment Final: November 2011
Gap Analysis of Main Sources of Livelihoods and Major Crops According to UNOCHA, as of Feb 2012, the extent of damaged crops was:
Cotton 100 % Rice 83% Sugarcane 43%
At the time of the flood, in august, 111,300 bales of cotton production, 84,600 tons of rice production and 2,100 tons of fodder was lost. Government and Humanitarian sector responded but their meagre efforts couldn’t fill the gaps. WFP supported 125,753 households with 17,399 metric tons of food. The share of other agencies was supporting 44,499 households. Sunflower seeds and fertilizers were distributed among 18,000 families. A mere 3 percent of the total requested funding was provided for early recovery. Deligent planning is needed for the future monsoons.

39DISTRICT BADIN
2.2.4 Health Damages reported in Health Sector Around 21,477 Pregnant & Lactating Women (PLW) and 37,530 children below 5 years of age were affected of malnutrition due to food insecurity and lack of proper hygiene facilities. Pregnant women in particular are facing problems in accessing health services. The most prevalent ailments are diarrhoea, respiratory infections, skin diseases and fever.
Moderate Acute Malnourished Children 23,375 Sever acute Malnourished Children 14,155 Malnourished PLWs 21,477
Source: Pakistan Floods 2011, Badin District Profile Jan-Feb 2012, UN OCHA
According to initial health assessments, conducted by WHO and GoS, after floods 2011, 19 out of 37 BHU were damaged, 3 out of 11 RHC were affected, and the only district headquarter hospital was affected too43.. As of now, 63 % of the moderate malnourished children, 51% of the severely malnourished children and 37% of malnourished PLWs have been covered44. Badin Health Facilities Gap Analysis According to the EDO Health Badin, the 2011 floods didn’t cause any major damage to these health facilities. Presently, all the health facilities are functional and are serving their purpose. Most of the Health facilities have been taken over by district Government for their rehabilitation and reconstruction. The EDO office also states that the building department recently conducted a survey and will start working on the reconstruction of health facilities. (Source EDO Health Badin) Most Damaged RHC in Badin is “Pangrio” which hasn’t been rehabilitated yet and the surrounding areas around the HF are in really bad conditions which includes sanitation Problems RHC repaired by Merlin International -
1. Khadan 2. Nindo 3. Khanijat 4. Talhar 5. Dei
HF repaired by Save the Children 1. Fazal Mohammad Talpur - RHC 2. Badin City – City OPD 3. Golarchi - Taluka Hospital 4. Fatehabad – GD 5. Mureed Chang – GD
43 WHO, G. N. (8th to 12th September, 2011). Health Initial Rapid Assessment, 22 flood affected disricts in Sindh. Islamabad 44 http://pakresponse.info/LinkClick.aspx?fileticket=sBDg2mW6GqI%3D&tabid=98&mid=722

DISASTER HISTORY AND ITS IMPACT38
G
ap A
naly
sis
of A
gric
ultu
re a
nd L
ives
tock
in B
adin
CO
MPO
NEN
T PR
E FL
OO
D
POST
-FLO
OD
PO
ST-F
LOO
D R
ESPO
NSE
G
AP
Agric
ultu
re
Ar
ea S
own
in a
cres
w
as
70,8
49
for
Cott
on
Ar
ea S
own
in a
cres
w
as
215,
867
for
Rice
Area
Sow
n in
acr
es
was
15
2,48
5 fo
r Su
garc
ane
Ar
ea S
own
in a
cres
w
as
40,7
33
for
chili
es
Ar
ea S
own
in a
cres
w
as
20,0
72
for
othe
r cr
ops
and
vege
tabl
es
MCN
A N
ovem
ber 2
011
Fina
l U
N O
CHA
Seed
s,
fert
ilize
r an
d ag
ricul
tura
l in
puts
fo
r ra
bbi
crop
s w
ere
prov
ided
to
affe
cted
far
mer
s bu
t al
mos
t 20
% h
ouse
hold
s w
ere
not
able
to
gr
ow
crop
s du
e to
in
unda
ted
area
til
l D
ecem
ber,
2011
. So
urce
s: C
rop
dam
age
asse
ssm
ent
by S
UPA
RCO
& F
AO
Cott
on 9
6 %
dam
aged
51
.7 %
hou
seho
lds
bore
this
loss
Co
tton
100
% d
amag
ed
Sunf
low
er
seed
w
as
dist
ribut
ed
amon
g 18
,000
fa
mili
es42
Ri
ce
86%
da
mag
ed
and
43.2
%
of
hous
ehol
ds b
ore
this
loss
Ri
ce 8
3 %
dam
aged
FA
O h
elpe
d 11
,500
Fam
ilies
to
rest
ore
livel
ihoo
ds
Suga
rcan
e 66
% d
amag
ed a
nd 1
9.8
%
Hou
seho
lds
bore
this
loss
Su
garc
ane
43 %
dam
aged
FA
O
prov
ided
su
nflo
wer
pl
antin
g pa
ckag
e to
58
,000
ho
useh
olds
2.
9 %
hou
seho
lds
had
Mai
ze l
oss
and
loss
per
cent
age
is 7
0
Alon
g w
ith
this
FA
O
also
pr
ovid
ed
vege
tabl
e se
eds
to
23,5
00
fam
ilies
fo
r ki
tche
n ga
rden
ing
WFP
pro
vide
d CF
W t
o 2,
478
Hou
seho
lds
29,9
00
hous
ehol
ds
wer
e pr
ovid
ed a
gric
ultu
ral i
nput
s
Live
stoc
k 1,
710,
160
Live
stoc
k H
eads
FA
O re
port
ed a
loss
of 8
,077
hea
ds o
f liv
esto
ck
400,
923
anim
als
trea
ted
332,
400
kg
of
anim
al
food
di
strib
uted
42 h
ttp:
//pa
kres
pons
e.in
fo/L
inkC
lick.
aspx
?file
ticke
t=sB
Dg2
mW
6GqI
%3D
&ta
bid=
98&
mid
=722

DISASTER HISTORY AND ITS IMPACT40
Gap Analysis of Health facilities in Badin
ATTR
IBUT
E
PRE FLOOD SITUATION POST FLOOD SITUATION (as of Feb 2012)
GAP
Heal
th Fa
ciliti
es
19 out of 37 BHU were damaged,
3 out of 11 RHC are affected, and the
District headquarter hospital is affected
Moderate Malnourished Children: 23,375
acute Malnourished Children: 14,155
Malnourished PLWs: 21,477
RHC repaired by Merlin International - Khadan Nindo Khanijat Talhar Dei
Health Facilities repaired by Save the Children Fazal Mohammad Talpur - RHC Badin City – City OPD Golarchi - Taluka Hospital Fatehabad – GD Mureed Chang – GD
Malnutrition Moderate Malnourished Children
Treated: 14,675 Acute Malnourished Children Treated:
7,166 Malnourished pregnant and lactating
women Treated: 7,895 # of women reached with relevant
information on appropriate IYCF: 50,852
Moderate Malnourished Children: 8,703
Acute Malnourished Children: 6,989
Malnourished pregnant and lactating women: 13,552
Hosp
ital A
cces
s (P
hysic
al)
In Badin Mean Distance of BHU from main population 3.74KM
Maximum distance is 15 km from population to Health Unit
The health Facilities were not accessible
after the floods, as most of these HF were submerged in Floods.
Currently, all health Facilities in Badin are accessible by the local population apart from 1 RHC located in Pangrio.
Wor
king
Con
ditio
ns
Before 2010 floods all 37 Basic Health Units, 11 RHC and 1 DHQ were in working Condition.
The average numbers of rooms in BHUs were 6.68 and for females an average room of 2.16 per BHU.
After the 2011 floods in Badin 19/37
BHU have been damaged, 3/11 RHC are damaged and 1 DHQ hospital in Badin city is in working condition.
Presently, all the health facilities are functional and none of the BHUs, RHC are in non-working condition. However,1 RHC in Pangrio Badin is nonfunctional due to bad sanitation problems
The Health Facilities in Badin are damaged but are fully functional and are serving their purpose.

41DISTRICT BADIN
2.2.5 Education Post Emergency Situation of Education Sector Education and Literacy Department of Sindh45 reported that, according to the educational census, there are 3,159 schools of which, 2,967 are primary, 133 are middle, 50 are matric/secondary and 9 are higher secondary schools. During floods 2011, 249 schools were partially damaged and 221 were fully destroyed. District Badin, Schools’ Details46 Out of these affected schools, 59 primary schools, 5 middle schools and 1 higher secondary school have been rehabilitated. Table 2.2.7: Activities Performed by the Education Cluster
ACTIVITY DESCRIPTION TARGET ACHIEVED BENEFICIARY TARGET
BENEFICIARY ACHIEVED
Establishment Of TSS 150 150 11094 12822 Partially Damaged School Renovation 65 65 N/A 3,042 To Provide Education In Emergency 308 308 14,780 14,620 To Provide Training To Govt. And Para Teachers
100 76 100 76
Training Of Teachers 7 7 N/A 210 Source: UNICEF
Gap Analysis of Education Sector ATTRIBUTE PRE FLOOD
SITUATION POST FLOOD SITUATION
Response/Gap
SCHOOLS 2,967 Primary Schools
133 Middle Schools
50 Secondary Schools
9 Higher Secondary Schools
Average Enrolment per school is 59 students per school
249 schools partially damaged
221 schools fully destroyed
Total damage to schools were 16% of the total schools
A maximum estimated number of 27,64847 students are affected in these partially or fully damaged schools
In response to the emergency, Education Cluster has performed the following Activities:
59 primary schools were rehabilitated as of 18th May 2012
5 middle Schools rehabilitated 1 higher school rehabilitated As of 18th May,129 temporary learning
centers were established where more than 9,000 beneficiaries are getting education
65 partially damaged schools were rehabilitated where the number of beneficiaries is 3,042
Emergency Education provided to 14,620 beneficiaries
286 Government and Para teachers are trained This is all response, Gaps have not been worked out
45 Flood Report on Education Sector for Sindh Province: 2010-11 46 Education Cluster Response in Sindh 18th May 2012 47 This figure is generalized
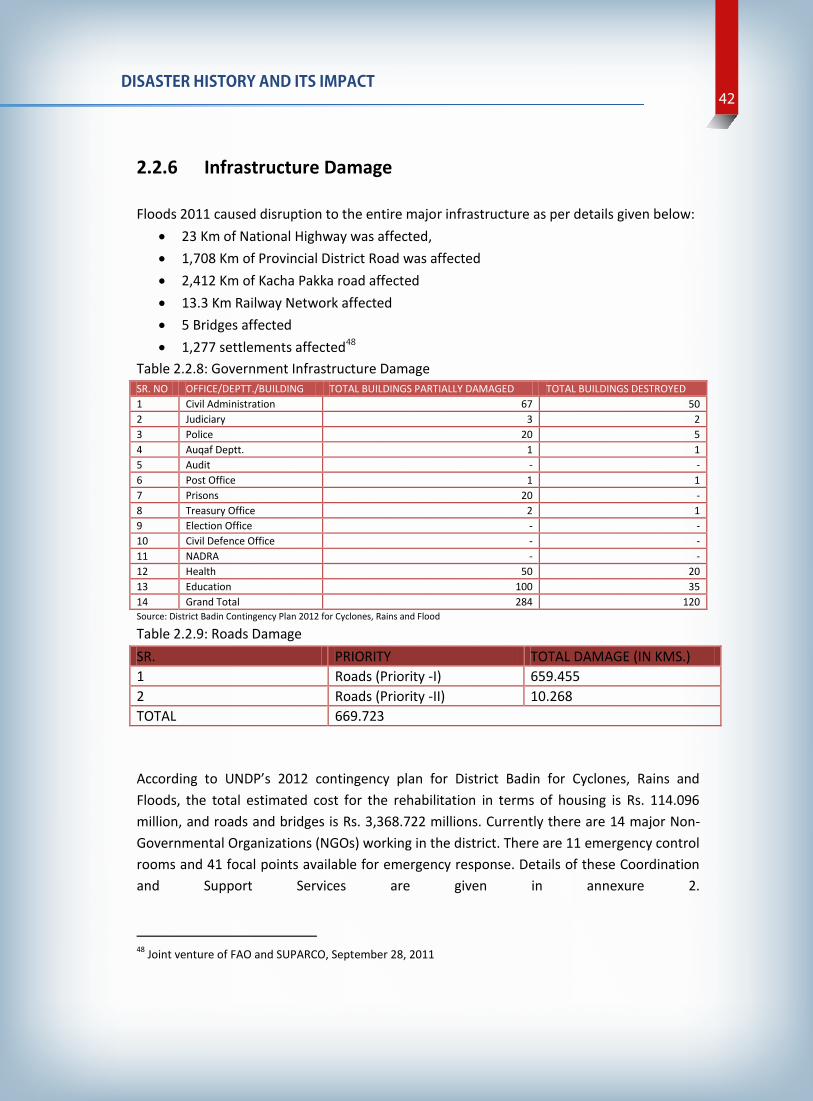
DISASTER HISTORY AND ITS IMPACT42
2.2.6 Infrastructure Damage Floods 2011 caused disruption to the entire major infrastructure as per details given below:
23 Km of National Highway was affected, 1,708 Km of Provincial District Road was affected 2,412 Km of Kacha Pakka road affected 13.3 Km Railway Network affected 5 Bridges affected 1,277 settlements affected48
Table 2.2.8: Government Infrastructure Damage SR. NO OFFICE/DEPTT./BUILDING TOTAL BUILDINGS PARTIALLY DAMAGED TOTAL BUILDINGS DESTROYED 1 Civil Administration 67 50 2 Judiciary 3 2 3 Police 20 5 4 Auqaf Deptt. 1 1 5 Audit - - 6 Post Office 1 1 7 Prisons 20 - 8 Treasury Office 2 1 9 Election Office - - 10 Civil Defence Office - - 11 NADRA - - 12 Health 50 20 13 Education 100 35 14 Grand Total 284 120 Source: District Badin Contingency Plan 2012 for Cyclones, Rains and Flood
Table 2.2.9: Roads Damage SR. PRIORITY TOTAL DAMAGE (IN KMS.) 1 Roads (Priority -I) 659.455 2 Roads (Priority -II) 10.268 TOTAL 669.723 According to UNDP’s 2012 contingency plan for District Badin for Cyclones, Rains and Floods, the total estimated cost for the rehabilitation in terms of housing is Rs. 114.096 million, and roads and bridges is Rs. 3,368.722 millions. Currently there are 14 major Non-Governmental Organizations (NGOs) working in the district. There are 11 emergency control rooms and 41 focal points available for emergency response. Details of these Coordination and Support Services are given in annexure 2.
48 Joint venture of FAO and SUPARCO, September 28, 2011
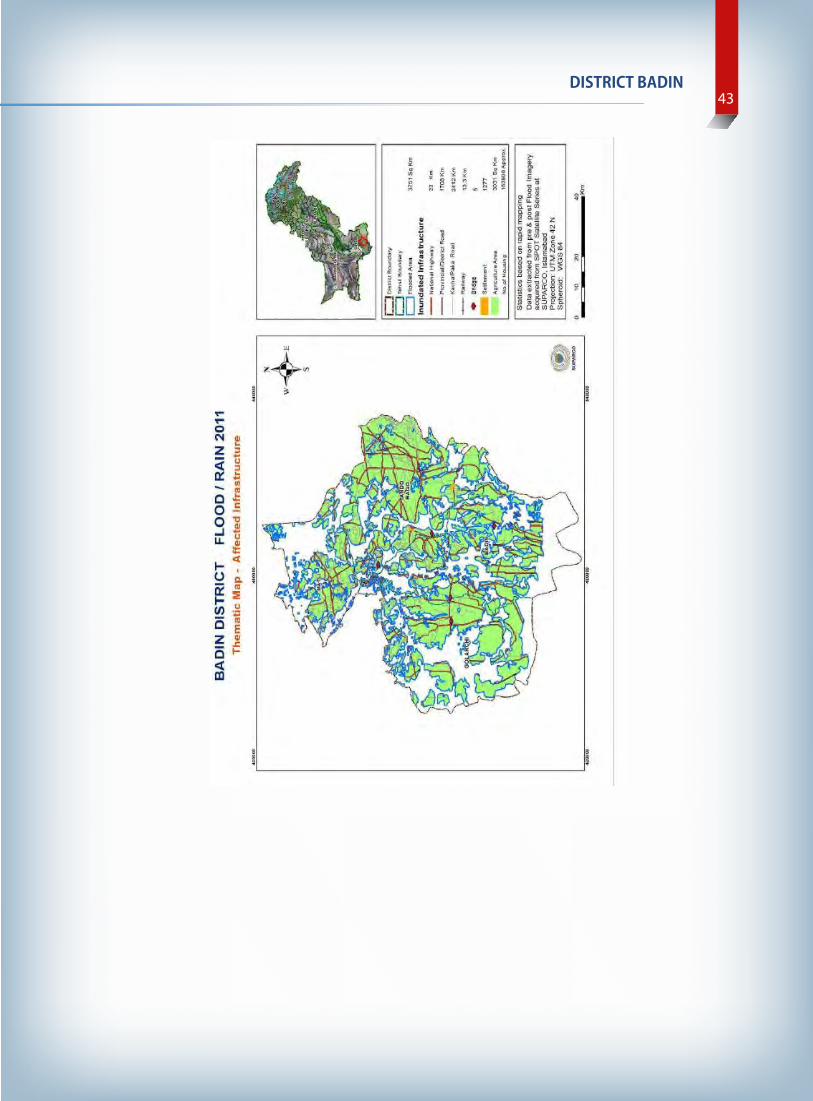
43DISTRICT BADIN

HAZARD VULNERABILITY AND CAPACITY ANALYSIS44
3 Hazard, Vulnerability and Capacity Analysis
3.1 Hazard Vulnerability and Capacity Analysis Prior to analysing existing hazards, vulnerability to hazards and capacity to cope with the same of the district and its population, an explanation of the terms used is given under each heading, as follows:
3.1.1 Hazard A hazard is a situation which triggers disaster. But it can be also defined as: “A potentially damaging physical event, phenomenon or human activity that may cause the Loss of life or injury, property damage, social and economic disruption or environmental degradation”49 A hazard is a situation that has the potential to harm the health and safety of people or to damage plant and equipment. Hazards can be divided into two categories.
3.1.1.1 Natural Hazard Natural hazards are natural processes or phenomena within the earth system that may constitute a damaging event. For example typhoons, tsunamis, earthquake and volcanic eruption cyclones, earthquakes, floods, landslides, storms are natural hazards.
3.1.1.2 Man-made Hazard Any industrial, nuclear, or transportation accident, explosion, power failure, resource shortage, or other condition, resulting from man-made causes, which threaten or cause damage to property, human suffering, hardship or loss of life constitute ‘Man-made Hazard.
3.1.1.3 Hazard Matrix of district Badin HAZARD FREQUENCY AREA AFFECTED/UNION
COUNCILS SEVERITY/FORCE YEAR
CYCLONE
Once in decade Ahmed Rajo, Bhugra Memon, Kadhan, khoski ,mithi and seerani
High 1964/1999/2007
49 The “Urban Governance and Community Resilience Guides” (ADPC, 2010)

45DISTRICT BADIN
HAZARD FREQUENCY AREA AFFECTED/UNION COUNCILS
SEVERITY/FORCE YEAR
FLOOD Once in three year Ahmed Rajo, Bhugra Memon,Khorwah, Tarai, Garho, Seerani,Kadhan, Mithi III, Abdullah Shah/ entire Badin
High 1970/1976/1979/1988/ 1994/1999/2003/2006/2010/ 2011
HEAVY RAINFALL Once In three year Taluka Badin, Taluka SF Rahoo
Medium(270-320 mm)
1973/1994/2003/2006/2010/2011
EARTHQUAKE Once in life Taluka Badin, Taluka SF Rahoo
Medium
2001
LBOD 1997 onwards Entire Badin High 1999/2003/2010/2011 DROUGHT Once in thirty years -do- Medium 1894/1932/1965-69 SEA INTRUSION Permanent Coastal area Medium INDUSTRIAL WASTES
Permanent
Entire Badin
Medium
---
3.1.2 Vulnerability Vulnerability is a situation which is: “The attributes and circumstances of a community or system that makes it sensitive, vulnerable or susceptible to the damaging effects of a hazard50” Vulnerability precedes disasters, contribute to their severity, hinder and obstruct the disaster response. It is divided into three parts:
3.1.2.1 Physical/Material Vulnerability Weakness of the built environment and lack of access to physical and material resources i.e. living in hazard prone areas or in unsafe buildings, lack of savings, insurance and assets constitutes physical/material vulnerability.
3.1.2.2 Social/Organizational Vulnerability Social/Organizational Vulnerability refers to inequality in social systems that discriminate against and marginalize certain groups of people from accessing resources and services. People who have been marginalized in social, economic or political terms are vulnerable to disasters. Weakness in social and organizational areas may also cause disasters e.g. deep division can lead to conflict and war. Conflict over resources due to poverty can also lead to violence.
3.1.2.3 Attitudinal/Motivational Vulnerability Existence of fatalistic myths and religious beliefs influence people’s vulnerability to disaster risks. If people believe that disasters are ‘acts of God’ and if they have low confidence in their ability to affect change or have ‘lost heart’ and feel defeated by events they cannot control, these people are often harder hit by disasters.
50 Participant’s Course workbook (ADPC)

HAZARD VULNERABILITY AND CAPACITY ANALYSIS46
3.1.2.4 Vulnerability matrix PHYSICAL/ MATERIAL
SOCIAL/ORGANIZATIONAL
ATTITUDINAL/MOTIVATIONAL
Rural/coastal population of Badin is entangled in vicious circle of poverty. Having lost everything in flood, they have gone under the poverty line and are in miserable condition.
Badin has got large population (2007) 1265,000 and most of them are illiterate.
Sense of dependence is found in the people, looking for aid from govt. and NGOs.
Less availability of boats and vehicles for evacuation of population from low lying areas
Lack of coordination between govt. and NGOs working on DRM and climate and environment.
No interest in improving their own lives but wait for other to come and take initiative.
Exposure to different kinds of hazards like flood, cyclones and heavy rainfall etc.
Self-interest oriented leaders of the local community, attach themselves to NGOs just for their benefits.
Lack of trust between government and the community
Badin is a coastal area with maximum elevation of 16.7 m on north west while minimum elevation in south is zero meters.
Unawareness of Zamindars, who blocked watercourses to their fields which result in the burst of canals at the end. Creating flood situation in the area and damaging everything what comes in its way.
Fatalism, natural hazards are seen as “Acts of Nature”
Not enough funds provision, for DRM activities.
Lack of coordination between govt. and NGOs working on DRM and climate and environment mentioned above.
People of Badin are not aware of their vulnerabilities, due to their ignorance, to natural and manmade hazards.
Breaches in LBOD, due to seasonal monsoon heavy rain falls and excessive municipal and industrial water
Community is divided into different political groups, lacking unity l. politicizing important issues which affects the people.
At risk communities are mostly not familiar with preventive measures to be taken before, during and after disaster.
Breaches in the irrigation canals, because they are not maintained properly.
Most population lives in rural areas (86 %) having no approach to basic life facilities.
No water treatment plant in industries (Agro-based and sugar mills )
Community people don’t cooperate with govt., in implementation of already made rules for land use planning and building codes.
Non availability of boats on both sides of LBOD, in the district for emergency situation.
In emergency, evacuees usually stay on Bunds, causing hindrance in movement of machinery and rescue staff.
Design defects in LBOD and its component. In LBOD construction social and environmental aspects were largely overlooked.
No disaster committees in communities, for assistance in assessment and implementation of DRM Plans.
Water logging and salinity affects the cultivated land and agriculture. Nearly 30% of irrigated lands in Sindh are threatened by water logging and salinity.
Inefficient monitoring system of hazards in monsoon season, by the govt. and local disaster committees.
Nonexistence of District Emergency Operation Centre in the district. (DEOC)
Insufficient CBDRM projects in the union councils of district Badin.

47DISTRICT BADIN
PHYSICAL/ MATERIAL
SOCIAL/ORGANIZATIONAL
ATTITUDINAL/MOTIVATIONAL
Kacha (mud ) houses at coastal area, exposed to cyclones etc.
No coordination of the local administration departments
Insufficient hospitals, with low standard health facilities and minimum number of doctors.
Communication gap between govt. and community, keeping away people from community projects, not appreciating people participation in the projects.
370,000 individuals are living in danger zone, of the coastal area, of Badin district, thus are exposed and vulnerable to tropical cyclones.
Livelihood is not sustainable, i.e. there is no incorporation and integration of DRR measures in the livelihood.
No disaster resilient infrastructure in the entire Badin district.
Scarcity of trained volunteers on DRR/DRM
Industrial wastes from Agro-based industries not only pollute water but air also and provide base for diseases.
Less capacity of district govt. to tackle issues related to emergency.
Inadequate Early warning system for flood, rainfall and cyclones etc.
Less capacity and interest of district administration towards DRM
No systematic and proper database is available at district level
Lack of social security, and pro poor development initiatives
Unplanned development ( no integration of DRR measures in building codes)
Out of 3,159 schools 2967 are primary and just 9 are higher secondary. This Implies that most of the Population has only access to primary education. 9 HSS indicates lack of interest In education.
Rainfall is highly unpredictable in the Badin with an average of 258.8mm
Around 76,199 pregnant and &27498 lactating woman (PLW) are affected by malnutrition.
Badin is at the extreme tail end of the irrigation system.
Drinking water accessibility in Badin is also not satisfactory just 18%of households are using tap water. Majority of people are using other sources for drinking and thus are prone to water borne diseases.
Sanitation facility is not satisfactory. 86% people live in rural in which just 9%have flush facility.
Economic situation of 26.04% of Hh in Badin has become poorer due to exposure to many hazards like droughts, floods and cyclones.
Decreased fresh water availability has increased uncultivable land. As a result Salinity prevailed in the delta region, degrading vegetation and mangroves around lakes.
Food prices in Badin have increased many folds ranging from 7 to 40% for different commodities thus increasing food insecurity.

HAZARD VULNERABILITY AND CAPACITY ANALYSIS48
3.1.3 Capacity Capacity is contrasted to vulnerability. Ability to perform or produce is termed as capacity. Capacities are resources, means and strengths, which exist in households and communities and which enable them to cope with, withstand, prepare for, prevent, mitigate or quickly recover from a disaster. The combination of all the strengths attributes and resources available within a community, society or organization that can be used to achieve agreed goals constitute its capacity to cope with hazards51.
3.1.3.1 Physical/Material Capacity In most disasters, people suffer their greatest losses in the physical and material realm. Access to physical/material things or objects count as physical capacity. A few examples of physical and material resources are cash, food, land, properties and tools.
3.1.3.2 Social /Organizational Capacity: When everything physical is destroyed, people still has their skills, experiences and knowledge; they have family and social networks. They have leaders and systems for making decisions. They also have local, collective ‘wisdom’ reflected in their cultural practices that help them reduce or cope with disaster risks.
3.1.3.3 Attitudinal/Motivational Capacity People also have positive attitudes and strong motivations such as the will to survive and willingness to help each other.
3.1.3.4 Capacity matrix PHYSICAL/ MATERIAL
SOCIAL/ORGANIZATIONAL
ATTITUDINAL/MOTIVATIONAL
Irrigation system is well developed i.e. kotri and sukkar barrages irrigate the fertile land of Badin.
Traditional Family system/structure is found in Badin which provides manpower and give structure to the society.
People of Badin district has sympathy and love for each other and cooperate and facilitate in floods and heavy rainfalls.
Badin is Gas and crude oil (4 oil fields ) producing district which contributes to the development of the country (50% crude oil of the total production of the country)
Awareness sessions and trainings conducted by welfare departments in vulnerable to risk communities has really influenced the perception towards disaster.(Paradigm shift concerning disasters)
Crops i.e. cash & food crops (sugar cane, sunflower, rice, wheat etc.) are the livelihood source for poor farmers.
Presence of CBO’s chairmen and presidents who understand the community very well and possess great influence on the people.
Contingency plans formation shows change in perception of govt. regarding DRM.
There are 11% Pakka Houses which are disaster resilient
Tribal heads can facilitate the govt. and NGOs in implementation of DRM plan.
Flood management plans provide guideline in management of floods.
Sugar and rice husking mills provides sugar and rice not only to
Identification of relief sites by the govt. and community shows their level
51 Participant’s Course workbook (ADPC)
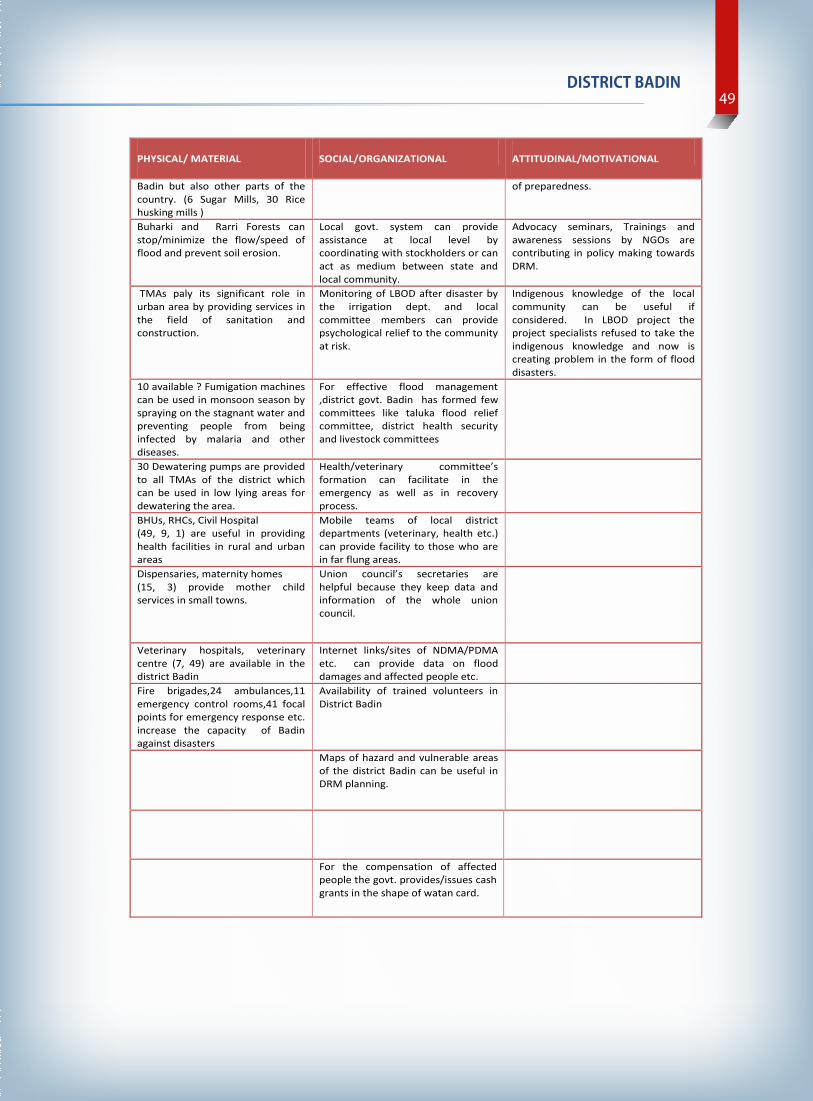
49DISTRICT BADIN
PHYSICAL/ MATERIAL
SOCIAL/ORGANIZATIONAL
ATTITUDINAL/MOTIVATIONAL
Badin but also other parts of the country. (6 Sugar Mills, 30 Rice husking mills )
of preparedness.
Buharki and Rarri Forests can stop/minimize the flow/speed of flood and prevent soil erosion.
Local govt. system can provide assistance at local level by coordinating with stockholders or can act as medium between state and local community.
Advocacy seminars, Trainings and awareness sessions by NGOs are contributing in policy making towards DRM.
TMAs paly its significant role in urban area by providing services in the field of sanitation and construction.
Monitoring of LBOD after disaster by the irrigation dept. and local committee members can provide psychological relief to the community at risk.
Indigenous knowledge of the local community can be useful if considered. In LBOD project the project specialists refused to take the indigenous knowledge and now is creating problem in the form of flood disasters.
10 available ? Fumigation machines can be used in monsoon season by spraying on the stagnant water and preventing people from being infected by malaria and other diseases.
For effective flood management ,district govt. Badin has formed few committees like taluka flood relief committee, district health security and livestock committees
30 Dewatering pumps are provided to all TMAs of the district which can be used in low lying areas for dewatering the area.
Health/veterinary committee’s formation can facilitate in the emergency as well as in recovery process.
BHUs, RHCs, Civil Hospital (49, 9, 1) are useful in providing health facilities in rural and urban areas
Mobile teams of local district departments (veterinary, health etc.) can provide facility to those who are in far flung areas.
Dispensaries, maternity homes (15, 3) provide mother child services in small towns.
Union council’s secretaries are helpful because they keep data and information of the whole union council.
Veterinary hospitals, veterinary centre (7, 49) are available in the district Badin
Internet links/sites of NDMA/PDMA etc. can provide data on flood damages and affected people etc.
Fire brigades,24 ambulances,11 emergency control rooms,41 focal points for emergency response etc. increase the capacity of Badin against disasters
Availability of trained volunteers in District Badin
Maps of hazard and vulnerable areas of the district Badin can be useful in DRM planning.
For the compensation of affected people the govt. provides/issues cash grants in the shape of watan card.

HAZARD VULNERABILITY AND CAPACITY ANALYSIS50
PHYSICAL/ MATERIAL
SOCIAL/ORGANIZATIONAL
ATTITUDINAL/MOTIVATIONAL
Funds for DRM from international agencies
Numerous shrines are there in Badin district which attracts number of local tourist and are a source of income generation.
District disaster management authority in the district
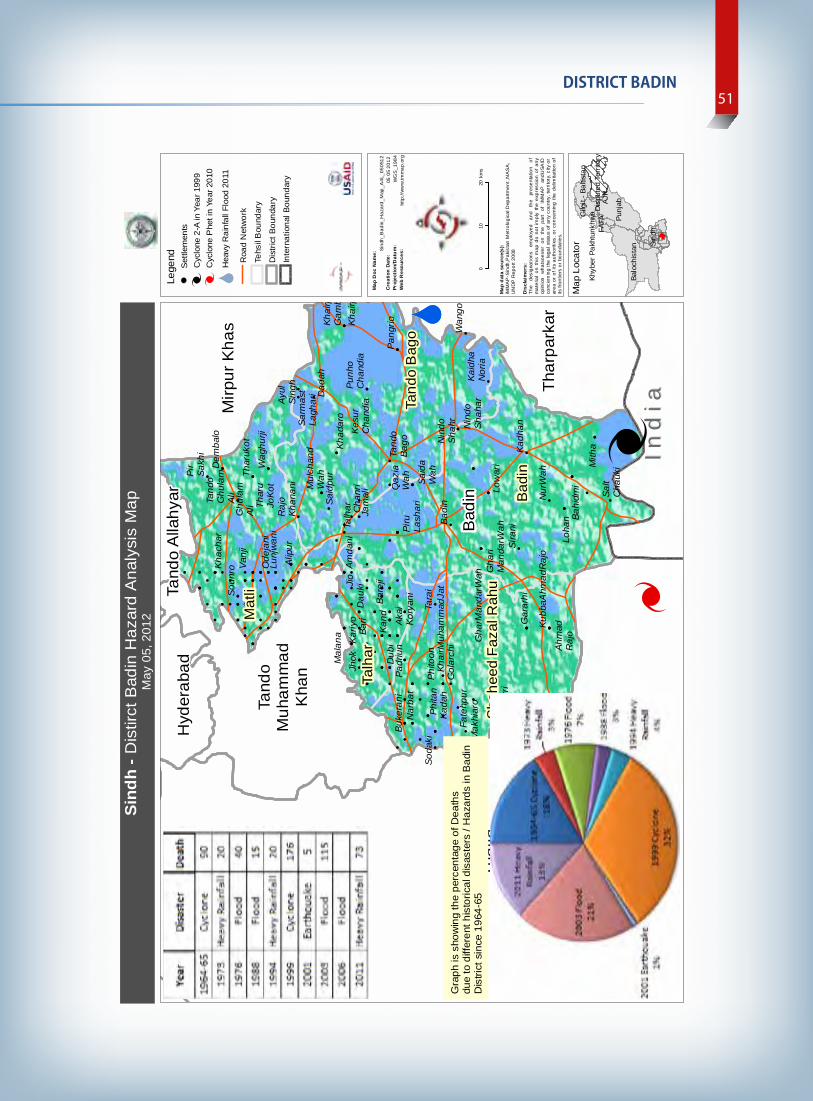
51DISTRICT BADIN
Punj
ab
Balo
chis
tan Si
ndh
Dis
pute
d Te
rrito
ryFA
TA
Gilg
it - B
altis
tan
Khyb
er P
akht
unkh
wa
AJK
Sin
dh -
Dis
tirct
Bad
in H
azar
d A
naly
sis
Map
May
05,
201
2
!
!!
!
!!!
!!
!!!!!
!!!!
!
!!
!!!
!!!!!
!!!
!!
!!!
!!
!
!!!
!
!!!
!
!!!!
!!
!!!!
!!
!!!
!!!
!!
!!!
!!!!
!!!!!!
!!!
!!!!
!!!!
!!
!
!!!!
!!!
!!
!!
!!
!!!!!
!!
!!
!!
!!!
!!!!
!!!
!
!!!
!!
!
!!!!
!!
!!
!!!
!!
!
!!!
!
!!!
!!
!!
!!!
!!
!!
!!
!!!!!!
!!
!!!
!!
!!!
!!!
!!!
!!!
!!!!
!!
!!
!!!!
!
!!!!
!!!!
!!
!!
!!
!!!!!
!!
!
!!!!!!
î
î
ÔÕ
Sal
tC
hauk
iMith
a
Bah
idm
iLo
han
Kub
ba A
hmad
Raj
o
Ahm
adR
ajo
Nur
Wah
Gar
arhi
Kad
han
Sira
niR
arri
Rar
iLo
war
i
Kai
dha
Nor
iaM
akhi
aro
Gha
r Man
dar W
ahG
hari
Man
dar W
ah
Fate
hpur
Wan
go
Nin
doS
hahr Nin
doS
haha
r
Gol
arch
iB
adin
Kad
ahK
hair M
uham
mad
Jat
Sod
aki
Tara
iP
hito
onP
hita
n
Nar
bat
Sai
daW
ah
Qaz
iaW
ahB
uker
ani
Pad
riun
Piru Lash
ari
Pan
grio
Dub
iK
and
Aka
iK
orya
ni
Tand
oBa
go
Bar
eji
Dau
kiP
unho
Cha
ndia
Kes
urC
hand
iaJh
okK
ariy
oB
ari
Cha
nri
Jam
ali
Amda
niM
alan
aJi
oTa
lhar
Khai
rpur
Gam
boKh
airp
urKh
adar
oS
aidp
ur
Mul
chan
dW
ahD
adah
Raj
oK
hana
niAy
ulSi
ngh
Sarm
ast
Lagh
ari
Alip
ur
Lunj
wan
iO
deja
niW
aghu
rji
Thar
ukot
Thar
uJo
Kot
Van
jiS
ounr
o
Tand
oG
hula
mA
liG
hula
mA
li
Dem
balo
Kha
char
Pir
Sak
hi
Bad
in
Sha
heed
Faz
al R
ahu
Mat
li
Tand
o B
ago
Talh
ar
Bad
in
Mirp
ur K
has
Thar
park
ar
That
ta
Hyd
erab
adTa
ndo
Alla
hyar
Tand
oM
uham
mad
Kha
n
Ind
iaIn
dia
010
20km
s
Map
Doc
Nam
e:
Cre
atio
n D
ate:
Proj
ecti
on/D
atu
m:
Web
Res
our
ces:
Si
ndh_
Bad
in_H
azar
d_M
ap_A
4L_0
5051
205
05
2012
W
GS
_198
4ht
tp://
ww
w.im
map
.org
Map
dat
a so
urce
(s):
iMM
AP
-Sin
dh,P
akis
tan
Met
rolo
gica
l Dep
artm
ent ,
NA
SA
,U
ND
P R
epor
t 200
8
Dis
clai
mer
s:Th
e de
sign
atio
ns
empl
oyed
an
d th
e pr
esen
tatio
n of
mat
eria
l on
thi
s m
ap d
o no
t im
ply
the
expr
essi
on o
f an
yop
inio
n w
hats
oeve
r on
th
e pa
rt of
iM
MA
P
andU
SAID
conc
erni
ng t
he le
gal s
tatu
s of
any
cou
ntry
, ter
ritor
y, c
ity o
rar
ea o
r of
its
auth
oriti
es, o
r co
ncer
ning
the
del
imita
tion
ofits
fron
tiers
or
boun
darie
s.
Map
Loc
ator
Lege
nd
Set
tlem
ents
Roa
d N
etw
ork
Tehs
il B
ound
ary
Dis
tric
t Bou
ndar
y
Inte
rnat
iona
l Bou
ndar
y
î îCyc
lone
2-A
in Y
ear 1
999
Cyc
lone
Phe
t in
Year
201
0
ÔÕH
eavy
Rai
nfal
l Flo
od 2
011
Gra
ph is
sho
win
g th
e pe
rcen
tage
of D
eath
sdu
e to
diff
eren
t his
toric
al d
isas
ters
/ H
azar
ds in
Bad
in
Dis
trict
sin
ce 1
964-
65

HAZARD VULNERABILITY AND CAPACITY ANALYSIS52
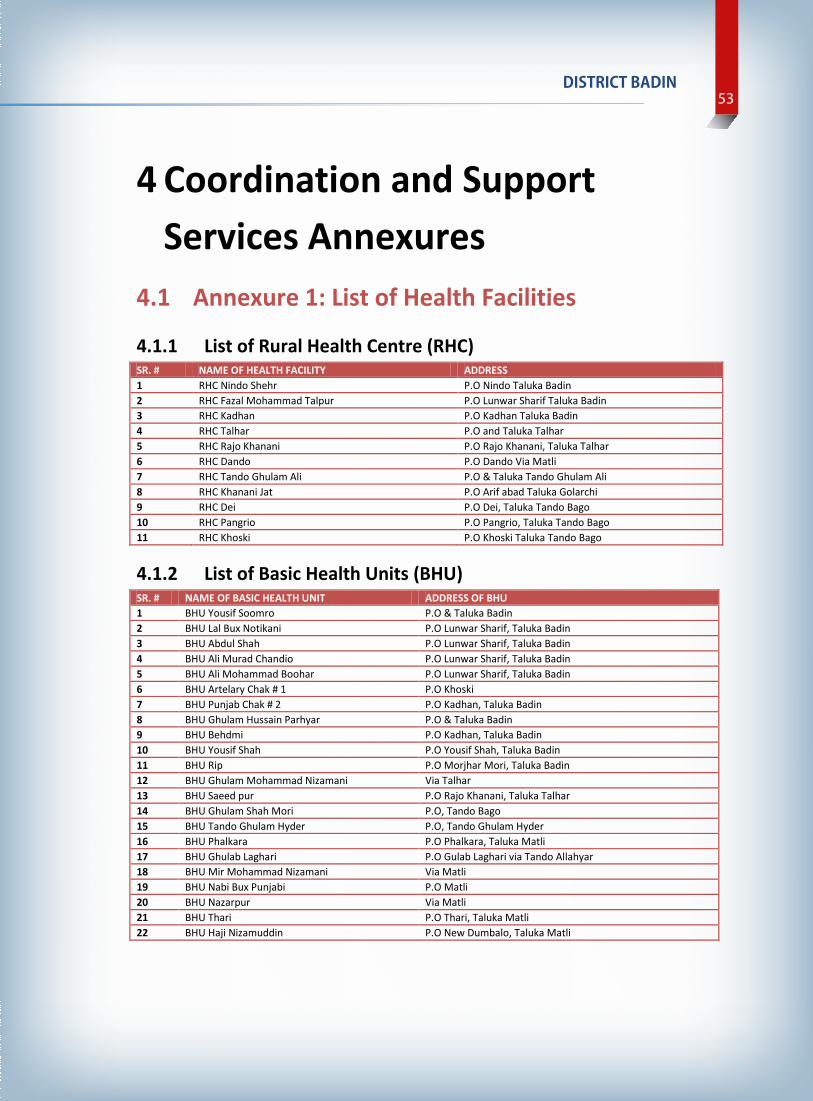
53DISTRICT BADIN
4 Coordination and Support Services Annexures
4.1 Annexure 1: List of Health Facilities
4.1.1 List of Rural Health Centre (RHC) SR. # NAME OF HEALTH FACILITY ADDRESS 1 RHC Nindo Shehr P.O Nindo Taluka Badin 2 RHC Fazal Mohammad Talpur P.O Lunwar Sharif Taluka Badin 3 RHC Kadhan P.O Kadhan Taluka Badin 4 RHC Talhar P.O and Taluka Talhar 5 RHC Rajo Khanani P.O Rajo Khanani, Taluka Talhar 6 RHC Dando P.O Dando Via Matli 7 RHC Tando Ghulam Ali P.O & Taluka Tando Ghulam Ali 8 RHC Khanani Jat P.O Arif abad Taluka Golarchi 9 RHC Dei P.O Dei, Taluka Tando Bago 10 RHC Pangrio P.O Pangrio, Taluka Tando Bago 11 RHC Khoski P.O Khoski Taluka Tando Bago
4.1.2 List of Basic Health Units (BHU) SR. # NAME OF BASIC HEALTH UNIT ADDRESS OF BHU 1 BHU Yousif Soomro P.O & Taluka Badin 2 BHU Lal Bux Notikani P.O Lunwar Sharif, Taluka Badin 3 BHU Abdul Shah P.O Lunwar Sharif, Taluka Badin 4 BHU Ali Murad Chandio P.O Lunwar Sharif, Taluka Badin 5 BHU Ali Mohammad Boohar P.O Lunwar Sharif, Taluka Badin 6 BHU Artelary Chak # 1 P.O Khoski 7 BHU Punjab Chak # 2 P.O Kadhan, Taluka Badin 8 BHU Ghulam Hussain Parhyar P.O & Taluka Badin 9 BHU Behdmi P.O Kadhan, Taluka Badin 10 BHU Yousif Shah P.O Yousif Shah, Taluka Badin 11 BHU Rip P.O Morjhar Mori, Taluka Badin 12 BHU Ghulam Mohammad Nizamani Via Talhar 13 BHU Saeed pur P.O Rajo Khanani, Taluka Talhar 14 BHU Ghulam Shah Mori P.O, Tando Bago 15 BHU Tando Ghulam Hyder P.O, Tando Ghulam Hyder 16 BHU Phalkara P.O Phalkara, Taluka Matli 17 BHU Ghulab Laghari P.O Gulab Laghari via Tando Allahyar 18 BHU Mir Mohammad Nizamani Via Matli 19 BHU Nabi Bux Punjabi P.O Matli 20 BHU Nazarpur Via Matli 21 BHU Thari P.O Thari, Taluka Matli 22 BHU Haji Nizamuddin P.O New Dumbalo, Taluka Matli

COORDINATION AND SUPPORT SERVICES ANNEXURES54
SR. # NAME OF BASIC HEALTH UNIT ADDRESS OF BHU 23 BHU Haji Dodo Khan Gishkori P.O New Dumbalo 24 BHU Kapri Mori Via Tando Ghulam Ali 25 BHU Chaudhry Fateh Mohammad P.O New Dumbalo 26 BHU Tarai P.O Tarai Taluka Golarchi 27 BHU Khorwah P.O Golarchi 28 BHU Molve Ali Mohammad Maheri P.O Kario Ghanwar Tal. Golarchi 29 BHU Juna P.O Kario Ghanwar Tal. Golarchi 30 BHU Ahmed Rajo P.O & Taluka Golarchi 31 BHU Gharo P.O Morjhar Mori Via Badin 32 BHU Mataro Mendharo P.O Fateh abad, Taluka Golarchi 33 BHU Rahuki P.O Rahuki Taluka Golarchi 34 BHU Dadah P.O Dei Taluka Tando Bago 35 BHU Khalifo Qasim P.O Tando Bago 36 BHU Wali Mohammad Malkani P.O Wali Mohammad Malkani, Taluka Tando Bago 37 BHU Syed Ali Bux Shah P.O Tando Bago 38 BHU Saeed Khan Bhurgri P.O Nindo Shehr SPO and Helping Hand Survey of Health Facilities in Badin
4.1.3 List of Dispensaries SR. # NAME OF DISPENSARY SR. # NAME OF DISPENSARY 1 Govt. Disp. Motan 9 Govt. Disp. Abdullah Samoo 2 Dr. Chandio Dr. Asadullah Jamali 10 Govt. Disp. Beero Lanjwani 3 Govt. Disp. Boro Shaib Khan 11 Govt. Disp. Bakhoo Chandio 4 Govt. Disp. Baghali 12 Govt. Disp. Sultan Chandio 5 Govt. Disp. Abdullah Samoo 13 Govt. Disp. Seerani 6 Govt. Disp. Sorhadi 14 Govt. Disp. Qabaili Chak 7 Govt. Disp. Ghainoo Khan Laghari 15 Govt. Disp. Meehna 8 Govt. Disp. Manik Laghari 16 Govt. Disp. Allahabad 17 Govt. Disp. Chak No.5 SPO and Helping Hand Survey of Health Facilities in Badin
4.1.4 BHU Rooms by Type and Number SR. # FACILITY AVAILABLE NON AVAILABLE 1 Consultation Rooms In Bhus 25 6 2 Consultation Room In Health Units For Female Patients 23 8 3 Checkup Rooms For Patients 30 1 4 Screen Facility For Female Patients 28 3 5 Waiting Room 29 2 6 Latrines For Patients Within Bhu Compound 27 4 7 Latrines For Female Patients 26 5 8 Latrines For Male Patients 27 4 9 Drinking Water 22 9 10 Electricity Facility In Health Units 26 5 SPO and Helping Hand Survey of Health Facilities in Badin

55DISTRICT BADIN
4.1.5 Furniture and other material in BHUs Sr. # DETAIL Total Average 1 Chairs 286 9.23 2 Table 135 4.35 3 Cupboard 43 1.43 4 Patients Bed 72 2.32 5 Laboratory 03 0.10 6 Chemical Test 17 0.57 7 Ambulance 0 0 8 Blood Bank 0 0 9 Sterilizer 30 0.97 10 Freezer 28 0.90 11 Other 09 0.29 SPO and Helping Hand Survey of Health Facilities in Badin
4.1.6 Availability of Instruments in Health Units SR. # INSTRUMENT NUMBER AND AVAILABILITY 1 Stethoscope 30 2 Bp Apparatus 30 3 Thermometer 31 4 Tongue Depressor 30 5 Weight Machine 29 6 Diagnostic Set 24 7 Examination Coach 29 8 Delivery Kit 22 9 Screen 24 10 Drip Stand 28 11 Dnc Kit 5 12 Fetoscope And Gluco Meter 2 13 Surgical Instruments Total: 90 Average: 3.1
4.1.7 Present Staff in Health Units SR. # STAFF MALE FEMALE TOTAL 1 Doctors 31 31 62 2 Nursing Staff 133 40 173 3 Other 50 8 58
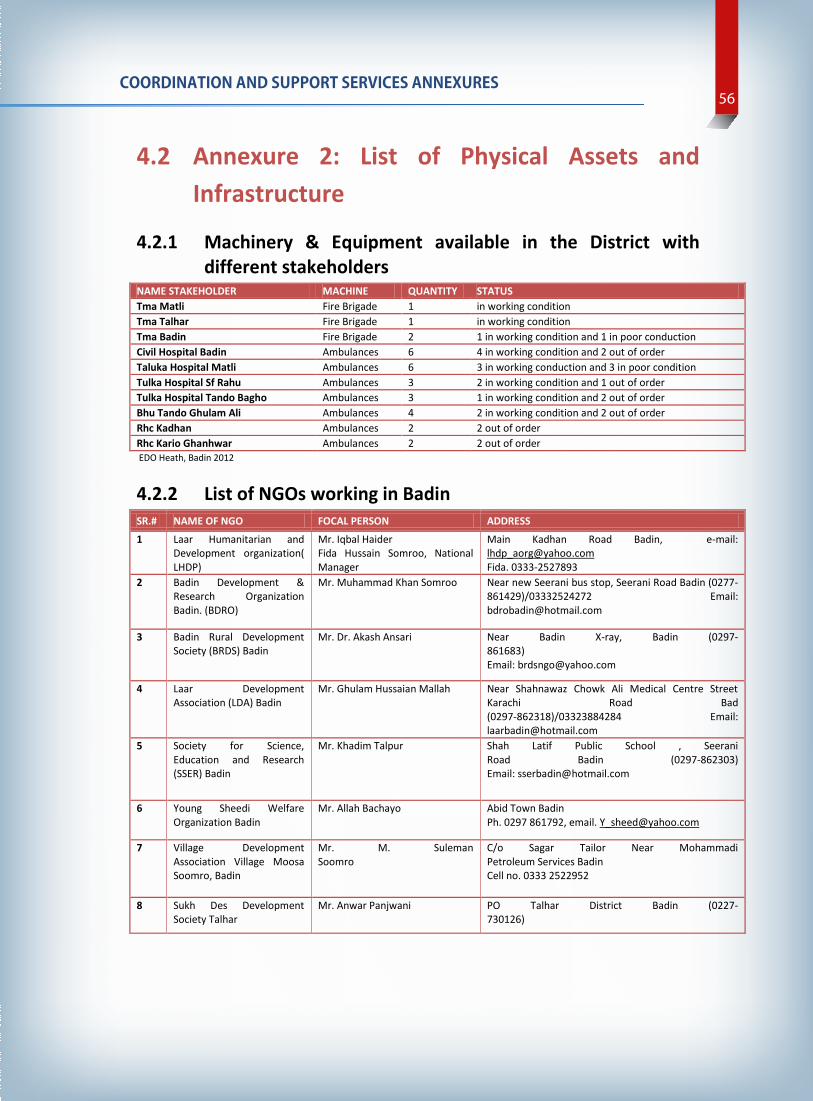
COORDINATION AND SUPPORT SERVICES ANNEXURES56
4.2 Annexure 2: List of Physical Assets and Infrastructure
4.2.1 Machinery & Equipment available in the District with different stakeholders
NAME STAKEHOLDER MACHINE QUANTITY STATUS Tma Matli Fire Brigade 1 in working condition Tma Talhar Fire Brigade 1 in working condition Tma Badin Fire Brigade 2 1 in working condition and 1 in poor conduction Civil Hospital Badin Ambulances 6 4 in working condition and 2 out of order Taluka Hospital Matli Ambulances 6 3 in working conduction and 3 in poor condition Tulka Hospital Sf Rahu Ambulances 3 2 in working condition and 1 out of order Tulka Hospital Tando Bagho Ambulances 3 1 in working condition and 2 out of order Bhu Tando Ghulam Ali Ambulances 4 2 in working condition and 2 out of order Rhc Kadhan Ambulances 2 2 out of order Rhc Kario Ghanhwar Ambulances 2 2 out of order EDO Heath, Badin 2012
4.2.2 List of NGOs working in Badin SR.# NAME OF NGO FOCAL PERSON ADDRESS
1 Laar Humanitarian and Development organization( LHDP)
Mr. Iqbal Haider Fida Hussain Somroo, National Manager
Main Kadhan Road Badin, e-mail: [email protected] Fida. 0333-2527893
2 Badin Development & Research Organization Badin. (BDRO)
Mr. Muhammad Khan Somroo Near new Seerani bus stop, Seerani Road Badin (0277-861429)/03332524272 Email: [email protected]
3 Badin Rural Development Society (BRDS) Badin
Mr. Dr. Akash Ansari Near Badin X-ray, Badin (0297- 861683) Email: [email protected]
4 Laar Development Association (LDA) Badin
Mr. Ghulam Hussaian Mallah Near Shahnawaz Chowk Ali Medical Centre Street Karachi Road Bad (0297-862318)/03323884284 Email: [email protected]
5 Society for Science, Education and Research (SSER) Badin
Mr. Khadim Talpur Shah Latif Public School , Seerani Road Badin (0297-862303) Email: [email protected]
6 Young Sheedi Welfare Organization Badin
Mr. Allah Bachayo Abid Town Badin Ph. 0297 861792, email. [email protected]
7 Village Development Association Village Moosa Soomro, Badin
Mr. M. Suleman Soomro
C/o Sagar Tailor Near Mohammadi Petroleum Services Badin Cell no. 0333 2522952
8 Sukh Des Development Society Talhar
Mr. Anwar Panjwani PO Talhar District Badin (0227- 730126)
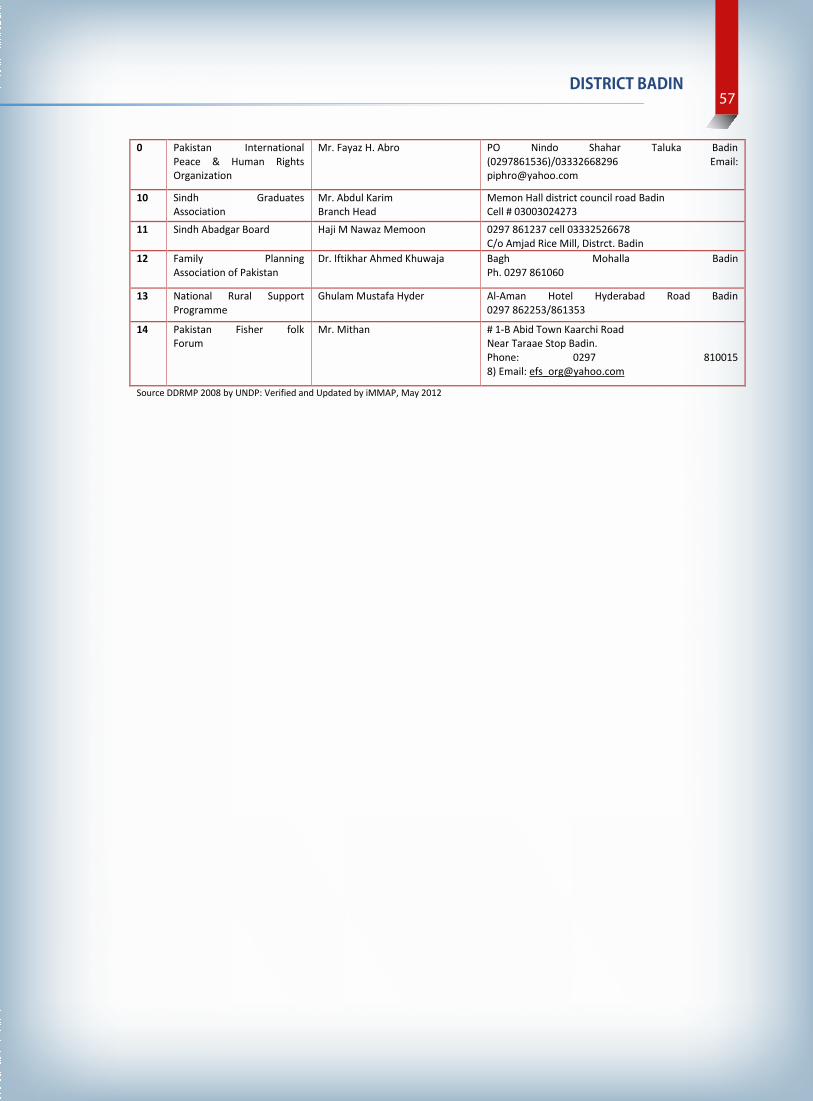
57DISTRICT BADIN
0 Pakistan International Peace & Human Rights Organization
Mr. Fayaz H. Abro PO Nindo Shahar Taluka Badin (0297861536)/03332668296 Email: [email protected]
10 Sindh Graduates Association
Mr. Abdul Karim Branch Head
Memon Hall district council road Badin Cell # 03003024273
11 Sindh Abadgar Board Haji M Nawaz Memoon 0297 861237 cell 03332526678 C/o Amjad Rice Mill, Distrct. Badin
12 Family Planning Association of Pakistan
Dr. Iftikhar Ahmed Khuwaja Bagh Mohalla Badin Ph. 0297 861060
13 National Rural Support Programme
Ghulam Mustafa Hyder Al-Aman Hotel Hyderabad Road Badin 0297 862253/861353
14 Pakistan Fisher folk Forum
Mr. Mithan # 1-B Abid Town Kaarchi Road Near Taraae Stop Badin. Phone: 0297 810015 8) Email: [email protected]
Source DDRMP 2008 by UNDP: Verified and Updated by iMMAP, May 2012

COORDINATION AND SUPPORT SERVICES ANNEXURES58
4.2.3 List of Departmental Focal Points For Emergency Response SR.# NAME OR ORGANIZATIONS OFFICE CONTACT SR.# NAME OR ORGANIZATIONS OFFICE CONTACT 1 Army Cantonment Badin 0297 861200/861201 22 XEN Highways Badin 0297 861410 2 District Nazim Badin 0297 862081/862108 23 DO Roads & Transport 0297 861840 3 DCO Badin 0297 861001 24 DO CDD Badin 0297 861232 4 DPO Badin 0297 861667/861324 25 D. Controller C. Defence 0297 861996 5 EDO Revenue 0297 861744 26 DDO Revenue Badin 0297 861358 6 EDO Education 0297 861183/861784 27 DDO Revenue SF Rahoo 0297 853197 7 EDO Works & Services 0297 862283 28 DDO Revenue Matli 0297 8740255 8 SE Irrigation 0297 861259 29 DDO Revenue T. Bago 0297 854037 9 EDO Agriculture 0297 861623 30 Mukhtiarkar (R) Badin 0297 861245 10 Taluka Nazim 0297 862165 31 Mukhtiarkar (R) Talhar 0297 8730280 11 Taluka TMA Talhar 0297 8730230 32 Mukhtiarkar (R) SF Rahoo 0297 853053 12 Taluka TMA Matli 0297 8740760 33 Mukhtiarkar (R) Matli 0297 8740205 13 Taluka TMA Tando Bago 0297 854120 34 Mukhtiarkar (R) T. Bago 0297 854037 14 Taluka Nazim FS Rahoo 0297 853018 35 A. Engineer Drainage 0297 861422 15 SDO HESCO Badin 0297 861972 36 PMD Badin 0297 861125 16 Civil Surgeon Badin 0297 8619081/862479 37 District Zakat Officer 0297 861322 17 Deputy Manager SSGC 0297 862241 38 XEN Irrigation 0297 861422 18 SDO Telephones 0297 861266/861111 39 XEN LBOD 0297 861422 19 Fire Brigade Badin 116 40 Director Left Bank Canal
Area Water Board 0344 3595929/0297 861259
20 Emergency Police Badin 15 41 Executive District Officer (F&P)
0297 861048
21 Edhi Centre Badin 115 Source DDRMP 2008 by UNDP: Verified and Updated by iMMAP, May 2012
4.2.4 List of Control Rooms used in Emergency SR.# FOCAL POINTS FOR EMERGENCY COTACT NO 1 Control Room Relief Commissioner Sindh 022 9200573
2 Army Cantonment Badin 0297 861200-861201 3 District Government Control Room 0297 862384 4 Met Office Islamabad 051 9250363-4 5 District Police Control Room 0297 861244 6 Navy Maritime Centre Karachi (Met Office) 021 4671300-4671302
7 Taluka Control Room Badin 0297 81245 8 Taluka Control Room SF Rahu 0297 853053 9 Taluka Control Room Tando Bago 0297 854037 10 Taluka Control Room Talhar 0297 830280 11 Taluka Control Room Matli 0297 840205 Source DDRMP 2008 by UNDP: Verified and Updated by iMMAP, May 2012
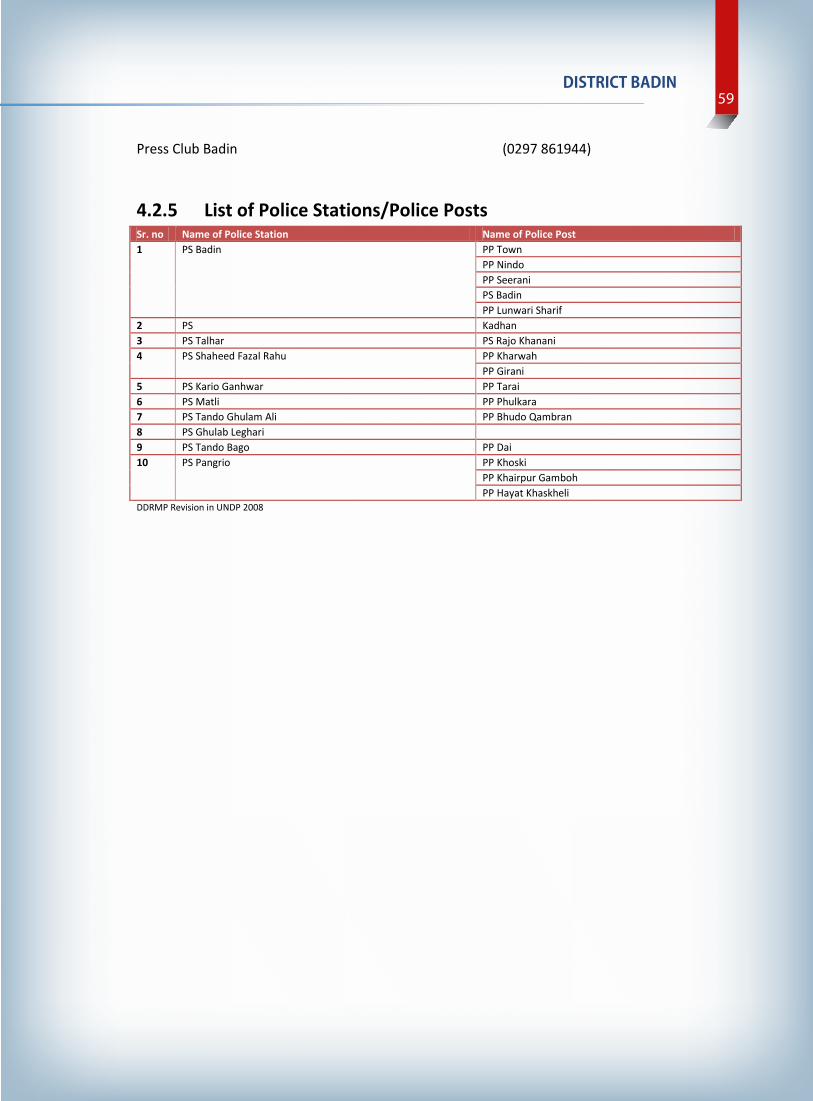
59DISTRICT BADIN
Press Club Badin (0297 861944)
4.2.5 List of Police Stations/Police Posts Sr. no Name of Police Station Name of Police Post 1 PS Badin PP Town
PP Nindo PP Seerani PS Badin PP Lunwari Sharif
2 PS Kadhan 3 PS Talhar PS Rajo Khanani 4 PS Shaheed Fazal Rahu PP Kharwah
PP Girani 5 PS Kario Ganhwar PP Tarai 6 PS Matli PP Phulkara 7 PS Tando Ghulam Ali PP Bhudo Qambran 8 PS Ghulab Leghari 9 PS Tando Bago PP Dai 10 PS Pangrio PP Khoski
PP Khairpur Gamboh PP Hayat Khaskheli
DDRMP Revision in UNDP 2008

COORDINATION AND SUPPORT SERVICES ANNEXURES60
4.
3 A
nnex
ure
3: L
ist
of R
oad
Net
wor
k by
Nat
iona
l Hig
hway
Aut
hori
ty
4.3.
1 Li
st o
f Roa
d N
etw
orks
Ava
ilabl
e in
Bad
in D
istr
ict
S. N
O:
RO
AD
ID
NA
ME
OF
SCH
EME
WIT
H L
ENG
TH
SEC:
NA
ME
RD
-CL
LEN
GTH
(K
M)
WID
TH
NO
: O
F B
RID
GE
NO
: O
F LA
NES
1
2 4
5 6
7 8
9 10
01
Road
Hyd
erab
ad-B
adin
M
ali,
Talh
ar, B
adin
70
A1
63.3
5 7.
30/
5.47
10
Si
ngle
02
Road
Bad
in-K
hosk
i-Wan
go
Nin
do,
Khos
ki
Shad
i La
rge,
W
ango
70
A1
44.2
5 7.
30/5
.47
13
Sing
le
03
Ro
ad B
adin
-Kad
han
to A
li Bu
nder
Lu
nwar
i, Ka
dhan
Ra
heem
Ke
Ba
zar
70 A
1 44
.25
5.47
07
Si
ngle
04
Ro
ad B
adin
-Tan
do B
ago
Von
ai, T
ando
Bag
o 70
A1
18.0
0 7.
30
04
Sing
le
05
Ro
ad T
ando
Bag
o-Jh
udo
road
Sa
ngi P
haro
, Jhu
do
70 A
1 40
.00
4.87
09
Si
ngle
06
Road
Mat
li Ta
ndo
Ghu
lam
Ali
Dum
balo
M
atli,
Haj
i saw
an,
Thar
i T.
G.
Ali,
D
umba
lo
70 A
1 37
.40
7.30
/5.4
7 06
Si
ngle
07
Ro
ad C
ham
bar-
T.G
.Ali
T.G
.Ali,
Gul
ab L
egha
r Ch
amba
r 70
A1
24.1
5 5.
47
02
Sing
le
08
Ro
ad M
atli-
Phul
kara
Sha
ikh
Bhi
rkio
M
atli,
Sh
aikh
Bh
irki
o G
ulab
Le
ghar
i 70
A1
20.0
0 7.
30/5
.47/
3.65
04
Si
ngle
09
Ro
ad
Mat
aro
Hot
al-K
ario
G
anw
ar
Khor
wah
to
Bath
oro
Mat
aro
Hot
el,
Kari
o G
anhw
ar,
Khor
wah
, 70
A1
55.3
0 7.
30/5
.47/
3.65
16
Si
ngle
10
Ro
ad
of
Talh
ar-R
ajo
Khan
ani
to
Haj
i Sa
wan
Ta
lhar
, Raj
o Kh
anan
i Haj
i Saw
an
70 A
1 24
.55
5.47
05
Si
ngle
11
Ro
ad B
adin
-See
rani
to
Bhug
ra M
emon
Ba
din,
See
arni
, bhu
gra
Mem
on
70 A
1 32
.20
5.47
/3.6
5 03
Si
ngle
12
Road
Gol
arch
i-Ahm
ed R
ajo
G
olar
chi,
Ahm
ed R
ajo
70 A
1 28
.98
5.47
/3.6
5 02
Si
ngle
13
Road
Tan
do B
ago
– D
ehi -
Dig
ri
Tand
o Ba
go,
Khad
haro
D
ehi,
Dig
ri
70 A
1 25
.76
5.47
10
Si
ngle
14
Ro
ad fr
om K
ario
Gan
hwar
to
Gol
arch
i Ra
hoki
, Kar
io G
anw
ar G
olar
chi
70 A
1 19
.32
5.47
05
Si
ngle
15
Road
Low
ari t
o N
indo
roa
d Lo
war
i, N
indo
70
A1
17.3
0 3.
65
03
Sing
le
16
Ro
ad K
adha
n –S
eera
ni
Kadh
an –
Seer
ani
70 A
1 19
.32
5.47
/3.6
5 03
Si
ngle
17
Road
from
Dum
balo
to
Budh
o Ka
mbr
ani
Dum
balo
, Bu
dho
Kam
bran
i Ch
utto
Mad
rani
70
A1
14.5
0 5.
47/3
.65
02
Sing
le
18
Ro
ad P
atta
n Pa
rhiy
ar-A
hmed
Raj
o Pa
ttan
Pa
rhiy
ar,
Ham
id
Man
dhar
o, A
hmed
Raj
o 70
A1
33.7
9 3.
65
03
Sing
le
19
Ro
ad S
eera
ni-A
hmed
Raj
o Se
eran
i-Ahm
ed R
ajo
70 A
1 24
.00
3.65
05
Si
ngle
20
Road
Tal
har-
Tan
do B
ago-
Pang
rio-
Jhud
o Ta
lhar
- Ta
ndo
Bago
Pa
ngri
o-70
A1
70.4
0 7.
30/5
.47
15
Sing
le

61DISTRICT BADIN
S.
NO
: R
OA
D ID
N
AM
E O
F SC
HEM
E W
ITH
LEN
GTH
SE
C: N
AM
E R
D-C
L LE
NG
TH
(KM
) W
IDTH
N
O:
OF
BR
IDG
E N
O:
OF
LAN
ES
Jhud
o 21
Road
Sae
ed P
ur-K
hada
ro
Saee
d Pu
r-Kh
adar
o 70
A1
17.0
0 3.
65
04
Sing
le
22
Ro
ad K
adha
n-N
indo
Ka
dhan
-Nin
do
70 A
1 14
.50
5.47
/3.6
5 04
Si
ngle
23
Road
Kho
ski-K
halif
o Q
asim
Kh
oski
-Kha
lifo
Qas
im
70 A
1 12
.88
5.47
/3.6
5 02
Si
ngle
24
Road
Tan
do B
ago-
Nin
do
Tand
o Ba
go-N
indo
70
A1
15.3
0 5.
47/3
.65
03
Sing
le
25
Ro
ad P
angr
io-W
ango
Pa
ngri
o, B
alou
ch C
hack
, Wan
go
70 A
1 16
.00
4.87
02
Si
ngle
26
Road
Bad
in-S
ujaw
al
Badi
n, G
olar
chi,
Khor
wah
Cho
k,
Suja
wal
70
A1
77.0
0 7.
30
14
Sing
le
27
Ro
ad D
ehi t
o Ta
ndo
Jan
Muh
amm
ad
Deh
i, 57
M
ori,
Tand
o Ja
n M
uham
mad
70
A1
29.0
0 3.
70
Si
ngle
28
Ro
ad
Patt
an
Parh
yar-
Ahm
ed
Raj
o to
V
illag
e H
amid
Man
dhar
o
Badi
n-Se
eran
i Ahm
ed R
ajo
70 A
1 2.
81
3.65
05
Si
ngle
29
Ro
ad
from
Ta
ndo
Bago
to
Kh
airp
ur
Gam
bo v
ia O
liya
Khan
Sha
h Ta
ndo
Bago
, Kh
airp
ur
Gam
bo
Oliy
a Kh
an S
hah
70 A
1 30
.59
3.65
07
Si
ngle
30
Ro
ad M
atli-
Tand
o G
hula
m A
li R
oad
to
Vill
age
Ali
Akb
er N
izam
ani v
ia T
hari
A
li A
kber
Niz
aman
i,Tha
ri
70 A
1 12
.07
5.47
/3.6
5 03
Si
ngle
31
Ro
ad
from
D
igri
to
Ra
jo
Khan
ai
via
Budh
o Ka
mbr
ani D
eh-1
70
Dig
ri
to
Rajo
Kh
anai
,Bud
ho
Kam
bran
i 70
A1
33.0
0 3.
65
05
Sing
le
32
Ro
ad
Khal
ifo
Qas
im
to
Tand
o Ba
go-
Jhud
o Kh
alifo
Qas
im,
Noo
rKer
io,
Dat
o ju
nejo
70
A1
19.2
0 3.
65
05
Sing
le
33
Ro
ad f
rom
Haj
i Sa
wan
to
Rajo
Kha
nani
Li
nk r
oad
Dar
gah
Muk
htia
r Sh
ah B
acha
l Lu
nd
Dar
gah
Muk
htia
r Sh
ah,B
acha
l Lu
nd
70 A
1 1.
00
3.65
-
Sing
le
34
Ro
ad
from
Ba
ran
Mor
i Re
gula
tor
to
Mir
ani
Mor
i vi
a M
oham
mad
H
assa
n Le
ghar
i vill
age
Mir
ani
Mor
i, M
oham
mad
H
assa
n Le
ghar
i 70
A1
2.00
3.
65
- Si
ngle
35
Ro
ad fr
om M
anik
Leg
hari
insi
de v
illag
e M
anik
Leg
hari
70
A1
0.50
3.
65
- Si
ngle
36
Road
fro
m G
ulab
Leg
hari
Sab
an D
asti
ro
ad li
nk t
o Sa
in B
ux R
ind
Gul
ab L
egha
ri S
aban
Das
ti,
Sain
Bu
x Ri
nd
70 A
1 0.
50
3.65
-
Sing
le
37
Ro
ad f
rom
Gul
ab L
egha
ri S
aban
Das
ti
road
link
to
Haj
i Pir
u Ri
nd
Gul
ab L
egha
ri S
aban
Das
ti,
Haj
i Pi
ru R
ind
70 A
1 0.
50
3.65
-
Sing
le
38
Ro
ad f
rom
Tan
do J
an M
oham
mad
to
Dei
ro
ad
Sim
N
ali
from
vi
llage
M
oham
mad
Ali
Kake
pota
Moh
amm
ad A
li Ka
kepo
ta
70 A
1 1.
00
3.65
-
Sing
le
39
Ro
ad f
rom
Iqb
al M
emon
Ota
que
villa
ge
to G
hula
m H
sass
ain
Tehb
o G
hula
m H
sass
ain
Tehb
o
70 A
1 1.
00
3.65
-
Sing
le
40
Ro
ad
from
D
igri
D
ei
road
to
V
illag
e Ch
anes
ar K
aloi
via
pat
asho
Dal
wan
i to
Ch
anes
ar K
aloi
,Pat
asho
Dal
wan
i 70
A1
1.00
3.
65
- Si
ngle
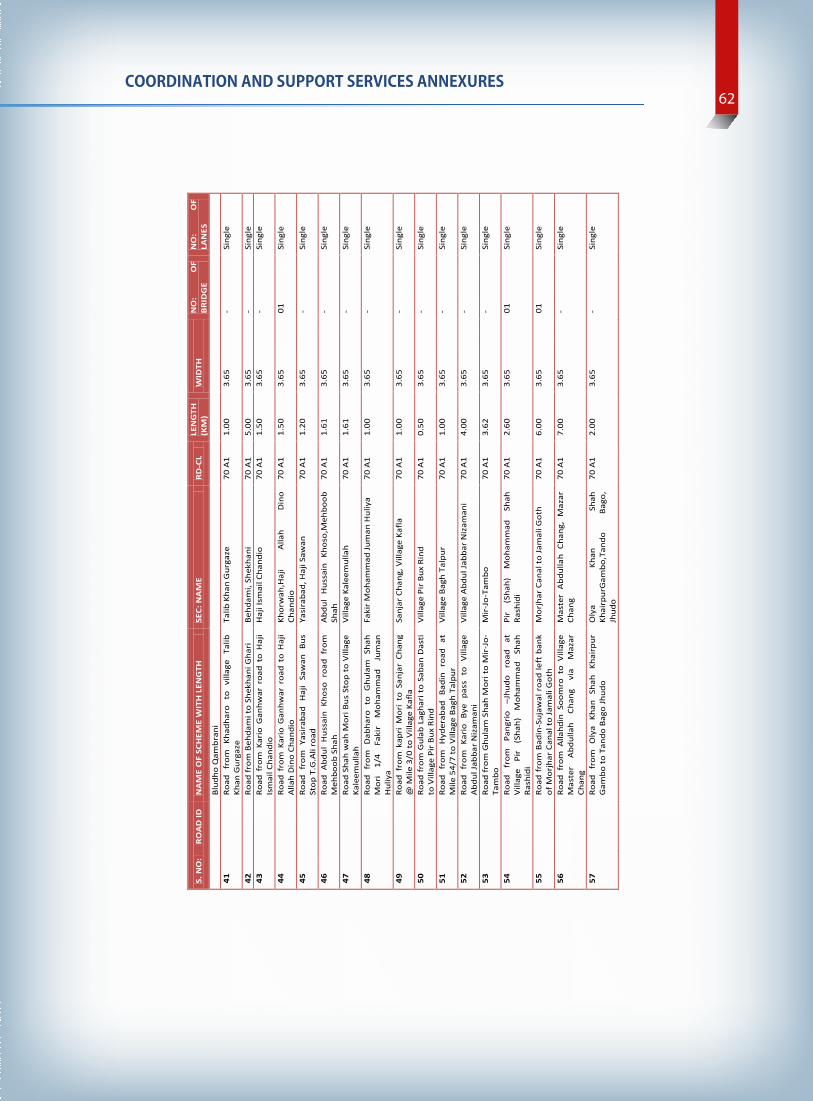
COORDINATION AND SUPPORT SERVICES ANNEXURES62
S.
NO
: R
OA
D ID
N
AM
E O
F SC
HEM
E W
ITH
LEN
GTH
SE
C: N
AM
E R
D-C
L LE
NG
TH
(KM
) W
IDTH
N
O:
OF
BR
IDG
E N
O:
OF
LAN
ES
Blud
ho Q
ambr
ani
41
Ro
ad
from
Kh
adha
ro
to
villa
ge
Talib
Kh
an G
urga
ze
Talib
Kha
n G
urga
ze
70 A
1 1.
00
3.65
-
Sing
le
42
Ro
ad fr
om B
ehda
mi t
o Sh
ekha
ni G
hari
Be
hdam
i, Sh
ekha
ni
70 A
1 5.
00
3.65
-
Sing
le
43
Ro
ad f
rom
Kar
io G
anhw
ar r
oad
to H
aji
Ism
ail C
hand
io
Haj
i Ism
ail C
hand
io
70 A
1 1.
50
3.65
-
Sing
le
44
Ro
ad f
rom
Kar
io G
anhw
ar r
oad
to H
aji
Alla
h D
ino
Chan
dio
Khor
wah
,Haj
i A
llah
Din
o Ch
andi
o 70
A1
1.50
3.
65
01
Sing
le
45
Ro
ad f
rom
Yas
irab
ad H
aji
Saw
an B
us
Stop
T.G
.Ali
road
Ya
sira
bad,
Haj
i Saw
an
70 A
1 1.
20
3.65
-
Sing
le
46
Ro
ad A
bdul
Hus
sain
Kho
so r
oad
from
M
ehbo
ob S
hah
Abd
ul
Hus
sain
Kh
oso,
Meh
boob
Sh
ah
70 A
1 1.
61
3.65
-
Sing
le
47
Ro
ad S
hah
wah
Mor
i Bus
Sto
p to
Vill
age
Kale
emul
lah
Vill
age
Kale
emul
lah
70 A
1 1.
61
3.65
-
Sing
le
48
Ro
ad
from
D
abha
ro
to
Ghu
lam
Sh
ah
Mor
i 1/
4 Fa
kir
Moh
amm
ad
Jum
an
Hul
iya
Faki
r M
oham
mad
Jum
an H
uliy
a 70
A1
1.00
3.
65
- Si
ngle
49
Ro
ad f
rom
kap
ri M
ori
to S
anja
r Ch
ang
@ M
ile 3
/0 t
o V
illag
e Ka
fla
Sanj
ar C
hang
, Vill
age
Kafla
70
A1
1.00
3.
65
- Si
ngle
50
Ro
ad f
rom
Gul
ab L
agha
ri t
o Sa
ban
Das
ti
to V
illag
e Pi
r Bu
x Ri
nd
Vill
age
Pir
Bux
Rind
70
A1
0.50
3.
65
- Si
ngle
51
Ro
ad
from
H
yder
abad
Ba
din
road
at
M
ile 5
4/7
to V
illag
e Ba
gh T
alpu
r V
illag
e Ba
gh T
alpu
r 70
A1
1.00
3.
65
- Si
ngle
52
Ro
ad
from
Ka
rio
Bye
pass
to
V
illag
e A
bdul
Jabb
ar N
izam
ani
Vill
age
Abd
ul Ja
bbar
Niz
aman
i 70
A1
4.00
3.
65
- Si
ngle
53
Ro
ad fr
om G
hula
m S
hah
Mor
i to
Mir
-Jo-
Tam
bo
Mir
-Jo-
Tam
bo
70 A
1 3.
62
3.65
-
Sing
le
54
Ro
ad
from
Pa
ngri
o –J
hudo
ro
ad
at
Vill
age
Pir
(Sha
h)
Moh
amm
ad
Shah
Ra
shid
i
Pir
(Sha
h)
Moh
amm
ad
Shah
Ra
shid
i 70
A1
2.60
3.
65
01
Sing
le
55
Ro
ad f
rom
Bad
in-S
ujaw
al r
oad
left
ban
k of
Mor
jhar
Can
al t
o Ja
mal
i Got
h M
orjh
ar C
anal
to
Jam
ali G
oth
70 A
1 6.
00
3.65
01
Si
ngle
56
Ro
ad f
rom
Alla
hdin
Soo
mro
to
Vill
age
Mas
ter
Abd
ulla
h Ch
ang
via
Maz
ar
Chan
g
Mas
ter
Abd
ulla
h Ch
ang,
Maz
ar
Chan
g 70
A1
7.00
3.
65
- Si
ngle
57
Ro
ad
from
O
lya
Khan
Sh
ah
Khai
rpur
G
ambo
to
Tand
o Ba
go Jh
udo
Oly
a Kh
an
Shah
Kh
airp
urG
ambo
,Tan
do
Bago
, Jh
udo
70 A
1 2.
00
3.65
-
Sing
le
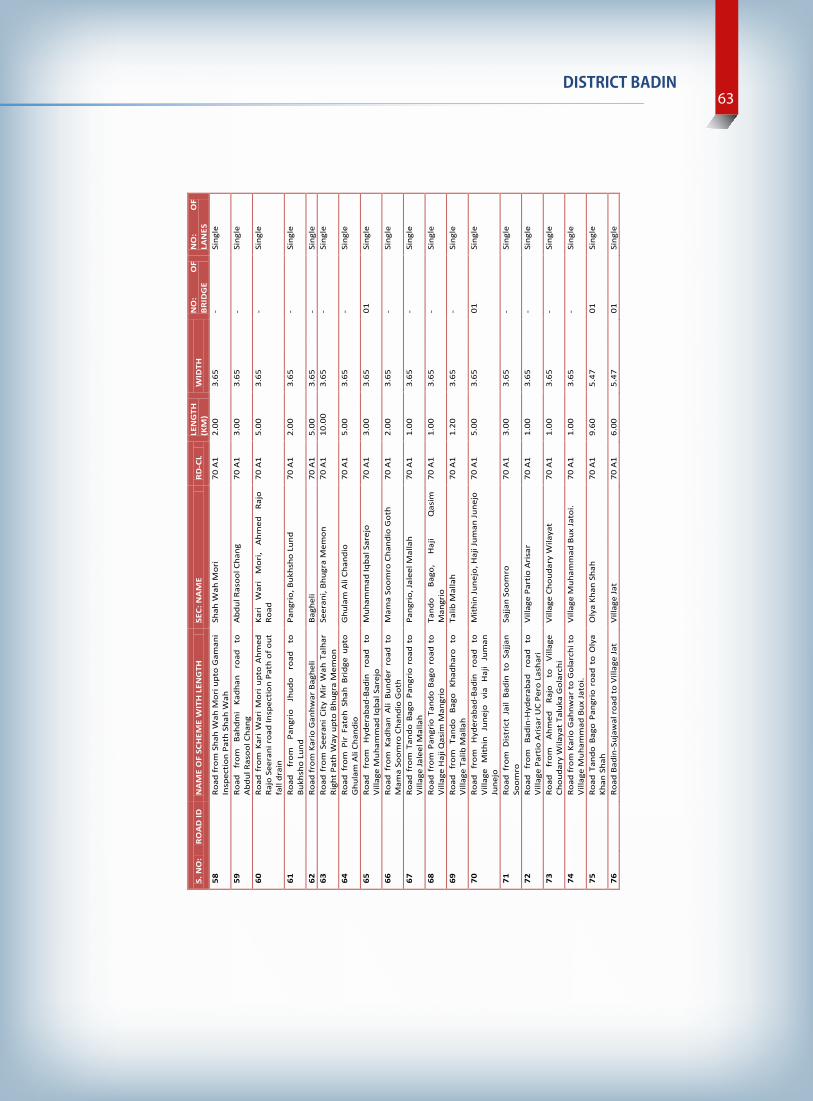
63DISTRICT BADIN
S.
NO
: R
OA
D ID
N
AM
E O
F SC
HEM
E W
ITH
LEN
GTH
SE
C: N
AM
E R
D-C
L LE
NG
TH
(KM
) W
IDTH
N
O:
OF
BR
IDG
E N
O:
OF
LAN
ES
58
Ro
ad fr
om S
hah
Wah
Mor
i upt
o G
aman
i In
spec
tion
Pat
h Sh
ah W
ah
Shah
Wah
Mor
i 70
A1
2.00
3.
65
- Si
ngle
59
Ro
ad
from
Ba
hdm
i Ka
dhan
ro
ad
to
Abd
ul R
asoo
l Cha
ng
Abd
ul R
asoo
l Cha
ng
70 A
1 3.
00
3.65
-
Sing
le
60
Ro
ad f
rom
Kar
i W
ari
Mor
i up
to A
hmed
Ra
jo S
eera
ni r
oad
Insp
ecti
on P
ath
of o
ut
fall
drai
n
Kari
W
ari
Mor
i, A
hmed
Ra
jo
Road
70
A1
5.00
3.
65
- Si
ngle
61
Ro
ad
from
Pa
ngri
o Jh
udo
road
to
Bu
khsh
o Lu
nd
Pang
rio,
Buk
hsho
Lun
d 70
A1
2.00
3.
65
- Si
ngle
62
Ro
ad fr
om K
ario
Gan
hwar
Bag
heli
Bagh
eli
70 A
1 5.
00
3.65
-
Sing
le
63
Ro
ad f
rom
See
rani
Cit
y M
ir W
ah T
alha
r Ri
ght
Path
Way
upt
o Bh
ugra
Mem
on
Seer
ani,
Bhug
ra M
emon
70
A1
10.0
0 3.
65
- Si
ngle
64
Ro
ad f
rom
Pir
Fat
eh S
hah
Brid
ge u
pto
Ghu
lam
Ali
Chan
dio
Ghu
lam
Ali
Chan
dio
70 A
1 5.
00
3.65
-
Sing
le
65
Ro
ad
from
H
yder
abad
-Bad
in
road
to
V
illag
e M
uham
mad
Iqba
l Sar
ejo
M
uham
mad
Iqba
l Sar
ejo
70 A
1 3.
00
3.65
01
Si
ngle
66
Ro
ad f
rom
Kad
han
Ali
Bund
er r
oad
to
Mam
a So
omro
Cha
ndio
Got
h M
ama
Soom
ro C
hand
io G
oth
70 A
1 2.
00
3.65
-
Sing
le
67
Ro
ad f
rom
Tan
do B
ago
Pang
rio
road
to
Vill
age
Jale
el M
alla
h Pa
ngri
o, Ja
leel
Mal
lah
70 A
1 1.
00
3.65
-
Sing
le
68
Ro
ad f
rom
Pan
grio
Tan
do B
ago
road
to
Vill
age
Haj
i Qas
im M
angr
io
Tand
o Ba
go,
Haj
i
Qas
im
Man
grio
70
A1
1.00
3.
65
- Si
ngle
69
Ro
ad
from
Ta
ndo
Bago
Kh
adha
ro
to
Vill
age
Talib
Mal
lah
Talib
Mal
lah
70 A
1 1.
20
3.65
-
Sing
le
70
Ro
ad
from
H
yder
abad
-Bad
in
road
to
V
illag
e M
ithi
n Ju
nejo
vi
a H
aji
Jum
an
June
jo
Mit
hin
June
jo, H
aji J
uman
June
jo
70 A
1 5.
00
3.65
01
Si
ngle
71
Ro
ad f
rom
Dis
tric
t Ja
il Ba
din
to S
ajja
n So
omro
Sa
jjan
Soom
ro
70 A
1 3.
00
3.65
-
Sing
le
72
Ro
ad
from
Ba
din-
Hyd
erab
ad
road
to
V
illag
e Pa
rtio
Ari
sar
UC
Pero
Las
hari
V
illag
e Pa
rtio
Ari
sar
70 A
1 1.
00
3.65
-
Sing
le
73
Ro
ad
from
A
hmed
Ra
jo
to
Vill
age
Chou
dary
Wila
yat
Talu
ka G
olar
chi
Vill
age
Chou
dary
Wila
yat
70 A
1 1.
00
3.65
-
Sing
le
74
Ro
ad fr
om K
ario
Gah
nwar
to
Gol
arch
i to
Vill
age
Muh
amm
ad B
ux Ja
toi.
Vill
age
Muh
amm
ad B
ux Ja
toi.
70 A
1 1.
00
3.65
-
Sing
le
75
Ro
ad T
ando
Bag
o Pa
ngri
o ro
ad t
o O
lya
Khan
Sha
h O
lya
Khan
Sha
h 70
A1
9.60
5.
47
01
Sing
le
76
Ro
ad B
adin
-Suj
awal
roa
d to
Vill
age
Jat
Vill
age
Jat
70 A
1 6.
00
5.47
01
Si
ngle
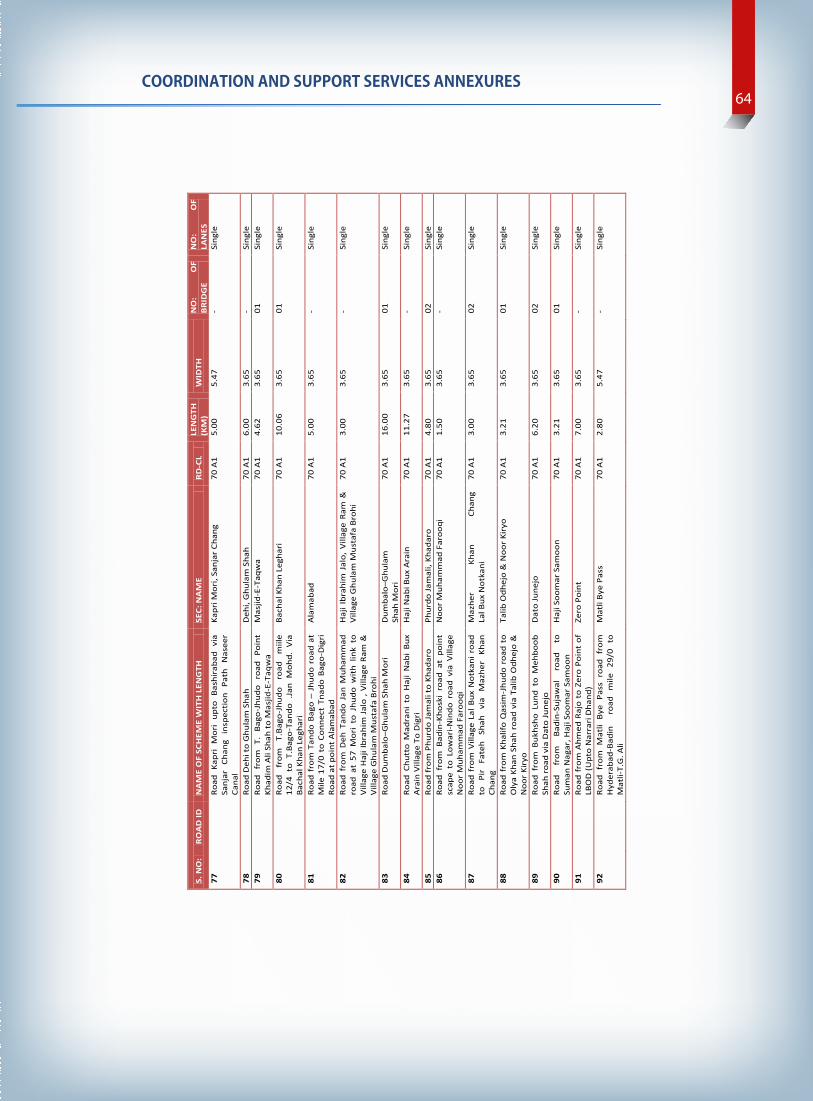
COORDINATION AND SUPPORT SERVICES ANNEXURES64
S.
NO
: R
OA
D ID
N
AM
E O
F SC
HEM
E W
ITH
LEN
GTH
SE
C: N
AM
E R
D-C
L LE
NG
TH
(KM
) W
IDTH
N
O:
OF
BR
IDG
E N
O:
OF
LAN
ES
77
Ro
ad K
apri
Mor
i up
to B
ashi
raba
d vi
a Sa
njar
Ch
ang
insp
ecti
on
Path
N
asee
r Ca
nal
Kapr
i Mor
i, Sa
njar
Cha
ng
70 A
1 5.
00
5.47
-
Sing
le
78
Ro
ad D
ehi t
o G
hula
m S
hah
Deh
i, G
hula
m S
hah
70 A
1 6.
00
3.65
-
Sing
le
79
Ro
ad
from
T.
Ba
go-J
hudo
ro
ad
Poin
t Kh
adim
Ali
Shah
to
Mas
jid-E
-Taq
wa
Mas
jid-E
-Taq
wa
70 A
1 4.
62
3.65
01
Si
ngle
80
Ro
ad
from
T.
Bago
-Jhu
do
road
m
iile
12/4
to
T.Ba
go-T
ando
.Ja
n M
ohd.
Via
Ba
chal
Kha
n Le
ghar
i
Bach
al K
han
Legh
ari
70 A
1 10
.06
3.65
01
Si
ngle
81
Ro
ad f
rom
Tan
do B
ago
– Jh
udo
road
at
Mile
17/
0 to
Con
nect
Tna
do B
ago
-Dig
ri
Road
at
poin
t A
lam
abad
Ala
mab
ad
70 A
1 5.
00
3.65
-
Sing
le
82
Ro
ad f
rom
Deh
Tan
do J
an M
uham
mad
ro
ad a
t 57
Mor
i to
Jhu
do w
ith
link
to
Vill
age
Haj
i Ibr
ahim
Jal
o , V
illag
e Ra
m &
V
illag
e G
hula
m M
usta
fa B
rohi
Haj
i Ib
rahi
m J
alo,
Vill
age
Ram
&
Vill
age
Ghu
lam
Mus
tafa
Bro
hi
70 A
1 3.
00
3.65
-
Sing
le
83
Ro
ad D
umba
lo–G
hula
m S
hah
Mor
i D
umba
lo–G
hula
m
Shah
Mor
i 70
A1
16.0
0 3.
65
01
Sing
le
84
Ro
ad C
hutt
o M
adra
ni t
o H
aji
Nab
i Bu
x A
rain
Vill
age
To D
igri
H
aji N
abi B
ux A
rain
70
A1
11.2
7 3.
65
- Si
ngle
85
Ro
ad fr
om P
hurd
o Ja
mal
i to
Khad
aro
Phur
do Ja
mal
i, Kh
adar
o
70 A
1 4.
80
3.65
02
Si
ngle
86
Road
fro
m B
adin
-Kho
ski
road
at
poin
t sc
ape
to L
owar
i-Nin
do r
oad
via
Vill
age
Noo
r M
uham
mad
Far
ooqi
Noo
r M
uham
mad
Far
ooqi
70
A1
1.50
3.
65
- Si
ngle
87
Ro
ad f
rom
Vill
age
Lal B
ux N
otka
ni r
oad
to
Pir
Fate
h Sh
ah
via
Maz
her
Khan
Ch
ang
Maz
her
Khan
Ch
ang
Lal B
ux N
otka
ni
70 A
1 3.
00
3.65
02
Si
ngle
88
Ro
ad f
rom
Kha
lifo
Qas
im-J
hudo
roa
d to
O
lya
Khan
Sha
h ro
ad v
ia T
alib
Odh
ejo
&
Noo
r Ki
ryo
Talib
Odh
ejo
& N
oor
Kiry
o 70
A1
3.21
3.
65
01
Sing
le
89
Ro
ad f
rom
Buk
hsho
Lun
d to
Meh
boob
Sh
ah r
oad
via
Dat
o Ju
nejo
D
ato
June
jo
70 A
1 6.
20
3.65
02
Si
ngle
90
Ro
ad
from
Ba
din-
Suja
wal
ro
ad
to
Sum
an N
agar
, Haj
i Soo
mar
Sam
oon
Haj
i Soo
mar
Sam
oon
70 A
1 3.
21
3.65
01
Si
ngle
91
Ro
ad f
rom
Ahm
ed R
ajo
to Z
ero
Poin
t of
LB
OD
(Upt
o N
arra
ri D
hand
) Ze
ro P
oint
70
A1
7.00
3.
65
- Si
ngle
92
Ro
ad f
rom
Mat
li By
e Pa
ss r
oad
from
H
yder
abad
-Bad
in
ro
ad
mile
29
/0
to
Mat
li-T.
G. A
li
Mat
li By
e Pa
ss
70 A
1 2.
80
5.47
-
Sing
le

65DISTRICT BADIN
S.
NO
: R
OA
D ID
N
AM
E O
F SC
HEM
E W
ITH
LEN
GTH
SE
C: N
AM
E R
D-C
L LE
NG
TH
(KM
) W
IDTH
N
O:
OF
BR
IDG
E N
O:
OF
LAN
ES
93
Ro
ad
from
Ba
louc
h Ch
ack
to B
acho
o Bh
oot
Bach
oo B
hoot
70
A1
3.00
3.
65
- Si
ngle
94
Ro
ad f
rom
Wal
i M
uham
mad
Leg
hari
to
Vill
age
Pehl
wan
Kha
n Le
ghar
i W
ali M
uham
mad
Leg
hari
70
A1
3.21
3.
65
01
Sing
le
95
Ro
ad K
ario
Gan
hwar
Bye
Pas
s Ka
rio
Gan
hwar
Bye
Pas
s 70
A1
1.61
3.
65
01
Sing
le
96
Ro
ad P
angr
io-J
hudo
to
Arb
ab S
ikan
dar
Arb
ab S
ikan
dar
70 A
1 2.
65
3.65
01
Si
ngle
97
Road
Ta
ndo
Bago
-Pan
grio
to
Fa
zal
Ahe
mda
ni
Faza
l Ahe
mda
ni
70 A
1 1.
00
3.65
-
Sing
le
98
Ro
ad R
ashe
ed A
rain
to
Jhud
o vi
a Sa
ngi
Phur
o Ra
shee
d A
rain
70
A1
3.21
3.
65
- Si
ngle
99
Ro
ad K
ario
Gan
hwar
Kho
rwah
Roa
d to
V
illag
e A
li M
uham
mad
Meh
ri
Ali
Muh
amm
ad M
ehri
70
A1
10.0
0 3.
65
- Si
ngle
100
Ro
ad
Rajo
Kh
anan
i H
aji
Saw
an
-na
veed
abad
H
aji S
awan
, Nav
eeda
bad
70 A
1 1.
00
3.65
-
Sing
le
101
Ro
ad D
umba
lo–G
hula
m S
hah
Mor
i to
Kh
amis
o Ja
lala
ni
Kham
iso
Jala
lani
70
A1
2.00
3.
65
- Si
ngle
102
Ro
ad
Dum
balo
-B
udho
Ka
mbr
ani
to
Am
ir-u
l-din
Ara
in
Am
ir-u
l-din
Ara
in
70 A
1 1.
80
3.65
01
Si
ngle
103
Ro
ad P
ir B
ux N
izam
ani
to A
hmed
Kha
n Ba
gran
i A
hmed
Kha
n Ba
gran
i 70
A1
1.61
3.
65
- Si
ngle
104
Ro
ad
Tand
o G
hula
m
Ali
Saba
n D
asti
Sa
mja
r Ch
ang
Saba
n D
asti
70
A1
1.40
3.
65
- Si
ngle
105
Ro
ad G
ulab
Leg
hari
to
Naw
ab H
assa
n A
li Ta
lpur
Naw
ab-J
o-Ta
mbo
alo
ng B
ank
of M
urad
Wah
Naw
ab-J
o-Ta
mbo
70
A1
5.00
3.
65
01
Sing
le
106
Ro
ad
Budh
o ka
mbr
ani
to
Mir
M
uham
mad
Unn
er
Mir
Muh
amm
ad U
nner
70
A1
6.00
3.
65
- Si
ngle
Sour
ce: N
atio
nal H
ighw
ay A
utho
rity
May
201
2