Pakenham East Interchange Comparative Traffic Modelling ... · Pakenham East Interchange...
44
Pakenham East Interchange Comparative Traffic Modelling Assessment Report Impact of New Interchange
-
Upload
hoangduong -
Category
Documents
-
view
220 -
download
0
Transcript of Pakenham East Interchange Comparative Traffic Modelling ... · Pakenham East Interchange...

Pakenham East Interchange Comparative Traffic Modelling Assessment
Report
Impact of New Interchange

Pakenham East Interchange Comparative Assessment
SMEC Australia | Page i
EXECUTIVE SUMMARY The Cardinia Shire Council seeks to investigate possible future options for improving the connectivity of the arterial road network around Pakenham across the Princes Freeway and the railway corridor to the south of Pakenham using the most up to date traffic and transport modeling tools.
Currently, a new interchange on the Princes Freeway is being proposed about midway between the Koo Wee Rup Road Interchange and the Princes Highway Interchange (near Nar Nar Goon Road) in the east.
For the purposes of this comparative assessment:
+ Option 1 was defined to INCLUDE the interchange and associated road links.
+ Option 2 did NOT INCLUDE the interchange and immediate road network links. Other relatively minor changes were made to individual road links to reflect more recent planning.
The Victorian Integrated Transport Model (VITM) has been used to compare the highway assignments of these two alternative road networks.
The assessment is limited to a comparison of traffic modelling results only. The results of this analysis have been displayed using a series of maps.
Travel Time and Vehicle Hours Without the proposed interchange (option 2), trips generally spend a longer time on the Princes Highway and other arterial roads. That is, until they are able to join the Princes Freeway. The net result is a small increase in the total vehicle kilometres travelled and in the total travel time on the highway network.
Overall, average travel speeds are reduced by about 3km/hr without the proposed interchange. The interchange impacts primarily on McGregor Road, Racecourse Road, the Princes Highway and Princes Freeway.
Trip Diversion At the extreme east of the modeled area, trips that would normally use the proposed new arterial road connection and the new interchange under option 2 would use the Nar Nar Goon Road Interchange to access or exit the Princes Freeway. This would result in larger traffic volumes on the freeway and the highway east of the proposed interchange.
West of the proposed interchange, volumes on the Princes Freeway would be lower without the interchange as far as the Cardinia Road interchange.
On the Princes Highway west of Dore Road, traffic volumes would be higher without the interchange. Traffic that would have travelled southwards to join the Princes Freeway would now do so at a point further west. Traffic would access the Princes Freeway via Racecourse Road, McGregor Road and Cardinia Road.
Traffic Volumes and Level of Service For option 2:
+ there would be a small decrease in level of service on the Princes Highway due to an increase in traffic volumes;
+ the Princes Freeway west of Cardinia Road would operate satisfactorily and at a better level of service;
+ McGregor Road between Henry Road and The Princes Freeway and Racecourse Road between Bald Hill Road and Princes Freeway would operate at lower level of service;
+ Level of service along short lengths of the Princes Highway at the Nar Nar Goon Road interchange would drop significantly;
+ east of McGregor Road, significant sections of the Princes Highway would operate at lower levels of service.
The forecast daily volumes show that McGregor Road and Racecourse Road will carry higher volumes in Option 2 than in Option 1. For Option 1, McGregor Road will carry about 32,300 vehicles per day, while for option 2 (without the new interchange); it will carry about 36,100 vehicles per day. Daily volumes on racecourse Road for Option 1 will reach around 27,000 vehicles but for Option 2 this would increase to 32,000 vehicles per day. The cause of the increase is the additional trips accessing the Princes Freeway from The Princes Highway.
On both roads, volumes for Option 1 and Option 2 are substantially lower than the 40,000 vehicles per day threshold capacity specified by MPA.
Travel Speeds For option 2: + speeds on the Princes Highway east of Dore Road would
increase; + speeds on the Princes Freeway, between McGregor Road
and the South Gippsland Highway would increase; + speeds on the Princes Highway between Dore Road and
McGregor Road would decrease; + speeds on McGregor Road and Racecourse Road south of
the railway line would decrease;
Conclusion
Examination of the VITM strategic modelling results shows that the provision of the proposed interchange at Pakenham East has relatively minor impact on the arterial road network in the Pakenham area. The Princes Highway, Racecourse Road and McGregor Road all operate within the thresholds for divided arterial roads (option 1).
The results of this exercise show that the interchange has only a localised impact, with the most obvious benefits being limited to the highway network in the immediate vicinity of the proposed interchange. Without the proposed interchange, levels of service, which drop by at least one category and travel speeds would be on average 3km/hour lower.
Under Option 2, however, The Princes Freeway would operate at a higher level of service, ie better, with higher speeds and lower traffic demands east of Cardinia Road. The need for the interchange should therefore be more closely examined to determine whether the benefits would deliver would warrant the cost of its provision, relative to other priorities for the road network in the Pakenham and Cardinia’s Urban Growth Area.

Pakenham East Interchange Comparative Assessment
SMEC Australia | Page ii
TABLE OF CONTENTS
1 INTRODUCTION ............................................ 3
1.1 BACKGROUND .............................................. 3 1.2 PURPOSE .................................................... 3 1.3 LIMITATIONS ................................................ 3
2 METHODOLOGY ........................................... 5
2.1 THE TRANSPORT NETWORK ............................. 5 2.2 THE TRAVEL ZONES ....................................... 5
3 TRAVEL TIME AND VEHICLE HOURS ............. 9
4 TRIP DIVERSION ......................................... 10
4.1 MORNING PEAK PERIOD ................................10 4.2 AFTERNOON PEAK PERIOD .............................10
5 TRAFFIC VOLUMES AND LEVELS OF SERVICE14
5.1 VOLUME/CAPACITY RATIO .............................14 5.2 MORNING PEAK PERIOD ................................15 5.3 AFTERNOON PEAK PERIOD .............................20 5.4 DAILY VOLUMES ON ROADS ...........................25
6 TRAVEL SPEEDS .......................................... 27
6.1 MORNING PEAK PERIOD ................................27 6.2 AFTERNOON PEAK PERIOD .............................27
7 CONCLUSION .............................................. 30
APPENDIX A – LAND USE INPUT COMPARISON: PEICA INPUTS COMPARED TO VITM SOUTH EAST CORRIDOR INPUTS ............................................ 31
APPENDIX B – REVISED 2046 DEMOGRAPHY .... 37

Pakenham East Interchange Comparative Assessment
SMEC Australia | Page 3
1 Introduction
1.1 Background
Currently, options are being developed to service future residential development in the area east of Pakenham. Option 1 proposes an additional interchange on the Princes Freeway interchange, approximately 3.6km east of the Racecourse Road/Koo Wee Rup Road interchange and 3.1km west of the Princes Highway Nar Nar Goon Road. If constructed, the interchange will serve the Pakenham East development and will connect to a yet to be established north-south road corridor (a southward extension of Dore Road) linking up with the Princes Highway in the north.
The location of the proposed interchange is shown in Figure 1.
Option 2 proposes that the development of Pakenham East does not include any new connections to the Princes Freeway.
1.2 Purpose
This document reports on the impact of providing versus not providing an interchange at the proposed location based on the future traffic characteristics of the highway network and the associated lessor road links within the Pakenham and Pakenham East area. The purpose of this report is to document only the findings of VITM modelling of alternative options.
1.3 Limitations
VITM is a strategic transport demand model. The model uses standard algorithms and techniques that are deterministic and rely on assumptions and algorithms that are not behavioural. In particular, the assignment of trips onto highway networks is not constrained to the capacity of individual road links. Traffic volumes and traffic delays on highly congested roads may therefore be overstated.
The report is limited to assessing modelling results only. It does not take into account important factors in the decision making process such as urban design impact, construction costs or implications on the future urban structure of Pakenham East PSP.
Pakenham East Interchange Comparative Assessment
SMEC Australia | Page 4
Figure 1 - Locality Plan
Source: OpenStreetMap
Location of proposed new
interchange
Proposed new road

Pakenham East Interchange Comparative Assessment
SMEC Australia | Page 5
2 Methodology
The Victorian Integrated Transport Model (VITM) has been used to compare the highway assignments of two alternative road networks. For the purposes of this comparative assessment, Option 1 was assumed to INCLUDE the interchange and associated road links. Option 2 did NOT INCLUDE the interchange and immediate road network links. The results of the comparative analysis have been displayed using a series of maps.
Integral to the process of the development of the model and analysis of its results is engagement with VicRoads and the MPA. Input and advice from these agencies form an important part of the development of the model and the resulting analysis.
2.1 The Transport Network
The VITM strategic model includes transport demand forecasts prepared by the Department of Transport at five yearly intervals from 2016 through to 2051. In each case, the transport network that is expected to be in place at that time is represented in the model as road and public transport networks. Because the purpose of this exercise is to look at the impact of changes to the networks when the Pakenham area is fully developed, the study has used the 2046 model year as representative of the ultimate development scenario.
There are several versions of the VITM in circulation at the present time. The version we have used for this project is the South-East Corridor model developed by the MPA for planning and development of the outer growth areas of Melbourne in the south east. This model is a version of the original VITM but with the south-eastern corridor transport network and land use forecasts refined to better represent the growth areas in the south eastern corridor and allow for more detailed planning work. Appendix A presents a comparison of the land use data from the VITM that this study is based on and those used by the MPA for the Casey Clyde sub-region.
For this study, Racecourse Road was assumed to be a 4-lane divided primary arterial with a posted speed limit of 80km/hour as included in the South-East Corridor model.
It is important to note that we have not changed the Base Year (2009) networks or demography, so that the calibration of the model is maintained. To test the impact of the interchange, we created an alternative network for 2046 in which the interchange and connecting roads were removed. The full list of changes made to the network is listed in Table 1.
2.2 The Travel Zones
The travel zones for the original VITM were refined as part of the development of the MPA south corridor version of the VITM and provide a good level of detail for a strategic model. The zones in the study area are shown in Figure 2.
The outline of the original VITM zones are shown, while the individual zone numbers show how many zones they were disaggregated for the South East Corridor model. Boundaries for the new zones were not defined; the primary aim of the new zones was for more precise definition of settlement patterns and loading of trips onto the model network. Each new zone was connected to the network with a separate zone connector or two. For convenience of reporting, the area was divided into regions, which are shown in Figure 3.
The demographic data input for the South East Corridor Model was reviewed by Council in the context of its current long term plans and population growth estimates. A summary of the demographic data for this model is contained in Table 2.
A record of the changes made by Council is provided in Appendix B.

Pakenham East Interchange Comparative Assessment
SMEC Australia | Page 6
Table 1 - Amendments to the South East Corridor Model Road Network
Road Link Description Change From Change To
Peck Road from Thewlis to Brown Local/Collector Secondary
Thewlis Road from Peck to Princes Highway Local/Collector Secondary
Brown Road from Peck to Bayview Road Local/Collector Secondary
Bayview Road from Brown to Princes Highway Local/Collector Secondary
Tivendale Road from Brown to Princes Highway Local/Collector Secondary
New Link from Bayview to Officer South Road Primary Undivided Primary Divided
New Link, Extension of Rix Road from Officer South to McGregor Road
Local/Collector Primary Divided
Webster Way Local/Collector Secondary
Lecky Road from Stephens to Cardinia Road Local/Collector Primary Divided
Ryan Road, Princes Highway to Pakenham Bypass Local/Collector Secondary
Dore Road and its southern extension
Deleted
East west connector Racecourse Road to Ryan Road
Deleted
Interchange at Pakenham East
Deleted
Princes Highway from Starling to Whiteside Road 4-lane 6-lane
Officer Road South from north of Paterson Road 4-lane 6-lane
New Link from Officer Road South to Cardinia Road 2-lane 4-lane
Table 2 - Summary of Demographic Data Inputs
Study Area Region *
Population Households Retail
Employment Total
Employment
Primary School
Enrolments
Secondary School
Enrolments
Pakenham East 18,850 6,500 467 870 900 1,200
Pakenham South
0 0 0 18,400 0 0
Centre East 5,046 1,851 11 374 0 0
Centre North 10,617 4,034 49 1,167 1,761 1,100
Centre South 10,724 3,817 79 1,025 399 0
Centre West 2,314 928 33 897 649 1,100
Far East 13 5 0 85 0 0
North East 192 75 0 49 0 0
South East 145 57 11 409 450 220
Town Centre 5,522 2,356 2,167 4,080 0 0
West 18,202 6,874 634 13,164 1,305 1,652
Total 71,625 26,496 3,450 40,520 5,465 5,272
*Refer to Figure 3 for the boundaries of the region.

Pakenham East Interchange Comparative Assessment
SMEC Australia | Page 7
Figure 2 - Study Area Zones

Pakenham East Interchange Comparative Assessment
SMEC Australia | Page 8
Centre North
Centre EastPakenham East
Pakenham South
Centre South
South East
Far East
North East
West
Centre WestTown Centre
Figure 3 - Study Area Regions

Pakenham East Interchange Comparative Assessment
SMEC Australia | Page 9
3 Travel Time and Vehicle Hours
During the morning peak, the majority of trips using the highway network around Pakenham and Pakenham East are towards the west. The Princes Freeway generally provides the fastest travel time for all trips through the area. Consequently, trips aim to join the freeway as early as possible. In Option 1, the proposed new interchange provides an additional opportunity for those trips to join the freeway earlier.
For Option 2, without the proposed interchange, trips generally spend a longer time on the Princes Highway and other arterial roads. That is, until they are able to join the freeway at the earliest point. The net result is a small increase in the total vehicle kilometres travelled and the total travel time on the highway network.
Table 2 shows a summary of the total travel distance and total travel time on the highway network in the modeled area.
It shows that without the new interchange in option 2, there is a small increase in the vehicle kilometres travelled (i.e. an increase in the order of 0.5% in the morning peak and 0.7% in the afternoon peak).
In both peaks, the total travel time increases by about 5.5%. This increase is as a result of the slightly longer travel distances involved as well as the impact of increased congestion on the highway network.
In both peak periods, the impact of not providing the interchange is primarily on roads McGregor Road, Racecourse Road, The Princes Highway and Princes Freeway.
Overall, in each of the peak periods, average travel speeds for option 2 are about 3km/hr slower than in Option 1. However, in a practical sense, this reduction in speed would result in additional travel time of only about 1 minute in a 15km journey from the east side of the modeled network to the west.
Table 2: Traffic Summary Statistics for AM and PM Peak Period Travel with and without the proposed interchange
Total Vehicle Kms Travelled
Total Vehicle Hours Travelled
Average Vehicle Speed (Km/Hr)
AM PEAK:
Option 1 (With Interchange) 455,270 8,580 53
Option 2 (No Interchange) 457,570 9,070 50
PM PEAK: 455,270 8,580 53
Option 1 (With Interchange) 510,990 9,900 52
Option 2 (No Interchange) 514,590 10,450 49

Pakenham East Interchange Comparative Assessment
SMEC Australia | Page 10
4 Trip Diversion
Volumes on modeled road links on the highway network for option 1 (with the proposed interchange included) were compared with those of Option 2 (without the interchange). These comparisons were made for the morning peak period and the afternoon peak period.
The results were categorized into five classes:
+ No difference, where the difference in peak period traffic volume is less than 50 vehicles;
+ Small difference, where the difference in peak period traffic volume is in the range 50-150 vehicles (increase and decrease);
+ Fair difference, where the difference in peak period traffic volume is in the range 150-500 vehicles (increase and decrease);
+ Large difference, where the difference in peak period traffic volume is in the range 500-1,000 vehicles (increase and decrease);
+ Very Large difference, where the difference in peak period traffic volume is greater than 1,000 vehicles (increase and decrease).
4.1 Morning Peak Period
Figure 4 shows a plot of the differences in volumes on the highway network during the morning peak period. It shows graphically how traffic would divert when the proposed interchange is not provided.
At the extreme east of the modeled area in Option 2, trips that would have used the proposed new arterial road connection and the new interchange to access the freeway would now travel eastwards to access the Princes Freeway at the interchange near Nar Nar Goon Road. This would result in larger traffic volumes on the freeway and the highway east of the proposed interchange. With the new interchange in Option 1, around 200 vehicles in the morning peak and 100 vehicles in the afternoon peak would access the Princes Freeway at Nar Nar Goon Road. Without the new interchange, these volumes increase to 1,100 vehicles in the morning peak and 1,400 in the afternoon peak.
West of the proposed interchange volumes on the freeway would be lower in Option 2 (without the interchange). Differences in traffic volumes between the two cases would decrease past each of the interchanges travelling west. There would be minimal difference between the two cases west of the Cardinia Road interchange.
On the Princes Highway west of Dore Road, traffic volumes would be higher in option 2 (without the proposed interchange). Traffic that would have travelled southwards to join the Princes Freeway, will do so at a point further west accessing the freeway via Racecourse Road, McGregor Road and Cardinia Road. West of Dore Road, westbound traffic in the morning peak period reach around 1,800 vehicles in Option 2 without the interchange, whereas in Option 1, the road would carry around 1,200 vehicles in the morning peak. Volumes in the afternoon peak in the eastbound direction are similar to the westbound morning peak volumes.
West of Cardinia Road, the differences in the traffic volumes on the Princes Freeway between the two cases would be small. In both cases, the Princes Freeway will carry approximately 20,000 vehicles in the morning peak period (both directions) and 21,000 vehicles in the afternoon peak period.
4.2 Afternoon Peak Period
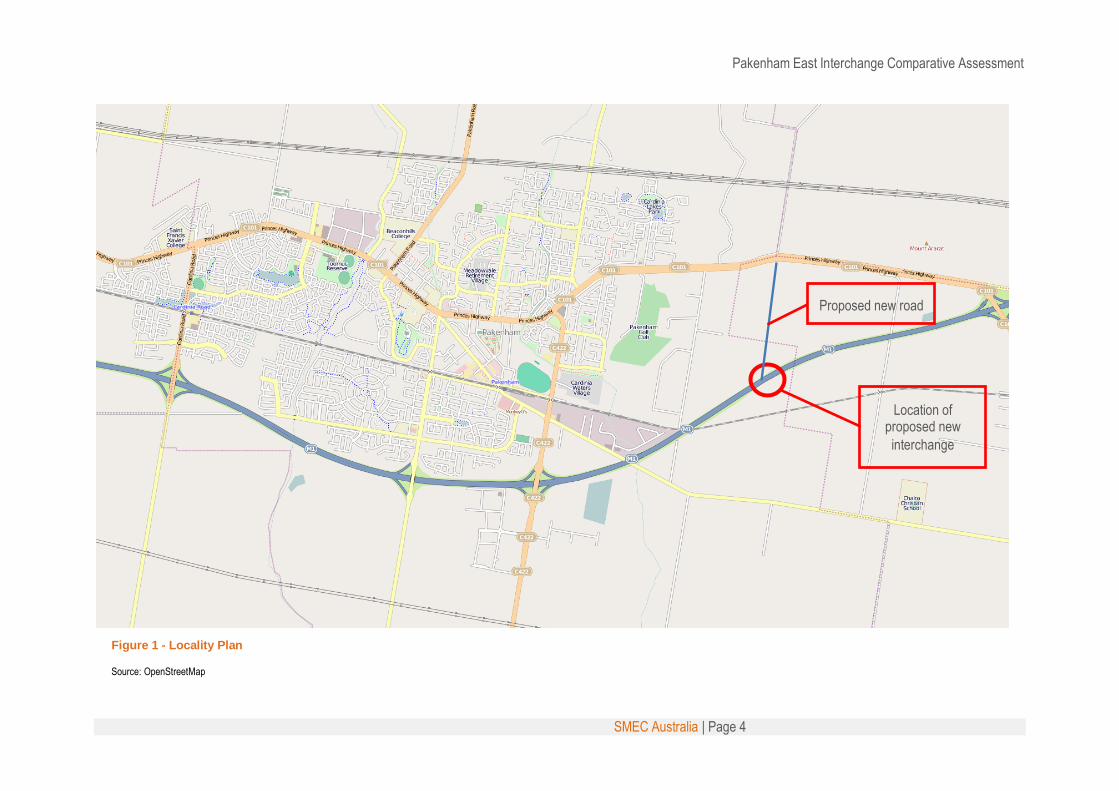
Figure 5 shows a plot of the differences in volumes on the highway network during the afternoon peak period. The map shows graphically how traffic would divert if the proposed interchange were not provided. The situation is a mirror image of the morning peak.
At the extreme east of the modeled area, trips in Option 2, that would have used the proposed new arterial road connection and the new interchange would travel further eastwards and exit the freeway at the interchange near Nar Nar

Pakenham East Interchange Comparative Assessment
SMEC Australia | Page 11
Goon Road. This would result in larger traffic volumes on the Princes Freeway and the Princes Highway the east of the proposed interchange.
West of the proposed interchange, volumes on the Princes Freeway would be lower than would be the case if the interchange was provided. West of the Cardinia Road interchange, there would be only small differences between the two cases. However, differences in the traffic volumes would increase eastwards past each of the interchanges.
On the Princes Highway, west of Dore Road, traffic volumes would be higher for Option 2, with traffic that would have travelled northwards from the freeway exiting at a point further west. They would exit the Princes Freeway via Racecourse Road, McGregor Road and Cardinia Road.

Pakenham East Interchange Comparative Assessment
SMEC Australia | Page 12
Figure 4 – Morning Peak 2-hour period traffic volume diversion
Source: VITM assignments
Please refer to section 4 for categorisation of results for definition of volume ranges.
LEGEND
No Difference
Small Decrease
Fair Decrease
Large Decrease
Very Large Decrease
Small Increase
Fair Increase
Large Increase
Very Large Increase
Some road links in Pakenham East that were removed from the option 2 network show in this diagram because of the difference between the volume on the road in option 1 and the absent volume in option 2
Pakenham East Interchange Comparative Assessment
SMEC Australia | Page 13
Figure 5 – Afternoon Peak 2-hour period traffic volume diversion
Source: VITM assignments
Please refer to section 4 for categorisation of results for definition of volume ranges.
LEGEND
No Difference
Small Decrease
Fair Decrease
Large Decrease
Very Large Decrease
Small Increase
Fair Increase
Large Increase
Very Large Increase
Some road links in Pakenham East that were removed from the option 2 network show in this diagram because of the difference between the volume on the road in option 1 and the absent volume in option 2

Pakenham East Interchange Comparative Assessment
SMEC Australia | Page 14
5 Traffic Volumes and Levels of Service
5.1 Volume/capacity Ratio
To study the effect of capacity on the impact of the interchange, we used the calculated volume/capacity ratio (v/c) from the model to separate road links into categories representing the six levels of service. These correspond closely to the Highway Capacity Manual’s level of service definitions for uninterrupted flow. The categories were defined as follows:
+ Level of Service A: v/c less than 0.6;
+ Level of Service B: v/c higher than 0.6, less than 0.7;
+ Level of Service C: v/c higher than 0.7, less than 0.8;
+ Level of Service D: v/c higher than 0.8, less than 0.9;
+ Level of Service E: v/c higher than 0.0.9, less than 1;
+ Level of Service F: v/c higher than 1.
LOS A describes the highest quality of traffic service, when motorists are able to travel at their desired speed. Passing demand is well below passing capacity, and platoons of three or more vehicles are rare.
LOS B characterizes a traffic flow where the demand for passing to maintain a desired speed first becomes noticeable. Drivers are delayed in platoons and speeds may fall, but motorists will not be unduly delayed in terms of their overall travel time.
LOS C describes further increases in flow, resulting in noticeable increases in platoon formation, platoon size, and frequency of passing impediments. High average vehicle speed can be maintained on level-terrain. At higher volumes there are chaining of platoons and significant reductions in passing capacity occur. Traffic flow is stable, but is susceptible to congestion due to turning traffic and slow-moving vehicles.
LOS D describes unstable traffic flow. The two opposing traffic streams begin to operate separately at higher volume levels, as passing becomes extremely difficult. Passing demand is high, with passing capacity reaching zero. Mean platoon sizes of 5 to 10 vehicles are common, Turning vehicles and roadside distractions cause major shock waves in the traffic stream.
At LOS E, traffic flow conditions are dense and very slow. Under these base conditions, passing is virtually impossible and platooning becomes intense, as slower vehicles or other interruptions are encountered. Operating conditions at capacity are unstable and difficult to predict.
LOS F represents heavily congested flow with traffic demand exceeding capacity. Volumes are lower than capacity and speeds are highly variable.
Table 3 shows the percentage of the length of highway network that operates well during the peak periods (better than LOS D) and poorly (worse than LOS D). It shows that for Option 2, without the proposed interchange, there is a small decrease in level of service on the Princes Highway. The percentage of the highway operating well decreases and the percentage of the highway operating poorly increases slightly.
Part of this can be attributed to the fact that the arterial road connected to the proposed interchange operates at a high level of service. This arterial is not included in the Option 2 road network and as a result, the length of highway and the length of highway operating well decrease. Both of these factors tend to lower the overall level of service.

Pakenham East Interchange Comparative Assessment
SMEC Australia | Page 15
Table 3: Percentage of highway network length operating at good and bad Levels of Service
% of Road Network Better than LOS D
% of Road Network Operating at LOS D
% of Road Network Worse than LOS D
AM PEAK:
Option 1 (With Interchange) 94.5% 2.9% 2.6%
Option 2 (No Interchange) 94.1% 2.1% 3.8%
PM PEAK:
Option 1 (With Interchange) 92.0% 5.0% 3.0%
Option 2 (No Interchange) 90.6% 5.0% 4.4%
5.2 Morning Peak Period
Figure 6 and Figure 7 show the levels of service on the highway network for the morning peak period for Option 1 and Option 2, i.e. the inclusion of the proposed interchange and the exclusion of the proposed interchange respectively. When comparing the two plots, it can be seen that for the case without the proposed interchange:
+ The Princes Freeway would operate satisfactorily along most of its length within the study area and at a better level of service;
+ Short sections of McGregor Road and Racecourse Road would operate at a lower level of service;
+ Level of service on the short lengths of the arterial roads closest to the east-most interchange on the Princes Freeway with the Princes Highway would drop significantly;
+ East of McGregor Road, significant sections of the Princes Highway would operate at a lower level of service.
It should be noted though, that where the levels of service for an individual link has changed, it is most likely that the change has been caused by a small difference close to the boundary between the two LOS classifications. For example, a change in v/c from 0.79 to 0.81 would show a change in level of service. However, operating conditions would not be very noticeably different.
The primary impact of not providing the interchange will be on the demand for trips to areas north and west of Pakenham. These trips will then use McGregor Road to access the freeway or The Princes Freeway to access the freeway at the Nar Nar Goon interchange.
Figure 8 shows a comparison of the volumes at selected locations on the road network with the interchange and without the interchange (volume with/volume without). These diagrams show that without the interchange, McGregor Road will carry approximately 900 additional vehicles in both directions in the morning peak period. The additional volumes are split equally in each direction. At its junction with Princes Highway, McGregor Road volumes will be around 1330 vehicles northbound and 1750 southbound. These will increase without the interchange to 1850 and 2250 vehicles respectively. Northbound volumes remain static further south along McGregor Road, but southbound volumes increase to 2,750 without the new interchange and 3,200 vehicles without it and Henty Road and at the interchange with the Princes Freeway, the road will carry around 3,200 vehicles with the new interchange in the network and 3,900 without it. The increase in volumes along McGregor Road reflects the increasing catchment of traffic destined for areas north of Pakenham. The increase in traffic with no new interchange is the result of additional demand accessing the freeway, diverted from accessing the interchange at Ryan Road.
On the Princes Highway east of Ryan Road, the impact is more complex. Here, trips that had travelled westwards along the Princes Highway to access the Freeway via the proposed new arterial, would travel eastwards along the Princes Highway to access the freeway at the Nar Nar Goon interchange. This would result in around 1,000 fewer vehicles travelling westwards and 1000 more vehicles travelling eastwards along the Princes Highway. At Ryan Road, Dore Road and Mt Ararat Road, more vehicles would turn eastwards without the interchange and fewer would turn to the west. Figures 9 and 10 show these travel patterns with bandwidth plots of volumes for option1 and option 2.

Pakenham East Interchange Comparative Assessment
SMEC Australia | Page 16
Figure 6 – Morning Peak 2-hour period Level of Service: Option 1, with interchange
Source: VITM assignments
Please refer to Section 5.1 for definitions of LOS
LEGEND
LOS D
LOS C
LOS B
LOS A
LOS E
LOS F
Some road links in Pakenham East that were removed from the option 2 network show in this diagram because of the difference between the volume on the road in option 1 and the absent volume in option 2

Pakenham East Interchange Comparative Assessment
SMEC Australia | Page 17
Figure 7 – Morning Peak 2-hour period Level of Service: Option 2, no interchange
Source: VITM assignments
Please refer to Section 5.1 for definitions of LOS
LEGEND
LOS D
LOS C
LOS B
LOS A
LOS E
LOS F
Some road links in Pakenham East that were removed from the option 2 network show in this diagram because of the difference between the volume on the road in option 1 and the absent volume in option 2

Pakenham East Interchange Comparative Assessment
SMEC Australia | Page 18
Figure 8 – Morning Peak 2-hour period Comparative Volumes (Option 1/Option 2)
Source: VITM assignments
Some road links in Pakenham East that were removed from the option 2 network show in this diagram because of the
difference between the volume on the road in option 1 and the absent volume in option 2

Pakenham East Interchange Comparative Assessment
SMEC Australia | Page 19
Figure 9 – Morning Peak 2-hour period volume bandwidths for Option 1, with new interchange
Source: VITM assignments
Figure 10 – Morning Peak 2-hour period volume bandwidths for Option 2 with no new interchange
Source: VITM assignments
Some road links in Pakenham East that were removed from the option 2 network show in this diagram because of the difference between the volume on the road in option 1 and the absent volume in option 2
Some road links in Pakenham East that were removed from the option 2 network show in this diagram because of the difference between the volume on the road in option 1 and the absent volume in option 2

Pakenham East Interchange Comparative Assessment
SMEC Australia | Page 20
5.3 Afternoon Peak Period
Morning peak period Levels of service are mirrored in the evening peak period. Figure 11 and Figure 12 show the levels of service on the highway network for the morning peak period for the two options, inclusion of the proposed interchange and exclusion of the proposed interchange respectively. When comparing the two options, it can be seen that without the interchange, Option2:
+ The Princes Freeway would operate along most of the length of the study area at the same or at a better level of service;
+ Sections of McGregor Road and Racecourse Road would operate at a lower level of service;
+ East of McGregor Road, significant lengths of the Princes Highway would operate at a lower level of service;
+ Short sections of the Princes Highway west of McGregor Road would operate at a lower level of service.
Figure 13 shows a comparison of the volumes at selected locations on the road network with the interchange and without the interchange (volume with/volume without). It shows that without the interchange, McGregor Road will carry between 600 and 800 additional vehicles in the afternoon peak period in both directions. As in the morning peak period, volumes in both cases increase towards the south.
In the afternoon peak, travel demand patterns reflect roughly a mirror image of the morning peak patterns, with some small additional changes. Trips from areas north and west of Pakenham would now use the McGregor Road interchange to access the road network serving East Pakenham or would travel to Nar Nar Goon interchange and then westwards along the Princes Highway. Figures 14 and 15 show these travel patterns with bandwidth plots of volumes on the road network with and without the new interchange.
At the McGregor Road interchange, the number of vehicles accessing the freeway westbound or leaving the freeway east bound will each increase by around 600 vehicles. This volume change will carried along the length of McGregor Road.
On the Princes Highway, east of Ryan Road, the eastbound volumes would increase substantially as a result of the additional trips leaving the eastbound freeway at the Nar Nar Goon interchange and accessing local road networks along the Princes Highway Westbound. There would fewer turns from the west into Ryan Road, Dore Road and Mt Ararat Road and more turns into the roads from the east.
There may be a smaller impact on Cardinia Road but the modelled differences in volume are small enough to be within the margins of error of forecasting over 30 years with the strategic model and no definitive conclusions can be made from the results.

Pakenham East Interchange Comparative Assessment
SMEC Australia | Page 21
Figure 11 – Afternoon Peak 2-hour period Level of Service: Option 1 with interchange
Source: VITM assignments
Please refer to Section 5.1 for definitions of LOS
LEGEND
LOS D
LOS C
LOS B
LOS A
LOS E
LOS F
Some road links in Pakenham East that were removed from the option 2 network show in this diagram because of the difference between the volume on the road in option 1 and the absent volume in option 2

Pakenham East Interchange Comparative Assessment
SMEC Australia | Page 22
Figure 12 – Afternoon Peak 2-hour period Level of Service: Option 2 no interchange
Source: VITM assignments
Please refer to Section 5.1 for definitions of LOS
LEGEND
LOS D
LOS C
LOS B
LOS A
LOS E
LOS F
Some road links in Pakenham East that were removed from the option 2 network show in this diagram because of the difference between the volume on the road in option 1 and the absent volume in option 2

Pakenham East Interchange Comparative Assessment
SMEC Australia | Page 23
Figure 13 – Afternoon Peak 2-hour period Comparative Volumes (Option 1/Option 2)
Source: VITM assignments
Some road links in Pakenham East that were removed from the option 2 network show in this diagram because of the
difference between the volume on the road in option 1 and the absent volume in option 2

Pakenham East Interchange Comparative Assessment
SMEC Australia | Page 24
Figure 14 – Afternoon Peak 2-hour period volume bandwidths for Option 1 with new interchange
Source: VITM assignments
Figure 15 – Afternoon Peak 2-hour period volume bandwidths for option 2 with no new interchange
Source: VITM assignments
Some road links in Pakenham East that were removed from the option 2 network show in this diagram because of the difference between the volume on the road in option 1 and the absent volume in option 2
Some road links in Pakenham East that were removed from the option 2 network show in this diagram because of the difference between the volume on the road in option 1 and the absent volume in option 2
Pakenham East Interchange Comparative Assessment
SMEC Australia | Page 25
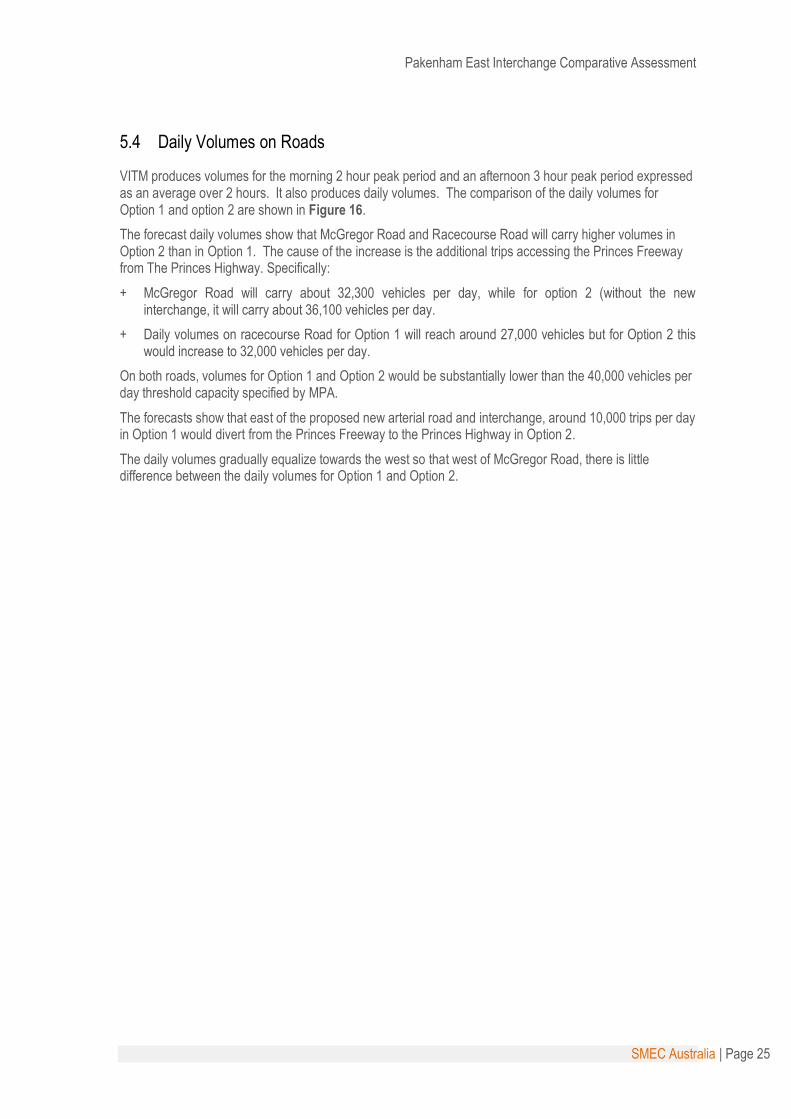
5.4 Daily Volumes on Roads
VITM produces volumes for the morning 2 hour peak period and an afternoon 3 hour peak period expressed as an average over 2 hours. It also produces daily volumes. The comparison of the daily volumes for Option 1 and option 2 are shown in Figure 16.
The forecast daily volumes show that McGregor Road and Racecourse Road will carry higher volumes in Option 2 than in Option 1. The cause of the increase is the additional trips accessing the Princes Freeway from The Princes Highway. Specifically:
+ McGregor Road will carry about 32,300 vehicles per day, while for option 2 (without the new interchange, it will carry about 36,100 vehicles per day.
+ Daily volumes on racecourse Road for Option 1 will reach around 27,000 vehicles but for Option 2 this would increase to 32,000 vehicles per day.
On both roads, volumes for Option 1 and Option 2 would be substantially lower than the 40,000 vehicles per day threshold capacity specified by MPA.
The forecasts show that east of the proposed new arterial road and interchange, around 10,000 trips per day in Option 1 would divert from the Princes Freeway to the Princes Highway in Option 2.
The daily volumes gradually equalize towards the west so that west of McGregor Road, there is little difference between the daily volumes for Option 1 and Option 2.

Pakenham East Interchange Comparative Assessment
SMEC Australia | Page 26
Figure 16 – Directional Daily Comparative Volumes (Option 1/Option 2)
Source: VITM assignments
Some road links in Pakenham East that were removed from the option 2 network show in this diagram because of the
difference between the volume on the road in option 1 and the absent volume in option 2
Pakenham East Interchange Comparative Assessment
SMEC Australia | Page 27
6 Travel Speeds
To examine the effect of changes in levels of service in more detail, the travel speed on each road link in the highway network with and without the interchange were compared. Differences were categorised into five separate bands:
+ No difference: less than 3km/hr difference;
+ Small difference: between 3km/hr and 6km/hr difference (faster and slower);
+ Fair difference: between 6km/hr and 9km/hr difference (faster and slower);
+ Large difference: between 9km/hr and 12km/hr difference (faster and slower);
+ Very Large difference: more than 12km/hr difference (faster and slower).
6.1 Morning Peak Period
A plot of the difference in travel speeds on the links is shown in Figure 17. It shows that speeds on most links would not be significantly affected by the presence or absence of the proposed interchange. For option 2 without the interchange, the exceptions are:
+ The Princes Highway east of Dore Road, where speeds would increase;
+ The Princes Freeway, westbound, between McGregor Road and the South Gippsland Highway, where speeds would increase;
+ Lower speeds on the Princes Highway between Dore Road and McGregor Road;
+ Lower speeds on Racecourse Road south of the railway line;
+ Lower speeds on McGregor Road south of the railway line; and
+ Lower speeds at interchange of the Princes Freeway with the Princes Highway near Nar Nar Goon Road.
6.2 Afternoon Peak Period
A plot of the difference in travel speeds on the links during the afternoon peak period is shown in Figure 18. Results are similar to the morning peak period in that speeds on most links are not affected by the presence or absence of the proposed interchange. For Option 2, without the interchange, the exceptions are:
+ The Princes Highway east of Dore Road, where speeds would increase;
+ The Princes Freeway, eastbound, between McGregor Road and the South Gippsland Highway;
+ Lower speeds on the Princes Highway between Dore Road and McGregor Road;
+ Lower speeds on Racecourse Road south of the railway line;
+ Lower speeds on McGregor Road south of the railway line; and
+ Lower speeds on the link north of the Princes Freeway with the Princes Highway near Nar Nar Goon Road.

Pakenham East Interchange Comparative Assessment
SMEC Australia | Page 28
Figure 17 – Morning Peak 2-hour period: difference in average travel speed – Option 1 to Option 2
Source: VITM assignments
LEGEND
No Difference
Small Decrease
Fair Decrease
Large Decrease
Very Large Decrease
Small Increase
Fair Increase
Large Increase
Very Large Increase
Some road links in Pakenham East that were removed from the option 2 network show in this diagram because of the difference between the volume on the road in option 1 and the absent volume in option 2

Pakenham East Interchange Comparative Assessment
SMEC Australia | Page 29
Figure 18 – Afternoon Peak 2-hour period: difference in average travel speed – Option 1 to Option 2
Source: VITM assignments
LEGEND
No Difference
Small Decrease
Fair Decrease
Large Decrease
Very Large Decrease
Small Increase
Fair Increase
Large Increase
Very Large Increase
Some road links in Pakenham East that were removed from the option 2 network show in this diagram because of the difference between the volume on the road in option 1 and the absent volume in option 2

Pakenham East Interchange Comparative Assessment
SMEC Australia | Page 30
7 Conclusion
The traffic modelling undertaken as part of the preparation of this report indicates that there is marginal difference between Option 1 and Option 2, being with and without a new freeway interchange at Pakenham East respectively. With the freeway interchange (Option 1), the travel speeds are approximately 3km/hr higher across the network than for Option 2, with a slightly reduced total travel distance. However in practical terms, these differences between Option 1 and Option 2 in travel time are approximately 1 minute. Traffic volumes are higher on the Freeway east of McGregor Road with the freeway interchange, while under Option 2 the absence of the freeway interchange results in vehicles accessing the freeway predominantly via Racecourse and McGregor Roads.
Duplication of Racecourse and McGregor Road will enable both existing arterials to cater for traffic demand generated by Pakenham East with minor impacts on travel time, levels of service and travel speeds for the Pakenham area. As both Racecourse Road and McGregor Road will operate within the capacity of a four lane arterial if the interchange is not provided, further investigations should be undertaken to determine whether the benefits of providing the interchange justify the cost.

Pakenham East Interchange Comparative Assessment
SMEC Australia | Page 31
Appendix A – Land Use Input Comparison: PEICA Inputs compared to VITM South
East Corridor Inputs

Pakenham East Interchange Comparative Assessment
SMEC Australia | Page 32
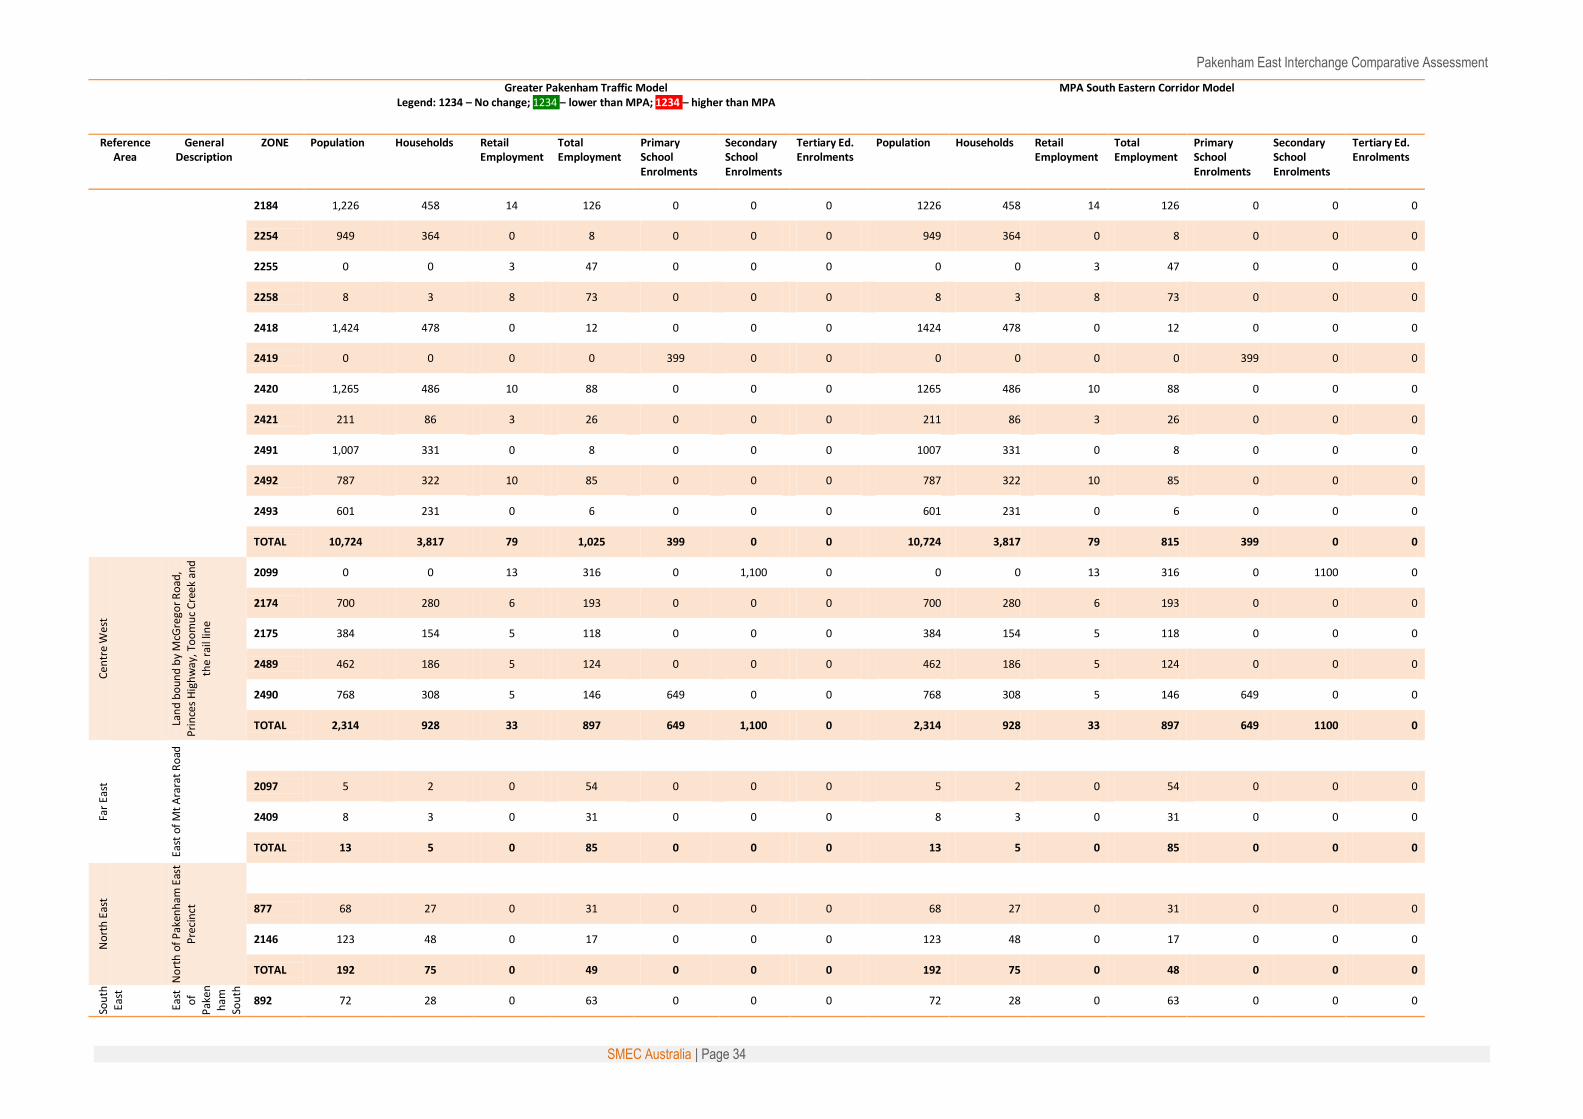
Greater Pakenham Traffic Model
Legend: 1234 – No change; 1234 – lower than MPA; 1234 – higher than MPA MPA South Eastern Corridor Model
Reference Area
General Description
ZONE Population Households Retail Employment
Total Employment
Primary School Enrolments
Secondary School Enrolments
Tertiary Ed. Enrolments
Population Households Retail Employment
Total Employment
Primary School Enrolments
Secondary School Enrolments
Tertiary Ed. Enrolments
Pak
enh
am E
ast
Lan
d w
ith
in U
GB
eas
t of
Dee
p C
ree
k /
Rya
n R
oad
2178
18,850 6,500 467 870 900 1,200
18,850 6,500 467 870 900 1,200 0
3026
3027
3028
3029
3030
3031 0
3034
3035
3036
3037
3038
3039
3040
TOTAL 18,850 6,500 467 870 900 1,200 0
Pak
enh
am S
out
h
All
Ind
ust
rial
so
uth
of
Pri
nce
s Fr
eew
ay, e
ast
of T
oo
mu
c C
reek
2179 0 0 0 1,600 0 0 0 0 0 0 1600 0 0 0
2180 0 0 0 2,000 0 0 0 0 0 0 2000 0 0 0
2181 0 0 0 4,000 0 0 0 0 0 0 4000 0 0 0
2256 0 0 0 1,000 0 0 0 0 0 0 1000 0 0 0
2259 0 0 0 2,000 0 0 0 0 0 0 2000 0 0 0
2451 0 0 0 1,600 0 0 0 0 0 0 1600 0 0 0
2452 0 0 0 1,600 0 0 0 0 0 0 1600 0 0 0
2453 0 0 0 1,600 0 0 0 0 0 0 1600 0 0 0
2454 0 0 0 1,000 0 0 0 0 0 0 1000 0 0 0
2455 0 0 0 1,000 0 0 0 0 0 0 1000 0 0 0
2456 0 0 0 1,000 0 0 0 0 0 0 1000 0 0 0
TOTAL 0 0 0 18,400 0 0 0 0 0 0 18,400 0 0 0
Cen
tre
East
Lan
d b
ou
nd
by
Rac
eco
urs
e R
oad
, ra
ilway
lin
e, R
yan
Ro
ad
and
Pri
nces
Hig
hw
ay
888 248 80 0 11 0 0 0 983 322 0 11 0 0 0
2100 1,827 739 5 149 0 0 0 1827 739 5 149 150 0 0
2176 915 345 3 106 0 0 0 915 345 3 106 0 0 0
2415 1,568 514 0 4 0 0 0 1568 514 0 4 0 0 0
2416 41 14 0 15 0 0 0 41 14 0 15 0 0 0

Pakenham East Interchange Comparative Assessment
SMEC Australia | Page 33
Greater Pakenham Traffic Model Legend: 1234 – No change; 1234 – lower than MPA; 1234 – higher than MPA
MPA South Eastern Corridor Model
Reference Area
General Description
ZONE Population Households Retail Employment
Total Employment
Primary School Enrolments
Secondary School Enrolments
Tertiary Ed. Enrolments
Population Households Retail Employment
Total Employment
Primary School Enrolments
Secondary School Enrolments
Tertiary Ed. Enrolments
2498 70 25 2 78 0 0 0 546 207 2 78 0 0 0
2499 222 85 0 2 0 0 0 222 85 0 2 0 0 0
2500 155 50 0 8 0 0 0 403 132 0 8 0 0 0
TOTAL 5,046 1,851 11 374 0 0 0 6505 2357 11 374 150 0 0
Cen
tre
No
rth
Lan
d n
ort
h o
f P
rin
ces
Hig
hw
ay b
etw
een
To
omu
c C
ree
k an
d D
eep
Cre
ek
883 1,192 495 7 162 0 0 0 1192 495 7 162 398 1100 0
2101 1,341 477 3 80 0 0 0 1341 477 3 80 0 0 0
2164 638 254 3 81 0 0 0 638 254 3 81 0 0 0
2165 608 243 6 111 401 0 0 608 243 6 111 401 0 0
2166 663 252 3 79 0 0 0 663 252 3 79 0 0 0
2411 756 287 1 2 0 0 0 756 287 1 2 0 0 0
2412 1,012 362 3 83 511 0 0 1012 362 3 83 511 0 0
2413 138 55 3 117 398 1,100 0 302 127 3 117 398 1100 0
2501 1,059 425 7 143 0 0 0 1059 425 7 143 0 383 0
2502 264 105 2 33 0 0 0 264 105 2 33 0 0 0
2503 152 46 1 25 0 0 0 152 46 1 25 0 0 0
2504 16 0 0 7 0 0 0 16 0 0 7 0 0 0
2505 398 156 3 58 0 0 0 398 156 3 58 0 0 0
2506 834 303 2 64 0 0 0 834 303 2 64 0 0 0
2507 700 251 2 55 0 0 0 700 251 2 55 0 0 0
2510 398 151 1 25 0 0 0 398 151 1 25 0 0 0
2512 68 26 0 0 0 0 0 68 26 0 0 0 0 0
2513 382 145 1 42 450 0 0 382 145 1 2 0 0 0
TOTAL 10,617 4,034 49 1,167 1,761 1,100 0 10,781 4106 49 1127 1710 2583 0
Cen
tre
Sout
h
Lan
d n
ort
h o
f th
e P
rin
ces
Free
way
bet
wee
n To
om
uc
Cre
ek a
nd
the
in
ters
ecti
on o
f th
e P
rin
ces
Free
way
an
d t
he
rail
line
889 1,211 385 0 9 0 0 0 1211 385 0 9 0 0 0
890 0 0 29 500 0 0 0 1 0 29 290 0 0 0
894 0 0 1 23 0 0 0 4 1 1 23 0 0 0
2182 2,034 671 0 14 0 0 0 2034 671 0 14 0 0 0
Pakenham East Interchange Comparative Assessment
SMEC Australia | Page 34
Greater Pakenham Traffic Model Legend: 1234 – No change; 1234 – lower than MPA; 1234 – higher than MPA
MPA South Eastern Corridor Model
Reference Area
General Description
ZONE Population Households Retail Employment
Total Employment
Primary School Enrolments
Secondary School Enrolments
Tertiary Ed. Enrolments
Population Households Retail Employment
Total Employment
Primary School Enrolments
Secondary School Enrolments
Tertiary Ed. Enrolments
2184 1,226 458 14 126 0 0 0 1226 458 14 126 0 0 0
2254 949 364 0 8 0 0 0 949 364 0 8 0 0 0
2255 0 0 3 47 0 0 0 0 0 3 47 0 0 0
2258 8 3 8 73 0 0 0 8 3 8 73 0 0 0
2418 1,424 478 0 12 0 0 0 1424 478 0 12 0 0 0
2419 0 0 0 0 399 0 0 0 0 0 0 399 0 0
2420 1,265 486 10 88 0 0 0 1265 486 10 88 0 0 0
2421 211 86 3 26 0 0 0 211 86 3 26 0 0 0
2491 1,007 331 0 8 0 0 0 1007 331 0 8 0 0 0
2492 787 322 10 85 0 0 0 787 322 10 85 0 0 0
2493 601 231 0 6 0 0 0 601 231 0 6 0 0 0
TOTAL 10,724 3,817 79 1,025 399 0 0 10,724 3,817 79 815 399 0 0
Cen
tre
Wes
t
Lan
d b
ou
nd
by
McG
rego
r R
oad
, P
rin
ces
Hig
hw
ay, T
oo
mu
c C
reek
and
th
e ra
il lin
e
2099 0 0 13 316 0 1,100 0 0 0 13 316 0 1100 0
2174 700 280 6 193 0 0 0 700 280 6 193 0 0 0
2175 384 154 5 118 0 0 0 384 154 5 118 0 0 0
2489 462 186 5 124 0 0 0 462 186 5 124 0 0 0
2490 768 308 5 146 649 0 0 768 308 5 146 649 0 0
TOTAL 2,314 928 33 897 649 1,100 0 2,314 928 33 897 649 1100 0
Far
East
East
of
Mt
Ara
rat
Ro
ad
2097 5 2 0 54 0 0 0 5 2 0 54 0 0 0
2409 8 3 0 31 0 0 0 8 3 0 31 0 0 0
TOTAL 13 5 0 85 0 0 0 13 5 0 85 0 0 0
No
rth
Eas
t
No
rth
of
Pak
enh
am E
ast
Pre
cin
ct
877 68 27 0 31 0 0 0 68 27 0 31 0 0 0
2146 123 48 0 17 0 0 0 123 48 0 17 0 0 0
TOTAL 192 75 0 49 0 0 0 192 75 0 48 0 0 0
Sou
th
East
East
o
f P
aken
ham
So
uth
in
du
stri
al
area
892 72 28 0 63 0 0 0 72 28 0 63 0 0 0

Pakenham East Interchange Comparative Assessment
SMEC Australia | Page 35
Greater Pakenham Traffic Model Legend: 1234 – No change; 1234 – lower than MPA; 1234 – higher than MPA
MPA South Eastern Corridor Model
Reference Area
General Description
ZONE Population Households Retail Employment
Total Employment
Primary School Enrolments
Secondary School Enrolments
Tertiary Ed. Enrolments
Population Households Retail Employment
Total Employment
Primary School Enrolments
Secondary School Enrolments
Tertiary Ed. Enrolments
2122 63 25 0 166 450 220 0 63 25 0 166 450 220 0
2190 3 1 11 158 0 0 0 3 1 11 158 0 0 0
2408 8 3 1 21 0 0 0 8 3 1 21 0 0 0
TOTAL 145 57 11 409 450 220 0 145 57 11 409 450 220 0
Tow
n C
entr
e
Lan
d b
ou
nd
by
Pri
nces
Hig
hw
ay, R
acec
ours
e R
oad
, Bal
d
Hill
s R
oad
/rai
l lin
e an
d M
cGre
gor
Ro
ad
887 2,945 950 350 525 0 0 0 27 14 2 60 0 0 0
2098 597 333 472 697 0 0 0 597 333 225 495 0 0 0
2177 728 414 107 100 0 0 0 728 414 107 627 0 0 0
2257 0 0 13 300 0 0 0 26 11 13 132 0 0 0
2494 459 240 2 58 0 0 0 459 240 2 58 0 0 0
2495 70 29 560 922 0 0 0 70 29 113 248 0 0 0
2496 133 76 663 1,000 0 0 0 133 76 77 440 0 0 0
2497 591 314 0 478 0 0 0 591 314 83 478 0 0 0
TOTAL 5,522 2,356 2,167 4,080 0 0 0 2,631 1,431 621 2,538 0 0 0
Wes
t
Lan
d in
Car
din
ia R
oad
Pre
cin
ct
878 0 0 18 334 0 0 0 0 0 18 334 0 0 0
885 1,530 609 0 44 0 0 0 1530 609 0 44 0 0 0
2148 2,076 726 0 17 0 0 0 2076 726 0 17 0 0 0
2170 152 58 210 315 0 0 0 89 34 113 242 0 0 0
2171 2,055 841 42 211 0 0 0 1835 751 42 211 0 0 0
2260 0 0 0 9,929 0 0 0 0 0 0 9463 0 0 0
2261 0 0 280 780 405 452 0 0 0 121 231 405 452 0
2262 0 0 17 80 0 0 0 0 0 17 80 0 0 0
2264 48 19 8 141 0 0 0 48 19 8 141 0 0 0
2422 4,512 1,628 0 44 0 0 0 1206 435 0 44 0 0 0
2423 2,114 811 49 70 0 0 0 2114 811 0 21 385 0 0
2424 2,470 950 0 36 450 1,200 0 2284 877 0 36 0 0 0
2437 901 321 0 2 0 0 0 901 321 0 2 0 0 0
2439 829 318 0 2 0 0 0 829 318 0 2 0 0 0

Pakenham East Interchange Comparative Assessment
SMEC Australia | Page 36
Greater Pakenham Traffic Model Legend: 1234 – No change; 1234 – lower than MPA; 1234 – higher than MPA
MPA South Eastern Corridor Model
Reference Area
General Description
ZONE Population Households Retail Employment
Total Employment
Primary School Enrolments
Secondary School Enrolments
Tertiary Ed. Enrolments
Population Households Retail Employment
Total Employment
Primary School Enrolments
Secondary School Enrolments
Tertiary Ed. Enrolments
2458 0 0 0 922 0 0 0 0 0 0 922 0 0 0
2484 43 15 1 8 0 0 0 43 15 1 8 0 0 0
2485 1,102 435 0 42 450 0 0 1102 435 0 42 0 0 0
2486 4 2 4 82 0 0 0 4 2 4 82 0 0 0
2487 367 141 6 106 0 0 0 367 141 6 106 0 0 0
TOTAL 18,202 6,874 634 13,164 1,305 1,652 0 14,428 5,494 329 12,027 790 451 0
Pakenham East Interchange Comparative Assessment
SMEC Australia | Page 37
Appendix B – REVISED 2046 DEMOGRAPHY

Pakenham East Interchange Comparative Assessment
SMEC Australia | Page 38
Reference Area
General Description
ZONE Population Households Retail Employment
Total Employment
Primary School Enrolments
Secondary School Enrolments
Tertiary Ed. Enrolments
Comment
Pak
enh
am E
ast
Lan
d w
ith
in U
GB
eas
t of
Dee
p C
ree
k /
Rya
n R
oad
2178
18,850 6,500 467 870 900 1,200
Incorporates current estimated development outcome for Pakenham East PSP.
3026 NOTE: Preference to consolidate into single zone for GPTM Version 1.
3027
3028
3029
3030
3031 0
3034
3035
3036
3037
3038
3039
3040
TOTAL 18,850 6,500 467 870 900 1,200 0
Pak
enh
am S
out
h
All
Ind
ust
rial
so
uth
of
Pri
nce
s Fr
eew
ay, e
ast
of T
oo
mu
c C
reek
2179 0 0 0 1,600 0 0 0
2180 0 0 0 2,000 0 0 0
2181 0 0 0 4,000 0 0 0
2256 0 0 0 1,000 0 0 0
2259 0 0 0 2,000 0 0 0
2451 0 0 0 1,600 0 0 0
2452 0 0 0 1,600 0 0 0
2453 0 0 0 1,600 0 0 0
2454 0 0 0 1,000 0 0 0
2455 0 0 0 1,000 0 0 0
2456 0 0 0 1,000 0 0 0
TOTAL 0 0 0 18,400 0 0 0

Pakenham East Interchange Comparative Assessment
SMEC Australia | Page 39
Reference Area
General Description
ZONE Population Households Retail Employment
Total Employment
Primary School Enrolments
Secondary School Enrolments
Tertiary Ed. Enrolments
Comment
Cen
tre
East
Lan
d b
ou
nd
by
Rac
eco
urs
e R
oad
, rai
lway
line
, Rya
n
Ro
ad a
nd
Pri
nce
s H
igh
way
888 248 80 0 11 0 0 0
Maintains number of lots as presently exists (rounded to nearest 5) and allows for slight decrease in persons per household to 3.1 from 3.31
2100 1,827 739 5 149 0 0 0 Delete Primary School enrolments at 2046. No site exists
2176 915 345 3 106 0 0 0
2415 1,568 514 0 4 0 0 0
2416 41 14 0 15 0 0 0
2498 70 25 2 78 0 0 0 Maintains number of lots as presently exists (rounded to nearest 5) and allows for slight decrease in persons per household to 2.8 from 2.83
2499 222 85 0 2 0 0 0
2500 155 50 0 8 0 0 0 Maintains number of lots as presently exists (rounded to nearest 5) and allows for slight decrease in persons per household to 3.1 from 3.32
TOTAL 5,046 1,851 11 374 0 0 0
Cen
tre
No
rth
Lan
d n
ort
h o
f P
rin
ces
Hig
hw
ay b
etw
een
To
omu
c C
ree
k an
d D
eep
Cre
ek
883 1,192 495 7 162 0 0 0 Delete Primary School and Secondary School enrolments at 2046. No sites exist. No changes to job numbers for zone. Did not appear to have been taken into account.
2101 1,341 477 3 80 0 0 0
2164 638 254 3 81 0 0 0
2165 608 243 6 111 401 0 0
2166 663 252 3 79 0 0 0
2411 756 287 1 2 0 0 0
2412 1,012 362 3 83 511 0 0
2413 138 55 3 117 398 1,100 0 Maintains number of lots as presently exists (rounded to nearest 5) and allows for slight decrease in persons per household to 2.5 from 2.58
2501 1,059 425 7 143 0 0 0 Deleted Secondary School enrolments at 2046. No sites exist. No job allowance appeared to be made, thus no changes to job yield in zone
2502 264 105 2 33 0 0 0
2503 152 46 1 25 0 0 0
2504 16 0 0 7 0 0 0
2505 398 156 3 58 0 0 0
2506 834 303 2 64 0 0 0
2507 700 251 2 55 0 0 0
2510 398 151 1 25 0 0 0
2512 68 26 0 0 0 0 0
2513 382 145 1 42 450 0 0 Primary School added with ultimate enrolments at 2046. Site acquired by education department. 40 jobs added to total jobs in cell

Pakenham East Interchange Comparative Assessment
SMEC Australia | Page 40
Reference Area
General Description
ZONE Population Households Retail Employment
Total Employment
Primary School Enrolments
Secondary School Enrolments
Tertiary Ed. Enrolments
Comment
TOTAL 10,617 4,034 49 1,167 1,761 1,100 0
Cen
tre
Sout
h
Lan
d n
ort
h o
f th
e P
rin
ces
Free
way
bet
wee
n T
oo
mu
c C
ree
k an
d t
he
inte
rsec
tio
n o
f th
e P
rin
ces
Free
way
an
d t
he
rail
line
889 1,211 385 0 9 0 0 0
890 0 0 29 500 0 0 0 Assumed current level of job provision is at least maintained in the future (anticipating redevelopment into more jobs-intensive uses), rather than significant decline. Household and Population Numbers reduced to nil at 2046. Industrial land.
894 0 0 1 23 0 0 0 Household and Population Numbers reduced to nil at 2046. Industrial land.
2182 2,034 671 0 14 0 0 0 No assumption changes made.
2184 1,226 458 14 126 0 0 0
2254 949 364 0 8 0 0 0
2255 0 0 3 47 0 0 0
2258 8 3 8 73 0 0 0
2418 1,424 478 0 12 0 0 0
2419 0 0 0 0 399 0 0
2420 1,265 486 10 88 0 0 0
2421 211 86 3 26 0 0 0
2491 1,007 331 0 8 0 0 0
2492 787 322 10 85 0 0 0
2493 601 231 0 6 0 0 0
TOTAL 10,724 3,817 79 1,025 399 0 0
Cen
tre
Wes
t
Lan
d b
ou
nd
by
McG
rego
r R
oad
, P
rin
ces
Hig
hw
ay, T
oo
mu
c C
reek
and
th
e ra
il lin
e
2099 0 0 13 316 0 1,100 0
2174 700 280 6 193 0 0 0
2175 384 154 5 118 0 0 0
2489 462 186 5 124 0 0 0
2490 768 308 5 146 649 0 0
TOTAL 2,314 928 33 897 649 1,100 0
Far
East
East
of
Mt
Ara
rat
Ro
ad
2097 5 2 0 54 0 0 0
2409 8 3 0 31 0 0 0

Pakenham East Interchange Comparative Assessment
SMEC Australia | Page 41
Reference Area
General Description
ZONE Population Households Retail Employment
Total Employment
Primary School Enrolments
Secondary School Enrolments
Tertiary Ed. Enrolments
Comment
TOTAL 13 5 0 85 0 0 0
No
rth
Eas
t
No
rth
of
Pak
enh
am
East
Pre
cin
ct
877 68 27 0 31 0 0 0
2146 123 48 0 17 0 0 0
TOTAL 192 75 0 49 0 0 0
Sou
th E
ast
East
of
Pak
enh
am S
ou
th
ind
ust
rial
are
a
892 72 28 0 63 0 0 0
2122 63 25 0 166 450 220 0
2190 3 1 11 158 0 0 0
2408 8 3 1 21 0 0 0
TOTAL 145 57 11 409 450 220 0
Tow
n C
entr
e
Lan
d b
ou
nd
by
Pri
nce
s H
igh
way
, Rac
ecou
rse
Ro
ad, B
ald
Hill
s R
oad
/rai
l lin
e an
d M
cGre
gor
Ro
ad
887 2,945 950 350 525 0 0 0 Adjustment to allow for 950 households at 2046, with an average household size of 3. Retail employment numbers assume 10,000sqm retail floorspace and applied 50% additional to generate total jobs
2098 597 333 472 697 0 0 0 Employment figures modified to allow for an additional 5000sqm of retail and 9000sqm of non-retail commercial.
2177 728 414 107 100 0 0 0 Employment figures reduced to 100 (consistent with current estimated employment)
2257 0 0 13 300 0 0 0 Household and population figures reduced to nil at 2046. Existing industrial site with approximately 300 jobs. If it redevelops one would expect higher yield. Conservative estimate adopts equivalent numbers as for 2011 and 2046.
2494 459 240 2 58 0 0 0
2495 70 29 560 922 0 0 0 Retail and total employment figures increased to reflect existing total retail on site, maintained at 2046. 20% increase applied to accommodate upper storey development / diversification of zone.
2496 133 76 663 1,000 0 0 0 Retail and total employment figures increased to allow for additional 16,000sqm retail from 2011 to 2046 (new Woolworths Development not taken into consideration in 2011 figures. Allowance made for additional 2000sqm retail).
2497 591 314 0 478 0 0 0 Deletion of retail employment figures (reduced to 0 at 2046)
TOTAL 5,522 2,356 2,167 4,080 0 0 0
Wes
t
Lan
d in
Car
din
ia R
oad
Pre
cin
ct 878 0 0 18 334 0 0 0
885 1,530 609 0 44 0 0 0
2148 2,076 726 0 17 0 0 0
2170 152 58 210 315 0 0 0 Employment figures adjusted to allow for 6000sqm retail floorspace, plus 50% additional employment. Adjusted households in line with current figures.
2171 2,055 841 42 211 0 0 0 Adjusted households in line with current
2260 0 0 0 9,929 0 0 0 Adjusted employment in line with PSP land use budget

Pakenham East Interchange Comparative Assessment
SMEC Australia | Page 42
Reference Area
General Description
ZONE Population Households Retail Employment
Total Employment
Primary School Enrolments
Secondary School Enrolments
Tertiary Ed. Enrolments
Comment
2261 0 0 280 780 405 452 0 Employment figures adjusted to allow for 8000sqm retail floorspace, plus 20000 non-retail floorspace.
2262 0 0 17 80 0 0 0
2264 48 19 8 141 0 0 0
2422 4,512 1,628 0 44 0 0 0 Adjusted households in line with current provision
2423 2,114 811 49 70 0 0 0 Deletion of Primary School from zone. Addition of Edenbrook NCC (1400sqm retail) and associated adjustments to retail and total employment figures.
2424 2,470 950 0 36 450 1,200 0 Addition of Primary School and Secondary School to zone. Modification of housing assumptions to provide for double the growth in Zone 2424 compared to Zone 2423 from 2011 to 2046. Application of original persons per household figure (2.6) to calculate population yield.
2437 901 321 0 2 0 0 0
2439 829 318 0 2 0 0 0
2458 0 0 0 922 0 0 0
2484 43 15 1 8 0 0 0
2485 1,102 435 0 42 450 0 0 Addition of Primary School as per current situation.
2486 4 2 4 82 0 0 0
2487 367 141 6 106 0 0 0
TOTAL 18,202 6,874 634 13,164 1,305 1,652 0
Pakenham East Interchange Comparative Assessment
SMEC Australia | Page 43
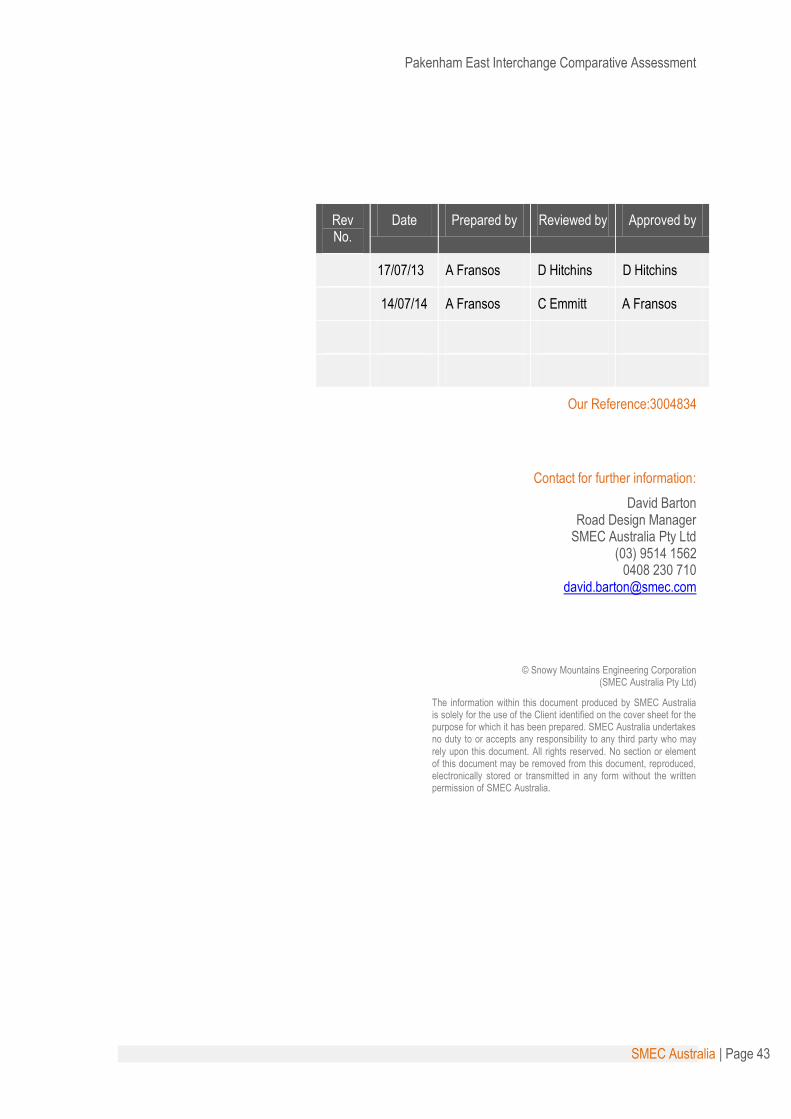
Our Reference:3004834
Contact for further information:
David Barton Road Design Manager
SMEC Australia Pty Ltd (03) 9514 1562
0408 230 710 [email protected]
© Snowy Mountains Engineering Corporation (SMEC Australia Pty Ltd)
The information within this document produced by SMEC Australia is solely for the use of the Client identified on the cover sheet for the purpose for which it has been prepared. SMEC Australia undertakes no duty to or accepts any responsibility to any third party who may
rely upon this document. All rights reserved. No section or element of this document may be removed from this document, reproduced, electronically stored or transmitted in any form without the written permission of SMEC Australia.
Rev No.
Date Prepared by Reviewed by Approved by
17/07/13 A Fransos D Hitchins D Hitchins
14/07/14 A Fransos C Emmitt A Fransos