PAK BENG HYDROPOWER PROJECT - Mekong River …€¦ · · 2017-01-17LIST OF TABLES . Table Title...
68
PAK BENG HYDROPOWER PROJECT Hydraulic Physical Model Investigation of Filling and Emptying System September 2015
Transcript of PAK BENG HYDROPOWER PROJECT - Mekong River …€¦ · · 2017-01-17LIST OF TABLES . Table Title...
PAK BENG HYDROPOWER PROJECT
Hydraulic Physical Model Investigation of Filling and
Emptying System
September 2015

Hydraulic Physical Model Investigation of Filling and Emptying System
i
CONTENTS
Page
1 PREFACE ............................................................................................................. - 1 -
2 DESIGN FEATURES ............................................................................................ - 1 -
2.1 NAVIGABLE WATER LEVEL .............................................................. - 1 -
2.2 LOCKAGE VESSEL .............................................................................. - 1 -
2.3 OTHERS ................................................................................................ - 1 -
3 FILLING AND EMPTYING SYSTEM DESIGN .................................................. - 2 -
3.1 TYPE SELECTION ................................................................................ - 2 -
3.2 LAYOUT AND DIMENSIONS .............................................................. - 2 -
4 EXPERIMENTAL CONTENTS AND STANDARDS ........................................... - 9 -
4.1 RESEARCH CONTENTS ....................................................................... - 9 -
4.2 FOLLOWING STANDARDS ................................................................. - 9 -
5 MODEL AND INSTRUMENTATION ................................................................ - 10 -
5.1 PHYSICAL MODEL DESIGN. ............................................................. - 10 -
5.2 APPURTENANCES AND INSTRUMENTATION ................................ - 12 -
6 HYDRAULIC CHARACTERISTICS OF FILLING AND EMPTYING .............. - 14 -
6.1 THE DESIGN WORKING HEAD......................................................... - 14 -
6.2 THE MIN UPSTREAM AND DOWNSTREAM WATER LEVEL ......... - 23 -
7 MOORING CONDITIONS IN LOCK CHAMBER ............................................. - 31 -
8 PRESSURES AND COEFFICIENT .................................................................... - 41 -
8.1 PRESSURES IN CULVERT SYSTEM ................................................. - 41 -
8.2 COEFFICIENTS ................................................................................... - 54 -
9 FLOW CONDITIONS IN LOCK APPROACHES ............................................... - 55 -
9.1 INTAKE MANIFOLD .......................................................................... - 55 -

Hydraulic Physical Model Investigation of Filling and Emptying System
ii
9.2 OUTLET .............................................................................................. - 56 -
10 CONCLUSION ................................................................................................... - 59 -

Hydraulic Physical Model Investigation of Filling and Emptying System
iii
LIST OF TABLES
Table Title Page
Table 3.1 Characteristic dimensions of filling and emptying system .................... - 4 -
Table 6.1 Hydraulic characteristics of lock filling and emptying (Head=32.38m ) ................................................................................... - 15 -
Table 6.2 Hydraulic characteristics of lock filling and emptying(lift) ................ - 24 -
Table 7.1 Hawser forces of 500t vessel in chamber ( two-valves operation) ...... - 32 -
Table 7.2 Hawser forces of 500t vessel in chamber (one-valve operation) ......... - 33 -
Table 8.1 Average steady flow pressure with two-valves filling(tv=6min) ......... - 45 -
Table 8.2 Average steady flow pressure with one-valve filling (tv=6min) ......... - 46 -
Table 8.3 Average pressure steady flow with two-valves emptying (tv=6min) .. - 47 -
Table 8.4 Average steady flow pressure with one-valve emptying (tv=6min) .... - 48 -
Table 8.5 Pressures at two sides of bifurcation.................................................... - 49 -
Table 8.6 Head loss coefficient of culvert for lock-filling ................................... - 54 -
Table 8.7 Head loss coefficient of culvert for lock-emptying ............................. - 54 -
Table 8.8 Lock-filling coefficients for various valve opening ............................ - 54 -
Table 8.9 Lock-emptying coefficients for various valve opening ....................... - 55 -
Table 9.1 Velocities in downstream approach for final layout ............................ - 57 -

Hydraulic Physical Model Investigation of Filling and Emptying System
iv
LIST OF FIGURES
Figure Title Page
Fig. 3.1 Layout of filling and emptying system(unit: m) .............................. - 5 -
Fig. 3.2 Intake manifold of upper lock head ....................................................... - 6 -
Fig. 3.3 Layout of main culvert and lock chamber manifold(Unit: m, Elev: m) - 7 -
Fig. 3.4 Bifurcation of conduit system (Unit: m, Elev: m) ................................. - 8 -
Fig. 3.5 Chamber discharge ports and energy dissipation ................................... - 8 -
Fig. 5.1 General view of model ......................................................................... - 10 -
Fig. 5.2 Culverts system under the chamber bottom ......................................... - 11 -
Fig. 5.3 Chamber and discharge port ................................................................ - 12 -
Fig. 5.4 Filling valve culvert ............................................................................. - 12 -
Fig. 5.5 Measuring instrument and valves operation system ............................ - 13 -
Fig. 6.1 Variation of filling time with valve opening time ................................ - 17 -
Fig. 6.2 Discharge and valve opeing time ......................................................... - 18 -
Fig. 6.3 Filling characteristic curve with two-valves ........................................ - 19 -
Fig. 6.4 Emptying characteristic curve with two-valves ................................... - 20 -
Fig. 6.5 Filling characteristic curve with one valve .......................................... - 21 -
Fig. 6.6 Emptying characteristic curve with one valve ..................................... - 22 -
Fig. 6.7 Variation of filling time with valve opening time ................................ - 25 -
Fig. 6.8 Discharge and valve opening time ....................................................... - 26 -
Fig. 6.9 Filling characteristic curve with two-valves ........................................ - 27 -
Fig. 6.10 Emptying characteristic curve with two-valves ................................... - 28 -
Fig. 6.11 Filling characteristic curve with one valve .......................................... - 29 -
Fig. 6.12 Emptying characteristic curve with one valve ..................................... - 30 -
Fig. 7.1 Vessel free drifting experiment ............................................................ - 31 -
Fig. 7.2 Relation of hawser forces and valve opening time .............................. - 34 -
Hydraulic Physical Model Investigation of Filling and Emptying System
v
Fig. 7.3 Hawser forces curve of 500t vessel moored in head of chamber ........ - 35 -
Fig. 7.4 Hawser forces curve of 500t vessel moored in middle of chamber ..... - 36 -
Fig. 7.5 Hawser forces curve of 500t vessel moored in tail of chamber ........... - 37 -
Fig. 7.6 Hawser forces curve of 500t vessel moored in head of chamber ........ - 38 -
Fig. 7.7 Hawser forces curve of 500t vessel moored in middle of chamber ..... - 39 -
Fig. 7.8 Hawser forces curve of 500t vessel moored in tail of chamber ........... - 40 -
Fig. 8.1 Pressure piezometer locations for measuring steady flow ................... - 43 -
Fig. 8.2 Pressure cell location at culvert roof for unsteady flow ...................... - 44 -
Fig. 8.3 Pressure curves of unsteady flow for lock filling with two-valves...... - 50 -
Fig. 8.4 Pressure curves of unsteady flow for lock emptying with two-valves - 51 -
Fig. 8.5 Pressure curves of unsteady flow for lock filling with one-valve ....... - 52 -
Fig. 8.6 Pressure curves of unsteady flow for lock emptying with one-valve operation .............................................................................................. - 53 -
Fig. 9.1 Surface vortices above intake without eddy-eliminating beams ......... - 55 -
Fig. 9.2 Final layout of upper intake with eddy-eliminating beams ................. - 56 -
Fig. 9.3 Final layout of outlet ............................................................................ - 57 -
Fig. 9.4 Velocity meter locations in drownstream approach ............................. - 58 -
Fig. 10.1 Final layout of filling and emptying system for Pak Beng navigation lock....................................................................................................... - 61 -

Hydraulic Physical Model Investigation of Filling and Emptying System
- 1 -
1 PREFACE
Pak Beng Hydropower Project (PHP) is the first cascade hydropower station planned on the mainstream of Meikong River in the Lao PDR. It is situated at Pak Beng District, Oudomxay Province. It is a hydropower project with comprehensive utilization functions. The PHP is consisted of sluices, power units, dam, lock, fishway and other buildings, the navigation lock is one of important structures in the project.
The maximum initial head of Pak Beng lock reached 32.38m, the hydraulic problems of filling and emptying will be vast complex and important. Purpose of the physical model experiments were conducted to check the suitability of the original design hydraulic filling and emptying system, and to develop, if possible, improvements in the system.
2 Design Features
2.1 NAVIGABLE WATER LEVEL
Max upstream navigable water level: EL.340m
Min upstream navigable water level: EL.334m
Max downsteam navigable water level: EL.329.38m
Min downsteam navigable water level: EL.307.62m
Thus the maximum initial water head will be 32.38m for study on lock filling characteristics, but for study on flow conditions in upstream approach, the min upper water-level 334m must be considered, combine with the downstream min water level 307.62m, the initial water head will be 26.38m.
2.2 LOCKAGE VESSEL
Type of vessel: cargo steamer
Vessel size(length ×width×draft):65m×10.8m×2m
Displacement: 500 t;
2.3 OTHERS
Filling/Emptying time:10—12 min
Longitudinal hawser force ≤25kN

Hydraulic Physical Model Investigation of Filling and Emptying System
- 2 -
Transverse hawser force ≤13kN
Filling/Emptying Overtravel≤25cm
3 Filling and Emptying System Design
3.1 TYPE SELECTION
According the Chinese Code (2001) for filling and emptying system of shiplocks (JTJ306-2001), the value of M could be used to choose the relevant types of the filling and emptying system.
HTm =
in which, H is the lift height of lock, m; T is the time to fill the chamber, min. The following values were derived from Chinese Code (JTJ306-2001) for choosing filling and emptying system:
3.5<M through heads system
2.5<M<3.5 through heads system or simple longitudinal culvert system
2.4<M simple longitudinal culvert system
1.8<M<2.4 a more complex longitudinal culvert system
M<1.8 a rather/very complex (advanced) longitudinal culvert system
The value M of Pak Beng lock with 32.38m lift head and 10-12min filling time is very about 1.76-2.11. According to the design code, a complex culvert system had to been selected. Combined with the geological conditions of Pak Beng lock site, the experimental results and experience of Yinpan lock which has similar lift height and chamber dimension with Pak Beng lock, a two-section dynamically balanced lock filling system with wall culvert and vertical bifurcation at midpoint of chamber, longitudinal manifolds with energy dissipation ditch in chamber was selected for Pak Beng lock.
3.2 LAYOUT AND DIMENSIONS
The area of culvert at valve section is calculated by the following equation:
( )[ ]vkgTddHC
αµω
−−−+⋅
=112
)(2 (3.1)

Hydraulic Physical Model Investigation of Filling and Emptying System
- 3 -
Where: ω—area of culvert at valve section,m2; C —area of chamber, m2; H — initial head, m; d –overtravel, m; μ—lock coefficient; T – filling time, s; α—a constant;kv, a constant 0.4—0.6; g -- acceleration due to gravity, m/s2.
For Pak Beng lock: C=130.0×12.0=1560m2, H=32.38m, T=10~12min=600-720s, d=0.40 m, μ=0.68, =0.46,kv=0.5:
( )[ ].206.40111.892720~600.680).40.408.332(15602
×−−×××−+××
=)(
ω =12.04~10.03 m2
So it was determined to set two culverts, each culvert cross section was 2.2m×2.6m( width × height), the total area of culverts were 11.44m2.
The filling and emptying system was used reverse tainter valves for flow control, the top and bottom elevation of culvert at filling/emptying valve section were 294.62m and 292.02m, the submergence depth of the culverts were 13.0m. To restrain valve cavitation, an optimization of culvert configuration, behind valves abrupt enlargement in bottom and roof-- enlargement culver, is adopted. The dimensions of enlargement culvert were 17.5 m long by 6.8 m high, bottom elevation was 290.02m. The detail information refereneces the physical model report of the valve culvert section.
In upper stream channel, the wall intake with 8 inlet orifices and 4 orifices on each side wall was adopted, the top elevation and dimension of orifices was 320.30m and 3.0m×3.3m (width × height), the max submerged depth of orifices was 19.70m.
In downstream channel, the energy dissipation chamber with top outlet grille and two deflecting sills in the chamber was designed. The top elevation of grille was same with channel bottom, and dimensiones of grilles were 2 rows, 20 holes per row and 2.2×0.6 m per hole.
The characteristic dimensions of filling and emptying system were listed in Tab.3.1, the layout and detail structure were showed in Fig.3.1 — Fig.3.5.

Hydraulic Physical Model Investigation of Filling and Emptying System
- 4 -
Table 3.1 Characteristic dimensions of filling and emptying system
No. Section Description Dimension
(m2)
Area rate
(Section/valve)
1 Intake the wall intake manifolds with 8 inlet orifices and 4 orifices on each side wall
2~4×3.0×3.3=79.2 6.92
2 Valve
The reversed tainter valve, the culvert with top and botoom abrupt enlargement behind valve the submergence depth of the valve is 13.0m
2~2.2×2.6=11.44 1.00
3 Culvert in
wall The bottom elevation is 298.32m, the distance to chamber wall is 5.0m
2~2.2×3.3=14.52 1.27
4 Main
bifurcation
A vertical bifurcation under the chamber floor and located in the midpoint of chamber
4~3.6×1.5=21.6 1.89
5 Culvert under chamber floor
Under the chamber floor and connected with bifurcation, the bottom elevation is 298.32 m
2~3.6×3.0=21.6 1.89
6 Manifolds in
chamber
Longitudinal manifolds with energy dissipation ditch, two-section,very section have 14 outlet pipes, the distance of two pipes is 6m.
2~14×0.5×1.4=19.6
1.71
7 Outlet Energy dissipation chamber with top outlet grille and two deflecting sills in the chamber
2~10×3.5×0.60=42.00
3.67

Hydraulic Physical Model Investigation of Filling and Emptying System
- 5 -
Fig. 3.1 Layout of filling and emptying system(unit: m)
立面布置图
平面布置图
A
A
B
B
B
B

Hydraulic Physical Model Investigation of Filling and Emptying System
- 6 -
Fig. 3.2 Intake manifold of upper lock head

Hydraulic Physical Model Investigation of Filling and Emptying System
- 7 -
Fig. 3.3 Layout of main culvert and lock chamber manifold(Unit: m, Elev: m)
B
B
B
B
立面布置图

Hydraulic Physical Model Investigation of Filling and Emptying System
- 8 -
Fig. 3.4 Bifurcation of conduit system (Unit: m, Elev: m)
Fig. 3.5 Chamber discharge ports and energy dissipation
(Unit: m, Elev: m)
Hydraulic Physical Model Investigation of Filling and Emptying System
- 9 -
4 Experimental Contents and Standards
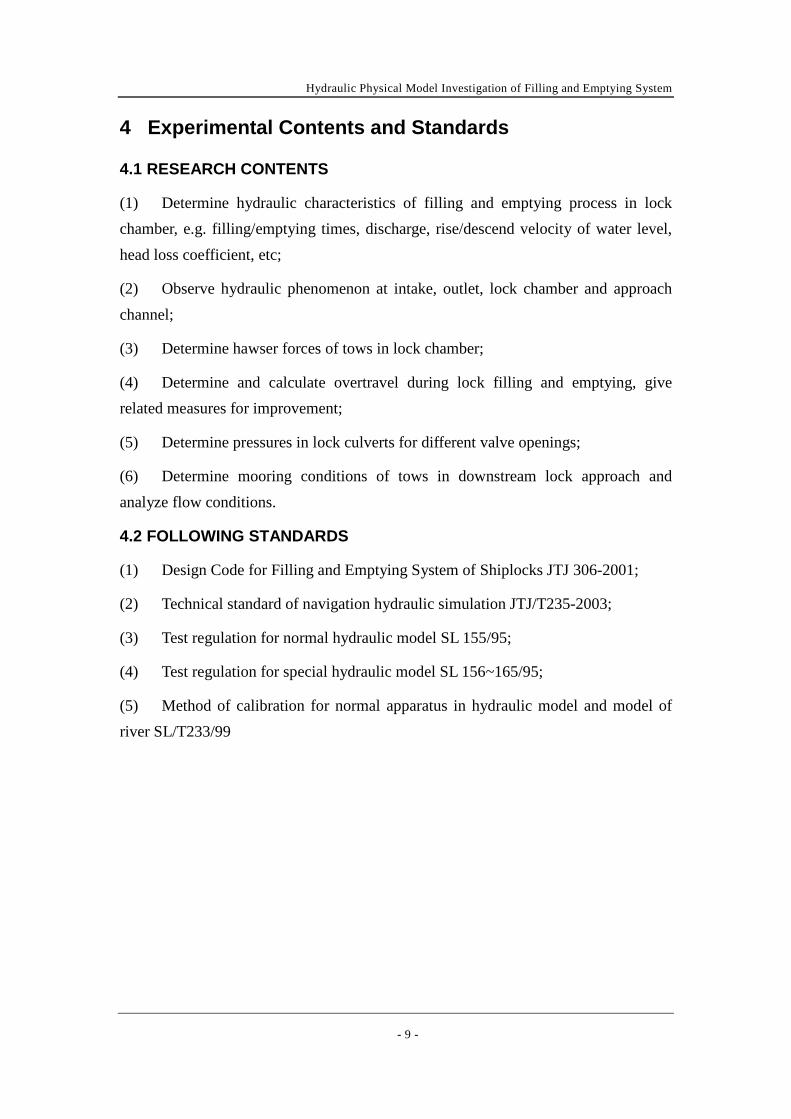
4.1 RESEARCH CONTENTS
(1) Determine hydraulic characteristics of filling and emptying process in lock chamber, e.g. filling/emptying times, discharge, rise/descend velocity of water level, head loss coefficient, etc;
(2) Observe hydraulic phenomenon at intake, outlet, lock chamber and approach channel;
(3) Determine hawser forces of tows in lock chamber;
(4) Determine and calculate overtravel during lock filling and emptying, give related measures for improvement;
(5) Determine pressures in lock culverts for different valve openings;
(6) Determine mooring conditions of tows in downstream lock approach and analyze flow conditions.
4.2 FOLLOWING STANDARDS
(1) Design Code for Filling and Emptying System of Shiplocks JTJ 306-2001;
(2) Technical standard of navigation hydraulic simulation JTJ/T235-2003;
(3) Test regulation for normal hydraulic model SL 155/95;
(4) Test regulation for special hydraulic model SL 156~165/95;
(5) Method of calibration for normal apparatus in hydraulic model and model of river SL/T233/99

Hydraulic Physical Model Investigation of Filling and Emptying System
- 10 -
5 MODEL AND INSTRUMENTATION
5.1 PHYSICAL MODEL DESIGN.
A model of the entire lock hydraulic system was constructed to a scale of 1:25. The general relations for transference of model data to prototype equivalents are presented in the following:
Length rL = 25 Area 2
rL =625
Velocity 1/2
rL =5 Time 1/2
rL =5
Discharge 5/2
rL =3125 Force 3
rL =15625
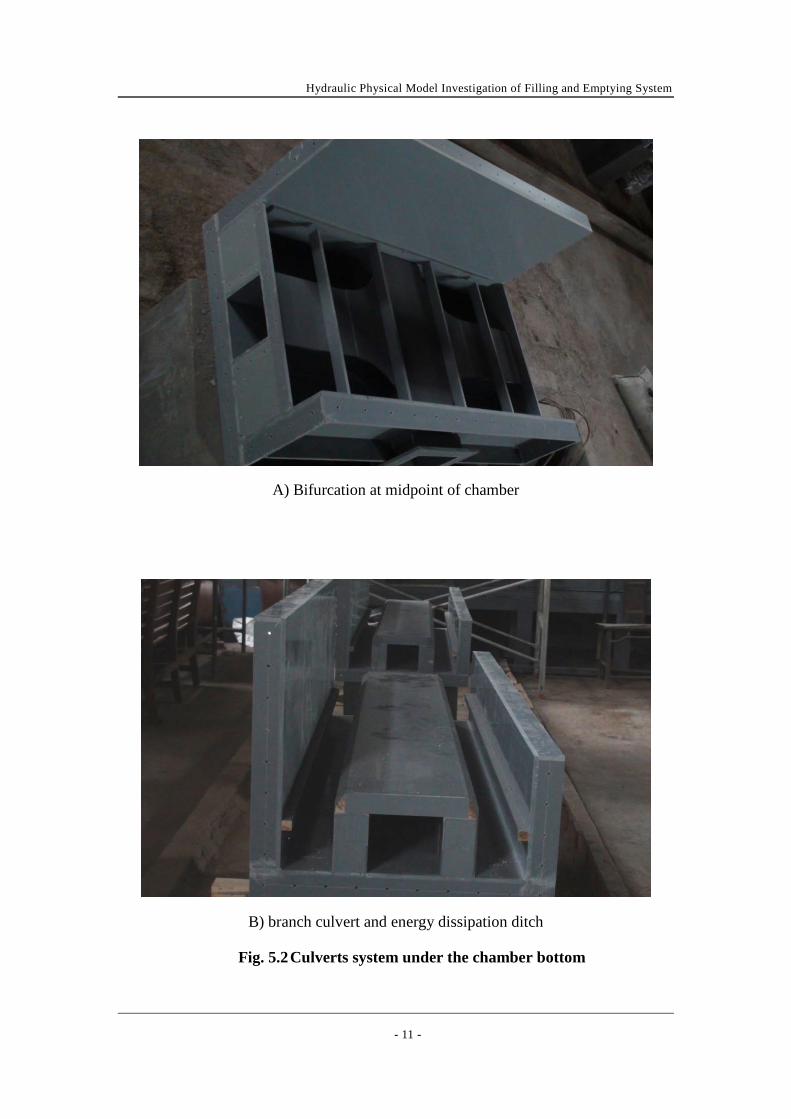
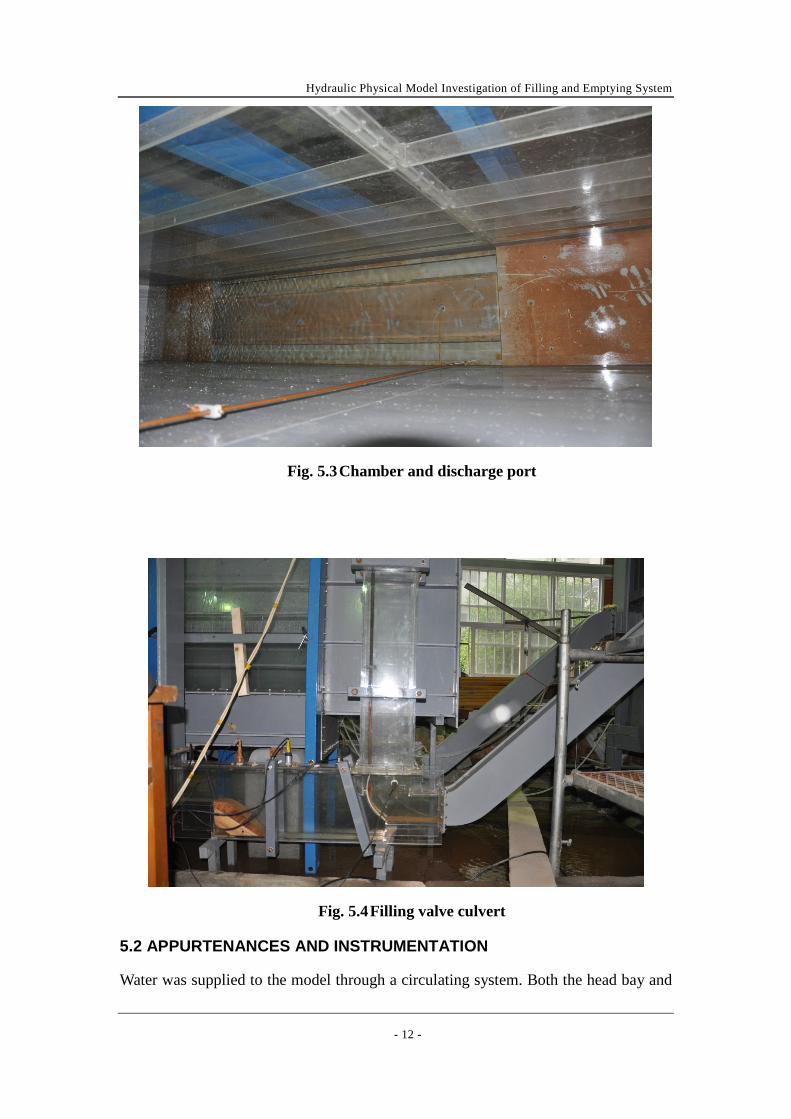
The lock hydraulic system model was included the partial upstream approach, upper intake manifolds, lock chamber and bottom discharge manifolds, culverts, outlet with energy dissipation and partial downstream approach. In the model, the one side of lock wall were constructed by steel plate, another side were constructed by plastic glass; Chamber discharge ports, energy dissipation, culvert, approach were constructed by polyvinyl chloride plate. For more clear observation valve sections of culvert were constructed of plastic glass. The models were shown on Fig.5.1 - Fig.5.4.
Fig. 5.1 General view of model
Hydraulic Physical Model Investigation of Filling and Emptying System
- 11 -
A) Bifurcation at midpoint of chamber
B) branch culvert and energy dissipation ditch
Fig. 5.2 Culverts system under the chamber bottom
Hydraulic Physical Model Investigation of Filling and Emptying System
- 12 -
Fig. 5.3 Chamber and discharge port
Fig. 5.4 Filling valve culvert
5.2 APPURTENANCES AND INSTRUMENTATION
Water was supplied to the model through a circulating system. Both the head bay and

Hydraulic Physical Model Investigation of Filling and Emptying System
- 13 -
tail bay of lock model contained skimming weirs that maintained essentially constant upper and lower pools during filling and emptying operations. Culvert valve drive mechanisms accurately controlled the rate at which the valves opened. The drive was powered by a stepping motor. Pressures cells were used to measure instantaneous pressures at selected locations in the culvert system and to record water surface in the lock chamber. Pressures measured with steady flow were determined by piezometers. Hawser forces of tows were measured by a Hawser-pull measuring device with resistance rings fabricated by NHRI.
Velocity in lock approaches was measured by 3D-ADV. At the end of tail bay there is a rectangular weir 60cm width used for measuring steady flow discharge during lock filling and emptying operations. All measured data were colleted and processed by microcomputer system.
Fig. 5.5 Measuring instrument and valves operation system

Hydraulic Physical Model Investigation of Filling and Emptying System
- 14 -
6 HYDRAULIC CHARACTERISTICS OF FILLING AND
EMPTYING
6.1 THE DESIGN WORKING HEAD
For the design working head H=32.38m (water level: 340.00m-307.62m), the hydraulic characteristics of lock filling and emptying were measured on physical model. The results including lock chamber water level, discharge, filling/emptying time and so on were shown on the Tab.6.1 and Fig 6.3-Fig 6.6.
Analysing the measured results, the lock was operated with two-valves and valve opening time tv<7min, the filling and empyting times all will be less then 12min.
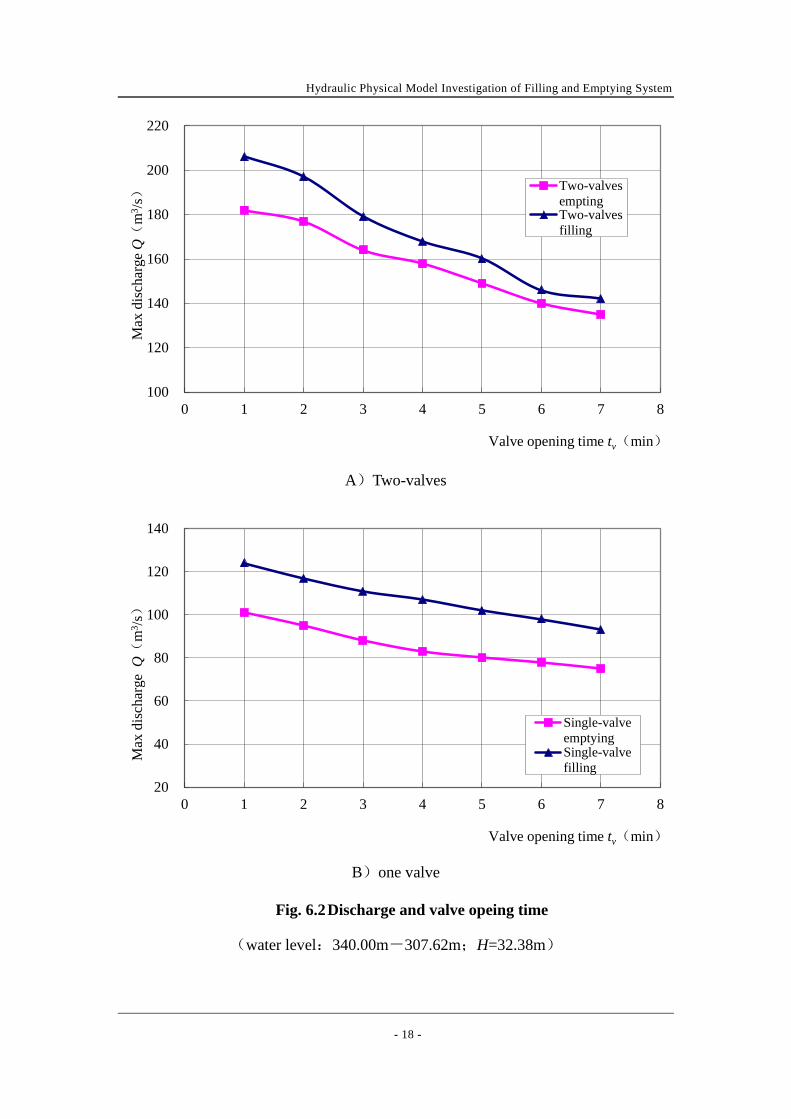
The two-valves operation and tv=6min, the filling and empyting time were 10.60 min and 11.16 min, the max discharge were 98m3/s and 78m3/s, the max average velocity were 10.1m/s and 9.6m/s in culvert cross section, 7.2m/s and 6.9m/s in bifurcation cross section. The various velocities were conformed to the china’s design code requirements.
The single-valve operation and tv=6min, the lock filling and empyting time were 18.10min and 20.13min, the max discharge were 146m3/s and 140m3/s, the max average velocity were 13.5 m/s and 10.7 m/s in culvert cross section.

Hydraulic Physical Model Investigation of Filling and Emptying System
- 15 -
Table 6.1 Hydraulic characteristics of lock filling and emptying (Head=32.38m )
Valve operation tv
(min) H(m) T(min)
Qmax
(m3/s)
V1
(m/s)
V2
(m/s)
U
(m/min)
Filling
Two valves
1 32.38 7.96 206 14.2 10.2 6.96
2 32.38 8.64 197 13.6 9.8 6.66
3 32.38 9.20 179 12.3 8.9 6.05
4 32.38 9.53 168 11.6 8.3 5.68
5 32.38 10.05 160 11.0 7.9 5.41
6 32.38 10.60 146 10.1 7.2 4.93
7 32.38 11.12 142 9.8 7.0 4.80
One valve
1 32.38 15.01 124 17.1 12.3 4.19
2 32.38 15.89 117 16.1 11.6 3.95
3 32.38 16.48 111 15.3 11.0 3.75
4 32.38 17.04 107 14.7 10.6 3.61
5 32.38 17.53 102 14.0 10.1 3.45
6 32.38 18.10 98 13.5 9.7 3.31
7 32.38 18.53 93 12.8 9.2 3.14
Emptying
Two valves
1 32.38 8.73 182 12.5 9.0 6.15
2 32.38 9.30 177 12.2 8.8 5.98
3 32.38 9.89 164 11.3 8.1 5.54
4 32.38 10.22 158 10.9 7.8 5.34
5 32.38 10.66 149 10.3 7.4 5.03
6 32.38 11.16 140 9.6 6.9 4.73
7 32.38 11.63 135 9.3 6.7 4.56
One valve
1 32.38 17.67 101 13.9 10.0 3.41
2 32.38 18.19 95 13.1 9.4 3.21
3 32.38 18.60 88 12.1 8.7 2.97
4 32.38 19.06 83 11.4 8.2 2.80
5 32.38 19.50 80 11.0 7.9 2.70
6 32.38 20.13 78 10.7 7.7 2.64
7 32.38 20.69 75 10.3 7.4 2.53
Hydraulic Physical Model Investigation of Filling and Emptying System
- 16 -
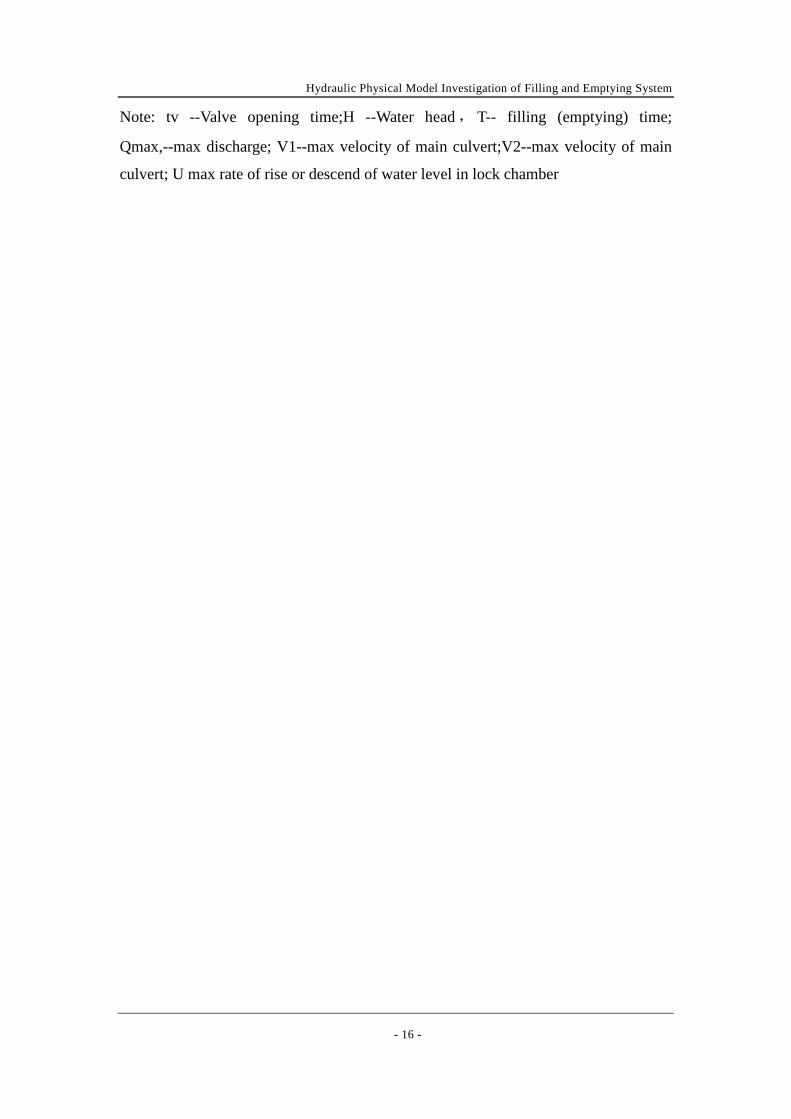
Note: tv --Valve opening time;H --Water head , T-- filling (emptying) time;
Qmax,--max discharge; V1--max velocity of main culvert;V2--max velocity of main
culvert; U max rate of rise or descend of water level in lock chamber

Hydraulic Physical Model Investigation of Filling and Emptying System
- 17 -
A)Two-valves
B)one valve
Fig. 6.1 Variation of filling time with valve opening time
(water level:340.00m-307.62m;H=32.38m)
6
7
8
9
10
11
12
0 1 2 3 4 5 6 7 8
Filli
ng/e
mpt
ying
tim
e T(
min)
Valve opening time tv(min)
Two-valvesemptingTwo-valvesfilling
10
12
14
16
18
20
22
0 1 2 3 4 5 6 7 8
Filli
ng/e
mpt
ying
tim
e T(
min)
Valve opening time tv(min)
Single-valveemptyingSingle-valvefilling
Hydraulic Physical Model Investigation of Filling and Emptying System
- 18 -
A)Two-valves
B)one valve
Fig. 6.2 Discharge and valve opeing time
(water level:340.00m-307.62m;H=32.38m)
100
120
140
160
180
200
220
0 1 2 3 4 5 6 7 8
Max
dis
char
ge Q(
m3 /s
)
Valve opening time tv(min)
Two-valvesemptingTwo-valvesfilling
20
40
60
80
100
120
140
0 1 2 3 4 5 6 7 8
Max
dis
char
ge Q
(m
3 /s)
Valve opening time tv(min)
Single-valveemptyingSingle-valvefilling

Hydraulic Physical Model Investigation of Filling and Emptying System
- 19 -
Fig. 6.3 Filling characteristic curve with two-valves
(water level:340.00m-307.62m;H=32.38m;tv=6min)

Hydraulic Physical Model Investigation of Filling and Emptying System
- 20 -
Fig. 6.4 Emptying characteristic curve with two-valves
(water level:340.00m-307.62m, H=32.38m, tv=6min)

Hydraulic Physical Model Investigation of Filling and Emptying System
- 21 -
Fig. 6.5 Filling characteristic curve with one valve
(water level:340.00m-307.62m, H=32.38m, tv=6min)

Hydraulic Physical Model Investigation of Filling and Emptying System
- 22 -
Fig. 6.6 Emptying characteristic curve with one valve
(water level:340.00m-307.62m,H=32.38m,tv=6min)
Hydraulic Physical Model Investigation of Filling and Emptying System
- 23 -
6.2 THE MIN UPSTREAM AND DOWNSTREAM WATER LEVEL
For water head H=26.38m, corresponding the min upstream and downstream water level (334.00m-307.62m), the hydraulic characteristics of lock filling and emptying also were measured on physical model. The results including lock chamber water level, filling/emptying time, discharge and so on were shown on the Tab.6.2 and Fig.6.7-Fig.6.12.
The two-valves operation and tv=6min, the filling and empyting time were 9.87min and 10.24min, the max discharge were 129m3/s and 124m3/s, the max average velocity were 8.9m/s and 8.5m/s in culvert cross section, 6.4m/s and 6.2m/s in bifurcation cross section.
The single-valve operation and tv=6min, the filling and empyting time were 16.04min and 17.77min, the max discharge were 85m3/s and 78m3/s, the max average velocity were 11.7 m/s and 10.7 m/s in culvert cross section.

Hydraulic Physical Model Investigation of Filling and Emptying System
- 24 -
Table 6.2 Hydraulic characteristics of lock filling and emptying(lift)
Filling mode tv
(min) H(m) T(min)
Qmax
(m3/s)
V1
(m/s)
V2
(m/s)
U
(m/min)
Filling
Double side
1 26.38 7.38 183 12.6 9.1 6.18
2 26.38 7.82 174 12.0 8.6 5.88
3 26.38 8.32 161 11.1 8.0 5.44
4 26.38 8.93 149 10.3 7.4 5.03
5 26.38 9.34 140 9.6 6.9 4.73
6 26.38 9.87 129 8.9 6.4 4.36
7 26.38 10.34 117 8.1 5.8 3.95
one side
1 26.38 13.75 99 13.6 9.8 3.34
2 26.38 14.21 97 13.4 9.6 3.28
3 26.38 14.86 95 13.1 9.4 3.21
4 26.38 15.15 93 12.8 9.2 3.14
5 26.38 15.7 90 12.4 8.9 3.04
6 26.38 16.04 85 11.7 8.4 2.87
7 26.38 16.63 80 11.0 7.9 2.70
Emptying
Double side
1 26.38 7.88 168 11.6 8.3 5.68
2 26.38 8.34 156 10.7 7.7 5.27
3 26.38 8.82 150 10.3 7.4 5.07
4 26.38 9.29 141 9.7 7.0 4.76
5 26.38 9.81 135 9.3 6.7 4.56
6 26.38 10.24 124 8.5 6.2 4.19
7 26.38 10.73 117 8.1 5.8 3.95
One side
1 26.38 15.46 90 12.4 8.9 3.04
2 26.38 15.92 87 12.0 8.6 2.94
3 26.38 16.37 83 11.4 8.2 2.80
4 26.38 16.8 82 11.3 8.1 2.77
5 26.38 17.32 80 11.0 7.9 2.70
6 26.38 17.77 78 10.7 7.7 2.64
7 26.38 18.28 76 10.5 7.5 2.57

Hydraulic Physical Model Investigation of Filling and Emptying System
- 25 -
A)Two-valves
B)one valve
Fig. 6.7 Variation of filling time with valve opening time
(water level:334.00m-307.62m, H=32.38m)
6
7
8
9
10
11
12
0 1 2 3 4 5 6 7 8
Filli
ng/e
mpt
ying
tim
e T(
min)
Valve opening time tv(min)
Two-valvesemptingTwo-valvesfilling
10
12
14
16
18
20
22
0 1 2 3 4 5 6 7 8
Filli
ng/e
mpt
ying
tim
e T(
min)
Valve opening time tv(min)
Single-valveemptyingSingle-valvefilling
Hydraulic Physical Model Investigation of Filling and Emptying System
- 26 -
A)Two-valves
B)one valve
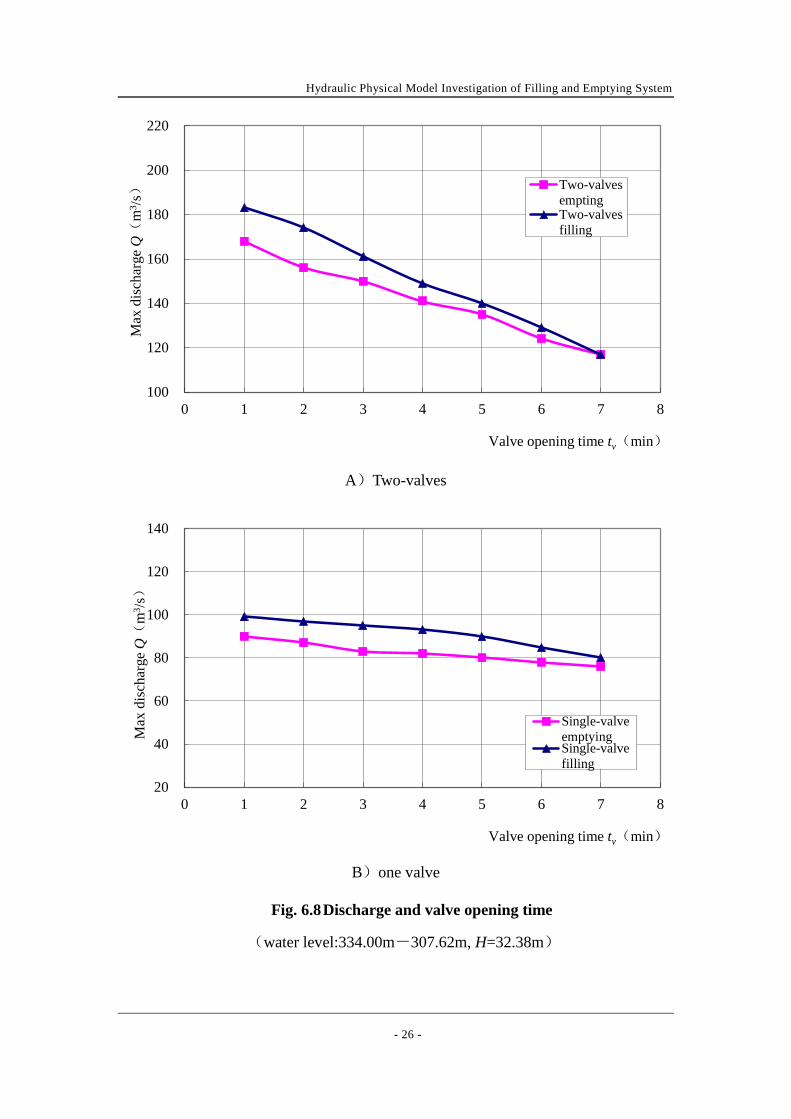
Fig. 6.8 Discharge and valve opening time
(water level:334.00m-307.62m, H=32.38m)
100
120
140
160
180
200
220
0 1 2 3 4 5 6 7 8
Max
dis
char
ge Q(
m3 /s
)
Valve opening time tv(min)
Two-valvesemptingTwo-valvesfilling
20
40
60
80
100
120
140
0 1 2 3 4 5 6 7 8
Max
dis
char
ge Q(
m3 /s
)
Valve opening time tv(min)
Single-valveemptyingSingle-valvefilling

Hydraulic Physical Model Investigation of Filling and Emptying System
- 27 -
Fig. 6.9 Filling characteristic curve with two-valves
(water level:334.00m-307.62m, H=26.38m, tv=6min)
Hydraulic Physical Model Investigation of Filling and Emptying System
- 28 -
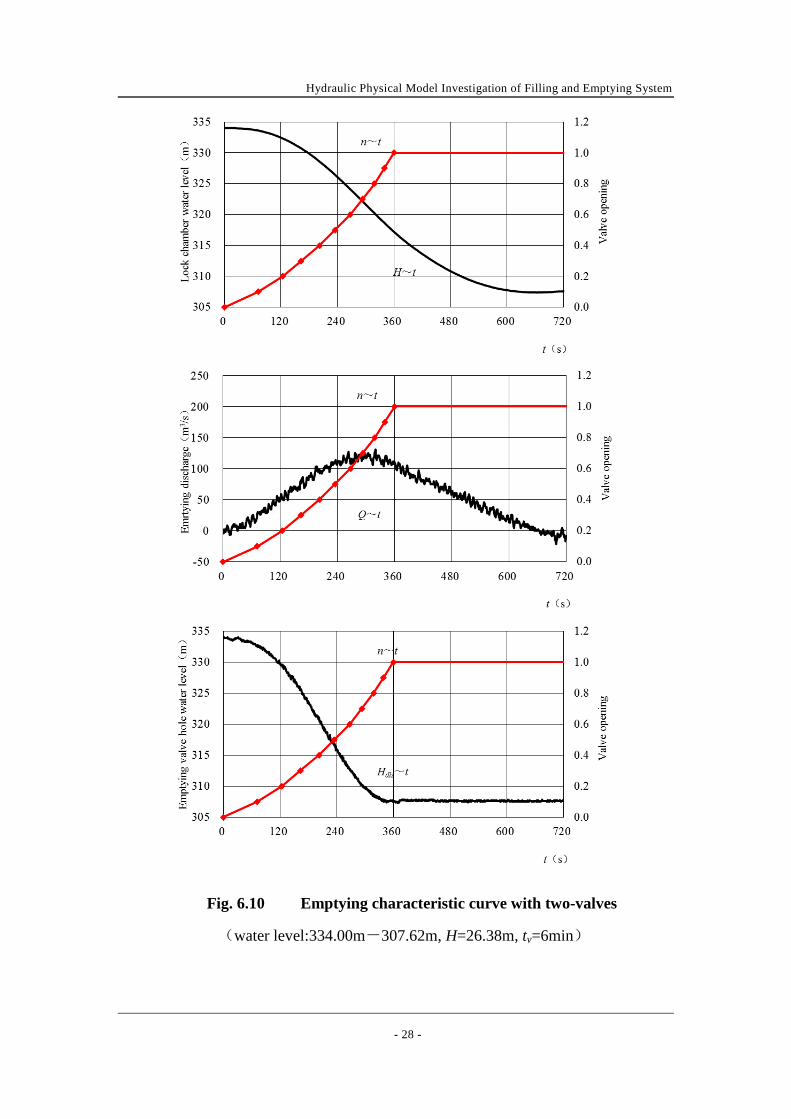
Fig. 6.10 Emptying characteristic curve with two-valves
(water level:334.00m-307.62m, H=26.38m, tv=6min)
Hydraulic Physical Model Investigation of Filling and Emptying System
- 29 -
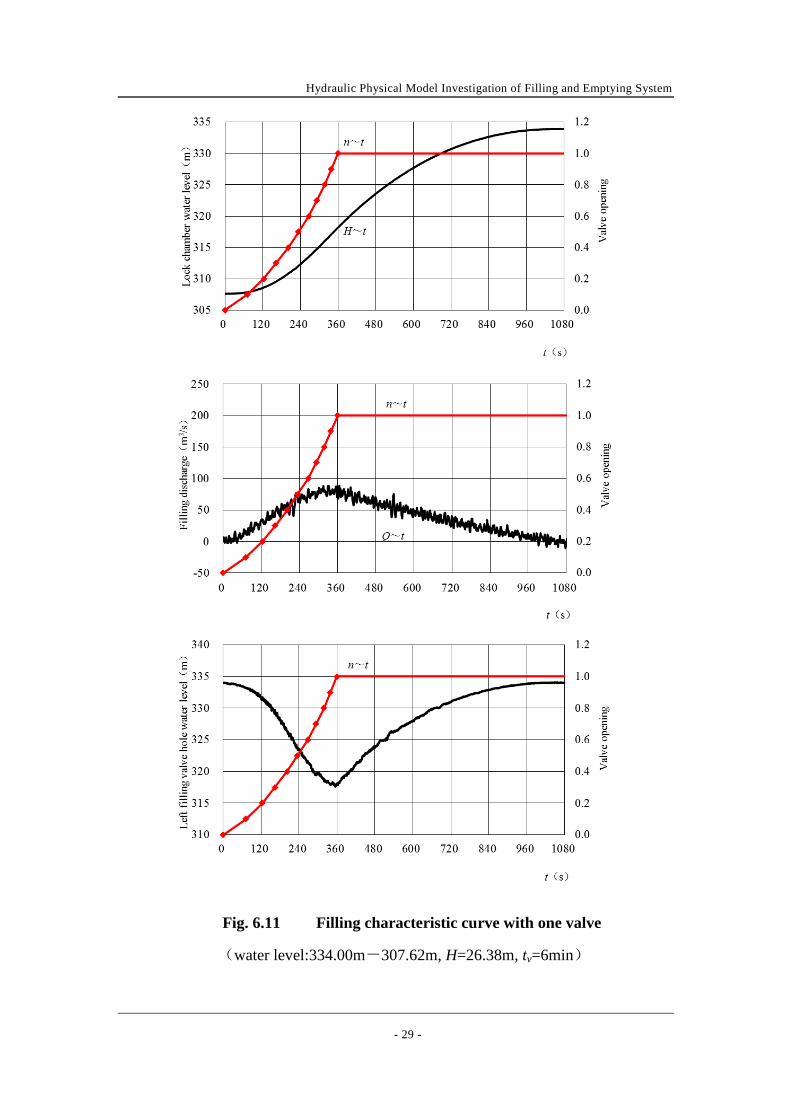
Fig. 6.11 Filling characteristic curve with one valve
(water level:334.00m-307.62m, H=26.38m, tv=6min)

Hydraulic Physical Model Investigation of Filling and Emptying System
- 30 -
Fig. 6.12 Emptying characteristic curve with one valve
(water level:334.00m-307.62m;H=26.38m;tv=6min)

Hydraulic Physical Model Investigation of Filling and Emptying System
- 31 -
7 MOORING CONDITIONS IN LOCK CHAMBER
The mooring conditions of vessels positioned at different location in chamber were conducted when lock filling with max initial water head.
The hawser stresses meaused under various valve opening schedule were show on tab.7.1 and tab7.2, the hawser stresses and valve opening time was show on Fig. 7.1, the the typcial hawser forces curves were shown on Fig 7.2-Fig 7.7.
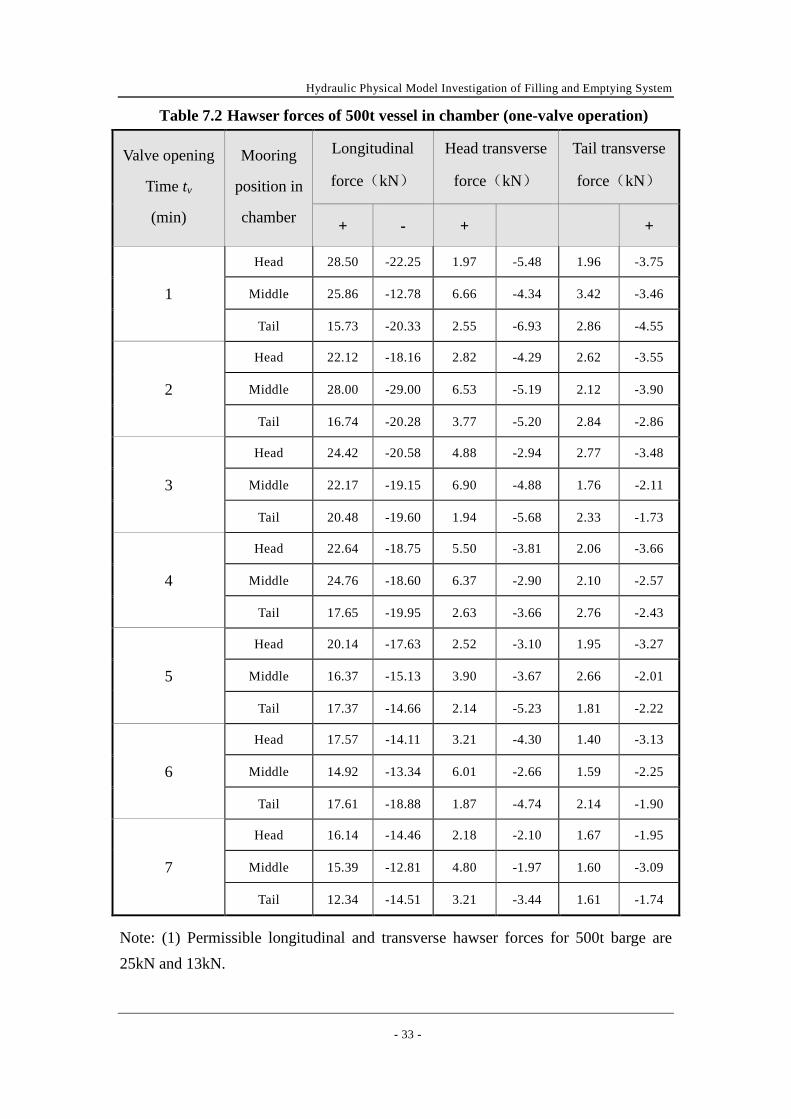
The maximum longitudinal and transverse hawser forces of 500t vessel in chamber were 16.5kN and 5.6kN for lock filling with two-valves operation (tv=6min), and were 17.6kN and 6.0kN with one-valve operation(tv=6min), all the hawser forces were satisfied with design code.
The vessel free drifting experiment showed that vessel free parked ( no-moored ) at center of chamber was raised with chamber water level almost no drifted in the lock filling process(see Pic.7.1 ), the water surface in chamber was smooth, the discharge of chamber manifold and the flow of main culvert divided into branch culvertes were symmetrical.
Fig. 7.1 Vessel free drifting experiment

Hydraulic Physical Model Investigation of Filling and Emptying System
- 32 -
Table 7.1 Hawser forces of 500t vessel in chamber ( two-valves operation)
Valve opening
Time tv
(min)
Mooring
position in
chamber
Longitudinal
force(kN)
Head transverse
force(kN)
Tail transverse
force(kN)
+ - + - + -
1
Head 24.8 -15.1 6.3 -6.5 7.2 -5.3
Middle 21.0 -18.6 8.0 -7.9 8.1 -3.8
Tail 20.8 -17.8 9.6 -4.7 7.6 -8.1
2
Head 23.3 -10.2 7.1 -6.2 3.9 -3.0
Middle 18.3 -12.2 7.3 -2.8 4.9 -3.7
Tail 20.9 -12.8 5.9 -4.5 4.6 -3.8
3
Head 16.6 -13.5 5.4 -5.6 3.9 -2.7
Middle 20.7 -13.1 7.3 -3.1 4.1 -2.8
Tail 13.0 -16.9 8.7 -3.7 4.7 -5.6
4
Head 16.2 -11.1 3.9 -3.1 3.1 -1.9
Middle 18.8 -7.7 5.2 -3.4 5.2 -3.9
Tail 16.1 -14.9 6.0 -3.3 2.7 -4.2
5
Head 17.4 -14.9 3.6 -4.7 2.8 -1.6
Middle 14.2 -11.9 5.8 -2.8 3.3 -1.4
Tail 13.0 -10.0 4.8 -2.6 2.4 -3.2
6
Head 16.2 -10.4 2.7 -4.0 2.9 -1.9
Middle 16.5 -14.4 5.6 -2.0 3.3 -1.2
Tail 15.1 -10.1 3.9 -3.7 2.8 -3.8
7
Head 11.5 -7.1 3.1 -3.6 2.9 -1.1
Middle 13.4 -10.3 5.1 -2.3 3.3 -2.2
Tail 15.5 -10.5 4.8 -3.5 2.8 -3.4
Hydraulic Physical Model Investigation of Filling and Emptying System
- 33 -
Table 7.2 Hawser forces of 500t vessel in chamber (one-valve operation)
Valve opening
Time tv
(min)
Mooring
position in
chamber
Longitudinal
force(kN)
Head transverse
force(kN)
Tail transverse
force(kN)
+ - + +
1
Head 28.50 -22.25 1.97 -5.48 1.96 -3.75
Middle 25.86 -12.78 6.66 -4.34 3.42 -3.46
Tail 15.73 -20.33 2.55 -6.93 2.86 -4.55
2
Head 22.12 -18.16 2.82 -4.29 2.62 -3.55
Middle 28.00 -29.00 6.53 -5.19 2.12 -3.90
Tail 16.74 -20.28 3.77 -5.20 2.84 -2.86
3
Head 24.42 -20.58 4.88 -2.94 2.77 -3.48
Middle 22.17 -19.15 6.90 -4.88 1.76 -2.11
Tail 20.48 -19.60 1.94 -5.68 2.33 -1.73
4
Head 22.64 -18.75 5.50 -3.81 2.06 -3.66
Middle 24.76 -18.60 6.37 -2.90 2.10 -2.57
Tail 17.65 -19.95 2.63 -3.66 2.76 -2.43
5
Head 20.14 -17.63 2.52 -3.10 1.95 -3.27
Middle 16.37 -15.13 3.90 -3.67 2.66 -2.01
Tail 17.37 -14.66 2.14 -5.23 1.81 -2.22
6
Head 17.57 -14.11 3.21 -4.30 1.40 -3.13
Middle 14.92 -13.34 6.01 -2.66 1.59 -2.25
Tail 17.61 -18.88 1.87 -4.74 2.14 -1.90
7
Head 16.14 -14.46 2.18 -2.10 1.67 -1.95
Middle 15.39 -12.81 4.80 -1.97 1.60 -3.09
Tail 12.34 -14.51 3.21 -3.44 1.61 -1.74
Note: (1) Permissible longitudinal and transverse hawser forces for 500t barge are 25kN and 13kN.

Hydraulic Physical Model Investigation of Filling and Emptying System
- 34 -
A)two-valve operation
B)one-valve operation
Fig. 7.2 Relation of hawser forces and valve opening time
0
4
8
12
16
20
24
28
0 1 2 3 4 5 6 7 8
Haw
ser f
orce
s F(
kN)
Valve opening time tv(min)
Longitudinal
Head transverse
Tail transverse
0
4
8
12
16
20
24
28
32
0 1 2 3 4 5 6 7 8
Haw
ser f
orce
s F(
kN)
Valve opening time tv(min)
Longitudinal
Head transverse
Tail transverse

Hydraulic Physical Model Investigation of Filling and Emptying System
- 35 -
Fig. 7.3 Hawser forces curve of 500t vessel moored in head of chamber
(two-valve operation, tv= 6min)

Hydraulic Physical Model Investigation of Filling and Emptying System
- 36 -
Fig. 7.4 Hawser forces curve of 500t vessel moored in middle of chamber
(two-valve operation, tv= 6min)
Hydraulic Physical Model Investigation of Filling and Emptying System
- 37 -
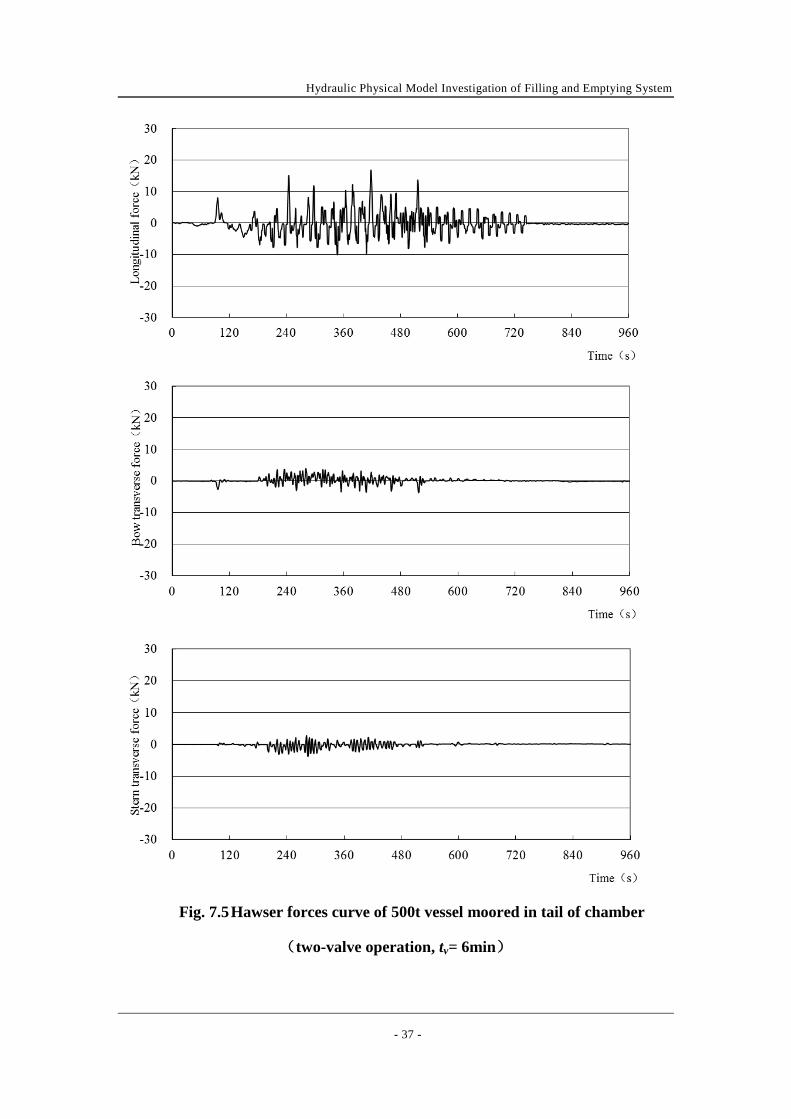
Fig. 7.5 Hawser forces curve of 500t vessel moored in tail of chamber
(two-valve operation, tv= 6min)

Hydraulic Physical Model Investigation of Filling and Emptying System
- 38 -
Fig. 7.6 Hawser forces curve of 500t vessel moored in head of chamber
(one-valve operation, tv= 6min)
Hydraulic Physical Model Investigation of Filling and Emptying System
- 39 -
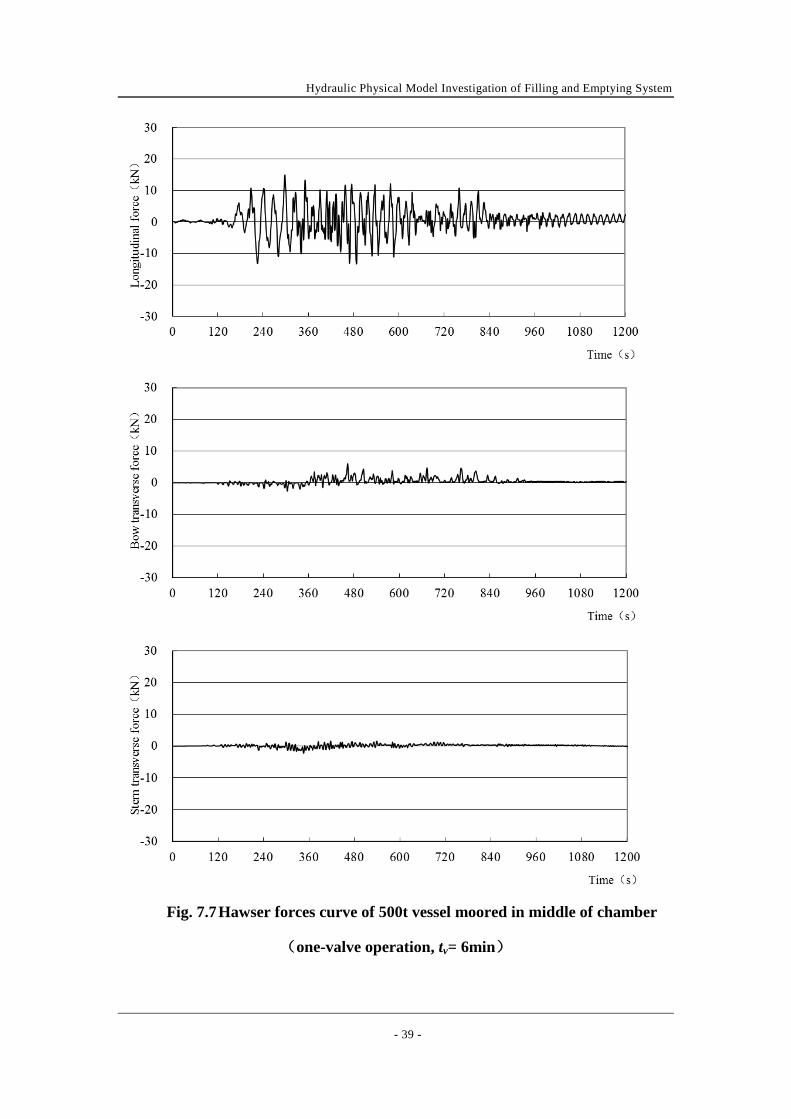
Fig. 7.7 Hawser forces curve of 500t vessel moored in middle of chamber
(one-valve operation, tv= 6min)

Hydraulic Physical Model Investigation of Filling and Emptying System
- 40 -
Fig. 7.8 Hawser forces curve of 500t vessel moored in tail of chamber
(one-valve operation, tv= 6min)
Hydraulic Physical Model Investigation of Filling and Emptying System
- 41 -
8 PRESSURES AND COEFFICIENT
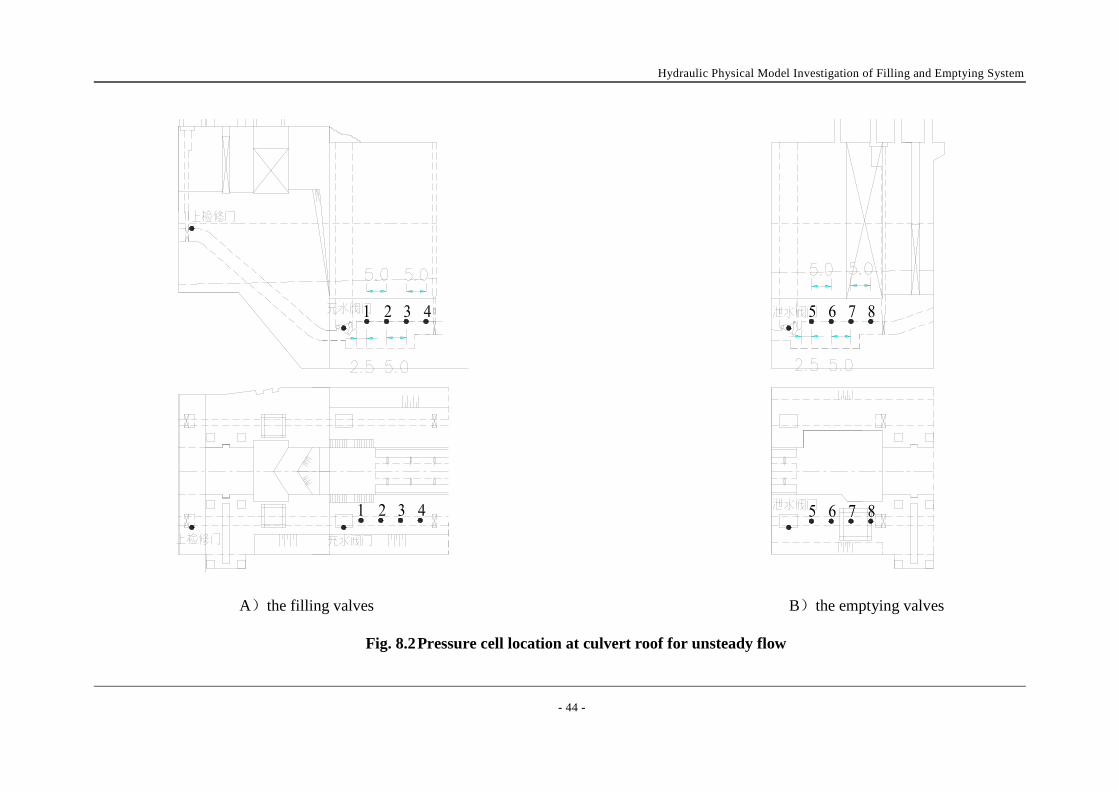
For analyzing and measuring the coefficients and pressures of various culvert sections, the 36 piezometers were installed in the culvert systems (see Fig 8.1) to measure average pressures with steady flow. 8 pressure cells were installed at the roof of culvert behind filling and emptying valves (see Fig 8.2) to measure the instantaneous pressures and pressure fluctuations of unsteady flow during valve operation.
8.1 PRESSURES IN CULVERT SYSTEM
The steady flow pressures at different location of culvert system were observed with different valve opening by piezometers, and the results were listed in Tab.8.1-Tab 8.4.
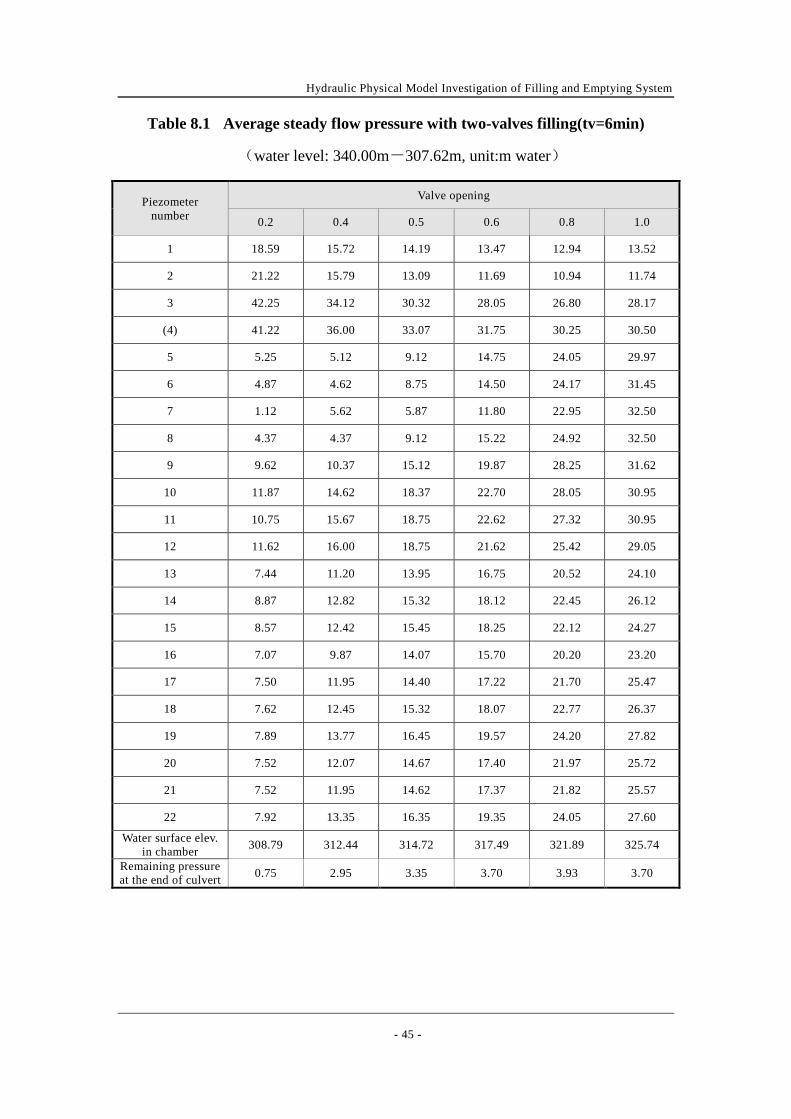
For lock filling with maximum initial head H=32.38m, the pressures with two-valves operation (tv=6min) were satisfactory for either location of the culvert, and the average minimum pressure was 1.12m water at the No.7 (behind filling valves) while valve opeing n=0.2. With one filling valve operation, the negative pressures were recorded at the top of culvert behind valve at partial opening(n=0.4-0.5), the average minimum pressure was -5.14mwater(No.7#, n=0.4). For lock filling, the pressures at two side of bifurcation (No.17#, 18#) were almost identical (see Tab.8.5), it means that the main flow was equally divided into the two branch culvert by bifurcation.
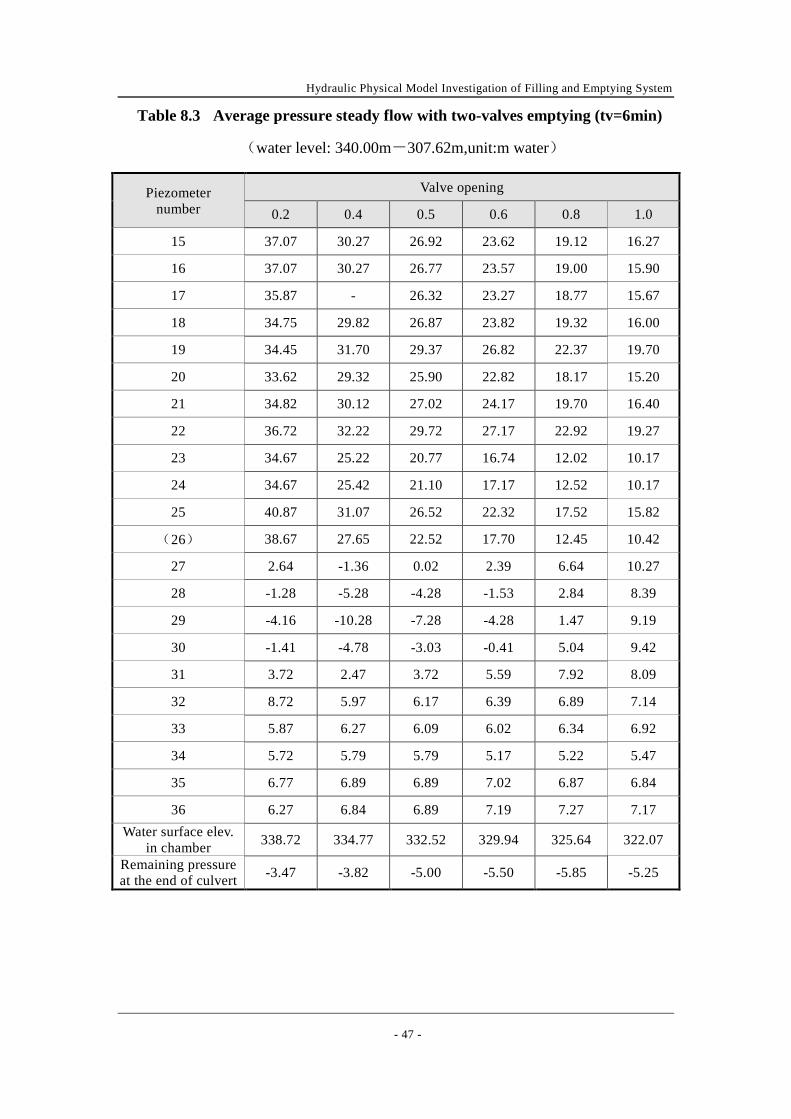
For lock emptying with maximum initial head H=32.38m, the pressures with two-valves operation (tv=6min), the negative pressures were recorded in a wide range at the top of culvert behind valve (No.27#-30#) while valve opening n=0.2-0.6, the average minimum pressure was –10.0m water (No,29#,n=0.4). With one empying valve operation, at the top of culvert behind valve (No.27#~30#) ,the negative pressures were recorded at valve opening n=0.2-0.8, the average minimum pressure was–10.0m water(No.29#, n=0.4;No.28#, n=0.5). At other location of empying system, the pressures were all positive with one or two-valves operation.
The lock was filling or emptying with two valves (tv=6min), the maximum remaining pressure (the difference of elevation pressure and water level in chamber) at the end of branch culvert was 3.93m (No.#19) or -5.85 m(No.20#).
Hydraulic Physical Model Investigation of Filling and Emptying System
- 42 -
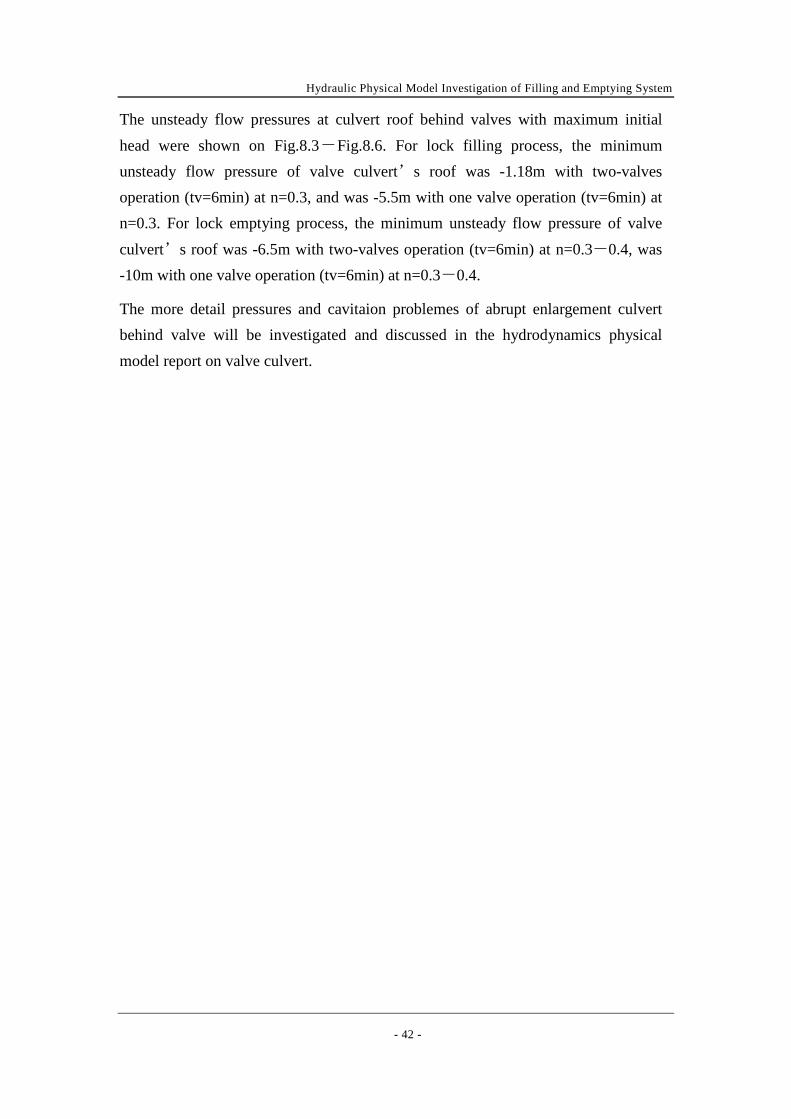
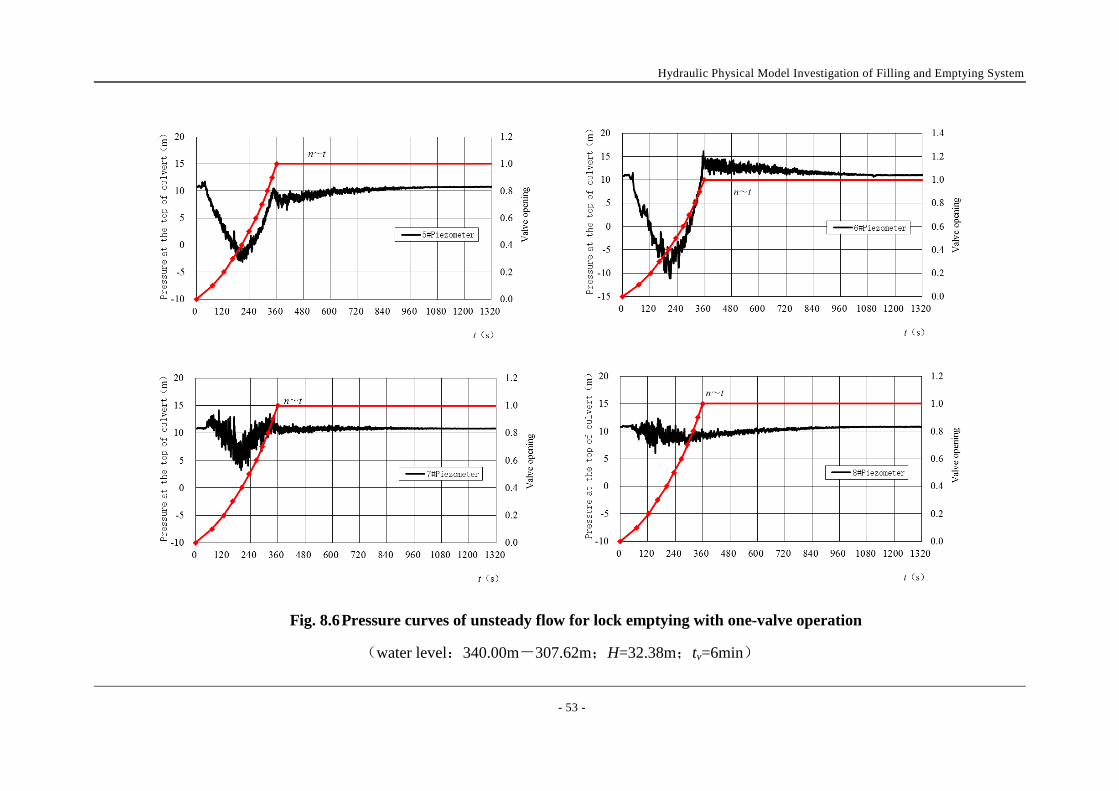
The unsteady flow pressures at culvert roof behind valves with maximum initial head were shown on Fig.8.3-Fig.8.6. For lock filling process, the minimum unsteady flow pressure of valve culvert’s roof was -1.18m with two-valves operation (tv=6min) at n=0.3, and was -5.5m with one valve operation (tv=6min) at n=0.3. For lock emptying process, the minimum unsteady flow pressure of valve culvert’s roof was -6.5m with two-valves operation (tv=6min) at n=0.3-0.4, was -10m with one valve operation (tv=6min) at n=0.3-0.4.
The more detail pressures and cavitaion problemes of abrupt enlargement culvert behind valve will be investigated and discussed in the hydrodynamics physical model report on valve culvert.

Hydraulic Physical Model Investigation of Filling and Emptying System
- 43 -
Fig. 8.1 Pressure piezometer locations for measuring steady flow
Hydraulic Physical Model Investigation of Filling and Emptying System
- 44 -
A)the filling valves B)the emptying valves
Fig. 8.2 Pressure cell location at culvert roof for unsteady flow
Hydraulic Physical Model Investigation of Filling and Emptying System
- 45 -
Table 8.1 Average steady flow pressure with two-valves filling(tv=6min)
(water level: 340.00m-307.62m, unit:m water)
Piezometer number
Valve opening
0.2 0.4 0.5 0.6 0.8 1.0
1 18.59 15.72 14.19 13.47 12.94 13.52
2 21.22 15.79 13.09 11.69 10.94 11.74
3 42.25 34.12 30.32 28.05 26.80 28.17
(4) 41.22 36.00 33.07 31.75 30.25 30.50
5 5.25 5.12 9.12 14.75 24.05 29.97
6 4.87 4.62 8.75 14.50 24.17 31.45
7 1.12 5.62 5.87 11.80 22.95 32.50
8 4.37 4.37 9.12 15.22 24.92 32.50
9 9.62 10.37 15.12 19.87 28.25 31.62
10 11.87 14.62 18.37 22.70 28.05 30.95
11 10.75 15.67 18.75 22.62 27.32 30.95
12 11.62 16.00 18.75 21.62 25.42 29.05
13 7.44 11.20 13.95 16.75 20.52 24.10
14 8.87 12.82 15.32 18.12 22.45 26.12
15 8.57 12.42 15.45 18.25 22.12 24.27
16 7.07 9.87 14.07 15.70 20.20 23.20
17 7.50 11.95 14.40 17.22 21.70 25.47
18 7.62 12.45 15.32 18.07 22.77 26.37
19 7.89 13.77 16.45 19.57 24.20 27.82
20 7.52 12.07 14.67 17.40 21.97 25.72
21 7.52 11.95 14.62 17.37 21.82 25.57
22 7.92 13.35 16.35 19.35 24.05 27.60
Water surface elev. in chamber 308.79 312.44 314.72 317.49 321.89 325.74
Remaining pressure at the end of culvert 0.75 2.95 3.35 3.70 3.93 3.70

Hydraulic Physical Model Investigation of Filling and Emptying System
- 46 -
Table 8.2 Average steady flow pressure with one-valve filling (tv=6min)
(water level: 340.00m-307.62m, unit:m water)
Piezometer number
Valve opening
0.2 0.4 0.5 0.6 0.8 1.0
1 18.64 15.14 12.94 11.72 9.59 8.89
2 21.29 14.64 10.64 7.79 4.19 2.74
3 42.25 32.50 26.25 22.37 17.02 14.57
(4) 41.27 34.62 30.52 27.75 23.12 21.42
5 3.62 0.37 0.62 6.00 14.00 19.45
6 3.57 0.87 0.12 5.62 13.70 21.57
7 0.87 -5.13 -0.13 2.12 11.52 23.92
8 3.12 1.12 0.00 6.25 15.17 24.07
9 8.37 4.62 9.00 13.25 20.70 23.70
10 11.17 11.12 13.00 95.87 20.57 21.82
11 10.37 11.87 13.50 15.75 19.42 21.25
12 10.17 12.37 13.25 14.50 16.25 18.30
13 6.84 7.52 8.57 9.69 11.40 13.87
14 8.25 9.14 10.07 11.32 13.45 15.65
15 4.17 8.69 9.44 11.32 12.45 12.70
16 6.77 8.14 9.32 10.60 12.87 15.72
17 6.77 8.12 9.32 10.42 12.65 15.62
18 7.09 9.19 10.87 12.52 15.27 18.17
19 7.19 9.75 12.20 13.57 15.95 19.05
20 6.89 8.77 10.07 11.40 13.92 16.77
21 6.89 9.02 10.57 11.97 14.65 17.45
22 7.14 9.52 11.99 13.02 15.65 18.55 Water surface elev.
in chamber 308.44 310.29 311.64 313.09 315.69 318.19
Remaining pressure at the end of culvert 0.38 1.07 2.18 2.10 1.88 2.48
Hydraulic Physical Model Investigation of Filling and Emptying System
- 47 -
Table 8.3 Average pressure steady flow with two-valves emptying (tv=6min)
(water level: 340.00m-307.62m,unit:m water)
Piezometer number
Valve opening
0.2 0.4 0.5 0.6 0.8 1.0
15 37.07 30.27 26.92 23.62 19.12 16.27
16 37.07 30.27 26.77 23.57 19.00 15.90
17 35.87 - 26.32 23.27 18.77 15.67
18 34.75 29.82 26.87 23.82 19.32 16.00
19 34.45 31.70 29.37 26.82 22.37 19.70
20 33.62 29.32 25.90 22.82 18.17 15.20
21 34.82 30.12 27.02 24.17 19.70 16.40
22 36.72 32.22 29.72 27.17 22.92 19.27
23 34.67 25.22 20.77 16.74 12.02 10.17
24 34.67 25.42 21.10 17.17 12.52 10.17
25 40.87 31.07 26.52 22.32 17.52 15.82
(26) 38.67 27.65 22.52 17.70 12.45 10.42
27 2.64 -1.36 0.02 2.39 6.64 10.27
28 -1.28 -5.28 -4.28 -1.53 2.84 8.39
29 -4.16 -10.28 -7.28 -4.28 1.47 9.19
30 -1.41 -4.78 -3.03 -0.41 5.04 9.42
31 3.72 2.47 3.72 5.59 7.92 8.09
32 8.72 5.97 6.17 6.39 6.89 7.14
33 5.87 6.27 6.09 6.02 6.34 6.92
34 5.72 5.79 5.79 5.17 5.22 5.47
35 6.77 6.89 6.89 7.02 6.87 6.84
36 6.27 6.84 6.89 7.19 7.27 7.17 Water surface elev.
in chamber 338.72 334.77 332.52 329.94 325.64 322.07
Remaining pressure at the end of culvert -3.47 -3.82 -5.00 -5.50 -5.85 -5.25

Hydraulic Physical Model Investigation of Filling and Emptying System
- 48 -
Table 8.4 Average steady flow pressure with one-valve emptying (tv=6min)
(water level: 340.00m-307.62m,unit:m water)
Piezometer No.
Valve opening
0.2 0.4 0.5 0.6 0.8 1.0
15 38.17 33.02 30.52 27.77 24.07 22.40
16 39.02 36.20 34.70 32.77 30.00 28.27
17 37.45 34.52 32.92 30.95 28.02 26.32
18 37.45 34.45 32.92 30.95 28.02 26.32
19 37.20 34.62 33.20 30.95 29.00 27.02
20 37.45 34.62 33.20 31.15 28.32 26.67
21 37.45 34.62 34.45 31.25 28.40 26.77
22 37.72 35.22 22.65 32.27 29.47 27.72
23 35.47 26.95 23.60 18.57 13.35 11.67
24 35.60 27.67 22.42 19.85 14.97 13.35
25 41.82 33.27 26.05 24.77 19.65 18.02
(26) 39.72 29.72 -2.23 19.37 12.82 10.15
27 2.14 -2.73 -3.23 -0.23 4.52 9.62
28 -1.41 -7.16 -10.53 -4.28 0.84 6.22
29 -3.91 -11.03 -4.53 -7.78 -1.28 8.27
30 -1.78 -6.53 2.59 -2.53 2.97 10.42
31 3.72 1.59 5.72 4.84 7.79 9.07
32 8.22 5.09 5.84 5.84 6.32 6.54
33 5.47 6.22 5.09 5.47 5.59 5.84
34 5.47 5.72 8.67 4.42 3.84 3.92
35 6.72 7.09 6.07 7.39 7.47 7.57
36 6.04 6.04 6.07 6.07 6.07 6.04 Water surface elev.
in chamber 339.24 337.07 335.82 334.34 331.79 329.69
Remaining pressure at the end of culvert -0.43 -1.00 -1.55 -1.77 -2.15 -1.75

Hydraulic Physical Model Investigation of Filling and Emptying System
- 49 -
Table 8.5 Pressures at two sides of bifurcation
(water level: 340.00m-307.62m, tv=6min, unit: m water)
Valve operation
Piezom-eter No. location
Valve opening
0.2 0.4 0.5 0.6 0.8 1.0
Two-valves 17 Upstream 7.50 11.95 14.40 17.22 21.70 25.47 Downstrea
m 7.52 12.07 14.67 17.40 21.97 25.72
One valve 20 Upstream 6.77 8.12 9.32 10.42 12.65 15.62 Downstrea
m 6.90 8.77 10.07 11.40 13.92 16.77

Hydraulic Physical Model Investigation of Filling and Emptying System
- 50 -
Fig. 8.3 Pressure curves of unsteady flow for lock filling with two-valves
(water level:340.00m-307.62m;H=32.38m;tv=6min)

Hydraulic Physical Model Investigation of Filling and Emptying System
- 51 -
Fig. 8.4 Pressure curves of unsteady flow for lock emptying with two-valves
(Water level:340.00m-307.62m;H=32.38m;tv=6min)

Hydraulic Physical Model Investigation of Filling and Emptying System
- 52 -
Fig. 8.5 Pressure curves of unsteady flow for lock filling with one-valve
(water level: 340.00m~307.62m;H=32.38m;tv=6min)
Hydraulic Physical Model Investigation of Filling and Emptying System
- 53 -
Fig. 8.6 Pressure curves of unsteady flow for lock emptying with one-valve operation
(water level:340.00m-307.62m;H=32.38m;tv=6min)

Hydraulic Physical Model Investigation of Filling and Emptying System
- 54 -
8.2 COEFFICIENTS
According the culvert pressures measured by piezometers under steady flow, the head loss coefficients of various section of culvert, and overall lock coefficient were calculated, the coefficients were shown in the Tab.8.6-Tab.8.9
The filling and emptying overall lock coefficient were 0.816 and 0.743 respectively for two valves operation and were 0.928 and 0.774 for single valve operation.
Table 8.6 Head loss coefficient of culvert for lock-filling Culvert sections Intake Valve
cluvert Main
cluvert From ports to
chamber surface Total
head loss coefficie
-nt ∑ξ
overall lock
coefficient µ
Piezometer position
upstream water surface
-1# 1#-12# 12#-17# 17#~ chamber
water surface
Two valves 0.015 0.854 0.419 0.215 1.503 0.816
One valve 0.000 0.707 0.405 0.060 1.162 0.928
Table 8.7 Head loss coefficient of culvert for lock-emptying
Culvert sections
From chamber surface to
ports
Main cluvert
Valve cluvert outlet Total head
loss coefficie-
nt ∑ξ
overall lock
coefficient µ
Piezometer position
chamber water surface-15# 15#-24# 24#-34#
24#-downstream
water surface
Two valves 0.371 0.310 0.653 0.478 1.812 0.743
One valve 0.116 0.386 0.686 0.491 1.679 0.772
Table 8.8 Lock-filling coefficients for various valve opening Opening
mode valve opening (n) 0.2 0.4 0.5 0.6 0.8 1.0
Two valves
Total head loss
coefficient ∑ξ 16.259 4.395 3.025 2.324 1.639 1.502
overall lock coefficient µ
0.248 0.477 0.575 0.656 0.781 0.816
One valve
Total head loss
coefficient ∑ξ 12.755 3.481 2.296 1.856 1.391 1.156
overall lock coefficient µ
0.28 0.536 0.66 0.734 0.848 0.93
Hydraulic Physical Model Investigation of Filling and Emptying System
- 55 -
Table 8.9 Lock-emptying coefficients for various valve opening Opening
mode valve opening (n) 0.2 0.4 0.5 0.6 0.8 1.0
Two valves
Total head loss
coefficient ∑ξ 16.935 4.566 3.379 2.544 1.892 1.811
overall lock coefficient µ
0.243 0.468 0.544 0.627 0.727 0.743
One valve
Total head loss
coefficient ∑ξ 14.907 4.304 2.932 2.331 1.811 1.678
overall lock coefficient µ
0.259 0.482 0.584 0.655 0.743 0.772
9 FLOW CONDITIONS IN LOCK APPROACHES 9.1 INTAKE MANIFOLD
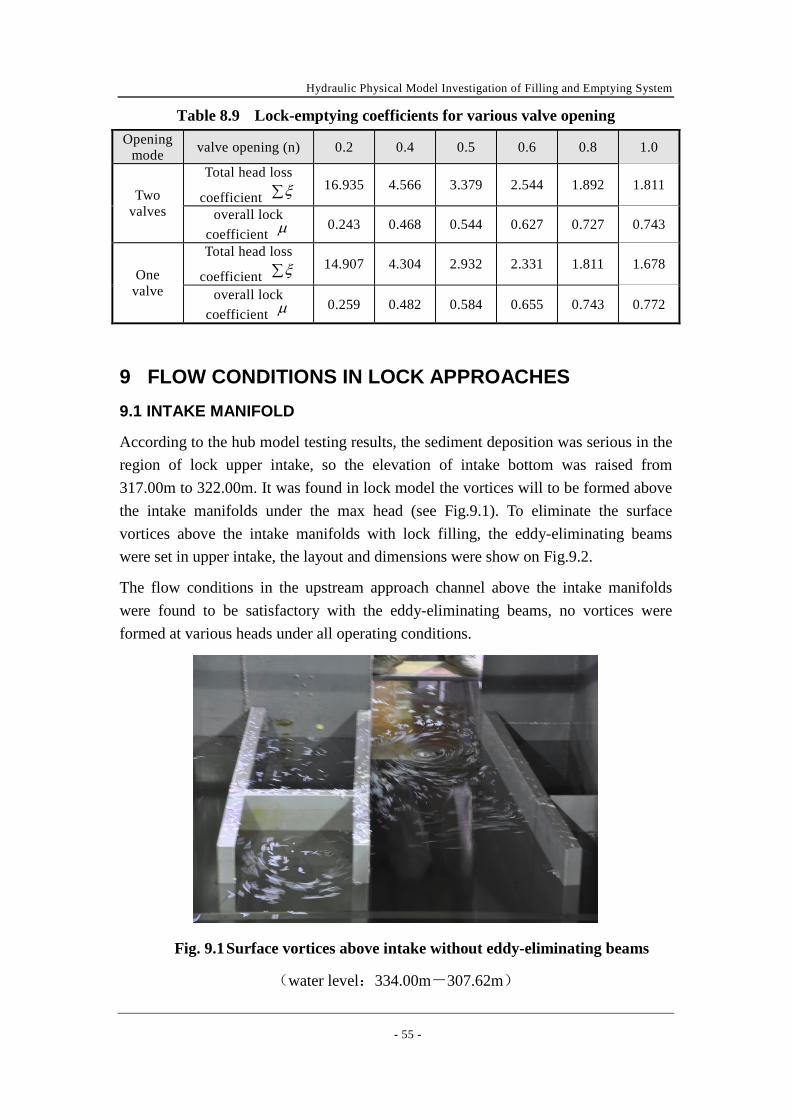
According to the hub model testing results, the sediment deposition was serious in the region of lock upper intake, so the elevation of intake bottom was raised from 317.00m to 322.00m. It was found in lock model the vortices will to be formed above the intake manifolds under the max head (see Fig.9.1). To eliminate the surface vortices above the intake manifolds with lock filling, the eddy-eliminating beams were set in upper intake, the layout and dimensions were show on Fig.9.2.
The flow conditions in the upstream approach channel above the intake manifolds were found to be satisfactory with the eddy-eliminating beams, no vortices were formed at various heads under all operating conditions.
Fig. 9.1 Surface vortices above intake without eddy-eliminating beams
(water level:334.00m-307.62m)

Hydraulic Physical Model Investigation of Filling and Emptying System
- 56 -
Fig. 9.2 Final layout of upper intake with eddy-eliminating beams
9.2 OUTLET
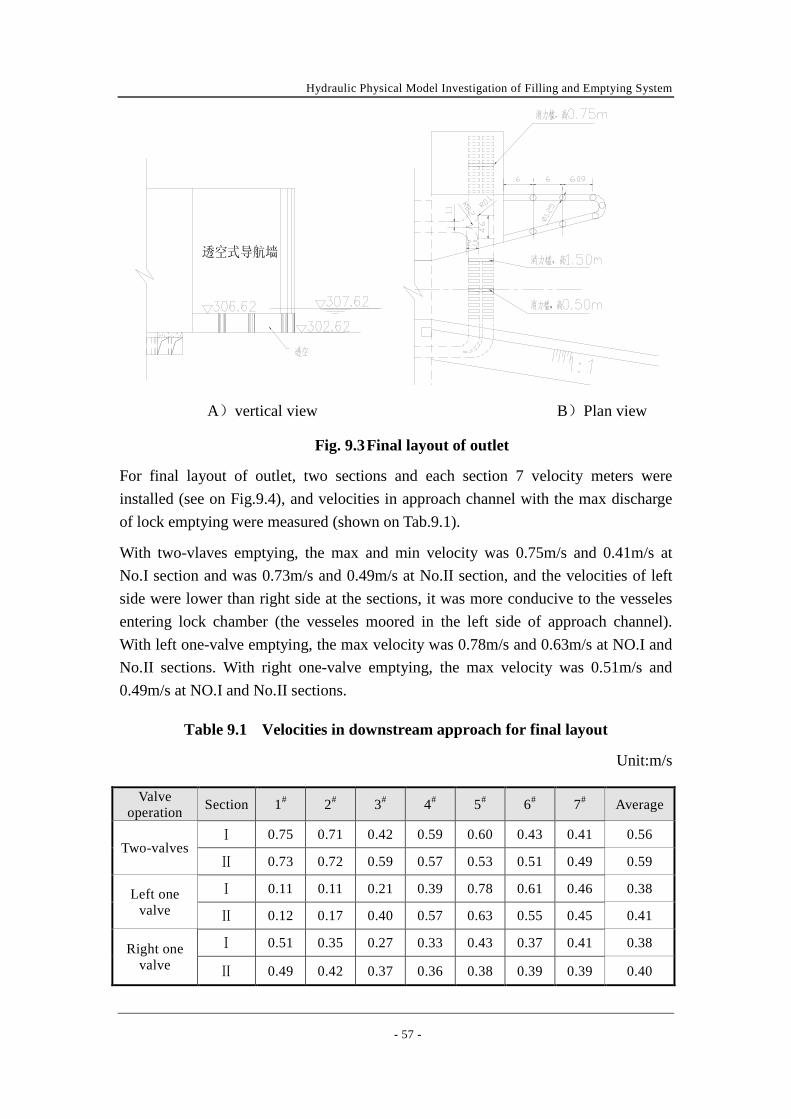
The outlet in downstream approach was optimized in model, to solving problems that the velocities were unevenlly distributed in approach with two-valves operation, and were too high in one side of approach with one valve operation, the left guide wall with hollow-out under the downstream minimum water level 1m (Elev<306.62m ) was used and the outlet culvertes in two side wall were connected with energy dissipation chamber, the final layout of outlet was showed on the Fig.9.3.
Hydraulic Physical Model Investigation of Filling and Emptying System
- 57 -
A)vertical view B)Plan view
Fig. 9.3 Final layout of outlet
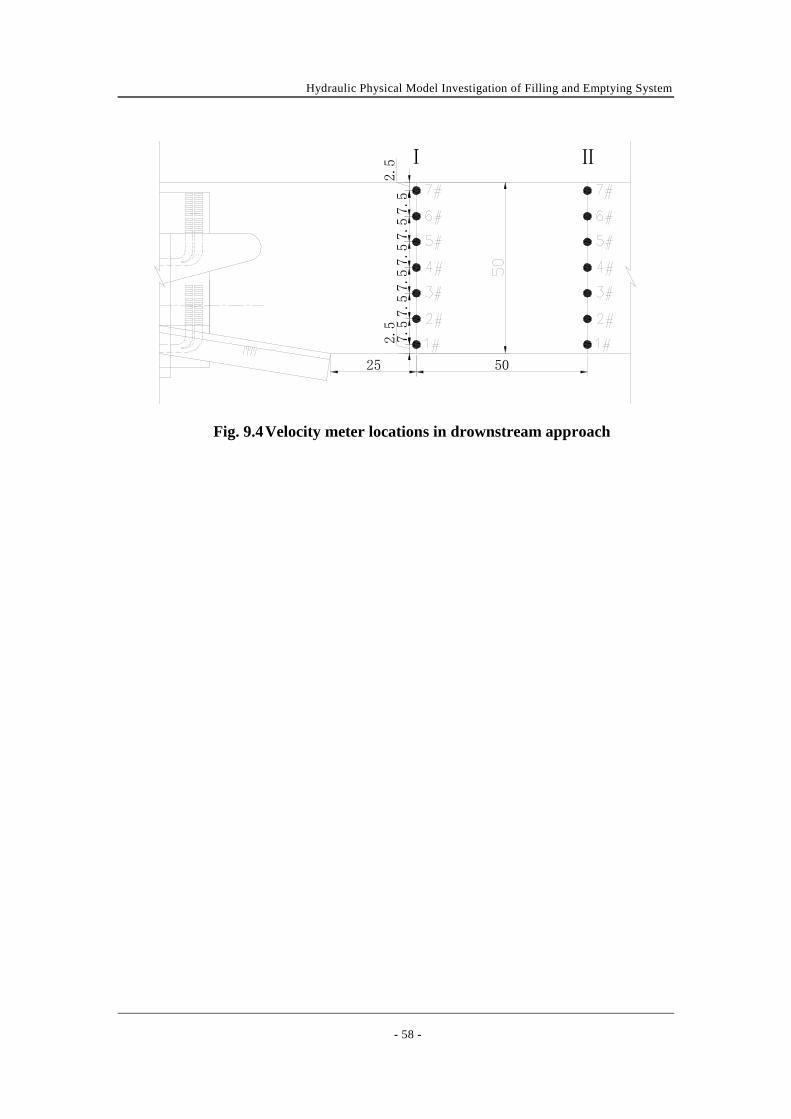
For final layout of outlet, two sections and each section 7 velocity meters were installed (see on Fig.9.4), and velocities in approach channel with the max discharge of lock emptying were measured (shown on Tab.9.1).
With two-vlaves emptying, the max and min velocity was 0.75m/s and 0.41m/s at No.I section and was 0.73m/s and 0.49m/s at No.II section, and the velocities of left side were lower than right side at the sections, it was more conducive to the vesseles entering lock chamber (the vesseles moored in the left side of approach channel). With left one-valve emptying, the max velocity was 0.78m/s and 0.63m/s at NO.I and No.II sections. With right one-valve emptying, the max velocity was 0.51m/s and 0.49m/s at NO.I and No.II sections.
Table 9.1 Velocities in downstream approach for final layout
Unit:m/s
Valve operation Section 1# 2# 3# 4# 5# 6# 7# Average
Two-valves Ⅰ 0.75 0.71 0.42 0.59 0.60 0.43 0.41 0.56
Ⅱ 0.73 0.72 0.59 0.57 0.53 0.51 0.49 0.59
Left one valve
Ⅰ 0.11 0.11 0.21 0.39 0.78 0.61 0.46 0.38
Ⅱ 0.12 0.17 0.40 0.57 0.63 0.55 0.45 0.41
Right one valve
Ⅰ 0.51 0.35 0.27 0.33 0.43 0.37 0.41 0.38
Ⅱ 0.49 0.42 0.37 0.36 0.38 0.39 0.39 0.40
Hydraulic Physical Model Investigation of Filling and Emptying System
- 58 -
Fig. 9.4 Velocity meter locations in drownstream approach
2.5
7.5
7.5
7.5
7.5
7.5
7.5
2.5
25 50

Hydraulic Physical Model Investigation of Filling and Emptying System
- 59 -
10 CONCLUSION (1) The experimental results of the filling and emptying system hydraulic model
experiment for Pak Beng navigation lock confirmed that the decision, the two-section dynamically balanced lock filling system with wall culvert and vertical bifurcation at midpoint of chamber, longitudinal manifolds with energy dissipation ditch was selected for Pak Beng lock, was correct. The filling and emptying system was modified and optimized with model experiment, the final layout of filling and emptying system was shown on Fig.10.1.
(2) Comprehensive consideration of the culvert hydrodynamic characteristics, filling and empying times, hydraulic conditions in chamber and approach channel and other factors’s influences, the valve opening times tv were recommended 6min for lock filling or emptying. With the valve operations, the lock filling and emptying times were 10.60min and 11.16min, the discharge were 146m3/s and 140m3/s, the max average velocities were 10.1m/s and 9.6m/s in valve culvert cross section, and were 7.2m/s and 6.9m/s in bifurcation cross section.
(3) The maximum longitudinal and transverse hawser forces of 500t vessel in chamber were 16.5kN and 5.6kN for lock filling with two-valves operation (tv=6min), and were 17.6 kN and 6.0 kN with one-valve operation(tv=6min), all the hawser forces were satisfied with design code.
(4) The vessel free drifting experiment showed that vessel free parked ( no-moored ) at center of chamber was raised with chamber water level almost no drifted in the lock filling process, the water surface in chamber was smooth, the discharge of chamber manifold and the flow of main culvert divided into branch culvertes were symmetrical.
(5) Except the valve culvert section, At other location of empying system, the pressures were all positive in culvert system under various water head with one or two-valves operation, the pressures and cavitaion problemes of abrupt enlargement culvert will be investigated and discussed in special report.
The lock filling and emptying with two valves (tv=6min), the maximum remaining pressure (the difference of elevation pressure and water level in chamber) at the end of branch culvert was 3.93m and -5.85 m.
(6) The overall lock coefficient for lock filling and emptying with two-valves operation were 0.816 and 0.743, and these related values were 0.928 and 0.743 with one valve operation.

Hydraulic Physical Model Investigation of Filling and Emptying System
- 60 -
(7) In upstream approach channel, the bottom elevation of intake manifolds were raised to EL.322.00m with the eddy-eliminating beams, the flow pattern above intake were satisfactory, no vortices were formed at various heads under all operating conditions. In downstream approach channel, the left guide wall with hollow-out and the outlet culvertes in two side wall were connected with energy dissipation chamber, the velocities in approach were satisfied with the design code.
(8) Suggestion: a) the hoist system of valves should have the ability to adjust valve opening time; b) the hydraulics prototype testing should be carried out before the lock normal operation.

Hydraulic Physical Model Investigation of Filling and Emptying System
- 61 -
Fig. 10.1 Final layout of filling and emptying system for Pak Beng navigation lock