Paint Waste Reduction and Disposal Options - InfoHouseinfohouse.p2ric.org/ref/01/00951.pdf · Paint...
198
HWRIC RR-060 Paint Waste Reduction and Disposal Options Volume I Prepared by Center for Economics Research Research Triangle Institute Research Triangle Park, NC 27709 and Research Associates Urbana, IL 61801 Prepared for The Illinois Hazardous Waste Research and Information Center One East Hazelwood Drive Champaign, Illinois 61820 HWRIC Projects 91087/91088 Printed by Authority of the State of Illinois 92/250 Mandated by the Illinois General Assembly through HB 1356; PA 86-1026; III. Rev. Stat. Ch. 111 l/2, Sec. 7057.1 (Illinois Solid Waste Management Act, 1989, Sec. 7.1 and 7.2).
-
Upload
duongthuan -
Category
Documents
-
view
221 -
download
0
Transcript of Paint Waste Reduction and Disposal Options - InfoHouseinfohouse.p2ric.org/ref/01/00951.pdf · Paint...
HWRIC RR-060
Paint Waste Reductionand
Disposal Options
Volume I
Prepared by
Center for Economics ResearchResearch Triangle Institute
Research Triangle Park, NC 27709and
Research AssociatesUrbana, IL 61801
Prepared for
The Illinois Hazardous Waste Researchand Information Center
One East Hazelwood DriveChampaign, Illinois 61820
HWRIC Projects 91087/91088
Printed by Authority of the State of Illinois 92/250
Mandated by the Illinois General Assembly through HB 1356; PA 86-1026; III. Rev. Stat.Ch. 111 l/2, Sec. 7057.1 (Illinois Solid Waste Management Act, 1989, Sec. 7.1 and 7.2).

EXECUTIVE SUMMARY
The manufacture and use of paints and coatings is an important part of the Illinoiseconomy. Illinois is among the top five states in the production of paints and coatings. Inaddition, most Illinois manufacturing industries and many of the small businesses, such asautomobile body shops, use paint in their operations. Furthermore, households andresidential/commercial painting contractors use large quantities of paint.
Both the manufacture and use of paint result in the generation of significant quantitiesof waste. The wastes generated occur in solid, liquid, and gaseous form and, because ofthe nature of paint, are hazardous or toxic in many cases.
The Illinois General Assembly amended the Solid Waste Management Act in 1989,directing the Illinois Department of Energy and Natural Resources (ENR) to
l “conduct a study to develop cost-effective, environmentally sound, andtechnically feasible waste paint disposal options for small businesses, includingat least painting contractors, auto body shops, and households;” and
l “[develop] an effective public education program to inform small businesses andhouseholds about the best available waste paint reduction and managementoptions.” (Public Act 86-1026)
ENR is directed to “report to the Governor and the General Assembly on its activities. . . with recommendations for legislation or regulations necessary to address the reductionand management of paint waste.” This report was prepared to meet this requirement.
Throughout this report, the term “waste” is used to refer to all nonproduct outputsfrom manufacturing or using paint. This definition of waste includes releases to the air,water, and land. It also refers to waste generation before any treatment or recoveryactivities. In this report, the wastes associated with paint manufacture and use arebroadly referred to as “paint-related waste.”
ES.1 OBJECTIVES AND METHODOLOGY
Three primary objectives were identified for this project:
l Identify waste reduction and waste management options that can beimplemented by both manufacturers and users of paint in Illinois.
l Make recommendations for an education program to help alleviate the problem.
l Suggest policy options to address the problem as defined by the project.
The first phase of the project involved conducting a thorough review of currentliterature and existing data sources to characterize the following:
l current waste reduction practices of Illinois manufacturers and users of paint;
l paints used and paint-related wastes generated in Illinois;
. . .i i i

l the scope and magnitude of the paint-related waste problem in Illinois, includingwaste generation and waste management techniques and their impact on theenvironment;
l technically and economically feasible waste reduction options;
l additional data needs to be addressed in subsequent tasks;
l relevant terminology and recommendations for standardized definitions for thepurposes of this project; and
l relevant state and federal legislation and associated regulations.
The second phase of the project was designed to gather additional data on paint-relatedoperations in Illinois, the wastes those operations generate, and how those wastes aremanaged. In addition, Phase II gathered data on current paint-related waste reductionactivities in Illinois and the potential for further waste reduction. Phase II focused onmanufacturers and on industrial and commercial users, because sufficient information onhousehold use was identified during the Phase I literature review. Phase II consisted of asurvey of Illinois’ paint manufacturers and industrial users and onsite investigations withmanufacturers, users, and waste management facilities.
To assist in conducting this study, an Ad Hoc Advisory Group (AHAG) was formed.AHAG consists of representatives of Illinois paint manufacturers and industrial andcommercial paint users. The Hazardous Waste Research and Information Center(HWRIC) recognized that issues associated with paint usage vary widely amongindustries, so AHAG was formed to provide as many points of view as possible. Thegroup provided input throughout the course of this study and has reviewed this report.
The purpose of this study is to provide a broad overview of paint-related activities inIllinois and to try to assess the extent of paint-related waste disposal problems in Illinois.The results of this study indicate that the types of paints and paint usages vary greatly.Therefore, the findings of this study may not apply to all situations.
ES.2 PAINT CLASSIFICATION
For the purposes of this study, paints are classified based on the primary types ofsolvent they contain, recognizing that many paints contain a mixture of solvents. Usingthis approach, paints are classified as follows:
l waterborne,
l organic solvent-borne, or
l powder (dry, without solvent).
The term waterborne refers to coating systems that use water to some degree as thesolvent. These types of coatings include aqueous emulsions (latex), colloidal dispersions,and water-reducible coatings. Although waterborne paints are not entirely free of organicsolvents, they do generally decrease air emissions of volatile organic compounds (VOCs)during paint application, eliminate organic solvents for thinning, and reduce the use oforganic solvents during clean-up.
iv
The majority of “conventional” paints are organic solvent-borne. By their nature,organic solvent-borne coatings contain significant amounts of VOCs. High-solidscoatings are being formulated to reduce VOCs. Wastes from organic solvent-bornepaints are generally hazardous due to toxicity, flammability, or both. However, therelative ease of solvent recycling and the high Btu content of organic solvent wastesprovide several possible avenues for waste recycling or reuse.
Powder coatings eliminate the use of a solvent. Powder coatings are applied dryusing electrostatic spray, fluidized bed, and flame spray application techniques. In allcases, the powder that adheres to the object being painted is melted using heat to providea continuous film. Because powder coatings do not begin to cure until they are heated,capturing and recycling powder overspray is possible, reducing this source of wastegeneration. VOCs are nearly eliminated with powder coatings because no organicsolvent is used.
ES.3 PAINT LIFE CYCLE
The life cycle of paint covers all the stages of paint manufacturing and use, from themining and manufacturing of inputs used in paint manufacturing to the ultimate disposalof the product that was painted. Paint usage has impacts on the environment at all stagesof this life cycle, including
l manufacturing the raw materials to be used to make paint;
l manufacturing the paint itself;
l applying the paint;
l removing the paint, if required; and
l disposing of the item that had been painted (e.g., taking an old car to the junkyard).
In addition, the life cycle of paint includes transporting materials, managing wastesgenerated, and producing energy that is consumed throughout the life cycle. This studyfocuses on the paint manufacturing, application, and removal stages of the paint lifecycle, with emphasis on the application and removal stages.
ES.4 PAINT MANUFACTURING PROCESS
The production of paint is a complex process involving dispersion of pigments andadditives into a solution of resin and solvent, followed by relatively simple mixingoperations. The most important step in the process is the initial pigment dispersionoperation, sometimes termed “grinding.” Different types of paint are manufactured bychanging the raw materials used and their relative quantities.
Most paint manufacturers produce many different types and colors of paint, includingboth organic solvent-borne and water-borne paints. Each type and color of paint ismanufactured in a separate batch, and all manufacturing equipment is generally cleanedbetween batches of different types or colors of paint to prevent contamination.Equipment cleaning is the largest source of waste from paint manufacturing. Generally,an organic solvent is required to clean equipment after manufacturing an organic solvent-
V

borne paint, while water can generally be used to clean equipment after manufacturingwater-borne paints.
Wastes generated from paint manufacturing include the following:
l equipment cleaning wastes,
l air emissions of VOCs,
l pigment dust from air pollution control equipment (e.g., baghouse dust),
l empty raw material packages, bags, and containers,
l bags and cartridges from paint filtration equipment,
l paint that is “off-spec” (i.e., did not meet quality or customer specifications),
l paint returned from the retailer (e.g., because it had exceeded its shelf life), and
l waste paint or raw materials from accidental spills and discharges.
Some of these wastes, such as off-spec and returned paints, are commonly recycled anddo not enter the waste stream.
Waste reduction options for paint manufacturers include the following:
l using less toxic raw materials;
l using less toxic cleaning solutions;
l using less cleaning solution by using mechanical cleaning methods (such asscraping) and by scheduling paint batches to reduce the number of timesequipment must be cleaned;
l reusing cleaning solutions by adding as a raw material in a compatible batch orrecovering organic solvents, if applicable;
l redesigning equipment and storage tanks to reduce VOC emissions; and
l implementing quality controls to reduce off-spec and returned paint, andreblending any off-spec or returned paints that are generated.
These waste reduction options do not apply to all paint manufacturing operations. Thegreatest barriers to implementing these changes are customer and quality specifications.
ES.5 PAINT APPLICATION PROCESS
Generally, the type of paint and the application method are critical to the performanceof a coating. The general steps for paint application include
l surface preparation,
l paint application, and
l curing or drying.
vi

The paint application process used depends on the type of surface to be coated, thetype of coating, and the size and shape of the surface. Most household painting is doneusing brushes and rollers, with a small amount of spray application. Auto body shoppainting is almost exclusively done using spray equipment, either conventional pressurespray or newer, high-volume, low-pressure spray equipment. For paints used as productcoatings, the importance of a high-quality, durable finish demands tailoring of both thecoating and the application technology.
The transfer efficiency is an important aspect of a paint application technology fromthe standpoint of waste generation. Transfer efficiency is the amount of paint applied tothe object being painted, divided by the amount of paint used. Low paint transferefficiencies can be the largest source of waste from paint application. Transferefficiencies for a given type of paint formulation vary with the type of equipment used,the skill of the operator, and the object being painted.
Wastes generated from industrial paint application processes may be consideredhazardous because of the presence of toxic metals (e.g., chromium, lead) and organicsolvents (e.g., toluene, methyl ethyl ketone). Wastes generated during industrial paintapplication include the following:
l scrubber water, paint sludge, and filters from air pollution control;
l equipment cleaning wastes;
l aqueous waste and spent solvents from surface preparation;
l VOC emissions during paint application, curing, and drying;
l empty raw material containers; and
l obsolete or unwanted paint.
Residential paint use generates waste from equipment cleaning, VOC emissions, emptycontainers, and leftover paint.
Waste generation from paint application can be significantly reduced by substituting apaint with lower VOC content and by modifying paint application techniques to increasepaint transfer efficiency. Both of these waste reduction options are limited by the type ofproduct being painted and the quality of the finish required. Additional waste reductionoptions include the following:
l using less toxic surface preparation solutions and reusing or recycling thesolutions;
l reducing equipment cleaning frequency by scheduling longer batches or usingdedicated equipment; and
l reducing leftover paints by using better inventory controls and finding a user forleftover paints.
ES.6 PAINT REMOVAL PROCESS
For some architectural and industrial uses of paint, paint removal is required toinspect, repair, or repaint coated surfaces. Conventional paint removal techniques include
vii

manual scraping, sanding, sand blasting, and solvent stripping. Manual scraping andsanding are labor intensive; therefore, their application is limited to small-scale paintremoval. Both sand blasting and solvent stripping, although widely used, generate wastesthat pose environmental and health risks. Wastes generated in solvent stripping includeair emissions of VOCs and large volumes of wastewater containing the solvent/paintresidues. The use of sand and other silica-containing materials in sand blasting processeshas been associated with lung disease in workers. Removing lead-containing paints posesparticular waste generation problems. Abrasive blasting of lead-containing paintsgenerates a fine lead dust that is highly toxic to workers.
Extensive research has been conducted to develop alternative paint removal processesthat reduce risks to workers and the environment. These alternative processes include thefollowing:
l blasting surfaces with alternative abrasive media, such as plastic media, sodiumbicarbonate, or dry ice;
l spraying the surface with high-pressure water;
l heating the surface with lasers or flashlamps to loosen paint;
l cooling the surface with liquid nitrogen to loosen the paint; and
l immersing objects to be stripped in molten salt or hot-caustic baths.
The applicability of each of these techniques depends on the type of object being strippedand the properties of the paint being removed.
ES.7 PAINT-RELATED ACTIVITIES IN ILLINOIS
HWRIC conducted a literature review, mail survey, and site visits to determine
l the types of facilities generating paint-related waste in Illinois,
l the quantities and types of paint-related waste generated by Illinois facilities,and
l current waste reduction, management, and disposal practices for paint-relatedwaste in Illinois.
Illinois ranked among the top five states in paint manufacturing in 1987 based onsales revenues, accounting for between 10 and 12 percent of total revenues from paintmanufacturing in the United States (Rauch, 1990). In 1989, paint manufacturers inIllinois had air emissions of 1.57 million pounds of chemicals considered toxic under theSuperfund Amendments and Reauthorization Act (SARA) (USEPA, 1991c). Thesefacilities generated 32,700 tons of hazardous waste in 1986 (USEPA, 1990b).
Less data are available on paint usage in Illinois. Based on a small number ofobservations and anecdotal evidence, we were able to make some rough estimates ofpaint usage and related waste generation in Illinois. These estimates are further explainedin Chapter 5.
Viii

Leftover paint is the largest source of paint waste from households. Data from aCalifornia study (Rathje et al., 1985) indicate that each household discards about 1.5pounds of paint waste in municipal trash per year. Using this figure for Illinoishouseholds results in about 3,000 tons of household paint waste in municipal trash peryear. In addition, households often store leftover paints and paint-related products. A1987 study of households in the Champaign/Urbana and Decatur areas and of farmers inChampaign County found that roughly 50 percent of households and farms had varnish orpaint thinner on their property at some time during the past year. Householders andfarmers that had varnish onsite at the time of the survey on average had roughly 3 to 4containers, and those with thinner onsite had roughly 2 to 3 containers on average(Liebert, 1988).
Information provided by the Illinois Automotive Service Association indicates thatthere are approximately 3,400 licensed auto body shops in Illinois, which service anestimated 1.6 million cars annually. Rough estimates based on population suggest that1.5 million gallons of paint are used by auto body shops in Illinois. Primary types ofwaste generation by auto body shops include VOC emissions, from paint curing, spentfilters from paint over-spray collection, and leftover paints.
The Illinois Department of Transportation (IDOT) is a major user of paint in Illinois.For fiscal year 1991, IDOT purchased 750,000 gallons of paint for traffic markings.IDOT projects that the use of these paints will generate 5,000 gallons of hazardous wasteand 1,500 gallons of wastewater (Grey, 1991). IDOT also uses an estimated 73,000gallons of paint per year for bridge maintenance and rehabilitation. Anecdotal evidencesuggests that 29,000 gallons of paint waste is released due to paint overspray from bridgemaintenance. Another source of paint-related wastes from IDOT is the removal of paintfrom bridges as part of maintenance operations. IDOT has suspended all bridge paintremoval operations because of concern for worker exposure to concentrated lead dust.
Little state-wide data on paint-related waste generation from OEM product coatingswere available. It is difficult to isolate the portion of waste generated by these facilitiesthat was due to paint-related operations. One data source, the National Survey ofHazardous Waste Generators, indicates that paint application operations at Illinoisfacilities that were large quantity generators of hazardous waste generated approximately8,000 tons of hazardous waste in 1986 (USEPA, 199Ob). This statistic does not includewastes generated from surface preparation and some equipment cleaning wastes. Formany paint application operations, surface preparation and equipment cleaning are thelargest sources of paint-related waste generation.
ES.8 CONCLUSIONS
The results of this study suggest that a variety of options are available to reduce paint-related waste generation, many of which have been implemented by Illinois paintmanufacturers and users. Many of these waste reduction options are available at low costin Illinois. The major barriers to implementing these options are a lack of technicalinformation and the perception that waste generation is not a problem. The educationprogram recommended in this report is designed to provide technical information onwaste reduction and to educate users about the effects of waste generation, including thefinancial costs of waste generation.
ix
Through the course of this study, we found that paint manufacturers are generallymore advanced at reducing waste generation than paint users. In part, this difference isdue to different perspectives on paint. Paint manufacturers are motivated to reduce paint-related wastes to maximize production of their finished product. Paint users, however,generally do not regard painting as their primary business, and painting is just a smallfraction of their cost of goods sold. This fact does not imply that paint manufacturers inIllinois do not need to reduce waste. On the contrary, the site visits indicated that somepaint manufacturers could further reduce their waste. This conclusion does support ourstudy’s focus on paint users rather than manufacturers.
The results of this study suggest that most paint-related liquid wastes from industry donot reach the environment untreated. These wastes are either treated in-house or handledby a solvent recycler or fuel blender. The study indicates that a viable liquid wastehandling industry in Illinois recycles liquid paint-related wastes from both small and largepaint users. We recommend efforts in educating firms on options for recycling liquidpaint-related wastes.
The largest type of air emissions from both paint manufacturers and paint users isVOCs, which contribute to atmospheric ozone pollution. Currently, the Clean Air Actimposes regulations on some major sources of VOC emissions (i.e., facilities that releaseover 100 tons per year). This regulation has already served as an incentive for largefacilities to use less paint and to switch to paints formulated with lower VOC content,such as high solids, waterborne, and powdered paints. The 1990 Clean Air ActAmendments lower thresholds for VOC emissions, making additional facilities subject tothe Clean Air Act permitting provisions and control technologies. We recommend aneducation program targeted at facilities now subject to these regulations, to inform themof the regulatory requirements and how they can use waste reduction to comply with theregulations. Waste reduction options include switching to paints formulated with lowerVOC content and improving paint transfer efficiencies, which results in less paint beingused and therefore decreased VOC emissions.
Further study is needed to determine the extent of environmental hazard due to landdisposal of paint-related wastes. In particular, the leachate hazard of disposing of paintproducts in municipal landfills is unknown. Ensuring proper disposal of these wastesmay require enhanced enforcement of special waste regulations for industry andcommercial operations and establishing additional household hazardous waste collectionprograms.
ES.9 RECOMMENDATIONS
This section presents our recommendations for programs to promote paint-relatedwaste reduction and environmentally sound disposal, including an education and publiccommunication program. The state of Illinois prefers waste reduction or recycling todisposal whenever feasible. The following recommendations incorporate this statepolicy.
We recommend that the Ad Hoc Advisory Group (AHAG) be maintained to provideinput in implementing the recommendations. The group would fulfill two functions.First, it would provide an insider’s view of the complex issues related to paint use in a
X

variety of industries. Second, because AHAG members can assure the effectiveness ofrecommended technologies, the group will encourage the implementation ofrecommended changes. In both of these functions, the group serves as a liaison betweengovernment agencies and the industries the members represent.
ES.9.1 Paint Manufacturers
We recommend an education program for paint manufacturers that includesinformation on technologies to reduce VOC emissions and waste management costs. Inaddition, paint manufacturers could identify profitable waste reduction opportunities byimplementing full-cost accounting and materials accounting. Information on bothaccounting methods could also be included in an education program.
Paint manufacturers can play an important role in waste reduction and recycling forwastes generated from using paint. For example, paint manufacturers could participate ina household paint waste recycling program. We recommend that the state of Illinoissolicit the participation of local paint manufacturers in recycling programs.
ES.9.2 Original Equipment Manufacturers (OEM) that Use Paint
The area that offers the greatest potential for waste reduction for OEM manufacturersis improving paint transfer efficiency. Generally, technologies are available to improvetransfer efficiency. To encourage the implementation of these technologies, werecommend
l technology demonstrations,
l distributing vendor lists,
l a tax credit for capital expenditures, and
l case studies and news releases, to be distributed through trade associations andtrade journals.
We recommend that steps be taken to ensure that all paint users are familiar withsolvent and aqueous waste recycling opportunities. One option is to provide lists ofrecyclers to paint users. The site visit results also indicated that some fuel blenders areblending solid paint wastes such as filters from over-spray capture devices. Werecommend this as an alternative to landfilling these solid paint-related wastes andrecommend that the availability of this service be publicized through trade journals.
During the course of this study, we identified a problem with the disposal of solidpaint-related wastes. Generally, these wastes are subject to Illinois special wasteregulations and should be transported by a licensed special waste hauler to landtillslicensed to accept the waste. However, these wastes are often disposed of in municipallandfills without the use of licensed haulers. This situation seems to be the result of alack of information on special waste regulations and a lack of enforcement of theseregulations. We recommend combining an education program on special wasteregulations with additional steps to enforce these regulations. In addition to ensuring thatthese wastes are disposed of properly, these additional steps will draw greater attention to
xi

these solid wastes, and the additional costs and management steps required to complywith special waste regulations may provide an incentive to reduce these wastes.
ES.9.3 Auto Body Shops
One important source of waste generation from auto body repair shops is leftoverpaints. We recommend that any leftover paint products be reused onsite wheneverpossible. For example, old paints can be blended with thinner and used as anundercoating. Thinners and paints that can not be reused onsite should be managed by asolvent recycler or fuel blender. We recommend that an education campaign be initiatedto ensure that all auto body shops are familiar with these recycling opportunities.
A second area that offers the potential for waste reduction from auto body shops isimproving transfer efficiency. As improving transfer efficiency results in less paint beingused and therefore reduced paint purchasing costs, there is a direct financial incentive forauto body shops to improve paint transfer efficiency. We recommend that Illinoisencourage this improvement by relating information on changes in applicationtechniques.
As with OEM manufacturers, we found through the course of this study indicationsthat auto body shops are not disposing of their solid wastes in accordance with specialwaste regulations. Again, we recommend combining an education program on specialwaste regulations with additional steps to enforce these regulations.
Educational materials targeted at auto body shops could be distributed through tradejournals and automotive paint vendors. Also, small regional conferences could be held todemonstrate new technologies.
One problem unique to auto body repair shops is the potentially large number ofsmall, part-time operations conducted in a residential garage or backyard. We identifiedno information on such operations during the course of this study, but such shops may notutilize the recommended methods of waste disposal, including solvent recyclers andlicensed special waste haulers. Contacting such operations as part of an educationprogram would be difficult. One option is to make information on practices to reducewaste generation available through paint vendors.
ES.9.4 Household Paint Users
Household users of paint should observe the following guidelines to reduce householdpaint waste generation:
l Buy only as much paint as needed to complete a job.
l Use good application procedures to minimize spills and the amount of paintused.
l Store paints properly to ensure they maintain their effectiveness.
l Find a user for any leftover paints (e.g., donate to a church, school, orcommunity theater).
xii

We recommend that these guidelines be included in education materials such a brochuresand posters displayed at paint retailers. These education materials should also includespecific instructions for proper disposal of paint-related wastes.
We also recommend that Illinois study the possibility of establishing a householdlatex paint recycling program, in conjunction with county governments and local paintmanufacturers. Prior to initiating such a program, a viable market for the reblendedpaints must be secured. Illinois should explore the possibility of the state purchasing therecycled paint. Paint cans collected at a household paint collection may also be recycled.Further study is needed to identify potential metal recyclers and markets for the recycledproduct.
The potential for leachate formation from paint and its associated hazard are unknownat this time. Because of their mobility, we recommend that liquid paints and paint-relatedwastes not be disposed of in municipal landfills. Some communities recommendallowing paint-related wastes to dry and then disposing of them in municipal landfills.For organic solvent-borne paints and thinners, the evaporation of VOCs during dryingcontributes to air pollution. Therefore, we do not recommend that the state of Illinoisadvocate this method of disposing of wastes containing organic solvents. Instead, werecommend that these products be collected through household hazardous wastecollection programs and then sent to a solvent recycler for management.
For latex paint waste, we recommend that toxic chemical leachate procedure (TCLP)testing be conducted to determine the potential leachate hazard of dried latex paint. Evenif studies determine that dried latex paint does not pose a leachate hazard, finding anotheruser for the paint or taking it to a collection center for reblending are preferred to air-drying and landfilling the paint.
ES.9.5 Household Painting Contractors
The results of this study suggest that household painting contractors generate paintwaste and manage their wastes in the same manner as household users. The educationmaterials recommended for households are also applicable to painting contractors.
We recommend a latex recycling program for household users of paint. This programis also applicable to painting contractors. However, Illinois special waste regulations andfederal RCRA regulations might impose additional constraints on recycling paint fromcommercial contractors. Additional permitting and administrative steps may be requiredto comply with these regulations.
Currently, paint wastes from household painting contractors are disposed of inmunicipal landfills. Further study is needed to determine the potential leachate hazardthese wastes pose in municipal landfills. If studies determine that these wastes do pose aleachate hazard, we recommend that they be collected in household hazardous wastecollections. This may require exemptions from special waste regulations and steps takento ensure compliance with federal RCRA regulations.
Xiii

ES.9.6 Educational MateriaIs
All educational materials should be developed with the appropriate trade associations.Their participation will improve material quality and promote their wider distribution.The educational materials can be grouped into three categories:
l reinforcement material for those already conscious of the need for effectivepaint-related waste management methods and who would benefit from guidanceand support from those in their industry;
l training material for those employees and supervisors in industries whoseattention to this area currently is limited; and
l public information items designed to inform and hopefully influence somemodest change in public practice.
The reinforcement material should focus on practices that could be adopted or shouldbe avoided by similar companies in industry. The following types of reinforcementmaterials could be developed:
l articles on the introduction of a cost-saving and waste-reducing new technologyin a particular industry;
l news releases from HWRIC on innovative ways to reduce and manage paint-related wastes, which cover different industries that generate varying quantitiesof paint-related wastes;
l short slide or tape presentations that show the technology used by one or moreindustries to reduce paint-related waste generation;
l short reports for senior management in paint manufacturing or in industries thatare major users of paint. The reports should highlight progress made in wastereduction and recommend additional steps that might be taken with managementsupport; and
l booklets containing case studies demonstrating how profits have increasedthrough waste reduction practices.
Training materials for both employees and supervisors can be used for initial andongoing employee training. Several options for training materials are available:
l Posters can emphasize different waste reduction steps that can be implementedby employees.
l Reminder sheets can be distributed to new employees at orientation sessions orposted as reminders. The materials should be specific to each industry andshould stress best practices and the value of these practices.
l Guides can be created for managers to conduct 5- to 15-minute remindersessions on the best use of paint material and legally acceptable steps for paint disposal.
xiv
l Checklists can be developed for managers to evaluate employees who are usingor disposing of paint and to suggest ways to correct or improve employeepractices using very short on-the-job training.
l Guides can be created for managers to review overall progress made in transferefficiency and in developing effective disposal methods. These guides would bein questionnaire form, which managers could require first-line supervisors tocomplete periodically.
Public awareness materials include those items designed for household users thatcould be put on paint cans, distributed by paint and hardware stores, or given out throughthe schools. These materials should be developed in cooperation with paintmanufacturers and paint retailers. The public awareness material should be simple andrecommendations should be easy to implement. Different types of public awarenessmaterials are available:
l Paint manufacturers in the state could copy and give single sheets of suggestionsfor paint use and disposal to retail outlets for distribution to their customers.
l Adaptations of that same information could be provided to science teachers inelementary and secondary schools in a form that students can take home toremind parents. Material also could be adapted for use in vocational educationcourses in high schools and community colleges.
l News releases could be sent out in a regular sequence to newspapers in the stateto remind the general public of effective paint use and disposal methods.
l Recycling centers could make information on recycling and on proper disposalof paint-related wastes available to the clients they serve. The material alsocould be provided to Cooperative Extension Service (CES) offices throughoutthe state; CES is actively involved in promoting improved waste management.
ES.10 FUNDING FOR RECOMMENDED PROGRAMS
Each of the above recommendations will require additional funding to implement.This section includes examples of funding alternatives.
For paint manufacturers and other manufacturers that use paint, one funding option isa fee on emissions of toxic chemicals reported in the Toxic Release Inventory (TRI).Auto body shops are not subject to TRI reporting requirements and therefore would notbe subject to a fee on TRI emissions. Options to finance an education program targetedat this industry include a fee on paint purchases or an increase in licensing fees.
Currently, Illinois assesses a fee on generators of hazardous waste and special wastes.Increasing this fee is another possible source of funding for a paint waste reductionprogram. Most Illinois paint manufacturers and industrial and commercial paint users areincluded in this fee requirement.
A third funding option is the Clean Air Act fee. Some of the funds generated by thisfee could be apportioned for educational programs targeted at paint manufacturers andindustrial users of paint.
xv

Waste reduction programs targeting household paint contractors and household usersof paint could be financed through a fee on paint purchases. The tax could vary by thetype of paint purchased, with a larger tax for paints that cannot be recycled and are thusmore expensive to dispose of.
A second funding option for programs related to household users of paint is a drop-off fee for household hazardous waste collections. The disadvantage of this fundingoption is that it discourages proper disposal of household hazardous waste.
Household waste reduction programs could be financed through an increase in tippingfees charged by municipal solid waste landfills. An increase in tipping fees is relevantbecause reducing waste going into these landfills is a major goal of a paint wastereduction program.
ES.11 REPORT OVERVIEW
This report describes the life cycle of paint. Chapter 1 provides backgroundinformation on the constituents in paint, the paint life cycle, and regulatory issues.Chapters 2, 3, and 4 describe paint manufacturing, application, and removal processes(respectively), the wastes that are generated from those processes, and options to reducethe generation of those wastes. Chapter 5 presents specific information on paint-relatedactivities in Illinois. Chapter 6 discusses the waste reduction and disposal optionsapplicable in Illinois for paint-related wastes. Finally, Chapter 7 presents recommendedpolicies for paint-related waste management and waste reduction in Illinois, includingrecommendations for an education program.
As part of this study, we conducted onsite investigations with paint manufacturers,users, and waste management facilities. The results of these investigations were used inthe analyses and recommendations made in this report. Complete documentation of theseinvestigations is available as a separate document (HWRIC TR-008).
xvi

CONTENTS
Chapter Page
Executive Summary ............................................................................................................... iii
Tables .................................................................................................................................... xxi
Figures.. ............................................................................................................................... xxiv
1 Introduction .................................................................................................................... 1
1.1
1.2
1.3
1.4
1.5
1.6
1.7
Objectives and Methodology .... . . . . . . . . . . . . . . . . . . . . . . . . . . . . . . . . . . . . . . . . . . . . . . . . . . . . . . . . 1
Paint Components .................................................................................................. 2
1.2.1 Pigments.. ................................................................................................. 3
1.2.2 Binder.. ..................................................................................................... 4
1.2.3 Solvents .................................................................................................... 4
Paint Classification ................................................................................................ 6
1.3.1 Waterborne Coatings.. .............................................................................. 6
1.3.2 Organic Solvent-borne Coatings .............................................................. 7
1.3.3 Powder Coatings ...................................................................................... 7
Paint Life Cycle ..................................................................................................... 8
Waste Management Regulations.. ........................................................................ 10
1.5.1 Air Releases.. .......................................................................................... 10
1.5.2 Wastewaters ........................................................................................... 11
1.5.3 Hazardous Wastes .................................................................................. 12
1.5.4 Illinois Special Wastes ......................................................................... 15
1.5.5 Household Paints.. .................................................................................. 15
Waste Reduction .................................................................................................. 17
1.6.1 Federal Waste Reduction Programs.. ..................................................... 17
1.6.2 Illinois Waste Reduction Programs.. ...................................................... 18
Report Overview.. ................................................................................................ 19
xvii
CONTENTS (continued)
Chapter Page
2 Paint Manufacturing . . . . . . . . . . . . . . . . . . . . . . . . . . . . . . . . . . . . . . . . . . . . . . . . . . . . . . . . . . . . . . . . . . . . . . . . . . . . . . . . . . . . . . . . . . . . . . . . . . . . 21
2.1 Paint Manufacturing Processes .. . . . . . . . . . . . . . . . . . . . . . . . . . . . . . . . . . . . . . . . . . . . . . . . . . . . . . . . . . . . . . . . . . . . . . . . 21
2.2 Waste Generation . . . . . . . . . . . . . . . . . . . . . . . . . . . . . . . . . . . . . . . . . . . . . . . . . . . . . . . . . . . . . . . . . . . . . . . . . . . . . . . . . . . . . . . . . . . . 23
2.3 Waste Reduction Options .................................................................................... 26
2.3.1 Product Substitution or Reformulation .................................................. 26
2.3.2 Reduce VOC Emissions.. ....................................................................... 26
2.3.3 Reduce Quantity and Toxicity of Cleaning Waste.. ............................... 29
2.3.4 Reduce or Recover Off-Spec and Returned Paints ................................ 30
2.3.5 Reduce Waste from Spills ...................................................................... 30
2.3.6 Reduce Package Waste ........................................................................... 30
2.3.7 Reduce Filter Wastes.. ............................................................................ 30
2.3.8 Quality Control ....................................................................................... 31
3 Paint Application . . . . . . . . . . . . . . . . . . . . . . . . . . . . . . . . . . . . . . . . . . . . . . . . . . . . . . . . . . . . . . . . . . . . . . . . . . . . . . . . . . . . . . . . . . . . . . . . . . . . . . . . . . 33
3.1 Process Description .............................................................................................. 33
3.1.1 Surface Preparation ................................................................................ 33
3.1.2 Paint Application .................................................................................... 35
3.1.3 Curing ..................................................................................................... 35
3.2 Waste Generation . . . . . . . . . . . . . . . . . . . . . . . . . . . . . . . . . . . . . . . . . . . . . . . . . . . . . . . . . . . . . . . . . . . . . . . . . . . . . . . . . . . . . . . . . . . . . . 38
3.3 Waste Reduction ................................................................................................. .38
3.3.1 Substitute or Reformulate Raw Materials .............................................. 41
3.3.2 Reduce Quantity and Toxicity of Surface Preparation Wastes.. ........... 41
3.3.3 Increase Paint Transfer Efficiency ......................................................... 42
3.3.4 Reduce Equipment Cleaning Waste ....................................................... 42
3.3.5 Reduce Wastes from Air Pollution Control ........................................... 43
3.3.6 Reduce Obsolete or Unwanted Paints .................................................... 43
3.3.7 Reduce Container Waste ........................................................................ 33
xviii
CONTENTS (continued)
Chapter Page
4 Paint Removal ............................................................................................................... 45
4.1 Conventional Paint Removal Processes ............................................................... 45
4.2 Waste Generation.. ............................................................................................... 48
4.3 Waste Reduction .................................................................................................. 48
4.3.1 Rinsewater Reduction ............................................................................ 48
4.3.2 Solvent Substitution ............................................................................... 50
4.3.3 Abrasive Media Substitution .................................................................. 50
4.3.4 Removal Process Substitution ................................................................ 51
5 Paint-Related Activities in Illinois .............................................................................. 53
5.1
5.2
5.3
5.4
5.5
5.6
Introduction .......................................................................................................... 53
Study Methodology .............................................................................................. 53
5.2.1 Survey Methodology .............................................................................. 53
5.2.2 Site Visit Methodology .......................................................................... 56
Paint Manufacturing in Illinois ............................................................................ 57
5.3.1 Description of Illinois Paint Manufacturers.. ......................................... 57
5.3.2 Waste Generated by Illinois Paint Manufacturers.. ................................ 59
5.3.3 Waste Reduction by Illinois Paint Manufacturers.. ............................... 61
Paint Application in Illinois ................................................................................. 64
5.4.1 Description of Paint Applications in Illinois ........................................ 64
5.4.2 Wastes Generated from Paint Application ............................................. 65
5.4.3 Waste Reduction by Illinois Industries Applying Paint.. ...................... 72
Paint Removal in Illinois ..................................................................................... 77
5.5.1 Description of Illinois Paint Removers .................................................. 77
5.5.2 Wastes Generated by Paint Removal ..................................................... 78
5.5.3 Waste Reduction for Paint Removal Operations in Illinois.. ................. 79
Waste Reduction Programs for Illinois Firms ..................................................... 81
xix

CONTENTS (continued)
Chapter Page
6 Waste Management, Disposal, and Reduction Options for Illinois . . . . . . . . . . . . . . . . . . . . . . . . . 87
6.1 Introduction . . . . . . . . . . . . . . . . . . . . . . . . . . . . . . . . . . . . . . . . . . . . . . . . . . . . . . . . . . . . . . . . . . . . . . . . . . . . . . . . . . . . . . . . . . . . . . . . . . . . . . . . . . 87
6.2 Large Businesses . . . . . . . . . . . . . . . . . . . . . . . . . . . . . . . . . . . . . . . . . . . . . . . . . . . . . . . . . . . . . . . . . . . . . . . . . . . . . . . . . . . . . . . . . . . . . . . . . .87
6.3 Small Businesses .................................................................................................. 87
6.3.1 Painting Contractors.. ............................................................................. 88
6.3.2 Auto Body Shops ................................................................................... 89
6.4 Households.. ......................................................................................................... 9 1
6.4.1 Household Hazardous Waste Collections .............................................. 92
6.4.2 Recycling Opportunities for Household Paint Waste ........................... .93
6.4.3 Other Waste Reduction Options for Household Paint Waste ............... .95
7 Conclusions and Recommendations . . . . . . . . . . . . . . . . . . . . . . . . . . . . . . . . . . . . . . . . . . . . . . . . . . . . . . . . . . . . . . . . . . . . . . . . . . . 97
7.1
7.2
7.3
7.4
7.5
7.6
7.7
Recommendations for Paint Manufacturers ......................................................... 98
Recommendations for Industrial Users of Paint.. ................................................ 99
Recommendations for Auto Body Repair Shops ............................................... 100
Recommendations for Household Users of Paint .............................................. 101
Recommendations for Household Painting Contractors .................................... 102
Recommended Education Program .................................................................... 102
7.6.1 Conceptual Basis For Educational Program Recommendations .......... 103
7.6.2 Description of Educational Materials.. ................................................. 104
Funding for Recommended Programs ............................................................... 110
References . . . . . . . . . . . . . . . . . . . . . . . . . . . . . . . . . . . . . . . . . . . . . . . . . . . . . . . . . . . . . . . . . . . . . . . . . . . . . . . . . . . . . . . . . . . . . . . . . . . . . . . . . . . . . . . . . . . . . . . . .... 113
Glossary . . . . . . . . . . . . . . . . . . . . . . . . . . . . . . . . . . . . . . . . . . . . . . . . . . . . . . . . . . . . . . . . . . . . . . . . . . . . . . . . . . . . . . . . . . . . . . . . . . . . . . . . . . . . . . . . . . . . . . . . ........ 117
Volume II Summaries of Site Visits
xx
TABLES
PageNumber
l - l
l-2
l-3
l-4
l-5
2-l
2-2
2-3
3-l
3-2
3-3
4-l
5-l
5-2
5-3
5-4
5-5
5-6
Some Common Pigments.. .................................................................................................... 3
Common Organic Solvents Used in Paint Formulation.. ...................................................... 5
Onsite Management of RCRA Hazardous Paint Waste Generated by LQGsin Illinois in 1986.. .............................................................................................................. 12
Offsite Management of RCRA Hazardous Paint Waste in Illinois in 1986 ....................... 14
Out-of-State RCRA Hazardous Waste Management of Illinois Paint Wastein 1986 ................................................................................................................................ 14
Air Emissions of SARA Toxic Chemicals by Illinois Paint Manufacturersin 1989 ................................................................................................................................ 24
Sources of Hazardous Waste from Paint Manufacturers in Illinois in1986 ..................... 26
Waste Reduction Techniques for Paint Manufacturing.. .................................................... 27
Paint Application Processes.. .............................................................................................. 36
Estimated Transfer Efficiencies For Various Painting Technologies.. ............................... 37
Waste Reduction Techniques for Paint Application.. ......................................................... 39
Waste Reduction Techniques for Paint Removal ............................................................... 49
Number of Facilities Surveyed and Responding ................................................................ 55
Types of Paint Manufactured by Paint Survey Respondents.. ............................................ 58
Cleaning Techniques Used by Paint Manufacturers Responding to PaintSurvey ................................................................................................................................. 59
Preliminary Estimates of Paint-Related Waste Generation and Managementfor Paint Manufacturers in Illinois.. .................................................................................... 60
Reasons for Waste Reduction in Paint Manufacturing as Reported by PaintSurvey Respondents.. .......................................................................................................... 62
Barriers to Reducing Waste Generation from Paint Manufacturing asReported by Paint Survey Respondents.. ........................................................................... .63
xxi

TABLES (continued)
Number Page
5-7
5-8
5-9
5-10
5-11
5-12
5-13
5-14
5-15
5-16
5-17
5-18
5-19
5-20
5-21
Recycling by Paint Manufacturers Responding to the Paint Survey . . . . . . . . . . . . . . . . . . . . . . . . . . . . . . . . . . 63
Quantity of Paint Used Nationally in 1990 by Type of Use (Millions ofGallons) . . . . . . . . . . . . . . . . . . . . . . . . . . . . . . . . . . . . . . . . . . . . . . . . . . . . . ........................... . . . . . . . . . . . 64
Surface Preparation Methods Used by Paint Survey Respondents ApplyingPaint . . .. . . . . . . . . . . . . . . . . . . . . . . . . . . . . . . . . . . . . . . . . . . . . . . . . . . . . . . . . . . . . . . . . . . . . . . . . . . . . . . . . . . . . . . . . . . . . . . . . . . . . . . . . . . . . . . . . ..........67
Types of Paint Used by Industry for Paint Survey Respondents ApplyingPaint . . . . . . . . . . . . . . . . . . . . . . . . . . . . . . . . . . . . . . . . . . . . . . . . . . . . . . . . . . . . . . . . . . . . . . . . . . . . . . . . . . . . . . . . . . . . . . . . . . . . . . . . . . . . ..68
Paint Application Methods Used by Paint Survey Respondents . . . . . . . . . . . . . . . . . . . . . . . . . . . . . . 69
Methods Used to Clean Paint Application Equipment by Paint SurveyRespondents . . . . . . . . . . . . . . . . . . . . . . . . . . . . . . . . . . . . . . . . . . . . . . . . . . . . . . . . . . . . . . . . . . . . . . . . . . . . . . . . ... . . . . 70
Waste Reduction in Paint Application by Industry as Reported by PaintSurvey Respondents . . . . . . . . . . . . . . . . . . . . . . . . . . . . . . . . . . . . . . . . . . . . . . . . . . . . . . . . . . . . . . . . . . . . . . . . . . . . . . . . . . . . . . . . . . . . . . . . . . . . . . . . . . . . 74
Reasons for Waste Reduction in Paint Application as Reported by PaintSurvey Respondents . . . . . . . . . . . . . . . . . . . . . . . . . . . . . . . . . . . . . . . . . . . . . . . . . . . . . . . . . . . . . . . . . . . . . . . . . 75
Barriers to Reducing Waste Generation from Paint Application for PaintSurvey R e s p o n d e n t s . . . . . . . . . . . . . . . . . . . . . . . . . . . . . . 7 6
Number of Paint Survey Respondents Recycling Their Paint ApplicationWaste . . . . . . . . . . . . . . . . . . . . . . . . . . . . . . . . . . . . . . . . . . . . . . . . . . . . . . . . . . . . . . . . . . . . . . . . . . . . . . . . . . . . . . . . . . . . . . . . . . . . . . . . . . . . . . . . . . . . . 76
Number of Paint Survey Respondents Applying and Removing Paint byIndustry. . . . . . . . . . . . . . . . . . . . . . . . . . . . . . . . . . . . . . . . . . . . . . . . . . . . . . . . . . . . . . . . . . . . . . . . . . . . . . . . . . . . . . . 77
Methods Used to Remove Paint by Paint Survey Respondents . . . . . . . . . . . . . . . . . . . . . . . . . . . . . . . . . . . . . . . . . . 78
Waste Reduction in Paint Removal by Industry for Paint SurveyRespondents . . . . . . . . . . . . . . . . . . . . . . . . . . . . . . . . . . . . . . . . . . . . . . . . . . . . . . . . . . . . . . . . . . . . . . . . . . . . . . . . . . . . . . . . . . . . . . . . . . . . . . . . . . . . . . . . . . . . . . . . 79
Reasons for Waste Reduction in Paint Removal as Reported by PaintSurvey Respondents . . . . . . . . . . . . . . . . . . . . . . . . . . . . . . . . . . . . . . . . . . . . . . . . . . . . . . . . . . . . . . . . . . . . . . . . . . . . . . . . . . . . . . . . . . . . . . . . . . . . . . . . . . . . 80
Barriers to Reducing Waste Generation from Paint Removal as Reported byPaint Survey Respondents . . . . . . . . . . . . . . . . . . . . . . . . . . . . . . . . . . . . . . . . . . . . . . . . . . . . . . . . . . . . . . . . . . . . . . . . . . . . . . . . . . . . . . . . . . . . . . 81
xxii

TABLES (continued)
Number Page
5-22 Number of Facilities Considering Waste Reduction by Reason as Reportedby Paint Survey Respondents ...................................,........................................................ 82
5-23 Number of Facilities with Waste Reduction Programs as Reported by PaintSurvey Respondents . . . . . . . . . . . . . . . . . . . . . . . . . . . . . . . . . . . . . . . . . . . . . . . . . . . . . . . . . . . . . . . . . . . . . . . . . . . . . . 83
5-24 Sources of Information about Waste Reduction as Reported by PaintSurvey Respondents . . . . . . . . . . . . . . . . . . . . . . . . . . . . . . . . . . . . . . . . . . . . . . . . . . . . . . . . . . . . . . . . . . . . . . 84
5-25 Types of Waste Reduction Information Needed by Paint SurveyRespondents . . . . . . . . . . . . . . . . . . . . . . . . . . . . . . . . . . . . . . . . . . . . . . . . . . . . . . . . . . . . . . . . . . . . . . . . . . . . . . . . . . . . . 85
5-26
6-l
7-l
7-2
7-3
7-4
7-5
Types of Waste Reduction Information Needed by Industry for PaintSurvey Respondents . . . . . . . . . . . . . . . . . . . . . . . . . . . . . . . . . . . . . . . . . . . . . . . . . . . . . . . . . . . . . . . . . . . . . . .86
Barriers to Reducing Paint-Related Waste Generation for Auto BodyRepair Shops Responding to the Paint Survey . . . . . . . . . . . . . . . . . . . . ...................................... 91
Topics for Articles, Presentations, and Case Studies . . . . . . . . . . . . . . . . . . . . . . . . . . . . . . . . . . . . . . . . . . . . . . . . . . . . . . . . 105
Procedures To Be Included in an Audit Guide . . . . . . . . . . . . . . . . . . . . . . . . . . . . . . . . . . . . . . . . . . . . . 106
Suggested Outline for Case Studies . . . . . . . . . . . . . . . . . . . . . . . . . . . . . . . . . . . . . . . . . . . . . . . . . . . . . .107
Topics for Training Sessions . . . . . . . . . . . . . . . . . . . . . . . . . . . . . . . . . . . . . . . . . . . . . . . . . . . . . . . . . . . . . . . . . . . . . . . . . . . . . . . . . . . . . . . . . . . . 108
Sample Reminder Sheet for an Auto Repair Shop . . . . . . . . . . . . . . . . . . . . . . . . . . . . . . . . . . . . . . . . . . . . . . 109
x x i i i

FIGURES
Number Page
l - l
2-l
2-2
3-l
4-l
4-2
5-l
5-2
Paint Life Cycle and Associated Waste Generation ............................................................. 9
Paint Manufacturing Process and Waste Generation.. ........................................................ 22
Most Common Types of Hazardous Waste Generated by PaintManufacturers in Illinois in 1986.. ...................................................................................... 25
Paint Application Process and Waste Generation.. ............................................................. 34
Abrasive Blasting Process and Waste Generated ............................................................... 46
Solvent Stripping Process and Waste Generated.. ............................................................. .47
Size Distribution of Illinois Paint Manufacturers.. ............................................................. 58
Quantities of Paint Applied Nationally in 1990.. ................................................................ 66
xxiv

CHAPTER 1
INTRODUCTION
The manufacture and use of paints and coatings is an important part of the Illinoiseconomy. Illinois is among the top five states in the production of paints and coatings. Inaddition, most Illinois manufacturing industries and many of the small businesses, such asautomobile body shops, use paint in their operations. Furthermore, households andresidential/commercial painting contractors use large quantities of paint.
Both the manufacture and use of paint result in the generation of significant quantitiesof waste. The wastes generated occur in solid, liquid, and gaseous form and, because ofthe nature of paint, are hazardous or toxic in many cases.
The Illinois General Assembly amended the Solid Waste Management Act in 1989,directing the Illinois Department of Energy and Natural Resources (ENR) to
l “conduct a study to develop cost-effective, environmentally sound, andtechnically feasible waste paint disposal options for small businesses, includingat least painting contractors, auto body shops, and households;” and
l “[develop] an effective public education program to inform small businesses andhouseholds about the best available waste paint reduction and managementoptions.” (House Bill 1356)
ENR is directed to “report to the Governor and the General Assembly on its activities. . . with recommendations for legislation or regulations necessary to address the reductionand management of paint waste.” This report was prepared to meet this requirement.
Throughout this report, the term “waste” is used to refer to all nonproduct outputsfrom manufacturing or using paint. This definition of waste includes releases to the air,water, and land. It also refers to waste generation before any treatment or recoveryactivities. In this report, the wastes associated with paint manufacture and use arebroadly referred to as “paint-related waste.”
1.1 OBJECTIVES AND METHODOLOGY
Three primary objectives were identified for this project:
l Identify waste reduction and waste management options that can beimplemented by the Illinois paint industry (both manufacturers and users).
l Make recommendations for an education program to help alleviate the problem.
l Suggest policy options to address the problem as defined by the project.
The first phase of the project involved conducting a thorough review of currentliterature and existing data sources to characterize the following:
. current waste reduction practices of Illinois manufacturers and users of paint;
l paints used and paint-related wastes generated in Illinois;

. the scope and magnitude of the paint waste problem in Illinois, including wastegeneration and waste management techniques and their impact on theenvironment;
. technically and economically feasible waste reduction options;
l additional data needs to be addressed in subsequent tasks;
l relevant terminology and recommendations for standardized definitions for thepurposes of this project; and
l relevant state and federal legislation and associated regulations.
Chapters 2 to 4 present the results of Phase I.
The second phase of the project was designed to gather additional data on paint-relatedoperations in Illinois, the wastes those operations generate, and how those wastes aremanaged In addition, Phase II gathered data on current paint-related waste reductionactivities in Illinois and the potential for further waste reduction. Phase II focused onmanufacturers and on industrial and commercial users, because sufficient information onhousehold use was identified during the Phase I literature review. Chapter 5 presents theresults of Phase II, which consisted of a survey of Illinois’ paint manufacturers andindustrial users and onsite investigations with manufacturers, users, and wastemanagement facilities.
To assist in conducting this study, an Ad Hoc Advisory Group (AHAG) was formed.AHAG consists of representatives of Illinois paint manufacturers and industrial andcommercial paint users. The Hazardous Waste Research and Information Center(HWRIC) recognized that issues associated with paint usage vary widely amongindustries, so AHAG was formed to provide as many points of view as possible. Thegroup provided input throughout the course of this study and was invited to review thisreport.
‘The purpose of this report is to provide a broad overview of paint-related activities inIllinois and to try to assess the extent of paint-related waste disposal problems in Illinois.The results of this study indicate that the types of paints and paint usages vary greatly.Therefore, the findings of this study may not apply to all situations.
1.2 PAINT COMPONENTs
Paint can be defined as a fluid material that when spread over a surface in a thin layerwill form a solid, cohesive, and adherent film (Morgans, 1990). Paint is generallyconsidered to consist of a mixture of the following components:
l pigment,
l binder,
l solvent, and
l additives
In paint, the combination of binder and solvent is referred to as the paint “vehicle.”Pigment and additives are dispersed within the vehicle. The type and proportion of eachof the components determine the properties of a particular paint. The various components
2
of paint also determine the characteristics of the waste generated in its manufacture anduse, including the potential environmental hazard and the available waste managementoptions. Some of the most common paint components are described below.
1.2.1 Pigments
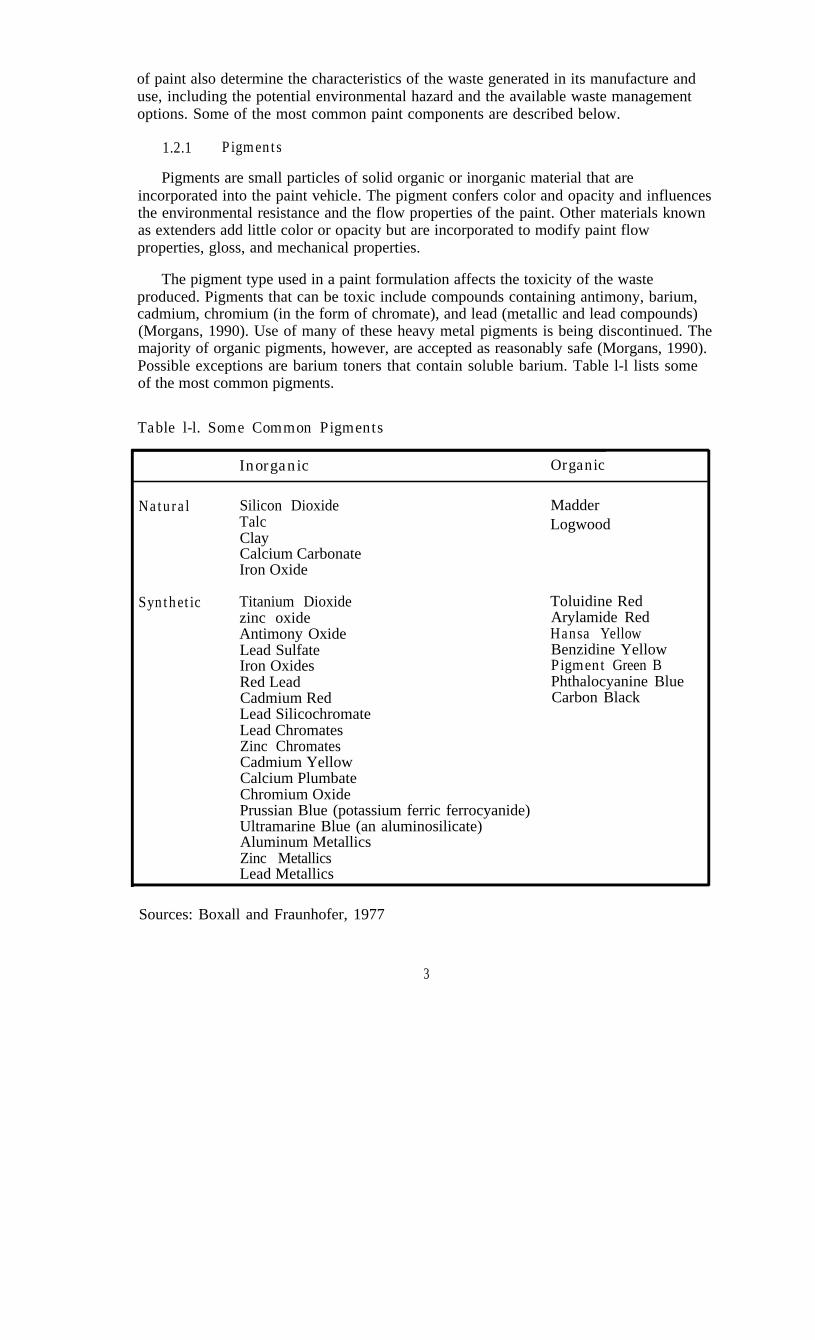
Pigments are small particles of solid organic or inorganic material that areincorporated into the paint vehicle. The pigment confers color and opacity and influencesthe environmental resistance and the flow properties of the paint. Other materials knownas extenders add little color or opacity but are incorporated to modify paint flowproperties, gloss, and mechanical properties.
The pigment type used in a paint formulation affects the toxicity of the wasteproduced. Pigments that can be toxic include compounds containing antimony, barium,cadmium, chromium (in the form of chromate), and lead (metallic and lead compounds)(Morgans, 1990). Use of many of these heavy metal pigments is being discontinued. Themajority of organic pigments, however, are accepted as reasonably safe (Morgans, 1990).Possible exceptions are barium toners that contain soluble barium. Table l-l lists someof the most common pigments.
Table l-l. Some Common Pigments
Inorganic Organic
Natural Silicon DioxideTalcClayCalcium CarbonateIron Oxide
Synthetic Titanium Dioxidezinc oxideAntimony OxideLead SulfateIron OxidesRed LeadCadmium RedLead SilicochromateLead ChromatesZinc ChromatesCadmium YellowCalcium PlumbateChromium OxidePrussian Blue (potassium ferric ferrocyanide)Ultramarine Blue (an aluminosilicate)Aluminum MetallicsZinc MetallicsLead Metallics
MadderLogwood
Toluidine RedArylamide RedHansa YellowBenzidine YellowPigment Green BPhthalocyanine BlueCarbon Black
Sources: Boxall and Fraunhofer, 1977
3

1.2.2 Binder
The binder is the portion of the paint that provides film continuity and adhesion to thesubstrate. The binder is the primary component that remains after the paint has cured1
Binders in paints are natural or artificial polymeric resin materials. Paints can beclassified based on the polymeric material(s) that make up the binder, recognizing that forcertain types of binders the solvents used to dissolve or disperse the binder can be wateror organic chemicals.
Some resin solutions may contribute to the volatile organic compound (VOC) contentof the paint. When cured, most resins used as paint binders are nontoxic and insoluble inwater. Listed below are some of the types of binders used in paint formulation (Boxalland Fraunhofer, 1977):
l oleoresinous- linseedoil- tung oil- oiticica oil
l alkyd resins
. amino resins
l vinyl resins
l acrylic resins
l epoxy resins
l polyurethane resins
l chlorinated rubber
l cellulosic polymers
. phenolic resins
1.2.3 Solvents
Solvents, including water, are volatile liquids added to paints in or&r to disperse ordissolve the binder component and to modify the viscosity of the coating. In paints withbinders based on convertible resins (i.e., those that undergo chemical reaction uponcuring), solvents are added to enable the coating to be applied by a suitable technique. Inpaints based on nonconvertible resins that do not undergo chemical reaction duringdrying, the solvents perform a more complex function in determining the final quality ofthe resultant film and the drying time. Furthermore, many paint application techniquesrequite the paint to have a narrow range of solvent-controlled physical and electricalproperties. In these cases, it is common practice to blend two or more solvents to obtainthe desired performance.
lThe paint forms a film when the binder converts to a solid. This occurs through chemical reactions suchas addition or condensation polymerization, oxidation polymerization, or evaporation of the solvent inwhich the binder is carried (Boxall and Fraunhofer, 1977). Collectively, these are referred to as paintcuring or drying processes.
4

Solvents used in paints are released through evaporation in limited quantities duringpaint manufacturing and in large quantities by design when paint dries or cures. TheClean Air Act Amendments of 1990 will reduce the use of many common organicsolvents because they lead to the generation of atmospheric ozone. The amended CleanAir Act will phase out the production of some organic solvents that contribute to ozonedepletion, such as l,l,l-trichloroethane (see Section 1.5.1).
A wide range of organic chemicals are used as solvents in paint. Table l-2 lists someorganic solvents commonly used in paint formulation. Generally, these chemicals areclassified as hazardous due to toxicity, ignitability, or both. Organic solvents are highlymobile and present a strong potential for groundwater contamination if they enter alandfill. Most organic solvents are relatively easily recycled or can be blended for fuel orincinerated.
Table 1-2. Common Organic Solvents Used in Paint Formulation
Flash Industrial AirPoint RCRA Toxics Toxics
Solvent (°F) Toxicitya Hazardous Programb Programc
Aliphatic Hydrocarbons:Mineral Spirits 104 NR Yes No No
Aromatic Hydrocarbons:Toluene 43 5 Yes Yes YesXylene 78 5 Yes Yes Yes
Esters:Ethyl Acetate 24 11 Yes No NoButyl Acetate 72 14 Yes No No
Ketones:Acetone 0 9.75 Yes No NoMethyl Isobutyl Ketone 73 2.08 Yes Yes YesMethyl Ethyl Ketone 22 3.4 Yes Yes Yes
Glycol Ethers:Ethylene Glycol 202 3 No No No
Monoethyl Ether
Alcohols:Ethyl Alcohol 55 6 Yes No NoButyl Alcohol <l00 0.79 Yes No No
aToxicity, LD50 (oral), in grams of toxic material per kilogram of body weight‘Chemicals in the 1989 Toxic Release Inventory (TRI) targeted by USEPA for reduction due to toxicity
and large quantities released (USEPA, 1991c).CUnder the 1990 Clean Air Act amendments.Sources: USEPA, 1991a; Hazardous Waste Consultant, 1991b; 40 CFR 261.30.
5

1.3 PAINT CLASSIFICATION
Paint classification can be approached in many different ways. From the standpointof waste reduction and disposal, a convenient method is to classify paints based on theprimary type of solvent they contain, recognizing that many paints contain a mixture ofsolvents. Using this approach paints can be classified as follows:
l waterborne,
l organic solvent-borne, or
l powder (dry, without solvent).
1.3.1 Waterborne Coatings
The term waterborne refers to coating systems that use water to some degree as thesolvent. These types of coatings include aqueous emulsions (latex), colloidal dispersions,and water-reducible coatings.
Emulsion, or latex, coatings are made from polymers that are synthesized in water andcontain a surfactant. Emulsion paints are formed by emulsion polymerization (i.e., byintroducing a liquid monomer into water and causing polymerization of that monomerwithin small droplets). These coatings consist of discrete particles of high molecularweight polymer dispersed in an aqueous media. Emulsion paints are manufactured using avariety of polymeric resins. ‘Resins used in emulsion paint vehicles include styrene-butadiene copolymers, polyvinyl acetate, acrylics, alkyds, and polystyrene. The term“latex” has become synonymous with emulsion paints, but latex specifically refers to anemulsion of rubber particles. Latex coatings are used primarily for architectural purposes.They have proven to be generally unacceptable for use in industrial finishing due toproblems associated with application (Gardon, 1973).
Water-reducible coatings are coatings that use water in part as a solvent and that canbe reduced (thinned) using water. These coatings can be applied effectively using a widerange of application techniques. Water-reducible coatings are more chemically complexthan latex coatings. In water-reducible coatings chemical structures (polar groups) areincorporated into the polymer to make it soluble in water. The polymers used in water-reducible coatings are copolymers (polymers made with more than one kind of monomer)that are synthesized in water-miscible organic solvents such as alcohols and esters.Incorporated in these polymers is a small percentage of a monomer containing carboxylicacid. These acid groups are then neutralized by bases such as ammonia or amines toresult in a product that is soluble in water. The water-reducible coating does containorganic solvents. A high boiling point, water-miscible organic solvent is required to aidcoalescence of the polymer after the water leaves the paint film. During curing of thewater-reducible coating, the water, solvent, and bases (ammonia or amines) evaporate,leaving a material that is no longer soluble in water. Chemicals that induce cross-linkingof the polymer as the coating cures can be added to improve coating durability.
Waterborne paints are not entirely free of organic solvents. Normally, a waterbornepaint requires an organic coalescing solvent. The coalescing solvent enables thedeposited paint film to have fluidity for smooth curing after the water has evaporated.
6

VOCs in waterborne paints can vary; one manufacturer provided the following datafor water reducible paints used as product coatings:
l Water reducible enamel (suitable for use on electronic business machines,computers, etc.) VOC = 2.3 pounds per gallon.
l Water reducible baking enamel (suitable for interior and exterior generalfinishing of metal products) VOC = 2.3 pounds per gallon.
l Water reducible shopcoat primer (for use as primer coat with above products)VOC = 2.8 pounds per gallon.
For waterborne emulsions (latex paints), data obtained from the National Paint andCoatings Association (NPCA) suggest median values for VOC of approximately 0.39pounds per gallon (NPCA, 1989). The South Coast Air Quality Management District inCalifornia recommends a limit of 2.1 pounds per gallon.
Waterborne paints have advantages over some types of organic solvent-bornecoatings because they generally decrease VOC emissions, eliminate organic solvents forthinning, and reduce the use of organic solvents during clean-up. When wastewater isgenerated in waterborne painting, (such as in water-wall paint booths), the wastewatercontains fewer toxic organics because of the limited organic solvents in the paint. Thereare, however, two key disadvantages to waterborne paints. First, the surface to be paintedmust be completely free of oil film or the paint will not adhere well. Secondly,waterborne coatings require longer drying times or oven drying.
1.3.2 Organic Solvent-borne Coatings
Many “conventional” paints are organic solvent-borne. Nearly every type of bindermaterial can be used in formulating organic solvent-borne paints. Included among organicsolvent-borne paints are “oil-based” paint, most industrial and special coatings, primers,and wood finishes.
By their nature, organic solvent-borne coatings contain significant amounts of VOCs.High-solids coatings are being formulated to reduce VOCs. The solids content requiredin order for a coating to be considered a high-solids coating is not clearly established,Rauch (1990) defines high-solids coatings as having over 60 percent solids. The highersolids content produces a coating using less solvent, but modifications to sprayingequipment are required due to the greater viscosity of high-solids coatings. Also, thereduced solvent content makes high-solids coatings less tolerant to contaminants on thesurface being coated (Higgins, 1989).
Wastes from organic solvent-borne paints are generally hazardous due to toxicity,flammability, or both. However, the relative ease of solvent recycling and the high Btucontent of organic solvent wastes provide several possible avenues for waste recycling orreuse.
1.3.3 Powder Coatings
Powder coatings entirely eliminate the use of a solvent and consist of resin, pigment,curing agents, catalysts, reinforcing filler, flow control agents, and other minoringredients. The use of powder coatings continues to expand; in 1990 they made up
7
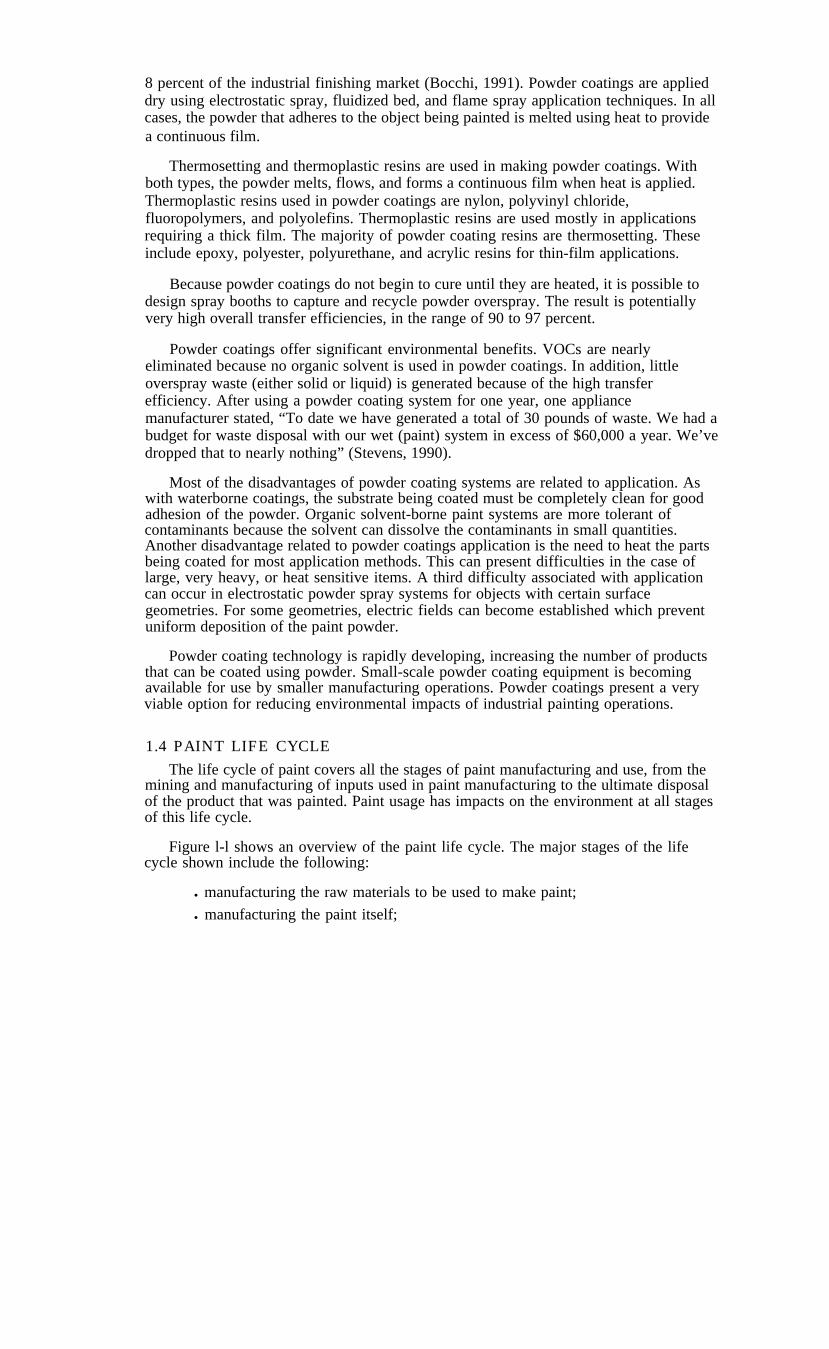
8 percent of the industrial finishing market (Bocchi, 1991). Powder coatings are applieddry using electrostatic spray, fluidized bed, and flame spray application techniques. In allcases, the powder that adheres to the object being painted is melted using heat to providea continuous film.
Thermosetting and thermoplastic resins are used in making powder coatings. Withboth types, the powder melts, flows, and forms a continuous film when heat is applied.Thermoplastic resins used in powder coatings are nylon, polyvinyl chloride,fluoropolymers, and polyolefins. Thermoplastic resins are used mostly in applicationsrequiring a thick film. The majority of powder coating resins are thermosetting. Theseinclude epoxy, polyester, polyurethane, and acrylic resins for thin-film applications.
Because powder coatings do not begin to cure until they are heated, it is possible todesign spray booths to capture and recycle powder overspray. The result is potentiallyvery high overall transfer efficiencies, in the range of 90 to 97 percent.
Powder coatings offer significant environmental benefits. VOCs are nearlyeliminated because no organic solvent is used in powder coatings. In addition, littleoverspray waste (either solid or liquid) is generated because of the high transferefficiency. After using a powder coating system for one year, one appliancemanufacturer stated, “To date we have generated a total of 30 pounds of waste. We had abudget for waste disposal with our wet (paint) system in excess of $60,000 a year. We’vedropped that to nearly nothing” (Stevens, 1990).
Most of the disadvantages of powder coating systems are related to application. Aswith waterborne coatings, the substrate being coated must be completely clean for goodadhesion of the powder. Organic solvent-borne paint systems are more tolerant ofcontaminants because the solvent can dissolve the contaminants in small quantities.Another disadvantage related to powder coatings application is the need to heat the partsbeing coated for most application methods. This can present difficulties in the case oflarge, very heavy, or heat sensitive items. A third difficulty associated with applicationcan occur in electrostatic powder spray systems for objects with certain surfacegeometries. For some geometries, electric fields can become established which preventuniform deposition of the paint powder.
Powder coating technology is rapidly developing, increasing the number of productsthat can be coated using powder. Small-scale powder coating equipment is becomingavailable for use by smaller manufacturing operations. Powder coatings present a veryviable option for reducing environmental impacts of industrial painting operations.
1.4 PAINT LIFE CYCLEThe life cycle of paint covers all the stages of paint manufacturing and use, from the
mining and manufacturing of inputs used in paint manufacturing to the ultimate disposalof the product that was painted. Paint usage has impacts on the environment at all stagesof this life cycle.
Figure l-l shows an overview of the paint life cycle. The major stages of the lifecycle shown include the following:
l manufacturing the raw materials to be used to make paint;
l manufacturing the paint itself;


l applying the paint;
l removing the paint, if required; and
. disposing of the item that had been painted (e.g., taking an old car to the junkyard).
In addition, the life cycle of paint includes transporting materials, managing wastesgenerated, and producing energy that is consumed throughout the life cycle. This studyfocuses on the paint manufacturing, application, and removal stages of the paint lifecycle, with emphasis on the application and removal stages.
Figure l-l shows the primary inputs used at each stage of the paint life cycle. Many ofthese inputs are toxic, flammable, or caustic. For example, heavy metals can be used aspigments and mercury can be used as a biocide in paint formulations. In addition, organicsolvents such as those used in paint formulations, as paint thinner, as paint remover, and toclean equipment may contribute to ozone and other environmental pollution.
Figure l-l also shows wastes generated at each stage of the paint life cycle. Many ofthese wastes pose an environmental or health risk, partly because of the use of hazardousor toxic inputs in paint formulations.
1.5 WASTE MANAGEMENT REGULATIONS
As described above, paint-related waste released at each stage in the paint life cyclecan pose environmental or health risks. To reduce this risk, the federal government andthe state of Illinois regulate the generation and management of many of these wastes.Applicable regulations depend on
l the environmental medium to which the waste is released and
l the regulatory status of the generator.
Following is a general summary of regulations governing the management of paint-related waste.
1.51 Air Releases
Sources of air releases from paint manufacturing and use include releases of
l VOCs, which contribute to ozone pollution;
l heavy metal dust from pigments and, in the case of mercury, biocides used inpaint formulations; and
l atomized paint from spray applications.
The federal Clean Air Act regulates air releases. Prior to 1990, major provisions of theClean Air Act included the National Ambient Air Quality Standards (NAAQS) (40 CFR50) and the National Emission Standards for Hazardous Air Pollutants (NESHAP) (40CFR 61).
The 1990 Clean Air Act amendments will have a major impact on paintmanufacturing and use. Under the amendments, a new Air Toxics Program replaces the
10

NESHAP program. The Air Toxics Program will require mandatory emission controltechnologies for sources of 189 listed hazardous air pollutants, including some organicsolvents and heavy metals used in paint formulations (Hazardous Waste Consultant,1991b).
The NAAQS program has been revised to address ozone pollution. The new ozonestandards will require many currently unregulated sources to comply with NAAQSnonattainment provisions. Regulations for ozone pollution will include annual reportingrequirements for VOC emissions, mandatory reductions in VOC emissions, and, in severeand extreme nonattainment areas, annual fees of $5,000 per ton of VOC emitted by asource in excess of the baseline amount, with the baseline to be determined by U.S.Environmental Protection Agency (USEPA) based on either actual VOC emissions orVOC emissions allowed under the source’s permit. In addition, USEPA is required tostudy VOC emissions from consumer and commercial products and establish regulatorycontrols to lower VOC emissions. Possible regulatory controls include chemicalreformulation, product or feedstock substitution, repackaging, and directions for use,consumption, and storage (Hazardous Waste Consultant, 1991b). These requirementscould result in reductions in the VOC content of paints.
A stratospheric ozone protection program has also been included in the Clean Air Actamendments. This new program will require the phase-out of production of ozone-depleting chemicals, including chloroflourocarbons (CFCs), halons, carbon tetrachloride,methyl chloroform, and hydrochloroflourocarbons (HCFCs) (Hazardous WasteConsultant, 1991b). Some of these chemicals, such as l,l,l-trichloroethane, are currentlyused in paint formulations (Industrial Finishing, 1990).
Finally, the 1990 amendments include a permitting program that will require mostregulated stationary sources of air emissions to obtain permits and comply withmonitoring and reporting requirements. The permitting provisions will also includeannual fees (Hazardous Waste Consultant, 1991b).
1.52 Wastewaters
Wastewaters are generated due to equipment cleaning, surface preparation, and therinsing of a surface after paint removal. Paint-related wastewaters can contain organicsolvents, heavy metals, and other toxic materials used in paint formulations, surfacepreparation, and equipment cleaning.
Under the federal Clean Water Act, most point sources of wastewater (e.g., dischargepipes) discharging to waterways require a National Pollutant Discharge EliminationSystem (NPDES) permit. Permits specify levels of toxicity and other characteristics thatmust be achieved prior to discharge. Pretreatment of the wastewater prior to discharge isgenerally necessary. Common wastewater treatment activities include settling to removepaint sludge and elementary neutralization.
Discharging paint into municipal sewage without pretreatment is illegal in Illinois.Nonetheless, small quantities of paint are released into municipal sewage when rinsingpaint brushes and other equipment. Reliable data on the quantities of paint wastewatersdisposed of in this manner are not available.
11
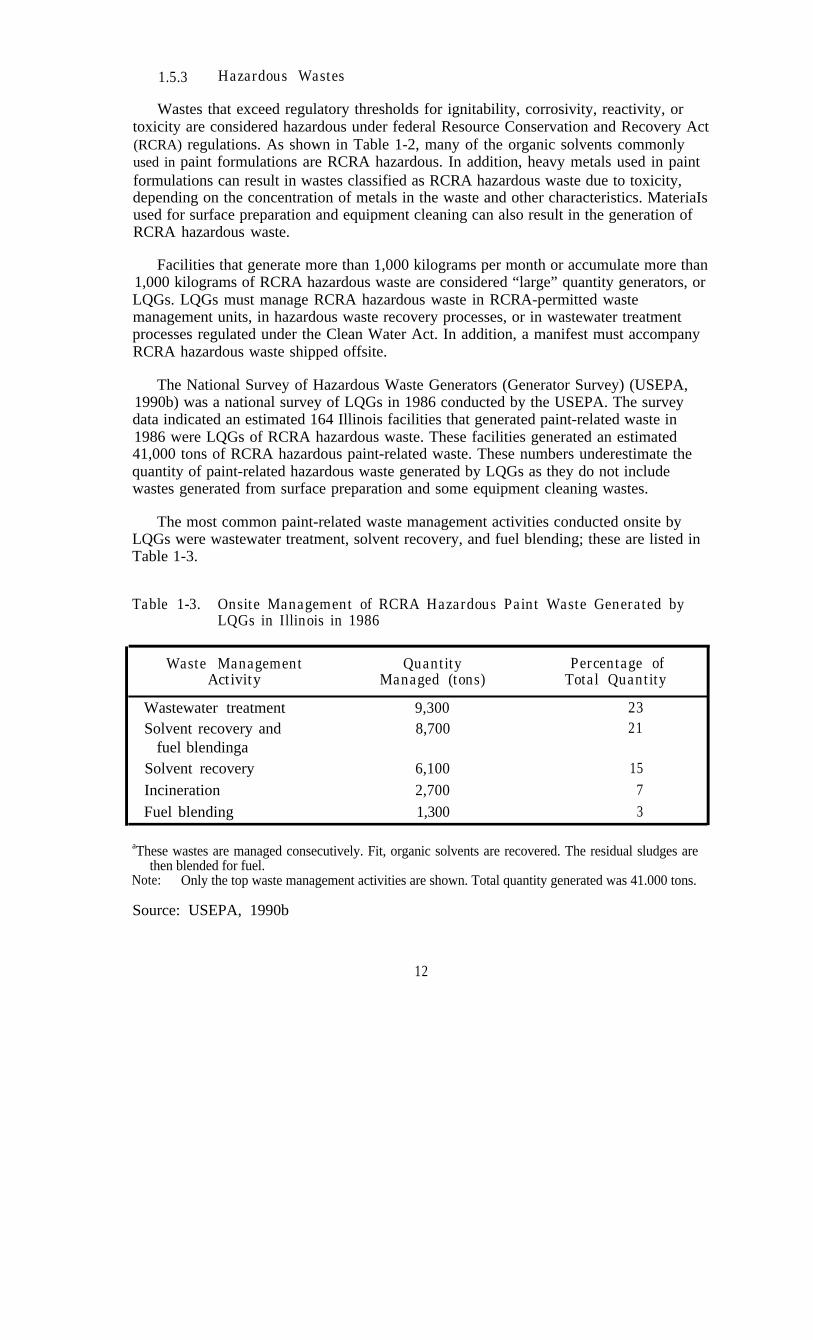
1.5.3 Hazardous Wastes
Wastes that exceed regulatory thresholds for ignitability, corrosivity, reactivity, ortoxicity are considered hazardous under federal Resource Conservation and Recovery Act(RCRA) regulations. As shown in Table 1-2, many of the organic solvents commonlyused in paint formulations are RCRA hazardous. In addition, heavy metals used in paintformulations can result in wastes classified as RCRA hazardous waste due to toxicity,depending on the concentration of metals in the waste and other characteristics. MateriaIsused for surface preparation and equipment cleaning can also result in the generation ofRCRA hazardous waste.
Facilities that generate more than 1,000 kilograms per month or accumulate more than1,000 kilograms of RCRA hazardous waste are considered “large” quantity generators, orLQGs. LQGs must manage RCRA hazardous waste in RCRA-permitted wastemanagement units, in hazardous waste recovery processes, or in wastewater treatmentprocesses regulated under the Clean Water Act. In addition, a manifest must accompanyRCRA hazardous waste shipped offsite.
The National Survey of Hazardous Waste Generators (Generator Survey) (USEPA,1990b) was a national survey of LQGs in 1986 conducted by the USEPA. The surveydata indicated an estimated 164 Illinois facilities that generated paint-related waste in1986 were LQGs of RCRA hazardous waste. These facilities generated an estimated41,000 tons of RCRA hazardous paint-related waste. These numbers underestimate thequantity of paint-related hazardous waste generated by LQGs as they do not includewastes generated from surface preparation and some equipment cleaning wastes.
The most common paint-related waste management activities conducted onsite byLQGs were wastewater treatment, solvent recovery, and fuel blending; these are listed inTable 1-3.
Table 1-3. Onsite Management of RCRA Hazardous Paint Waste Generated byLQGs in Illinois in 1986
Waste ManagementActivity
Wastewater treatmentSolvent recovery and
fuel blendingaSolvent recoveryIncinerationFuel blending
Quantity Percentage ofManaged (tons) Total Quantity
9,300 238,700 21
6,100 15
2,700 7
1,300 3
aThese wastes are managed consecutively. Fit, organic solvents are recovered. The residual sludges arethen blended for fuel.
Note: Only the top waste management activities are shown. Total quantity generated was 41.000 tons.
Source: USEPA, 1990b
12

Of the 41,000 tons of RCRA hazardous paint waste generated by LQGs in 1986,29,000 tons, or 71 percent, was sent offsite for management. Over 95 percent of paintwaste LQGs shipped RCRA hazardous paint waste offsite. Solvent recovery, reusing thewaste as fuel, and incineration were the most common offsite waste managementactivities (see Table l-4). Of those LQGs shipping hazardous waste offsite formanagement, 125 shipped their wastes to management facilities outside the state ofIllinois. In addition, 58 non-Illinois waste management facilities received this waste in1986. Table l-5 shows the most common out-of-state waste management activities forRCRA hazardous paint wastes generated by LQGs in Illinois and the number of out-of-state management facilities handling Illinois hazardous paint waste.
As Tables l-3, l-4, and l-5 show, RCRA hazardous paint-related wastes generated byLQGs are often burned for fuel recovery. Previously, burning hazardous waste for energyand material recovery in boilers and industrial furnaces had been exempt from manyRCRA regulations. In 1991, USEPA issued new regulations designed to require thatboilers and industrial furnaces comply with essentially the same standards as hazardouswaste incinerators (Hazardous Waste Consultant, 1991a). These new regulations willrequire that most boilers and industrial furnaces
l meet destruction and removal efficiency standards;
l have controls on products of incomplete combustions;
. meet emission standards for heavy metals, hydrogen chloride and chlorine gas,and particulates; and
l comply with RCRA-permitting requirements.
To avoid meeting these new regulatory requirements, some operators of boilers andindustrial furnaces may choose to discontinue burning hazardous waste. The amount ofpaint-related waste burned for energy recovery, therefore, might decline.
According to federal regulations, small quantity generators are classified as generatorsof at least 100 kilograms (220 pounds) per month but less than 1,000 kilograms(2,200 pounds) per month of RCRA hazardous waste. Federal regulations require thatSQGs notify USEPA (through IEPA) of their hazardous waste activities and obtain aUSEPA generator number. SQGs must use hazardous waste management facilities andtransporters permitted to handle the types of waste they generated. A hazardous wastemanifest must accompany all shipments of hazardous waste generated by SQGs(Kraybill, 1990).
Conditionally exempt generators (CEGs) generate less than 100 kilograms (220pounds) of RCRA hazardous waste per month. CEGs that do not accumulate more than1,000 kilograms (2,200 pounds) of RCRA hazardous waste at any one time are exemptfrom federal RCRA regulations (Kraybill, 1990). Households are also exempt fromRCRA regulations.
13

Table l-4. Offsite Management of RCRA Hazardous Paint Waste in Illinois in1986a
Waste Management Number ofActivity LQGs
Fuel blending and reuse as fuel 45
Incineration 44
Solvent recovery and reuse as fuel 33
Solvent recovery 26
Other 9
Total Offsite Management 157
aIncludes hazardous paint waste generated by Illinois LQGs only.bPercentage of all Illinois LQGs of paint waste in 1986 (164 generators).
Percentage ofLQGsb
27.4
26.8
20.1
15.9
5.5
95.7
Source: USEPA, 1990b.
Table 1-5. Out-of-State RCRA Hazardous Waste Management of Illinois PaintWaste in 1986a
Number of Out-of-StateWaste Management
Percentage of Out-of-Waste Management
ActivityState Waste Management
Facilities Facilities
Incineration 29 50
Solvent recovery 19 32
Solvent recovery and fuel 17 29blending
Fuel blending and reuse as 15 26Fuel
Fuel blending 12 21
Solidify and landfill 8 14
Total 58b 1OOb
aIncludes hazardous paint waste generated by Illinois LQGs only.bA single out-of-state waste management facility may conduct more than one hazardous waste management
activity. Totals shown are without double counting.
Source: USEPA, 1990b.
14
1.5.4 Illinois Special Wastes
The state of Illinois further regulates most solid waste generated by industrial andcommercial facilities, known as “special wastes.” Illinois special wastes include RCRAhazardous waste, infectious hospital waste, and nonhazardous (under RCRA definitions)industrial process and pollution control wastes.
Generators of more than 100 kilograms (220 pounds) per month of special wastesmust obtain an Illinois identification number and receive specific authorization fordisposal of their special waste. Authorized special waste haulers and waste managementfacilities must be used, and all shipments of special wastes must be accompanied by aspecial waste manifest (Kraybill, 1990). In addition to these special waste regulations,generators of RCRA hazardous waste are subject to all applicable federal regulations.
In 1986, an estimated 8,000 cubic yards of paint products were manifested as specialwaste by generators of more than 100 kilograms per month of special waste. Thisquantity does not include paint-related wastes such as pigments, solvents, and resins asthese products could not be directly attributed to paint usage and production. A total of1.79 million cubic yards of special waste were manifested during the same time period(Perry, 1989).
Generators of less than 100 kilograms (220 pounds) per month of special waste areexempt from many parts of the Illinois special waste regulations. These generators mustobtain a state identification number and waste stream authorization and must send theirwastes to a waste management facility licensed to handle that type of waste. They cantransfer their special wastes themselves without a permit or manifest (Kraybill, 1990).The quantity of special waste generated by these generators is not known due to theirexclusion from manifesting requirements.
1.55 Household Paints
A 1985 study of Marin County, California, estimates an average household paintwaste landfilled of 1.51 pounds per year (Meiorin and Purin, 1989). In 1986, Illinois hadan estimated 4.2 million households (U.S. Bureau of the Census, 1987). Using the MarinCounty estimate, an estimated 6.3 million pounds (over 3,000 tons) of paint waste waslandfilled from households in Illinois in 1986.
Paint and related products can contain toxic or hazardous components that maycontribute to groundwater contamination if improperly disposed of. Reliable data on thecontribution of these products to contamination are not available (USEPA, 1988). Thissection discusses regulations concerning paints for household use.
1.5.5.1 Toxicity of Household Paints
Until recently mercuric compounds, used as a biocide in latex (a water-borne paint),were unregulated in paint. The mercury constituent of the paint slowly vaporizes afterapplication and can cause brain damage and central nervous system disorders. In 1989,approximately 30 percent of latex paint sold contained some level of mercury(Consultant, 1990). In 1990, USEPA approached the manufacturers of the mercuriccompounds used in latex paint and they agreed to voluntarily amend their Federal
15

Insecticide, Fungicide, and Rodenticide Act (FIFRA) registrations; these compounds canno longer be used in interior latex paint. In May 1991, the FIFRA registrations werefurther amended to exclude the use of mercury in exterior latex paints (HHWMN, 1991).No new paints of any kind will contain mercury. However, latex paints manufacturedbefore these changes that contain mercury may continue to be stored and used byhouseholds (Seattle Solid Waste Utility, 1990a).
Lead has been used in paint as a pigment, as a drying compound, for corrosionprotection, and to enhance hardness and high-gloss. Lead from peeling paint or paint dustcan cause brain damage and central nervous system disorders. In 1978, the ConsumerProducts Safety Commission set a lead concentration maximum of 0.06 percent forhousehold uses of paint. Higher concentrations of lead can be used on industrial productsor structural steel (Consultant, 1990). As with mercury, households may haveaccumulated older paints with concentrations of lead above this regulatory limit that stillmust be disposed of.
Art and hobby paints are generally exempt from the regulations governingconstituents in architectural paints. Toxic substances that these products can containinclude arsenic, asbestos, lead, formaldehyde, antimony, cadmium, manganese, andmercury (Hirschhorn and Oldenburg, 1991).
1 5.5.2 Household Paint Disposal Regulations
Under federal law, household wastes are exempt from hazardous waste regulation andcan be disposed of in municipal solid waste landfills. However, some states and localgovernments, concerned with potential contamination of groundwater or surface waters,have further regulated paint waste disposal. For example, California regulations ban thedisposal of liquid wastes in solid waste landfills. California considers liquid paintscontaining lead or organic solvents hazardous and sends these wastes to a hazardouswaste treatment, storage, and disposal facility. The state is currently looking into thepotential for solidifying liquid latex paint and then landfilling it. Currently, however, thestate recommends treating latex paint as a hazardous waste (in part because of potentialmercury content). Dried organic solvent and latex paints and empty paint cans can belandfilled in California (Meiorin and Purin, 1989).
In Illinois, paint and related wastes can be legally disposed of in solid waste landfills,although some local solid waste haulers and municipal landfills in the state do not acceptpaint products for disposal. McHenry County in Illinois advises residents to allow latexpaints to evaporate prior to landfilling. Residents are advised to allow organic solventbased paints to evaporate outdoors prior to landfilling or to save the paint for a householdhazardous waste collection event (McHenry County Illinois Department of Solid WasteManagement, 1991).
IEPA annually sponsors six to ten local household hazardous waste collections. IEPApays for the cost of waste collection, packaging, transportation, and disposal, while thesponsoring community handles all publicity and promotion (IEPA News, 1990a). Duringtheir 1988 household hazardous waste collection, Champaign County collected 5,628containers of hazardous materials from 451 contributing units (i.e., households, farmoperations, or group quarters). Approximately 20 percent of these containers were
16

organic solvent-borne paints. It is important to note that container size and capacityvaries; the actual volume of paint waste collected was not determined (Oldakowski,1990).
A bill banning the disposal of liquid paint, paint removers and thinners, and otherpotentially hazardous household wastes from solid waste landfills was introduced in theIllinois legislature in 1991 (SB 0633). The bill was passed by the Senate but was referredto interim study by the House Energy and Environment Subcommittee.
1.6 WASTE REDUCTION
To reduce the risks wastes pose to human health and the environment, to reduceworker exposure to hazardous substances, and to conserve resources, both governmentand industry have adopted waste reduction policies (policies to reduce or eliminate thegeneration of waste at its source). Waste reduction techniques include the following:
l modification or redesign of processes,
l in process (closed-loop) recycling,
l reformulation or redesign of the product,
l product substitution,
. raw materials substitution, and
l improved maintenance, housekeeping, and operating practices.
Environmentally sound recycling is the preferred waste management activity forwaste generation that cannot be eliminated. Recycling includes blending old paints tomake new, usable paints; recovering and reusing spent solvents; and reusing waste as fuelto generate energy. Chapters 2, 3, and 4 of this report include descriptions of wastereduction and recycling techniques to reduce the generation of waste at three stages in thepaint life cycle: paint manufacturing, application, and removal. The following discussionsummarizes government policies designed to encourage waste reduction.
1.6.1 Federal Waste Reduction Programs
The federal Pollution Prevention Act of 1990 establishes pollution prevention as a“national objective.” The Act establishes as national policy the pollution preventionhierarchy, declaring that pollution should be prevented at the source whenever feasible,while pollution that cannot be prevented should be recycled (USEPA, 1991c).
The federal government has initiated several waste reduction programs applicable topaint. For example, RCRA requires hazardous waste generators that ship hazardouswaste offsite to certify that the waste has been reduced to the extent that is technically andeconomically feasible.
Under the federal Industrial Toxics Program (33/50 Program), major generators of17 targeted toxic chemicals are encouraged to voluntarily reduce their emissions. Thetoxic pollutants were targeted because of their toxicity and the quantities released(USEPA, 1991a). The paint manufacturing industry had the fourth largest releases of
17
these targeted toxic chemicals during 1988, based on data reported for the Toxic ReleaseInventory (TRI) (USEPA, 1991c).
The Clean Air Act, as amended in 1990, will require reductions in releases of VOCsfrom paint manufacturing and usage. However, if a facility successfully reduces itsemissions by 90 percent, the facility can apply to USEPA for a temporary waiver fromcomplying with the new regulations. for six years (Hazardous Waste Consultant, 1991 b).
USEPA has developed the Pollution Prevention Information Clearinghouse (PPIC) toencourage transfer of information on pollution prevention. PPIC includes a computerizedPollution Prevention Information Exchange System that can be accessed by industry andgovernment officials. The computerized system includes a bibliography of pollutionprevention information sources and case studies.
Finally, USEPA has developed several funding programs to the states to encouragetheir development of pollution prevention initiatives. These include the RCRA IntegratedTraining and Technical Assistance (RITTA), the Waste Reduction InnovativeTechnology Evaluation (WRITE), and the Pollution Prevention Incentives for StatesGrants (PPIG) programs. Illinois has received several of these contracts to support itswaste reduction efforts (HWRIC, 1991).
1.6.2 Illinois Waste Reduction Programs
The 1989 Illinois Toxic Pollution Prevention Act (PA 86-914) states that toxicpollution prevention is the preferred means for achieving compliance with environmentallaws and regulations. This Act establishes a toxic pollution prevention technicalassistance program to provide technical information on pollution prevention to industryand citizens. It also includes provisions for the development and submission of voluntarytoxic pollution prevention innovation plans.
The Illinois Toxic Pollution Prevention Act established the Office of PollutionPrevention within the Illinois Environmental Protection Agency IEPA). Among theOffice’s programs are an Industrial Materials Exchange Service to encourage recyclingand an internship program that provides companies with engineering graduate studentsto assist in implementing pollution prevention. In 1990, one intern developed a programto reduce paint and solvent waste and to recover product from paint sludges (IEPA,1990b).
The Illinois Hazardous Waste Research and Information Center (HWRIC), a divisionof ENR, has been mandated to study ways to reduce the volume of hazardous wastegenerated and to assess the threat hazardous waste poses to human health and theenvironment. HWRIC has promoted waste reduction in Illinois through the followingfour major program activities:
l providing direct technical assistance to Illinois industries, communities, andcitizens;
l encouraging waste reduction through the use of the Governor’s PollutionPrevention Awards;
18
l encouraging waste reduction through the Recycling and Reduction Techniquesmatching fund and research programs; and
l providing information dissemination and technology transfer through HWRIC’slibrary, clearinghouse, and computerized bibliographic information system, andthrough participation in seminars and workshops across the state.
With additional support from USEPA, HWRIC is providing waste reduction training forIEPA personnel and is evaluating the use of innovative engineering and scientifictechnologies to prevent pollution. For more information on HWRIC waste reductionactivities, refer to the Illinois Hazardous Waste Research and Information Center AnnualReport (HWRIC, 1991).
1.7 REPORT OVERVIEW
This report describes the life cycle of paint. Chapters 2, 3, and 4 describe paintmanufacturing, application, and removal processes (respectively), the wastes that aregenerated from those processes, and options to reduce the generation of those wastes.Chapter 5 presents specific information on paint-related activities in Illinois. Chapter 6discusses the waste reduction and disposal options applicable to Illinois paint-relatedwastes. Chapter 7 presents recommended policies for paint-related waste managementand waste reduction in Illinois, including recommendations for an education program. Aspart of this study, we conducted onsite investigations with paint manufacturers, users, andwaste management facilities. The results of these investigations were used in theanalyses and recommendations made in this report. Complete documentation of theseinvestigations is available as a separate document (HWRIC TR-008).
19

20
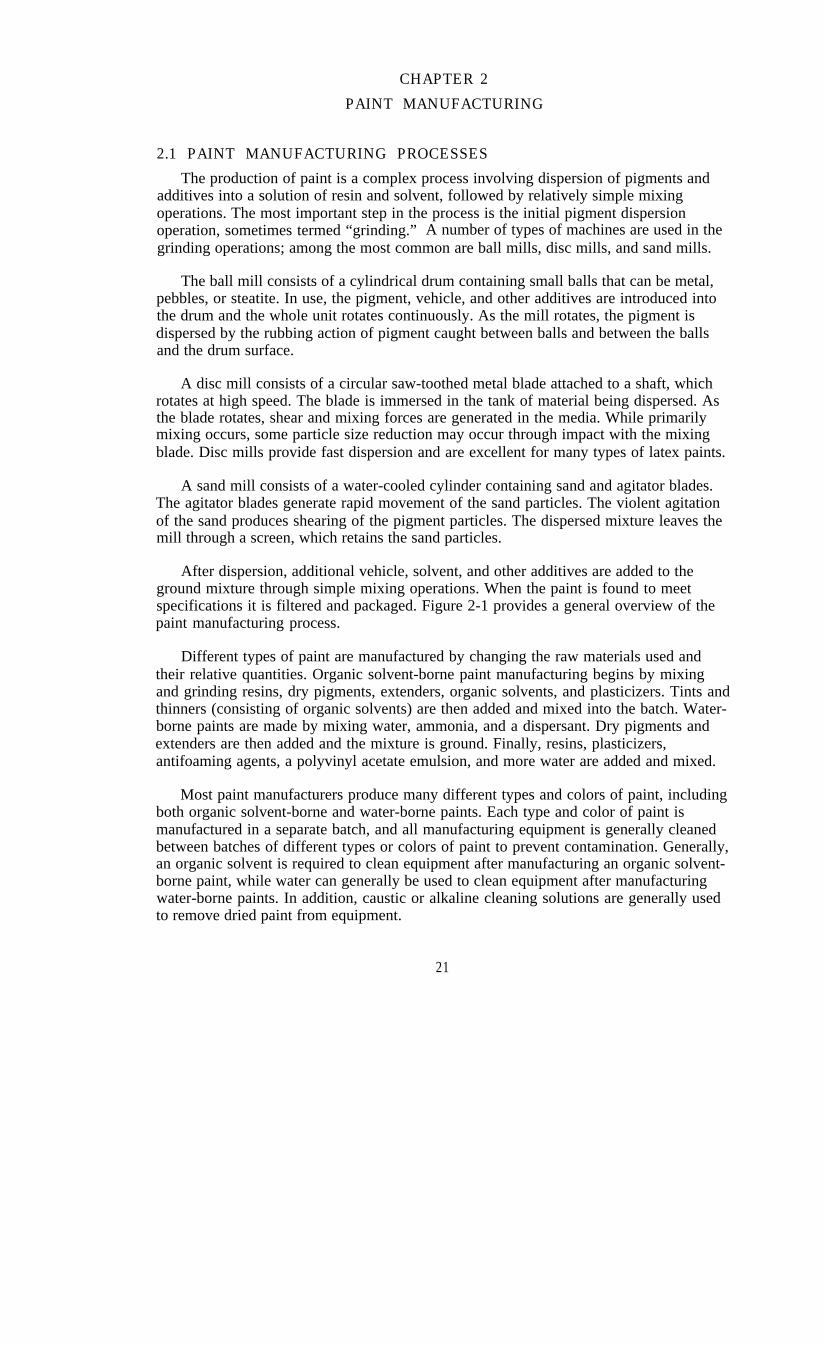
CHAPTER 2
PAINT MANUFACTURING
2.1 PAINT MANUFACTURING PROCESSES
The production of paint is a complex process involving dispersion of pigments andadditives into a solution of resin and solvent, followed by relatively simple mixingoperations. The most important step in the process is the initial pigment dispersionoperation, sometimes termed “grinding.” A number of types of machines are used in thegrinding operations; among the most common are ball mills, disc mills, and sand mills.
The ball mill consists of a cylindrical drum containing small balls that can be metal,pebbles, or steatite. In use, the pigment, vehicle, and other additives are introduced intothe drum and the whole unit rotates continuously. As the mill rotates, the pigment isdispersed by the rubbing action of pigment caught between balls and between the ballsand the drum surface.
A disc mill consists of a circular saw-toothed metal blade attached to a shaft, whichrotates at high speed. The blade is immersed in the tank of material being dispersed. Asthe blade rotates, shear and mixing forces are generated in the media. While primarilymixing occurs, some particle size reduction may occur through impact with the mixingblade. Disc mills provide fast dispersion and are excellent for many types of latex paints.
A sand mill consists of a water-cooled cylinder containing sand and agitator blades.The agitator blades generate rapid movement of the sand particles. The violent agitationof the sand produces shearing of the pigment particles. The dispersed mixture leaves themill through a screen, which retains the sand particles.
After dispersion, additional vehicle, solvent, and other additives are added to theground mixture through simple mixing operations. When the paint is found to meetspecifications it is filtered and packaged. Figure 2-1 provides a general overview of thepaint manufacturing process.
Different types of paint are manufactured by changing the raw materials used andtheir relative quantities. Organic solvent-borne paint manufacturing begins by mixingand grinding resins, dry pigments, extenders, organic solvents, and plasticizers. Tints andthinners (consisting of organic solvents) are then added and mixed into the batch. Water-borne paints are made by mixing water, ammonia, and a dispersant. Dry pigments andextenders are then added and the mixture is ground. Finally, resins, plasticizers,antifoaming agents, a polyvinyl acetate emulsion, and more water are added and mixed.
Most paint manufacturers produce many different types and colors of paint, includingboth organic solvent-borne and water-borne paints. Each type and color of paint ismanufactured in a separate batch, and all manufacturing equipment is generally cleanedbetween batches of different types or colors of paint to prevent contamination. Generally,an organic solvent is required to clean equipment after manufacturing an organic solvent-borne paint, while water can generally be used to clean equipment after manufacturingwater-borne paints. In addition, caustic or alkaline cleaning solutions are generally usedto remove dried paint from equipment.
21
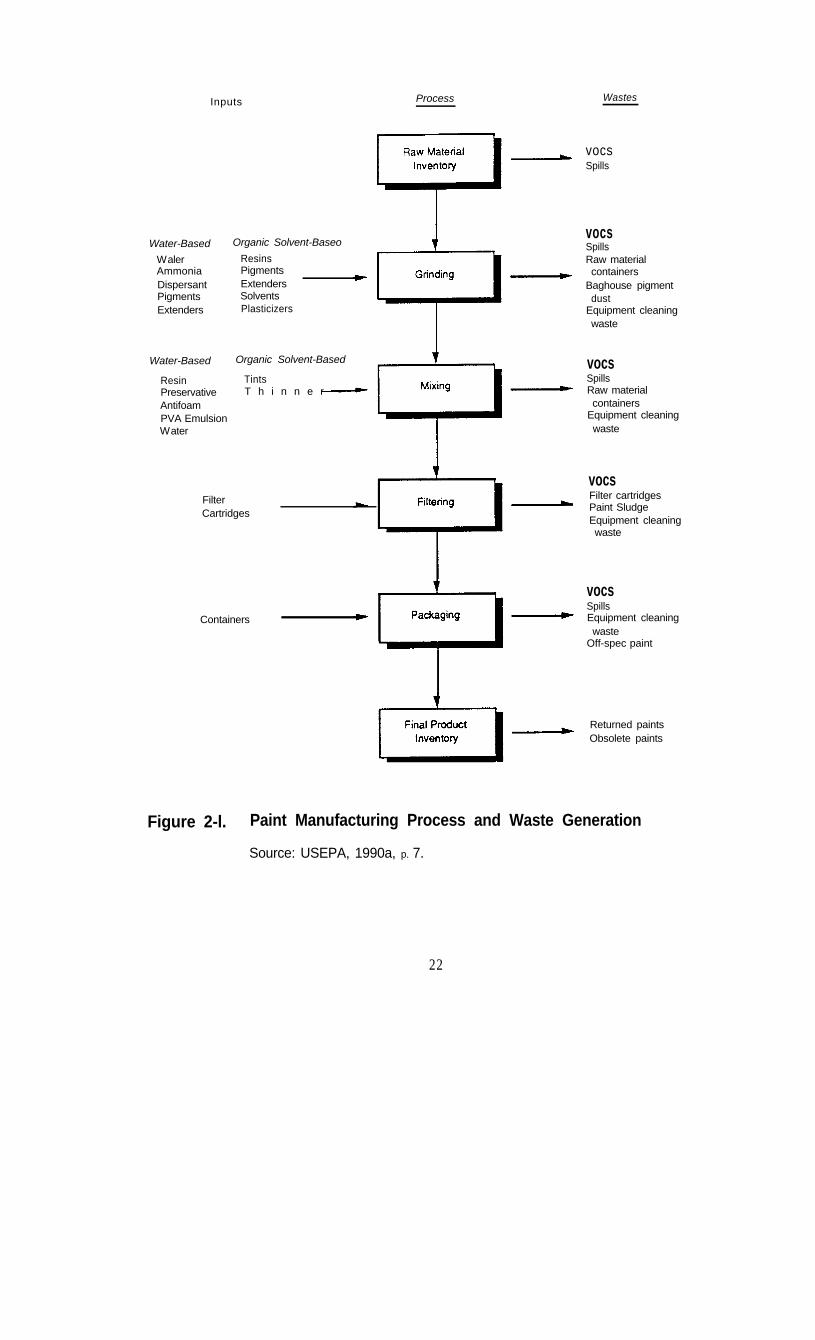
Inputs Process Wastes
Water-Based
WalerAmmoniaDispersantPigmentsExtenders
Water-Based
ResinPreservativeAntifoamPVA EmulsionWater
Organic Solvent-Baseo
ResinsPigmentsExtendersSolventsPlasticizers
Organic Solvent-Based
TintsT h i n n e r -
FilterCartridges
Containers
vocsSpills
vocsSpillsRaw materialcontainers
Baghouse pigmentdust
Equipment cleaningwaste
vocsSpillsRaw materialcontainers
Equipment cleaningwaste
vocsFilter cartridgesPaint SludgeEquipment cleaningwaste
vocsSpillsEquipment cleaningwaste
Off-spec paint
Returned paintsObsolete paints
Figure 2-l. Paint Manufacturing Process and Waste Generation
Source: USEPA, 1990a, p. 7.
22

2.2 WASTE GENERATION
Wastes generated from paint manufacturing include the following:
. equipment cleaning wastes,
l air emissions of VOCS,. pigment dust from air pollution control equipment (e.g., baghouse dust),
l empty raw material packages, bags, and containers,
l bags and cartridges from paint filtration equipment,. paint that is “off-spec” (i.e., did not meet quality or customer specifications),. paint returned from the retailer (e.g., because it had exceeded its shelf life), and. waste paint or raw materials from accidental spills and discharges.
Some of these wastes are recycled and do not enter the waste stream.
Equipment cleaning is the largest source of waste from paint manufacturing. Anestimated 80 percent of waste generated is due to cleaning manufacturing equipment(USEPA, 1986). These wastes include
l spent organic solvents,
l wastewater,
l acids or alkalines, and
l paint sludge.
The paint characteristics that affect the volume of wash wastes are drying time, curingmechanism, and solvent type (water or organic). For example, drying time determines ifthe mix tank must be cleaned soon after use or some hours later. A slightly longer dryingtime in the mix tank would allow the manufacturer more flexibility in scheduling tankwashing. Similarly, the curing mechanism affects the drying time and also determines tosome extent the difficulty of removing the dried film. Depending on the curingmechanism, the dried paint may or may not be soluble in its original solvent. Thus, thetype of cleaning solution (and its potential environmental hazard) are affected by the paintcuring mechanism.
The solvent type also affects the drying time and ease of removal of the cured paint.In addition, the solvent type determines the degree to which the rinse wastes can berecycled into the next paint product. Under ideal conditions, rinse waste can be storedand incorporated into the next batch of paint. The applicability of this varies for differentcircumstances. Paints incorporating organic solvents may be more sensitive to the mix ofsolvent, requiring tighter control of the type and quantity of solvent used in rinsingoperations. In some cases reusing rinse water from latex paint operations may be difficultif the rinse water must be stored for more than a day. In such cases, the potential forbacterial contamination of the water may preclude its use in the next batch of paint.
The use of organic solvents in paint formulations or to clean equipment generateswaste in the form of VOC vapors. The evaporation characteristics of each solvent will
23

affect the volume and degree of environmental hazard of the VOC waste. For paintmanufacturers, VOCs can be reduced by covering mixing tanks. VOC emissions fromvents on solvent tanks can be reduced by changes in the vent design and by usingequipment to recondense the solvent vapors.
Many of the chemicals used in paint manufacturing are considered toxic chemicalsunder Title III of the Superfund Amendments and Reauthorization Act (SARA). Theseinclude heavy metals and organic solvents. In addition, many of these chemicals havebeen targeted for voluntary waste reduction by USEPA in its 33/50 Program based ontheir potential hazard and the quantity released to the environment (USEPA, 1991 a).Table 2-l shows the quantity of SARA toxic chemicals released in Illinois by paintmanufacturers during 1989. All the releases are to the air. Table 2-1 also indicateschemicals that are targeted under the Industrial Toxics Program.
Table 2-l. Air Emissions of SARA Toxic Chemicals by Illinois PaintManufacturers in 1989
Air Emissions Percentage of TotalChemical (pounds) Air Emission@
Methyl Ethyl Ketoneb 375,682 23.9
Xylene (mixed isomers) 298,008 19.0
Tolueneb 272,101 17.3
Acetone 253,589 16.1
Dichloromethaneb 68,688 4.4
Glycol Ethers 49,932 3.2
Methyl Isobutyl Ketoneb 48,845 3.1
Ethylbenzene 48,178 3.1
Methanol 45,911 2.9
1, 1, 1-Trichloroethaneb 25,504 1.6
All Others 84,995 5.4
Total 1,571,433 100.0
aPercentage of total quantity of toxic chemicals released in Illinois by paint manufacturers in 1989 andreported in the Toxic Release Inventory.
bthese chemicals have been targeted by USEPA under the 33/50 Program for reduction due to their toxicityand the large quantities released.
Source: USEPA, 1991c.
24

Wastes from paint manufacturing that exceed regulatory thresholds for toxicity,reactivity, corrosivity, or flammability may be considered hazardous under the federalRCRA. Data from Generator Survey (USEPA, 1990b) indicate that, in 1986, anestimated 65 Illinois paint manufacturers were LQGs of RCRA hazardous waste (seeSection 1.5.3 for definitions of LQGs and RCRA hazardous waste). These manufacturersgenerated an estimated 32,733 tons of hazardous waste, less than 1 percent of the totalquantity of hazardous waste generated by all Illinois LQGs in 1986. Over half of thepaint-manufacturing hazardous waste contained solvents. Other common types ofhazardous waste generated include hazardous wastewater, organic paint sludge, andorganic paint (see Figure 2-2). Table 2-2 shows the most common sources of hazardouswaste generated by paint manufacturers. The three most common sources--causticcleaning, still bottom removal, and cleaning of process equipment-generate equipmentcleaning wastes. These three sources generate 65 percent of all hazardous wastegenerated by paint manufacturers that are LQGs.
0% 50% 100%
Wastewater or AqueousMixture
Organic Paint Sludge
Organic Paint 2,335
All Others
Figure 2-2. Most Common Types of Hazardous Waste Generated by PaintManufacturers in Illinois in 1986 (tons)Note: Numbers indicate the quantity of hazardous waste generated in tons prior
to recycling or treatment by large quantity generators. The total quantityof hazardous waste generated by Illinois paint manufacturers was32,733 tons.
Source: USEPA, 1990b
25
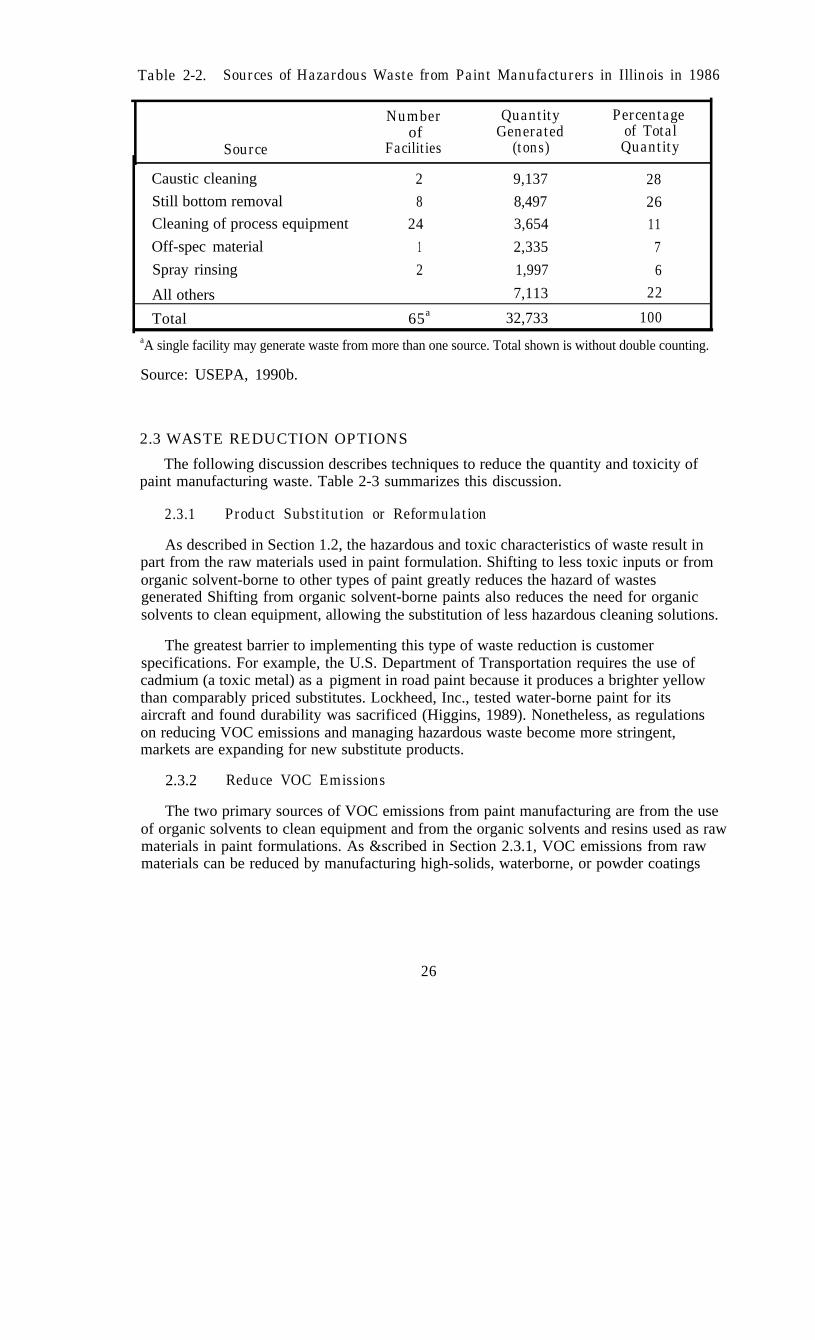
Table 2-2. Sources of Hazardous Waste from Paint Manufacturers in Illinois in 1986
Source
Numberof
Facilities
QuantityGenerated
(tons)
Percentageof TotalQuantity
Caustic cleaning 2 9,137 28
Still bottom removal 8 8,497 26Cleaning of process equipment 24 3,654 11
Off-spec material 1 2,335 7
Spray rinsing 2 1,997 6
All others 7,113 22
Total 65a 32,733 100aA single facility may generate waste from more than one source. Total shown is without double counting.
Source: USEPA, 1990b.
2.3 WASTE REDUCTION OPTIONS
The following discussion describes techniques to reduce the quantity and toxicity ofpaint manufacturing waste. Table 2-3 summarizes this discussion.
2.3.1 Product Substitution or Reformulation
As described in Section 1.2, the hazardous and toxic characteristics of waste result inpart from the raw materials used in paint formulation. Shifting to less toxic inputs or fromorganic solvent-borne to other types of paint greatly reduces the hazard of wastesgenerated Shifting from organic solvent-borne paints also reduces the need for organicsolvents to clean equipment, allowing the substitution of less hazardous cleaning solutions.
The greatest barrier to implementing this type of waste reduction is customerspecifications. For example, the U.S. Department of Transportation requires the use ofcadmium (a toxic metal) as a pigment in road paint because it produces a brighter yellowthan comparably priced substitutes. Lockheed, Inc., tested water-borne paint for itsaircraft and found durability was sacrificed (Higgins, 1989). Nonetheless, as regulationson reducing VOC emissions and managing hazardous waste become more stringent,markets are expanding for new substitute products.
2.3.2 Reduce VOC Emissions
The two primary sources of VOC emissions from paint manufacturing are from the useof organic solvents to clean equipment and from the organic solvents and resins used as rawmaterials in paint formulations. As &scribed in Section 2.3.1, VOC emissions from rawmaterials can be reduced by manufacturing high-solids, waterborne, or powder coatings
26

Table 2-3. Waste Reduction Techniques for Paint Manufacturing
Technique
Substitute rawmaterials.
Description Effects Caveats
Substitute less toxic Reduces toxicity for all Applicability dependspigments for heavy metals. waste streams. on customer
Substitute organicspecifications and raw
bactericides for mercury-Reduces baghouse pigment material availabilitv.dust
containing bactericides.
Substitute slurried pigmentsfor powdered pigments.
Substitute or Shift from organic solvent- Reduces toxicity for all Applicability dependsreformulate product. borne to water-borne, high- waste streams. on customer
solids, or dry-powdered Reduces air emissions. specifications.paints.
Allows substitution ofalkaline or water fororganic solvents to cleanequipment.
I Substitute cleaning Substitute water or alkaline Reduces toxicity of May not be suitablematerials. solutions for organic equipment cleaning waste. for organic solvent- I
I solvent+ Reduces VOC airborne paints.
Use high-pressure water emissions.systems. I
I Recycle equipment Use waste as an input in Reduces the quantity of Using waste as inputcleaning wastes. another batch of paint. equipment cleaning waste. may reduce product
Remove paint sludge andreuse waste for cleaninge q u i p m e n t .
Distill waste and recoversolvent.
quality.
Reduce cleaningfrequency.
Dedicate equipment lines to a Reduces the quantity of Changes in schedulingsingle type of paint equipmentcleaning waste. or equipment usage
Maximize length of a If organic solvents are usedmay not be feasible
production run for each type to clean, reduces airfor a particular
of paint. emissions.operation.
Schedule production batchesprogressively from light- todark-colored paint.
Improve quality control. Reduces quantity of paint Automation mayoperating procedures, and waste. require large capitalemployee training. Reduces loss of paint
expenditures.
Improve inventory controls product.and marketing activities.
Increase use of automation.
27
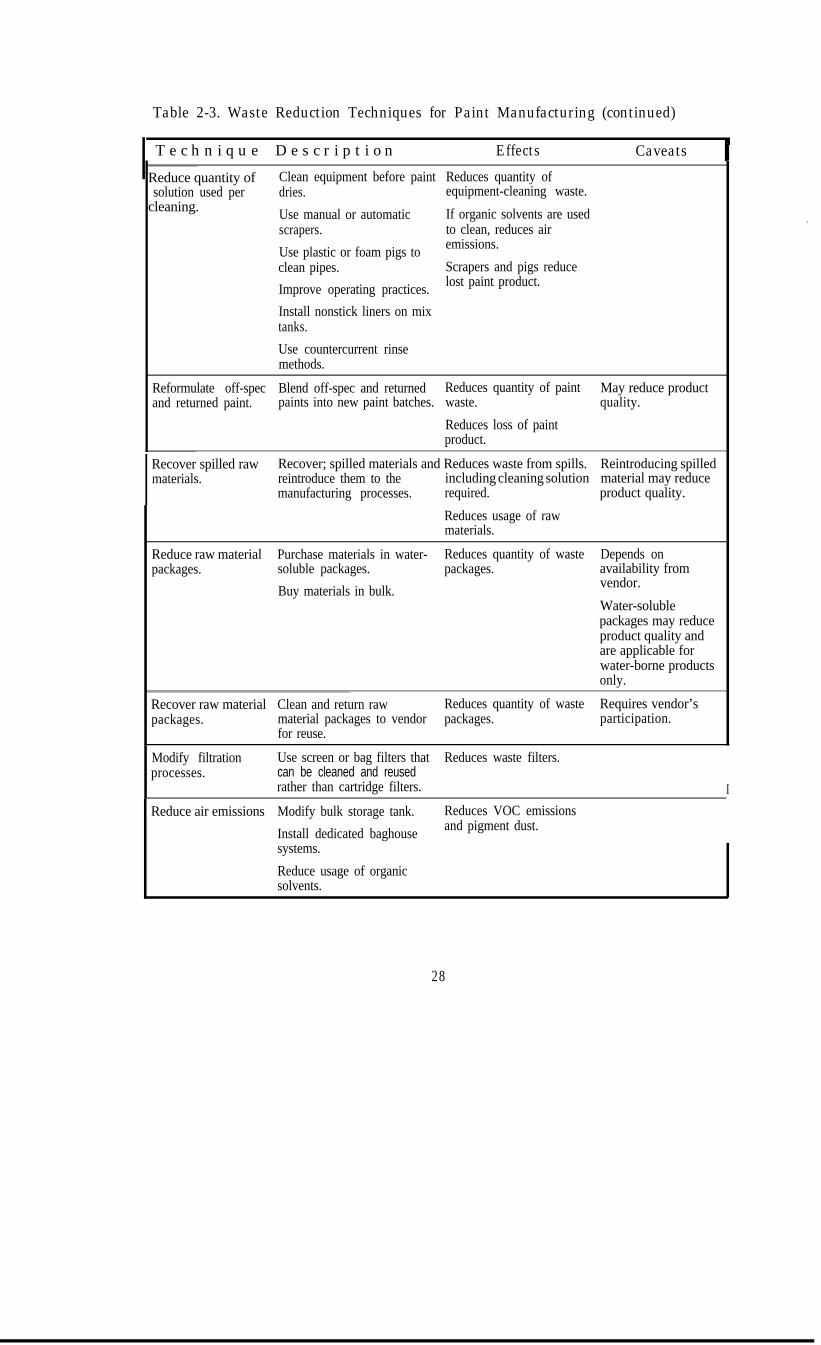
Table 2-3. Waste Reduction Techniques for Paint Manufacturing (continued)
T e c h n i q u e D e s c r i p t i o n Effects Caveats IReduce quantity of Clean equipment before paint Reduces quantity ofsolution used per dries.
cleaning.equipment-cleaning waste.
Use manual or automatic If organic solvents are usedscrapers. to clean, reduces air
Use plastic or foam pigs to emissions.
clean pipes. Scrapers and pigs reduce
Improve operating practices. lost paint product.
Install nonstick liners on mixtanks.
Use countercurrent rinsemethods.
Reformulate off-spec Blend off-spec and returned Reduces quantity of paint May reduce productand returned paint. paints into new paint batches. waste. quality.
Reduces loss of paintproduct.
I Recover spilled raw Recover; spilled materials and Reduces waste from spills. Reintroducing spilledmaterials. reintroduce them to the including cleaning solution material may reduce
manufacturing processes. required. product quality.
Reduces usage of rawmaterials.
Reduce raw material Purchase materials in water- Reduces quantity of waste Depends onpackages. soluble packages. packages. availability from
Buy materials in bulk.vendor.
Water-solublepackages may reduceproduct quality andare applicable forwater-borne productsonly.
Recover raw material Clean and return raw Reduces quantity of waste Requires vendor’spackages. material packages to vendor packages. participation.
for reuse.
Modify filtrationprocesses.
Use screen or bag filters that Reduces waste filters.can be cleaned and reusedrather than cartridge filters. I
Reduce air emissions Modify bulk storage tank. Reduces VOC emissions
Install dedicated baghouse and pigment dust.
systems.
Reduce usage of organicsolvents.
28
rather than conventional solvent paints. Switching to waterborne paints also eliminates theneed for organic solvents to clean equipment, further reducing VOC emissions (USEPA,199Oa). Such product reformulation is limited by customer specifications, however.
Modifying bulk storage tanks can reduce the evaporation of solvents and resins instorage, reducing air emissions and raw material losses (USEPA, 1990a). Reducing rawmaterial losses can result in cost savings. Modifications to tanks to reduce VOCemissions include the following:
l using conservation vents,. converting to floating roof designs,
l using nitrogen blanketing,
l using refrigerated coils,
l using lean-oil or carbon absorbers, and
l using vapor compressors.
Redesigning open processing equipment such as mixing tanks can also reduce VOCemissions, although such changes require capital expenditures. For example, some usersof horizontal sand mills (rather than vertical mills) report reductions in VOC emissions.
VOC emissions from equipment cleaning can be reduced by substituting causticrinses for organic-solvent cleaners. As mentioned above, switching to water-borne paintsreduces the need for organic solvents in cleaning, thus eliminating this source of VOCemissions. For organic solvents that are used to clean equipment, VOC emissions can bereduced by installing closed tanks or using one of the methods described above to reduceVOC evaporation. In addition to reducing air emissions, these methods reduce the loss ofsolvents and therefore decrease solvent use.
2.3.3 Reduce Quantity and Toxicity of Cleaning Waste
As shown in Table 2-2, the most common source of waste from paint manufacturingis from cleaning manufacturing equipment. The toxicity of cleaning wastes can bereduced by substituting less toxic cleaning solutions, such as high-pressure water oralkaline solutions, for organic solvents. Such a substitution also reduces air emissions ofVOCs. However, water or alkaline solutions may not be suitable for use in organicsolvent-borne paints.
Equipment cleaning wastes can also be reduced by cleaning equipment lessfrequently. Batch production runs can be scheduled to maximize the length of a singleproduction run or to manufacture compatible batches (e.g., light to dark) that do notrequire thorough cleaning between production runs. Cleaning frequency can also bereduced by dedicating equipment lines to the production of a single type of paint, whichallows equipment to be cleaned occasionally rather than after each batch (USEPA,1990a).
The quantity of solution required for each cleaning can be reduced by minimizing theamount of dried paint residue on equipment. If possible, equipment should be cleanedbefore paint dries. Plastic or foam “pigs” can be used to clean pipes. Manual or
29

automatic scrapers can be used to remove paint from the sides of tanks, reducing theamount of residual dried paint on tank walls. Using scrapers or pigs also reduces the lossof paint product (USEPA, 1990a). Improved operating practices also ensure that only theminimum amount of cleaning solution required is used. For some applications, liquiddisplacers have been used inside filter housings to reduce the volume of material insidethe housing. This reduces the waste generated each time the filter housings are drained tochange products or filters (Waste Advantage, Inc., 1988).
The amount of equipment cleaning waste for disposal can be reduced by recycling.Cleaning solutions can be reused if paint sludge is removed. Spent cleaning solvents canbe recovered. For some applications, the waste can be used as an input in the nextcompatible batch of paint; however, such reuse may reduce product quality. One paintmanufacturer reduced waste cleaning solvent generation from 25,000 gallons to just 400gallons by scheduling compatible paint batches and segregating and reusing cleaningsolvents (Lorton, 1988).
2.3.4 Reduce or Recover Off-Spec and Returned Paints
Off-spec and returned paints reduce plant productivity and represent unproductiveuses of resources. Such paint waste can be reduced (and productivity can be improved)by improving quality controls, operating procedures, and employee training. Automatingmanufacturing processes can also reduce off-spec paint. Improved inventory controls andmarketing practices can reduce returned paints. For example, obsolete paints can bemarketed for alternative uses at reduced costs. Often off-spec and returned paints can beblended into new paint batches. Careful quality control is required to ensure thatreblending does not reduce product quality (USEPA, 1990a).
2.3.5 Reduce Waste from Spills
Improving operating practices to reduce the amount of spilled material is the best wayto reduce waste from spills. Installing better overflow controls and training employees inhandling materials are two ways to reduce spills. When spills do occur, spilled materialsshould be collected and reintroduced into the manufacturing process (USEPA, 1990a).However, reintroducing spilled material may reduce product quality.
2.3.6 Reduce Package Waste
Raw material packaging can be minimized by buying raw materials in bulk.However, tight inventory controls must be put in place to ensure that waste isn’tgenerated from expiration of materials, contamination, or spills. Container waste can bereduced by using water-soluble packages that can be blended into water-borne products;however, this may affect product quality. Finally, raw material packages can be cleanedand returned to the vendor for reuse or sent to a metals recycler (USEPA, 1990a).
2.3.7 Reduce Filter Wastes
Cartridge filters must be periodically replaced, so used filters are disposed of aswaste. Filter waste can be reduced by using screen or bag filters that can be cleaned andreused; however, waste is generated from the cleaning operation. Improving pigment
30
dispersion during grinding operations reduces the frequency of changing the filter(USEPA, 1990a).
2.3.8 Quality Control
Another method that may find some application in waste reduction is the use ofstatistical process/quality control procedures. Generally, these procedures consist ofregression-based control charts for different process variables, but the simple act ofrecording and plotting data without regression analysis can also be useful. Suchprocedures could help in reducing production of off-specification paints and may evenidentify some overlooked methods for reducing waste.
For example, one Glidden plant formed a quality team to identify methods to reducethe amount of wastewater entering the plant water treatment facility (Schrantz, 1990).The team examined each wastewater source and measured the amount coming from each.They observed tank cleaning operations and identified the most effective cleaningmethods. The team drafted a set of washdown procedures and produced a training video.All washdown operators participated in making the video. The end result was a one-thirdreduction in the amount of water entering the waste treatment facility.
If paint manufacturers regularly gathered and analyzed data related to wastegeneration, similar savings might occur. For example, examination of data from onemanufacturer of product coatings indicated that, on a monthly basis, organic solventwaste equaled about 5 percent of monthly production. During some months, however,organic solvent waste was only 3 percent of monthly production, nearly a 50 percentreduction, even though the amount of organic solvent-borne paint produced was greater.One possible reason for the reduction could have been production of paint in larger batchsizes, reducing the amount of tank cleaning performed per gallon produced. Identifyingthis and other possible causes for the significant decrease in solvent waste generation incertain months could be used as a starting point in developing ways to reduce solventwastes.
31

32
CHAPTER 3
PAINT APPLICATION
3.1 PROCESS DESCRIPTION
Paint and other surface coatings are used to provide decoration and protection to aproduct. Generally, the type of paint and the application method are critical to theperformance of the coating. The general steps for paint application include
l surface preparation,
l paint application, and
l curing or drying.
In addition, cleaning the equipment used in each of these steps generates waste.Figure 3-l shows the general steps in paint application processes, the materials used, andthe wastes generated.
3.1.1 Surface Preparation
Surface preparation improves the bond between the coating material and the surface.Preparation can include removing old paint as well as contaminants and oils. Chapter 4provides a description of paint removal processes. The types of surface preparation usedvary depending on the material to be painted, the paint to be used, and the desiredproperties of the resulting finish.
Surface preparation of wood depends in part on the type of wood and its intended use.Preparation methods include sanding and applying fillers, sealers, preservatives, andprimers.
Methods for surface preparation of metals are extensive. The first step can be acleaning operation to remove any mill scale and/or rust on the metal surface. This isaccomplished using blast cleaning with abrasives, flame cleaning, or acid pickling.Metals that have oil or grease on their surface are cleaned by solvent wiping or vapordegreasing. Solvents used include trichloroethylene, perchloroethylene, and1, 1, 1 trichloroethane. Oils and grease can also be removed using alkaline degreasingsolutions such as sodium hydroxide, sodium carbonate, sodium phosphate, sodiummetasilicate, and borax. Alkali degreasing agents must be completely removed prior topainting, which often requires several rinses. Following cleaning, a conversion coatingmay be applied to metal surfaces using a phosphating process. In the phosphating processthe metal surface is treated with a dilute solution of phosphoric acid. The phosphateprocess results in a microcrystalline layer that improves the surface for paint application,providing better adhesion and some corrosion protection.
Plastics to be painted may be roughened with mildly abrasive media, in some casesplastic shot. Vapor degreasing may also be used to prepare plastic surfaces for paint. Forsome plastics, the surface may be oxidized using ultraviolet light activated chemicals,corona discharge, or acid pre-soaks (Roobol, 1990).
33
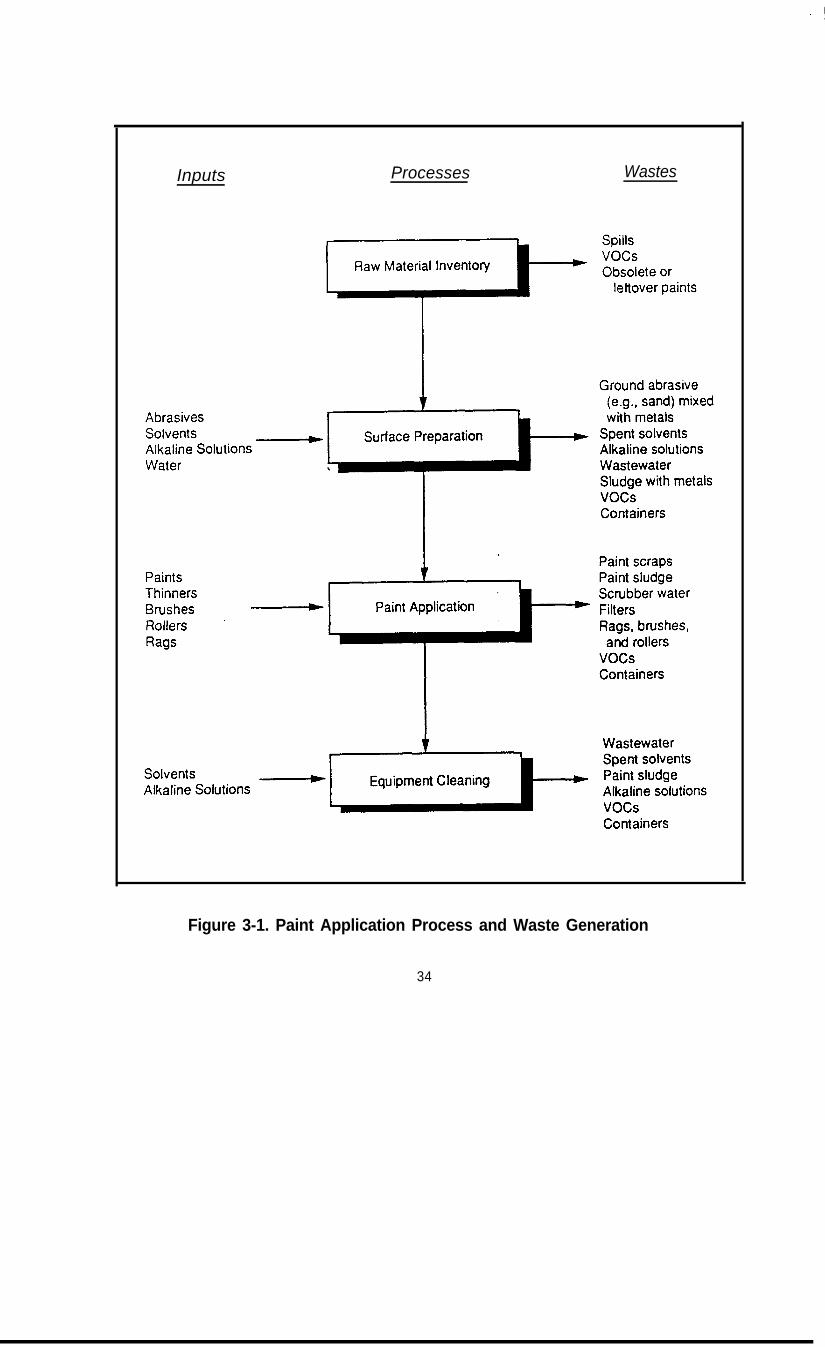
Inputs Processes Wastes
Figure 3-1. Paint Application Process and Waste Generation
34
3.1.2 Paint Application
Which paint application process is used depends on the type of surface to be coated,the type of coating, and the size and shape of the surface. Most household painting isdone using brushes and rollers, with a small amount of spray application. Auto bodyshop painting is almost exclusively done using spray equipment, either conventionalpressure spray or newer, high-volume. low-pressure spray equipment. For paints used asproduct coatings, the importance of a high-quality, durable finish demands tailoring ofboth the coating and the application technology. Table 3-l describes various paintapplication processes and gives examples of the types of surfaces for which the processesare applicable (Higgins, 1989; Morgans, 1990; and Peterson and Young, 1989).
The transfer efficiency is an important aspect of a paint application technology fromthe standpoint of waste generation. Transfer efficiency is the amount of paint applied tothe object being painted, divided by the amount of paint used. Transfer efficiencies for agiven type of paint formulation vary with the type of equipment used, the skill of theoperator, and the object being painted. Transfer efficiencies can range from 15 to99 percent. Table 3-2 gives typical transfer efficiencies for industrial paint applicationprocesses. Efficiencies of brushes and rollers used in residential painting are estimated tobe 95 percent.
3.1.3 Curing
Once the paint material is applied to the surface, a curing process takes place thatconverts the fluid or resinous paint binder into a hard, tough, and adherent film. Whatoccurs when a paint dries or cures depends on whether it is made of a convertible ornonconvertible binder. If the binder is convertible, some form of chemical reactionoccurs during curing, converting the paint to a solid film that is no longer soluble in itsoriginal solvent component. Paints made with nonconvertible binders do not undergochemical reaction upon curing. As they dry, only the loss of solvent through evaporationtakes place. The resulting films remain soluble in the original solvent component.
For paints with convertible binders, curing can take place through ambienttemperature oxidation (as in most enamel and organic solvent-borne paints), throughchemical reactions with another component (as in two-pack systems such as epoxy andpolyurethanes), and by baking. Additional curing mechanisms include infrared radiationultraviolet radiation, and irradiation using electron beams. Infrared curing is used forautomobile finishes, industrial vehicles, and electric motors. Ultraviolet curing isfrequently used for wood and metal finishing. Ultraviolet curing offers advantages froma waste reduction standpoint because little VOC is used in paints made for ultravioletcuring. However, ultraviolet curing equipment is costly and can pose problems forworker safety.
Paints that cure by a mechanism whose initiation can be controlled, such as radiationor baking, offer an advantage in terms of waste reduction because any overspray does notcure and thus is more readily recycled. Powder paints in particular make use of thisadvantage; because they cure by baking, almost all powder overspray can be captured andreused. These techniques are not applicable to residential paint use.
35

Table 3-1. Paint Application Processes
Process
Brush
Description Applications Wastes Generated
Manual application of slow- Small-scale application Solvent and paint solidsdrying solvent or water-borne (used by homeowners) from cleaning brushpaints.
Hand roller Manual application usingroller saturated with paintfrom a shallow tray.
Large, flat areas (e.g., walls) Solvent from cleaning(used by homeowners) paint roller, trays
I Dip coating Objects are immersed in tank Car and tractor parts, tools, Cleaning waste whenfilled with paint. electrical components paint in dipping tank is
changed
I
Flow coating Paint flows over the objects or Large objects, or objects of Equipment cleaningis directed at objects from intricate shape waste when paint isnozzles. changed
Cumin coating Panels are carried by Large, flat panels of wood Equipment cleaningconveyor through a curtain of or hardboard waste when paint ispaint dispensed from nozzles changedor slit pipe.
Direct rollercoating
Sheets are fed through roller Sheet materials, e.g., strip Equipment cleaningthat applies the paint metal and boards; used to waste when paint is
decorate cans and other changedmetal objects
coil coating Coiled metal strip is uncoiled Coiled metal strips Equipment cleaningpretreated, roller coated with waste when paint ispaint, cured, then recoiled. changed
Tumbling or Objects and paint are placed Large numbers of small, Equipment cleaningbarrel coating in a barrel and tumbled to coat irregularly shaped objects waste when paint is
uniformly. (e.g., screws, clips) changed
Centrifuging Objects are placed in a wirebasket dipped in paint, thencentrifuged to remove surpluspaint
Sprayapplication
Object is sprayed withatomized paint; paint isatomized using compressedair or hydraulic pressure.
Small objects that would bedamaged in tumbling (e.g.,jewelry)
I n d u s t r i a lcommercial products,military equipment, etc.
May be used byhomeowners or paintingcontractors.
Equipment cleaningwaste
Paint overspray;scrubber water, filters,and paint sludge fromair pollution control; andequipment cleaningwaste
I Silk-screen Stencil is applied to silk or Used when sharp definition Equipment cleaningcoating mesh screen is placed on the is required (e.g., to apply waste
object; paint is then applied lettering or decoration)
I with a squeegee. ICONTINUED
36
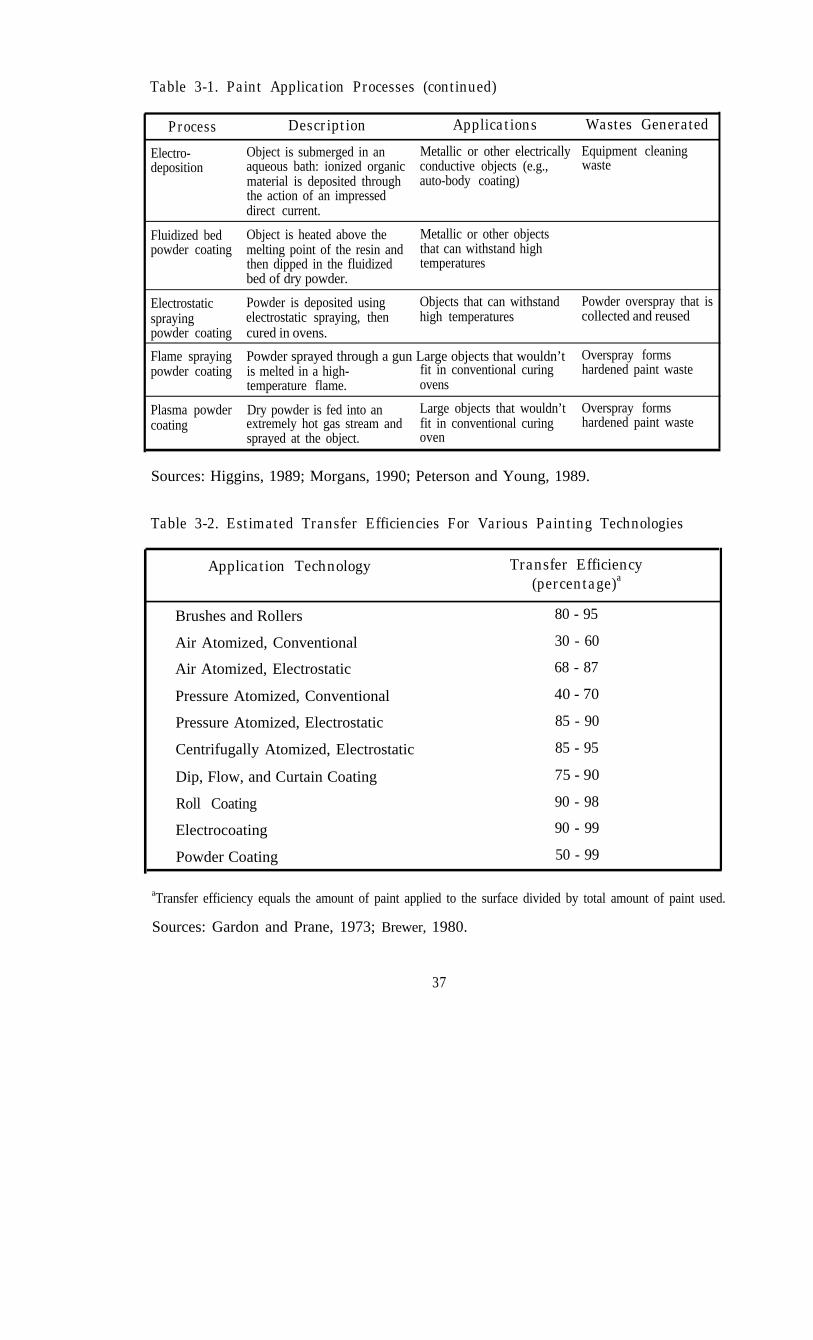
Table 3-1. Paint Application Processes (continued)
Process
Electro-deposition
Description Applications Wastes Generated
Object is submerged in an Metallic or other electrically Equipment cleaningaqueous bath: ionized organic conductive objects (e.g., wastematerial is deposited through auto-body coating)the action of an impresseddirect current.
Fluidized bed Object is heated above the Metallic or other objectspowder coating melting point of the resin and that can withstand high
then dipped in the fluidized temperaturesbed of dry powder.
Electrostatic Powder is deposited using Objects that can withstand Powder overspray that isspraying electrostatic spraying, then high temperatures collected and reusedpowder coating cured in ovens.
Flame spraying Powder sprayed through a gun Large objects that wouldn’t Overspray formspowder coating is melted in a high- fit in conventional curing hardened paint waste
temperature flame. ovens
Plasma powder Dry powder is fed into an Large objects that wouldn’t Overspray formscoating extremely hot gas stream and fit in conventional curing hardened paint waste
sprayed at the object. oven
Sources: Higgins, 1989; Morgans, 1990; Peterson and Young, 1989.
Table 3-2. Estimated Transfer Efficiencies For Various Painting Technologies
Application Technology
Brushes and Rollers
Air Atomized, Conventional
Air Atomized, Electrostatic
Pressure Atomized, Conventional
Pressure Atomized, Electrostatic
Centrifugally Atomized, Electrostatic
Dip, Flow, and Curtain Coating
Roll Coating
Electrocoating
Powder Coating
Transfer Efficiency(percentage)a
80 - 95
30 - 60
68 - 87
40 - 70
85 - 90
85 - 95
75 - 90
90 - 98
90 - 99
50 - 99
aTransfer efficiency equals the amount of paint applied to the surface divided by total amount of paint used.
Sources: Gardon and Prane, 1973; Brewer, 1980.
37

3.2 WASTE GENERATION
Wastes generated from industrial paint application processes may be consideredhazardous because of the presence of toxic metals and organic solvents. Wastesgenerated during industrial paint application include the following:
l scrubber water, paint sludge, and filters from air pollution control:
l equipment cleaning wastes;. aqueous waste and spent solvents from surface pretreatment;
l VOC emissions during paint application, curing, and drying;
� empty raw material containers; and
l obsolete or unwanted paint.
In addition, residential paint use generates waste from equipment cleaning, VOCemissions, empty containers, and leftover paint.
Paint transfer inefficiency can be the largest source of waste from paint applicationprocesses. Paint used but not applied to the surface being coated (e.g., paint overspray)generally becomes waste. Paint-laden air from overspray is often filtered through a waterscrubber that removes the paint from the air. The scrubber water is generally recycled,and the paint sludge is disposed of, often as a hazardous waste (Higgins, 1989).
Evaporation of organic solvents is another important source of waste. The entiresolvent component of organic solvent-borne paints eventually evaporates. In addition,organic solvents used to thin paint, to clean equipment, and to prepare surfaces forcoating are sources of air pollution. The USEPA and some states have regulatedemissions of VOCs from paint coatings, and further reductions will be required in thefuture under the amended federal Clean Air Act (see Section 1.5.1). These restrictionswill have an impact on the amounts and types of solvents used in coatings and those usedfor cleaning.
Equipment cleaning is a third major source of waste generation from paintapplication. Generally, all paint application equipment must be cleaned after each use toprevent dry paint residue and avoid contaminating batch processes. In addition, brushesand rollers can be cleaned after each use to remain pliable. Wastes generated includespent organic solvents, aqueous cleaners, wastewater, and paint sludge. (Alternatively,airtight containers are used to store rollers so that cleaning isn’t required). Generally,solvent-based paints require organic solvents for clean-up. Less toxic cleaning solutionscan be used to clean up water-borne paints. The resultant wastes are also less toxic(Higgins, 1989).
3.3 WASTE REDUCTION
Techniques to reduce the quantity and toxicity of waste generated from paintapplication are described below. Table 3-3 summarizes this discussion.
38

Table 3-3. Waste Reduction Techniques for Paint Application
Technique Description Effects CaveatsI
Use alternativepaint
Substitute water-borne, Reduces the toxicity ofpowdered, or high-solids paints paint sludge and paintfor solvent-based paints. scraps.
Use paints that have less toxic Powdered paints eliminatepigments. scrubber water and paint
sludges from overspray.
Reduces need for organicsolvents for cleaning orpaint thinning.
Reduces VOC emissions.
Substitute paints mustmeet qualityspecifications.
Powdered and high-solids paints requirenew or modifiedapplication processesthat generally aren’tavailable forhomeowners or smallbusinesses.
Reduce quantity of Reduce solvent evaporation by Reduces quantity of spentsolution used for installing tank lids, increasing solvents, aqueoussurface freeboard space, and installing solutions, and rinsewaterpreparation. freeboard chillers. from surface preparation.
Extend life of cleaning solution Reduces use of rawby removing solids and adding materials.components to increaseefficacy, when needed.
Redesign rinsing system toreduce rinsewater usage (e.g.,use water sprays, reduce dragout).
Reduce toxicity of Use physical or mechanical Reduces toxicity of surfacesolutions used for methods. preparation wastes.surfacepreparation. Use less toxic solvents or Reduces VOC emissions.
aqueous solutions.
Recycle surface Recover and reuse spent Reduces the quantity ofpreparation wastes. solvents. surface cleaning wastes.
Reuse nonhalogenated solventsas fuel.
Recover metals from surfacepreparation solutions.
Increase transfer Use electrostatic spraying to Reduces paint loss due to Electrostatic sprayingefficiency. increase transfer efficiency. overspray. and electrodeposition
use flow coating, roller Reduces paint sludge,require electrically
coating, or electrodeposition to scrubber water, and spentconductive surface.
increase transfer efficiency. filters from air pollution Applicability of
Improve operating practices. control. coating processesdepends on shape ofsurface. IElectrodepositionrequires water-bornepaints.
High investment costs.
CONTINUED
39
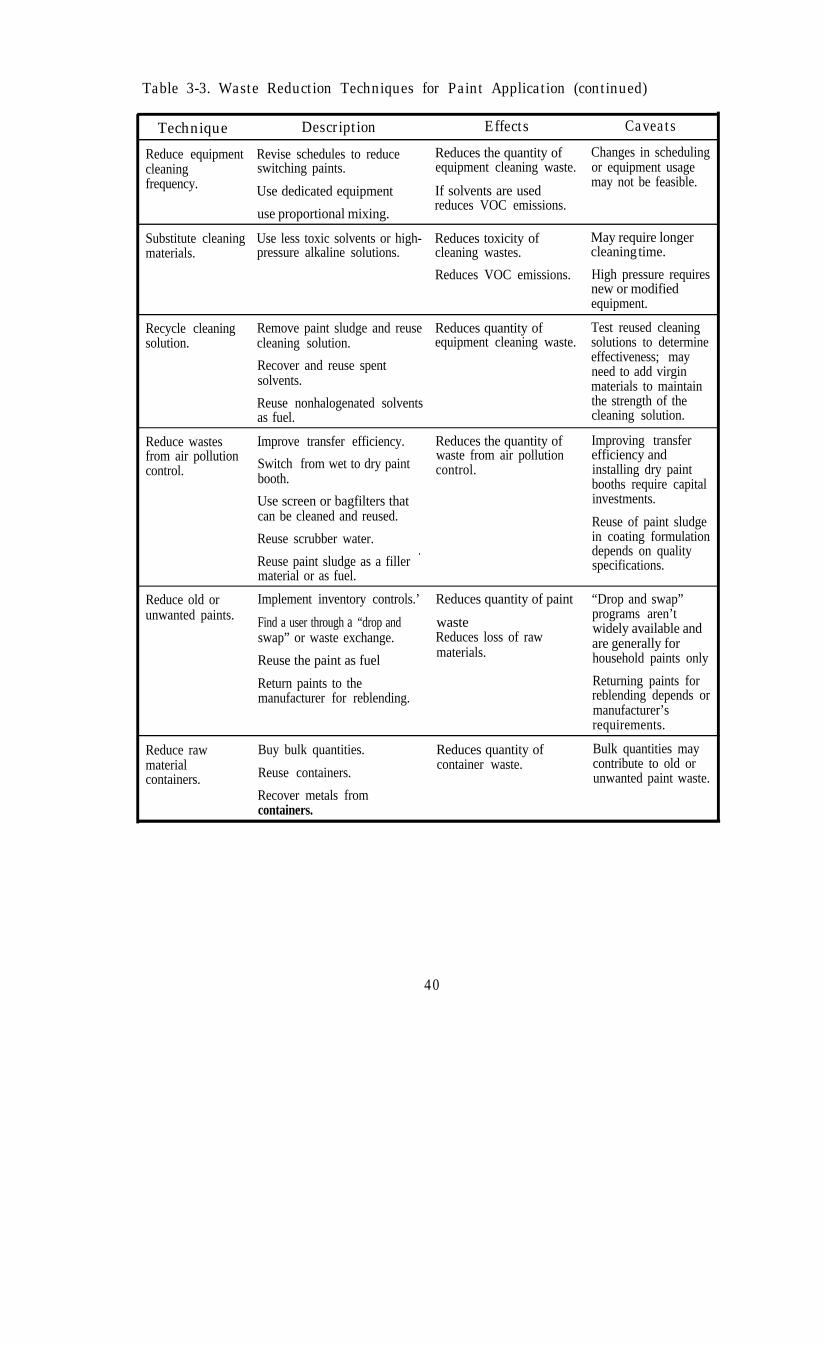
Table 3-3. Waste Reduction Techniques for Paint Application (continued)
Technique Description Effects Caveats
Reduce equipment Revise schedules to reduce Reduces the quantity of Changes in schedulingcleaning switching paints. equipment cleaning waste. or equipment usagefrequency. Use dedicated equipment If solvents are used
may not be feasible.
use proportional mixing.reduces VOC emissions.
Substitute cleaning Use less toxic solvents or high- Reduces toxicity of May require longermaterials. pressure alkaline solutions. cleaning wastes. cleaning time.
Reduces VOC emissions. High pressure requiresnew or modifiedequipment.
Recycle cleaning Remove paint sludge and reuse Reduces quantity of Test reused cleaningsolution. cleaning solution. equipment cleaning waste. solutions to determine
Recover and reuse spenteffectiveness; may
solvents.need to add virginmaterials to maintain
Reuse nonhalogenated solvents the strength of theas fuel. cleaning solution.
Reduce wastes Improve transfer efficiency. Reduces the quantity of Improving transferfrom air pollution Switch from wet to dry paint
waste from air pollution efficiency andcontrol. booth.
control. installing dry paintbooths require capital
Use screen or bagfilters thatcan be cleaned and reused.
Reuse scrubber water.
investments.
Reuse of paint sludgein coating formulation
Reuse paint sludge as a fillermaterial or as fuel.
depends on qualityspecifications.
Reduce old or Implement inventory controls.’ Reduces quantity of paint “Drop and swap”unwanted paints. Find a user through a “drop and waste
programs aren’t
swap” or waste exchange. Reduces loss of rawwidely available and
materials.are generally for
Reuse the paint as fuel household paints only
Return paints to the Returning paints formanufacturer for reblending. reblending depends or
manufacturer’srequirements.
Reduce rawmaterialcontainers.
Buy bulk quantities.
Reuse containers.
Recover metals fromcontainers.
Reduces quantity ofcontainer waste.
Bulk quantities maycontribute to old orunwanted paint waste.
40

3.3.1 Substitute or Reformulate Raw Materials
The hazardous and toxic characteristics of waste from paint application result in partfrom the toxicity of the paint used. Using paints formulated with less toxic materialsreduces the hazard of the waste generated. Substituting water-borne, powdered, or high-solids paints for conventional organic solvent-borne paints reduces the need for organicsolvents for cleaning equipment or thinning paints, and they reduce VOC emissions. Ametal furniture manufacturing company reportedly eliminated all VOC emissions byswitching from organic solvent-borne to powdered paint (Kohl, 1984). In addition,powdered paints eliminate the generation of scrubber water, paint sludges, and dry filterwaste from overspray capture devices.
The use of substitute paints is limited by coating quality specifications and the type ofsurface to be coated. For example, powdered coatings are only applicable for surfacesthat can withstand high temperatures. In addition, powdered and high-solids paints mayrequire new or modified equipment.
3.3.2 Reduce Quantity and Toxicity of Surface Preparation Wastes
Wastes from surface preparation include spent solvents, rinsewaters, contaminatedaqueous solutions, and spent abrasive materials. Waste reduction techniques for wastesfrom surface preparation include reducing the amount of cleaning solution used,substituting less hazardous cleaning solutions, and reusing and recycling the cleaningwaste.
To reduce the amount of cleaning solution used in surface preparation, solids andaccumulated sludge should be removed from cleaning baths to extend the life of the bath.In addition, solvent cleaning solutions can be conserved by reducing loss due toevaporation. Techniques to reduce evaporation include installing tank lids, increasingfreeboard space, installing freeboard chillers or refrigerated coils, and reducing drag out.Rinsewaters can be conserved by reducing drag out and by installing water spray systemsthat use small amounts of water. Finally, physical and mechanical methods, such asblasting or sanding, can prepare metal surfaces for paint application. These methodsproduce smaller quantities of dry waste and can eliminate the need for some cleaningsolutions.
Organic solvents used to clean surfaces prior to painting emit VOCs that contribute toatmospheric ozone. Replacing these with alkaline solutions or mechanical abrasivetechniques eliminates this sources of VOC emissions. The hazard of using abrasives suchas sand or stone, which generate a fine silt mixed with metals, can be reduced by usingsynthetic abrasives that are more durable.
Finally, wastes from surface preparation can be recycled. As mentioned above,solutions can be progressively mused by removing accumulated sludges or oils. Thistechnique is applicable for both industry and households. Metals removed from treatmentsolutions can be reused. For example, ferrous salts removed from pickling bath solutionscan be sold to ink, dye, and pigment manufacturers. Organic solvents can be recoveredfor reuse. Nonhalogenated spent solvents can be burned as fuel.
41

3.3.3 Increase Paint Transfer Efficiency
In conventional spray painting operations, large quantities of waste are generatedfrom paint overspray and rebound, including paint sludge, scrubber water, and filters.Wastes from paint application can be reduced by increasing the transfer efficiency ofpaint application processes. For example, electrostatic spraying and electrodeposition inimmersion can increase transfer efficiency over conventional spray application.However, both electrodeposition and electrostatic spraying require electrically conductivesurfaces for application. Direct application methods such as roller coating and flowcoating also increase paint transfer efficiency. The applicability of these techniques,however, depends on the shape of the surface being coated.
Even greater improvements may be possible by more major changes in applicationtechnique such as going from a conventional spray system to an electrocoat or powdercoating system. Other options include changing to a powder coating system or to a paintformulation that remains fluid indefinitely unless subject to heat or other curingmechanisms. A paint booth system by Grace Robotics Incorporated (1990) is designed towork with liquid high-solids bake coatings. The spray booth captures overspray andrecycles it to the spray system; the manufacturer claims paint utilization of up to 99percent.
The waste reduction techniques described above require changes in paint applicationprocesses and therefore require capital investment. Improvements in operating practicesfor existing spraying processes can also improve transfer efficiency, although they are notas effective as process changes. Proper adjustment and regular cleaning of spray gunsensure optimum spraying results. Improved operator training may also enhance theefficiency of existing application processes.
3.3.4 Reduce Equipment Cleaning Waste
Generally, paint application equipment is cleaned prior to applying different types orcolors of paint. Reducing cleaning frequency by revising production schedules toconsolidate production runs or dedicating application equipment to a single type of paintcan reduce equipment cleaning waste. The quantity of cleaning waste is also reduced byutilizing proportional mixing of paints at the point of paint application; this eliminates theneed to clean paint mixing tanks. The toxicity of equipment cleaning wastes can bereduced by replacing organic solvents with less toxic or nontoxic solutions. A longercleaning time may be required when using less toxic solvents.
Wastes from clean-up can be reduced through more effective cleaning methods suchas pressure spraying, using heated fluids in place of organic solvents, and usingmechanical means such as scraping or wiping instead of just rinsing. More advancedsystems such as agitated solvent rinse tanks or use of ultrasonics are possible. Replacingsolvent usage with high-pressure alkaline solutions reduces the release of VOCs fromcleaning equipment; however, this requires installing new equipment.
Equipment cleaning wastes can be recycled. Cleaning solutions should be reuseduntil they are no longer effective. Sludges can be removed and additives introduced toextend the life of cleaning solutions. Spent cleaning solvents can be recovered for reuse,and spent nonhalogenated solvents can be reused as fuel. One medium-sized body shop
reduced its waste disposal by 40 percent by recycling spent cleaning solvents onsite(Peterson and Young, 1989).
3.3.5 Reduce Wastes from Air Pollution Control
Using air pollution control devices designed to capture paint overspray generateslarge quantities of waste. Improving the transfer efficiency of paint application processesreduces or eliminates this source of waste. Section 3.3.3 describes techniques to improvetransfer efficiency. Switching from a wet to a dry paint booth may reduce the volume ofwaste generated. Dry paint booths use filters rather than water scrubbers to remove paintfrom the air and eliminate the generation of scrubber wastewater. However, dry paintbooths generate waste filters and paint solids that must be landfilled, while wastes fromwet paint booths can be recycled. A life cycle assessment is required to determine the“best” method.
3.3.6 Reduce Obsolete or Unwanted Paints
In addition to generating a hazardous waste, unused paints represent an unproductiveuse of materials. Better inventory controls to reduce the generation of this waste paintinclude purchasing only the amount of paint required, using the oldest paints in aninventory first (first in, first out), and standardizing paint types and colors to minimize thenumber of different types of paint in inventory.
Leftover paint waste is often generated from household painting. This problem canbe reduced by education to improve skills in estimating the surface area to be painted.Also, some changes in sales policies for residential paint could be helpful. In an informalconversation with a large manufacturer of architectural paint for home owners, it wasproposed that consumers should be able to purchase quart containers of paint withoutpaying a price premium. To qualify, the consumer would have to purchase a minimumquantity of paint. The reaction to this suggestion was that it might be possible as long asthe consumer could not return unopened containers for credit. Even with this restriction,such a program could reduce household paint waste.
If unused paint wastes are generated, finding another user for the paint is one methodof reducing waste generation. For household paint use, leftover paints could be taken to a“drop and swap” for exchange or donated to a community group. Drop and swapprograms are not currently available in Illinois. Paints could also be returned to the paintmanufacturer for reblending or reused onsite for an application with less stringentspecifications. Organic solvents can be recovered from organic solvent-borne paints andreused. Finally, unused paints can be reused as fuel if their concentrations of heavy metalsand PCBs are within regulatory limits, although waste reduction is preferred to this reuse.
3.3.7 Reduce Container Waste
Containers that held toxic or hazardous raw materials must often be disposed of ashazardous waste. Container waste can be reduced by buying materials in bulk quantities.However, bulk quantities can contribute to old or unwanted paint waste. Another way toreduce container waste is recycling. Empty paint containers are recyclable. Containerscan be cleaned and returned to the vendor for reuse. Metals can be recovered frommetallic containers.
43

44
CHAPTER 4
PAINT REMOVAL
For some architectural and industrial uses of paint, paint removal is required toinspect, repair, or repaint coated surfaces. Examples include scraping loose paint on ahouse prior to repainting, removing paint from commercial airplanes prior to inspection.and removing old coats of lead-containing paints because of human health andenvironmental risks.
4.1 CONVENTIONAL PAINT REMOVAL PROCESSES
Conventional paint removal techniques include manual scraping, sanding, sandblasting, and solvent stripping. Manual scraping and sanding are labor intensive andtherefore their application is limited to small-scale paint removal. Both sand blasting andsolvent stripping, although widely used, generate wastes that pose environmental andhealth risks. Extensive research has therefore been conducted to develop alternative paintremoval processes that reduce these risks. Section 4.3 describes alternative processes thathave been and are being developed.
Abrasive blasting, conventional sand blasting, and glass bead blasting have been usedextensively to remove paint from metal surfaces. In the abrasive blasting process, theabrasive media (e.g., sand) is propelled against the painted surface by compressed air; theimpact loosens the paint. Sand blasting is the most commonly used method of removingpaint from heavy steel surfaces. It is commonly used to remove paint from the hulls ofships, from large storage tanks, from pipes used in the petroleum and chemical industries,and from the exterior walls of concrete and masonry buildings. Because sand blastingcan damage soft surfaces, it is not applicable for removing paint from smooth wood orthin or delicate metal surfaces (Higgins, 1989). Figure 4-l illustrates the abrasiveblasting process.
For softer surfaces not suitable for sand blasting, softer abrasive media such as ricehulls and walnut shells have been used with only limited success (Higgins, 1989).Although reasonably effective, these media are subject to bacterial growth during storage,which poses a health risk to workers.
Solvent stripping is most often used on soft surfaces not suitable for abrasive blasting,such as aluminum, plastic, or wood. In conventional solvent snipping processes, organicsolvents or mixtures of organic solvents and other chemicals are applied to the paintedsurface to physically destroy the paint or the bond between the paint and the surface.Phenolic- or methylene chloride-based solvents are commonly used. The solvent can beapplied directly to the surface, or the painted object can be dipped into a solvent bath.The solvent and dissolved paint are then removed using pressurized water or by scraping.Figure 4-2 describes the solvent stripping process.
45
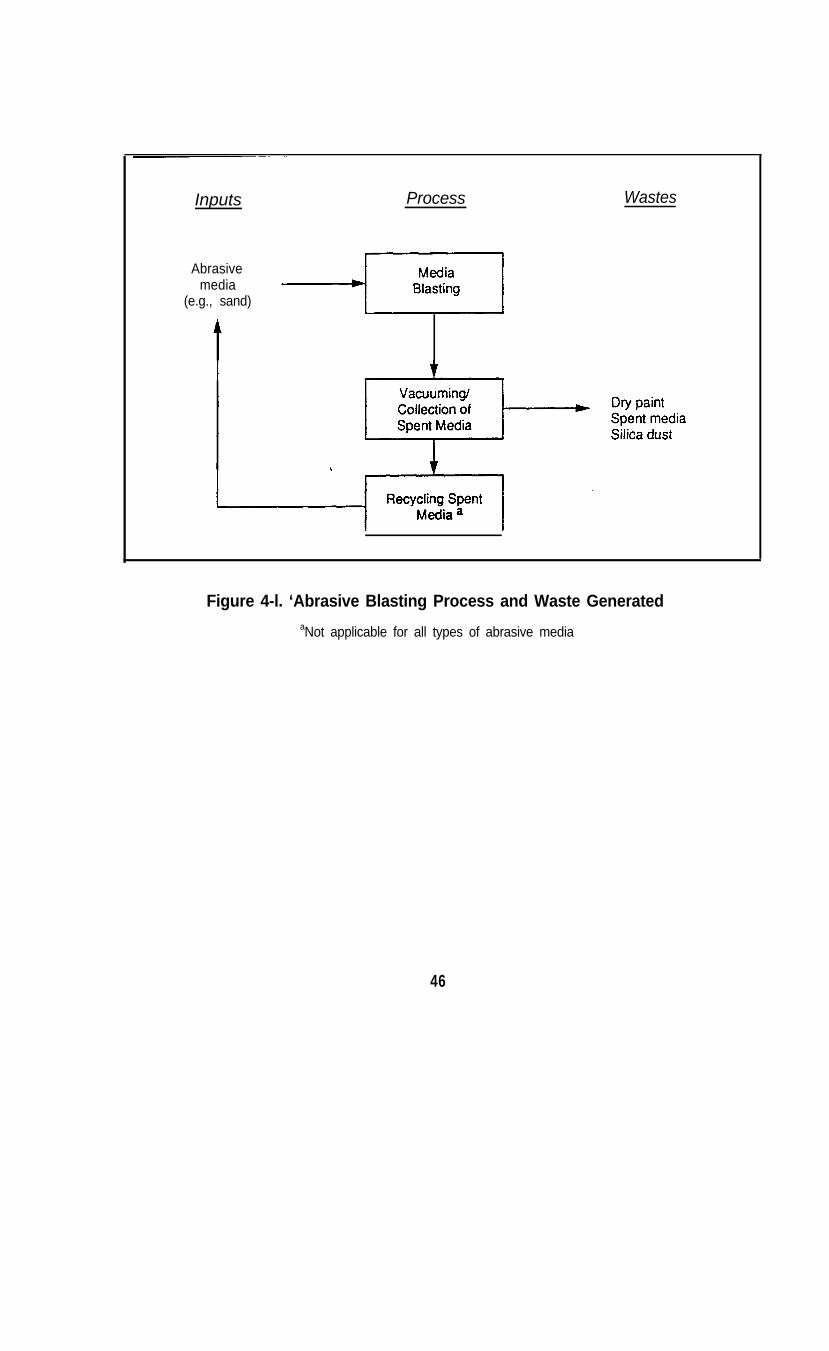
Inputs Process
Abrasivemedia
(e.g., sand)
Wastes
Figure 4-l. ‘Abrasive Blasting Process and Waste GeneratedaNot applicable for all types of abrasive media
46
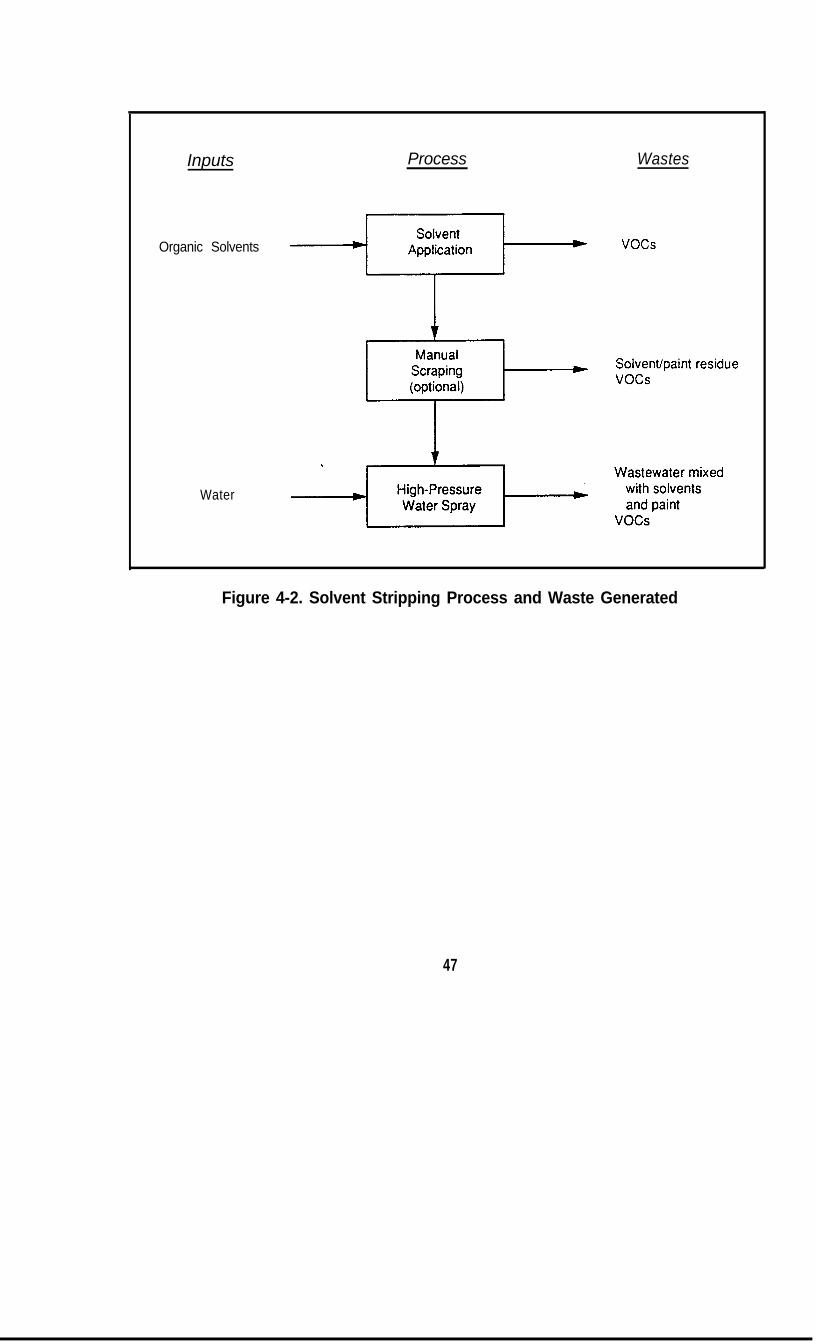
Inputs
Water
Process Wastes
Organic Solvents
Figure 4-2. Solvent Stripping Process and Waste Generated
47

4.2 WASTE GENERATION
Both sand blasting and solvent stripping processes generate hazardous wastes.Wastes generated in solvent stripping include air emissions of VOCs and large volumesof wastewater containing the solvent/paint residues. The wastewater requires treatment toremove the solvent/paint residue prior to discharge.
The use of sand and other silica-containing materials in sand blasting processes hasbeen associated with lung disease in workers. For some uses, slags from smelteringoperations have been substituted for sand to eliminate this risk. Sand blasting alsogenerates dry paint waste, which may contain heavy metals. The dry paint residue andthe spent abrasive media (e.g., sand or slag) are generally hazardous and may belandfilled or incinerated.
Removing lead-containing paints poses particular waste generation problems.Abrasive blasting generates a tine lead dust that is highly toxic to workers.Environmental regulations require total containment of the area being blasted, whichresults in workers’ exposure to very concentrated lead particles. Workers haveexperienced health problems including lead intoxication and elevated blood-lead levels(lead concentrations greater than 25 micrograms per deciliter of whole blood) (Janssen,1990). In addition, the costs of containment, collection, treatment, and disposal of theresultant waste are three to five times the before-containment costs. These problems haveled the Illinois Department of Transportation to suspend all paint removal from bridgesuntil alternatives can be found.
4.3 WASTE REDUCTION
The following activities reduce the quantity or toxicity of waste generated from paintremoval. Most of these activities require changes in waste removal processes. Suchprocess changes often require large initial investments that may be unavailable for smallfirms. Table 4- 1 summarizes this discussion.
4.3.1 Rinsewater Reduction
Conventional solvent stripping processes generate large quantities of wastewater.The wastewater is generated from high-pressure water sprays used to remove theloosened paint and solvent from the surface and from cleaning the work area to removesolvent/paint residue. Water use can be reduced by manually scraping the dissolved paintfrom the surface and collecting the residue in plastic or metal troughs. This reduces theamount of water required to remove the paint and eliminates the need to rinse the floor.Some water is still required to remove any remaining solvent/paint residue from thesurface, but less wastewater is generated. Manual scraping is labor intensive and may notbe feasible for large surfaces.
48

Table 4-1. Waste Reduction Techniques for Paint Removal
Technique
Rinse waterreduction.
Description
Collect paint and solventsolution.
Filter and reuse strippersolvent.
Effects Caveats
Reduces the quantity of Collecting thewastewater from rinsing paint/solvent solutionafter solvent paint is labor intensive.stripping.
Recovered solventsReduces the quantity of may require additives.virgin solvent used.
Solvent substitution. Immerse objects in molten salt Reduces VOC High temperaturesor hot caustic bath instead of emissions. preclude use for somesolvent bath. surfaces, including
nonmetals.
Caustic strippers areonly applicable forremoving caustic-sensitive paints fromsteel.
Abrasive mediasubstitution.
Use plastic media or dry ice as Eliminates use of sand Dry ice generates CO2
abrasive media. and related health risks. gas, which is a
Use high-pressure water Eliminates spent mediagreenhouse gas andcan affect worker
sprays. waste (plastic media arerecyclable and dry ice
health.
evaporates). Dry ice process
Plastic media blastingrequires large capital
can be substituted forinvestment.
solvent stripping, Can damage theeliminating VOCs and surface.spent solvent waste.
Substitute pulsedlight for abrasivemedia.
Use lasers or flashlamps to heat Eliminates spent media Requires large capitaland loosen paint. waste. investments.
Reliability, effects onsurfaces, and airpollutants released areuncertain and furtherresearch is necessary.
49
I
A second means of reducing the quantity and toxicity of wastewater is IO recover andreuse the spent solvents. Initial rests of solvent recovery by the Air Force showed someloss of solvent effectiveness (Higgins, 1989). Virgin materials could be added as neededto improve solvent effectiveness. Solvent collection requires large volumes of water or islabor intensive.
4.3.2 Solvent Substitution
To reduce VOC emissions, objects to be stripped can be immersed in molten salt orhot caustic baths rather than organic solvent baths. In each case, the heat destroys thepaint. The molten salt bath cannot be used on aluminum, some alloys, and nonmetallicsbecause of the high temperatures involved (900’ F). Salt baths are used in the automotiveand appliance industries. The hot caustic bath operates at lower temperatures (200’ F)than the salt bath, but the process is only applicable for removing caustic-sensitive paintsfrom steel surfaces because the caustic corrodes most other materials, includingaluminum. Caustic baths are also currently used by industry (Higgins, 1989).
43.3 Abrasive Media Substitution
To reduce the risk of lung disease associated with the use of sand and other silica-containing materials, other blasting media such as steel slags have been substituted forsand. As mentioned above, walnut shells and rice hulls have been used as abrasivemedia. Though effective, bacterial growth in the media poses worker health risks.
Plastic media have been developed to be used with conventional blasting equipment.The plastic media can be separated from the dry paint waste and reused, reducing thegeneration of spent media waste. The plastic media can be specifically engineered fordifferent surfaces. Plastic media blasting therefore can be used to remove paint fromsurfaces that would be damaged by conventional abrasive blasting. Plastic media blastinghas been used to replace solvent stripping, eliminating the release of VOCs and thegeneration of spent solvent waste and wastewater from rinsing.
Plastic media blasting has been used successfully to remove a number of differenttypes of coatings from different surfaces, resulting in significant savings in energy andlabor (Higgins, 1989). However, using excessive air pressure in the blasting operation orholding the blast nozzle too close to the painted surface can damage the surface.Improved operating practices should reduce this damage. In addition, some surfaces(e.g., aluminum aircraft skin) have a tendency to work-harden as a result of plastic mediablasting.
Sodium bicarbonate granules have also been used in abrasive blasting. Sodiumbicarbonate is not hazardous and may provide coagulation benefits in wastewatertreatment facilities.
Dry ice is another alternative blasting material to reduce silica waste generation. Inthe process, dry ice is propelled against the painted surface using conventional blastingequipment. Both the cold temperature of the dry ice and the abrasive force of blastingloosen the paint from the surface. The dry ice evaporates, leaving only the dry paintwaste. The process does generate air emissions of carbon dioxide, which can affectworker health. Also, soft surfaces such as aluminum can be damaged by dry ice blasting.
50

4.3.4 Removal Process Substitution
Extensive research has been conducted to develop alternative paint removal processesthat reduce waste generation. This section describes alternative processes that have beenand are being developed.
Flashlamp stripping uses high-energy quartz lamps to heat the paint, loosening it fromthe surface. The process has been successful at removing paint from both composite andmetallic surfaces without damaging the surfaces. It can also selectively strip the top coatsof paint while leaving the primer undamaged (USAF, 1987). Flashlamp stripping hasbeen found to be difficult to use and to have a high initial investment cost (Higgins,1989).
Laser systems are similar to flashlamp stripping. A laser fired at a painted surfaceheats the paint, loosening it from the surface. Tests of laser systems have demonstratedthat paint is completely removed from test surfaces. However, the technique is still in theexperimental stages and many questions relating to reliability, effects on surfaces, effectson nearby electronic equipment, and air pollutants still need to be researched. Inaddition, laser systems require large capital outlays (Higgins, 1989). Finally, furtherresearch is needed to determine if additional safety procedures are required to protectworkers and the public from laser/electro-optical dangers (Janssen, 1990).
High-pressure water-jet blasting is currently used to remove paint build-up from thefloor gratings of paint booths. Its use in other applications is being considered.Questions about such applications include the reliability and control of the system, wastegeneration, potential damage to surfaces, worker safety, and the ability to remove a widerange of coatings (Higgins, 1989).
Cryogenic processes require spraying the surface with liquid nitrogen to lower thesurface temperature to -100’ F and thereby loosen the paint. The paint is loosenedbecause the coating and the surface contract at different rates because of the lowtemperatures. The loosened paint is then removed using plastic media blasting (Higgins,1989). This process is useful for coatings that cannot be removed by plastic mediablasting alone. It is only applicable for removing paint from relatively small surfaces.
51

52
CHAPTER 5PAINT-RELATED ACTIVITIES IN ILLINOIS
5.1 INTRODUCTION
HWRIC conducted a literature review, mail survey, and site visits to determine
l the types of facilities generating paint-related waste in Illinois,
l the quantities and types of paint-related waste generated by Illinois facilities,and
l current waste reduction, management, and disposal practices for paint-relatedwastes in Illinois.
This chapter presents information on these paint-related activities in Illinois.
5.2 STUDY METHODOLOGY
HWRIC used the results of the literature review to identify data gaps and to structurethe subsequent survey and site visits. The literature review identified little data on paintusage and associated waste generation. More detailed data were available for paintmanufacturing activities, but detailed, current descriptions of waste reduction activitiesundertaken by paint manufacturers were not available. The mail survey and site visitswere undertaken to fill in these data gaps. This section describes the methodology usedto conduct the mail survey and site visits.
5.2.1 Survey Methodology
HWRIC conducted the voluntary mail survey, “Reducing and Managing Paint-Related Wastes” (Paint Survey), of Illinois paint manufacturers and paint users to obtainthe following information:
. the quantities and types of multimedia waste generated due to paint-relatedactivities,
how paint-related wastes are currently managed,the extent of waste reduction activities for paint-related wastes, andwaste reduction information sources used and information needed by Illinoisfacilities.
Because the survey was voluntary and conducted through the mail, it was determined thatwe would not obtain a response rate sufficient to support making estimates for the entirepopulation of paint manufacturers and users in Illinois. Instead, the Paint Survey wasdesigned to provide an indication of the types of paint-related waste generation,management, and reduction in Illinois. The results of the survey do indicate what wastereduction and waste management options are available to Illinois firms. They alsoindicate how Illinois firms get information on waste reduction and what types ofinformation they need. These data have been used to develop a proposed education andcommunication program in Illinois.
53
In addition, respondents to the Paint Survey were invited to provide any commentsrelevant to HWRIC’s study. Comments received have been incorporated into this report.All survey responses and comments are confidential; therefore, the identities of surveyrespondents are not included in this report. Appendix A includes copies of the PaintSurvey questionnaires.
The Paint Survey sample included industries in the survey that were expected to
l use or manufacture paint,l have relatively small firms based on the numbers of employees, andl represent a variety of paint-related activities.
Table 5-l lists the industries included in the survey and the estimated number offacilities in Illinois for each industry. Within each industry shown, HWRIC randomlyselected facilities to receive the Paint Survey. Because Illinois House Bill 1356specifically referred to painting contractors and auto body shops, the survey was sent to alarger number of these industries. Table 5-1 shows the number of facilities in eachindustry that received a survey.
Table 5-l also shows the number of facilities responding to the Paint Survey in eachindustry. Approximately 16 percent of facilities surveyed responded. One-third of therespondents indicated that they did not manufacture or use paint. These facilities fall intothree groups:
l facilities in Paint and Related Coatings Manufacturing industry (StandardIndustrial Classification [SIC] code 2851) that manufactured sealants rather thanpaints
l automobile mechanics that do not do any body work (e.g., painting) and wereincorrectly included in Auto Body Repair (SIC 7532), and
l manufacturers who do not use any paint but who HWRIC suspected paintedtheir products as part of their manufacturing operations. Many of these facilitiescontract out their painting work.
Response rates to the Paint Survey ate not sufficient to make statistically accurateestimates of data for all Illinois paint manufacturers or users. In addition, a largepercentage of facilities that did respond were unable to quantify some or all of the wastethey generated GeneraIly, these are conditionally exempt small quantity generators,which are exempt from federal or state regulations that would require them to measurethe quantity of waste generated. Nonetheless, the survey responses do provide anindication of some of the types of waste generation and waste reduction activitiesconducted by Illinois facilities and the information Illinois facilities have available onwaste reduction opportunities.
54

Table 5-l. Number of Facilities Surveyed and Responding
Illinois Facilities Facilities RespondingSIC Description Facilitiesa Surveyed Paint No Paint1721 Painting and paper hanging 2,315 150 17 02434 Wood kitchen cabinets 218 15 1 02499 Wood products, n.e.c.b 118 15 1 42511 Wood household furniture 111 15 1 12514 Metal household furniture 20 5 0 02851 Paint manufacturing 114 35 6 63411 Metal cans 21 5 1 13412 Metal shipping barrels and 22 5 2 0
3442 Metal doors, sash, and trim 86 5 0 13444 Sheet metal work 306 20 1 43469 Metal stampings, n.e.c.b 139 20 1 33479 Metal coating, engraving 177 20 1 2
(coil coaters)3499 Fabricated metal products, 273 20 0 3
n.e.c.b
3523 Farm machinery and equipment 91 5 0 13531 Construction machinery 40 5 0 03564 Blowers and fans 61 3 1 03585 Air conditioning, heating equipment 39 2 0 0
3631 Household cooking equipment. 9 1 0 0
3632 Household refrigerators and 3 1 0 0
3633 Household laundry equipment 4 1 1 0
3635 Electric housewares and fans 29 1 0 03639 Household appliance 0 0
manufacturers, n.e.c.b2 1
3711 Motor vehicles and 2 5 0 0passenger car bodies
3713 Truck and bus bodies 27 5 0 03714 Motor vehicle parts and 208 10 1 0
accessories3743 Railroad equipment 35 5 0 17532 Auto body repair shops 3187 150 22 2
Total 7,661 525 57 29
*Source: American Business Information, 1991b n.e.c . = not elsewhere classified
55

5.2.2 Site Visit Methodology
We arranged each site visit through telephone contacts with the management of thecandidate facility. If the facility indicated an interest in participating in the study, we senta copy of the appropriate site visit questionnaire to the facility for review. Appendix Bcontains a copy of the questionnaire. After allowing time for the facility to review thequestionnaire, we made a follow-up telephone contact to either set a date for the site visitor to eliminate the facility from further consideration.
In general, all site visits consisted of three phases. In the first phase we conducted anentry interview to discuss the objectives of the project, the overall information goals ofthe visit, and the nature of the site being visited. During this phase of the site visit, werequested permission to tape record the remainder of the interview. During this initialmeeting, we discussed the paint manufacturing or paint use process occurring at the sitein detail to insure a complete understanding prior to beginning the actual inspection of theprocess. The majority of the site visit questionnaire was also completed at this time. Weidentified items of information requiring lead time to acquire at the end of the inspectionportion of the site visit. The duration of the entrance interviews varied from one to fourhours depending on the nature of the site.
The second phase of each site visit consisted of the actual inspection of the paint useor manufacturing process. Regardless of the process type, the inspection followed theprocess from the receipt of raw materials through production activities, to the completionof the product (paint or finished article). We also examined storage tanks, containers, andpackages of raw materials and/or paints to verify data gathered during the entranceinterview. The inspection concentrated on identifying points of waste generation,quantities and types of waste generated, and methods of disposal, reuse, or recycling. Inparticular, we identified and inspected ultimate disposal points of liquid and solid wastes.During some of the site visits, we took photographs of the process to document theinspection. The duration of the inspection phase varied from about one to four hoursdepending on the process being inspected.
The third and final meeting of each site visit consisted of an exit interview. At thismeeting we discussed the results of the inspection and completed any remaining items ofthe site visit questionnaire. We developed a summary of accomplishments and openquestions at the close of the meeting and determined follow-up responsibilities. Inseveral instances, we made additional telephone contacts following the site visit to clarifyitems from the questionnaire or the site inspection.
We selected candidate sites from among Illinois paint users, manufacturers, and paintwaste processing facilities. Paint manufacturers visited included both large and smallmanufacturers of architectural (household) paints and product coatings. The paint userswe visited also included both large and small facilities, including auto body shops, woodcabinet manufacturers, construction equipment manufacturers, container manufacturers,and “job shop” painting companies.
56
5.3 PAINT MANUFACTURING IN ILLINOIS
5.3.1 Description of Illinois Paint Manufacturers
Based on sales revenues, Illinois ranked among the top five states in paintmanufacturing in 1987, accounting for between 10 and 12 percent of total revenues frompaint manufacturing in the United States. On a dollar basis, the East North Central regionof the United States (consisting of Ohio, Indiana, Illinois, Michigan, and Wisconsin)accounted for 31.8 percent of U.S. paint shipments in 1987 (Rauch, 1990). Direct data onthe quantity of paint manufactured in Illinois could not be identified. Assuming a linearrelationship between sales dollars and gallons manufactured, we estimate that in 1989Illinois manufactured 130 million gallons of paint. This is based on a total production inthe United States of 1,194 million gallons in 1989 (Department of Commerce, 1990).
Using sales revenues, 49 percent of the paints manufactured in Illinois in 1990 werearchitectural coatings, 39 percent were product coatings, and 12 percent were specialpurpose coatings (Rauch, 1990). A 1991 market study projected that of the paintmanufactured in Illinois, 43 percent is water-borne, 54.3 percent is organic solvent-borne,and 2.7 percent is powder (Beels, 1990).
We identified specific Illinois paint manufacturers using the 1990 IllinoisManufacturers Directory (1990), the Thomas Register (1990), and the Paint Red Book(Palmer, 1990). These sources identified 114 manufacturers of paints and coatings inIllinois of which 90 are located in the Chicago area. Figure 5-l shows the number ofemployees for Illinois paint manufacturers based on the 59 Illinois companies listed in thePaint Red Book (about 50 percent of the paint manufacturers in Illinois). About 50percent of Illinois manufacturers listed employ 50 or fewer people. Surprisingly, many ofthe smaller companies produce a wide range of paint types. As an example, the painttypes listed in the Paint Red Book for a small, Illinois-based paint company that employsten people, include the following:
. Alkyd
l Chlorinated rubberl Polyurethane
l Vinyl coatingsl Air dry enamell Waterborne systems
l Aluminum l ceIlulose
l Epoxy l 0leoresinous
l Shellac l Silicone
l Zinc chromate primer l Water soluble
l Lacquers . High solids
Table 5-2 shows the types of paint manufactured by Illinois facilities responding tothe Paint Survey. Five of the six respondents manufactured organic solvent-borne paints.These five facilities manufacture product coatings, special purpose coatings, or both. Theone respondent that does not manufacture organic solvent-borne paints makes only water-borne coatings for architectural use. None of the survey respondents manufacture powdercoatings.
57

Percentage of Companles
30
25
20
15
10
5
01-10 11-25 26-50 51-100 100+
Number of Employees
Figure 5-1. Size Distribution of Illinois Paint Manufacturer@
Source: Palmer, 1990.
aIncludes only the 59 Illinois paint manufacturers listed in the Paint Red Book (Palmer, 1990).
Table 5-2. Types of Paint Manufactured by Paint Survey Respondents
Type of Coating Number of Respondents
Organic solvent-borne coatings only 2
Water-borne coatings only 1
Both organic solvent- and water-borne coatings 3
Powder coatings 0
Total 6
58
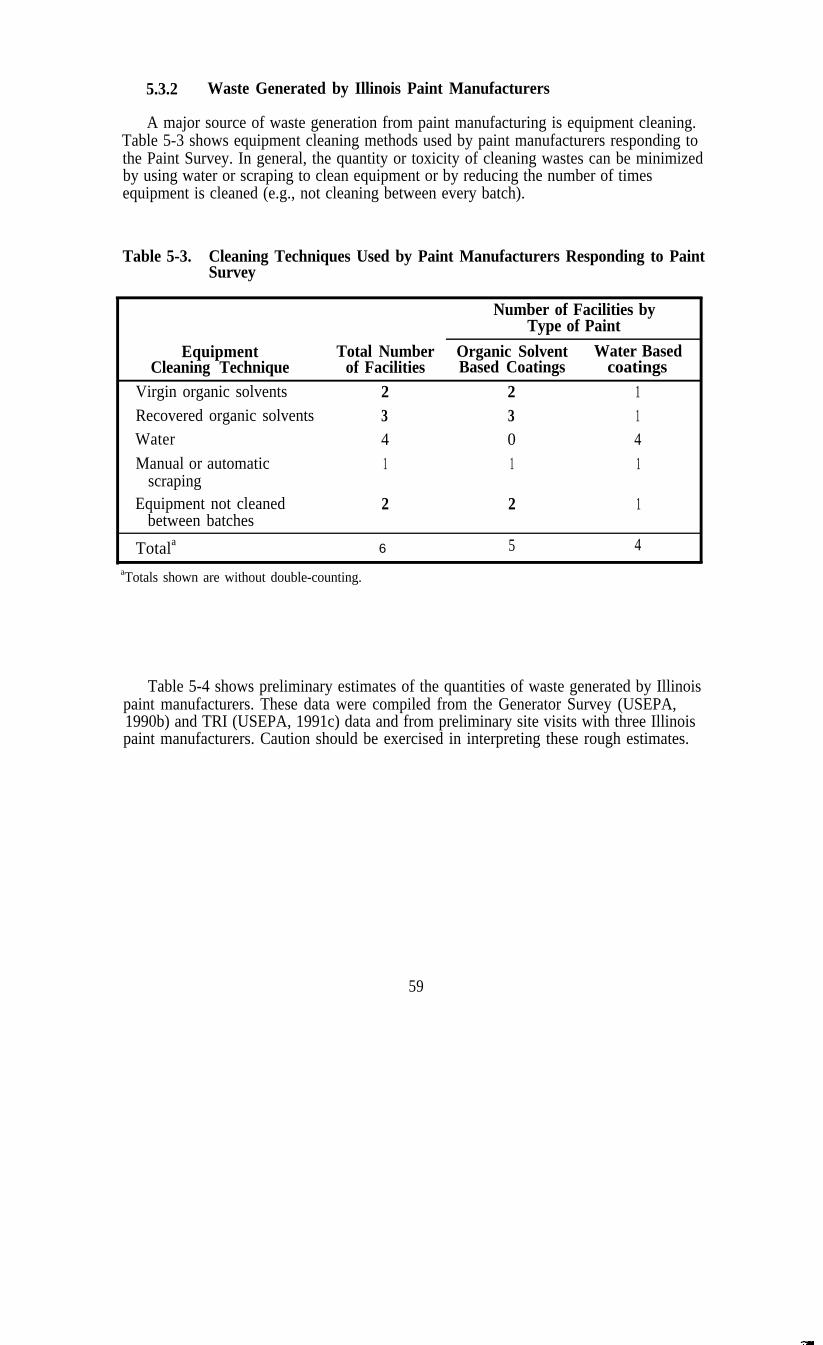
5.3.2 Waste Generated by Illinois Paint Manufacturers
A major source of waste generation from paint manufacturing is equipment cleaning.Table 5-3 shows equipment cleaning methods used by paint manufacturers responding tothe Paint Survey. In general, the quantity or toxicity of cleaning wastes can be minimizedby using water or scraping to clean equipment or by reducing the number of timesequipment is cleaned (e.g., not cleaning between every batch).
Table 5-3. Cleaning Techniques Used by Paint Manufacturers Responding to PaintSurvey
Number of Facilities byType of Paint
Equipment Total Number Organic Solvent Water BasedCleaning Technique of Facilities Based Coatings coatings
Virgin organic solvents 2 2 1Recovered organic solvents 3 3 1Water 4 0 4Manual or automatic 1 1 1
scrapingEquipment not cleaned 2 2 1
between batches
Totala6 5 4
aTotals shown are without double-counting.
Table 5-4 shows preliminary estimates of the quantities of waste generated by Illinoispaint manufacturers. These data were compiled from the Generator Survey (USEPA,1990b) and TRI (USEPA, 1991c) data and from preliminary site visits with three Illinoispaint manufacturers. Caution should be exercised in interpreting these rough estimates.
59
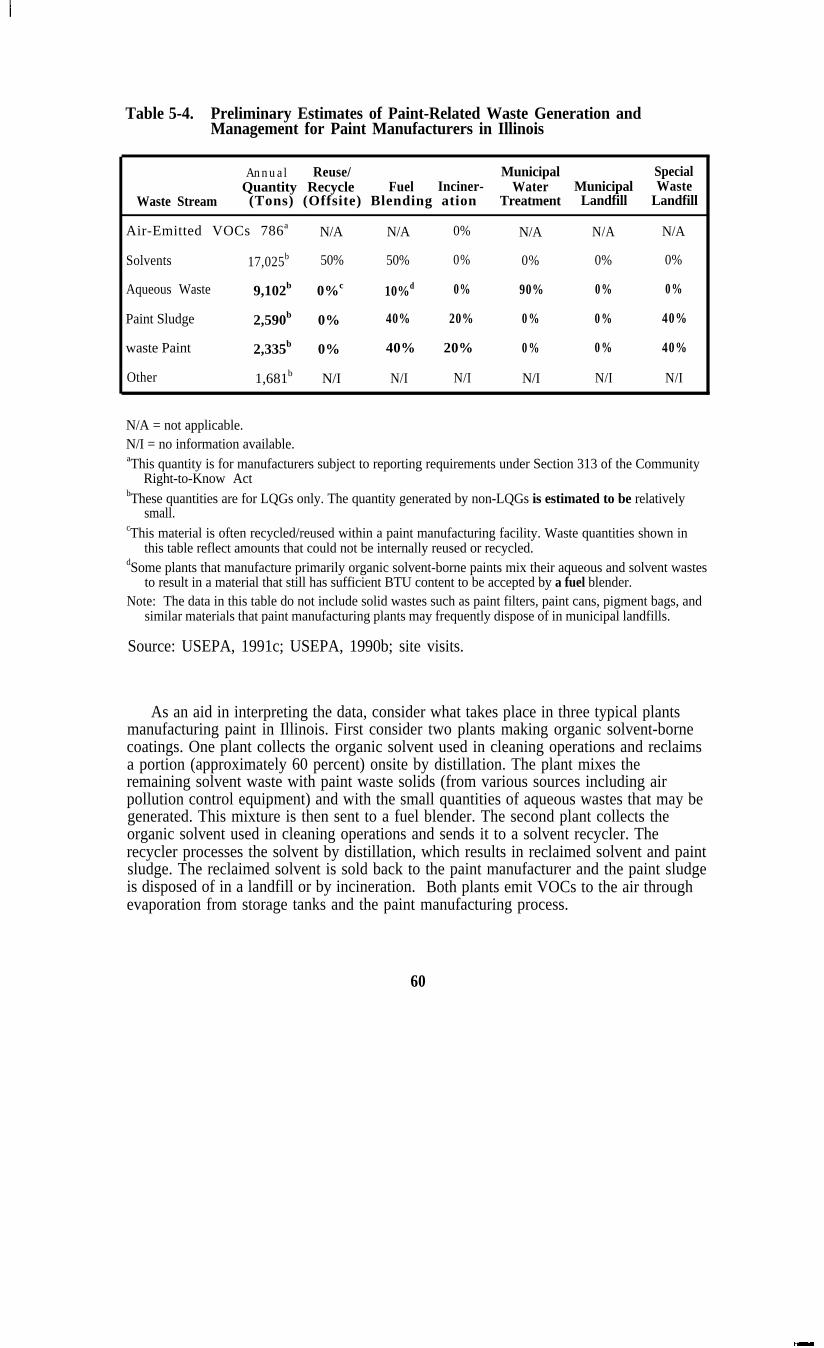
Table 5-4. Preliminary Estimates of Paint-Related Waste Generation andManagement for Paint Manufacturers in Illinois
Annual Reuse/ Municipal SpecialQuantity Recycle Fuel Inciner- Water Municipal Waste
Waste Stream (Tons) (Offsite) Blending ation Treatment Landfill Landfill
Air-Emitted VOCs 786a N/A N/A 0% N/A N/A N/A
Solvents 17,025b 50% 50% 0% 0% 0% 0%
Aqueous Waste 9,102b 0%c 10%d 0% 90% 0% 0%
Paint Sludge 2,590b 0% 40% 20% 0 % 0 % 40%
waste Paint 2,335b 0% 40% 20% 0 % 0 % 40%
Other 1,681b N/I N/I N/I N/I N/I N/I
N/A = not applicable.N/I = no information available.aThis quantity is for manufacturers subject to reporting requirements under Section 313 of the Community
Right-to-Know ActbThese quantities are for LQGs only. The quantity generated by non-LQGs is estimated to be relatively
small.cThis material is often recycled/reused within a paint manufacturing facility. Waste quantities shown in
this table reflect amounts that could not be internally reused or recycled.dSome plants that manufacture primarily organic solvent-borne paints mix their aqueous and solvent wastes
to result in a material that still has sufficient BTU content to be accepted by a fuel blender.Note: The data in this table do not include solid wastes such as paint filters, paint cans, pigment bags, and
similar materials that paint manufacturing plants may frequently dispose of in municipal landfills.
Source: USEPA, 1991c; USEPA, 1990b; site visits.
As an aid in interpreting the data, consider what takes place in three typical plantsmanufacturing paint in Illinois. First consider two plants making organic solvent-bornecoatings. One plant collects the organic solvent used in cleaning operations and reclaimsa portion (approximately 60 percent) onsite by distillation. The plant mixes theremaining solvent waste with paint waste solids (from various sources including airpollution control equipment) and with the small quantities of aqueous wastes that may begenerated. This mixture is then sent to a fuel blender. The second plant collects theorganic solvent used in cleaning operations and sends it to a solvent recycler. Therecycler processes the solvent by distillation, which results in reclaimed solvent and paintsludge. The reclaimed solvent is sold back to the paint manufacturer and the paint sludgeis disposed of in a landfill or by incineration. Both plants emit VOCs to the air throughevaporation from storage tanks and the paint manufacturing process.
60

Second, consider a large plant making latex (a waterborne paint). This plant usesonly small amounts of organic solvent and does not have a significant organic solventwaste stream. Its primary waste streams are solid wastes from pollution controlequipment, spent filters, pigment bags, and aqueous wastes from equipment cleaning.The plant sends the waste from its air pollution control equipment along with the spentfilters to a special waste landfill. Pigment bags are disposed of in the municipal landfill.The plant treats the aqueous waste stream onsite to result in two streams: an effluent thatis sent to the municipal water treatment plant, and paint sludge that is sent to a wastehauler. The waste hauler dewaters the sludge and disposes of the solids either in a landfillor by incineration.
Comparing the magnitude of wastes generated by the Illinois paint industry with thequantity of paint produced provides estimates of the material efficiency of the industry.In Section 5.3.1 we estimated that the annual production of paint in Illinois is 130 milliongallons. If we assume an average density of 8 pounds per gallon this amounts toproduction of 520,000 tons of paint per year. The total quantity of waste generated bypaint manufacturers after recycling (assuming 50 percent of organic solvent waste isrecovered) amounts to approximately 25,000 tons, based on data in Figure 2-2. Thematerial efficiency for the industry in terms of product produced per material input is520,000 divided by 545,000 or 95.4 percent.
5.3.3 Waste Reduction by Illinois Paint Manufacturers
Five of the six paint manufacturers responding to the Paint Survey consideredreducing their waste generation from paint manufacturing. Of these, only three facilitiesactually made any changes in their paint manufacturing operations to reduce wastegeneration. Two facilities reformulated their product to reduce waste generation andthree facilities reduced waste generation by changing their equipment cleaningprocedures.
Table 5-5 shows the reasons facilities gave for considering waste reduction for theirpaint manufacturing operations. The most commonly cited reason was to improve andprotect the environment. Other common reasons were to reduce waste management costsand potential liability.
Respondents to the survey also indicated the barriers to reducing or further reducingtheir waste generation from paint manufacturing. Table 5-6 shows these results. Whileno single barrier dominates the list, customer specifications and the high cost of wastereduction were the most commonly listed barriers. In addition, two of the six respondentsindicated that there are no barriers to waste reduction.
For wastes that cannot be reduced, Illinois prefers recycling or reuse rather thantreatment or disposal. Table 5-7 shows the number of paint manufacturers responding tothe Paint Survey that recycled or reused their paint-related wastes. Five of the six surveyrespondents recovered their paint manufacturing wastes. The two types of recycling usedwere organic solvent recovery and blending waste as fuel.
61
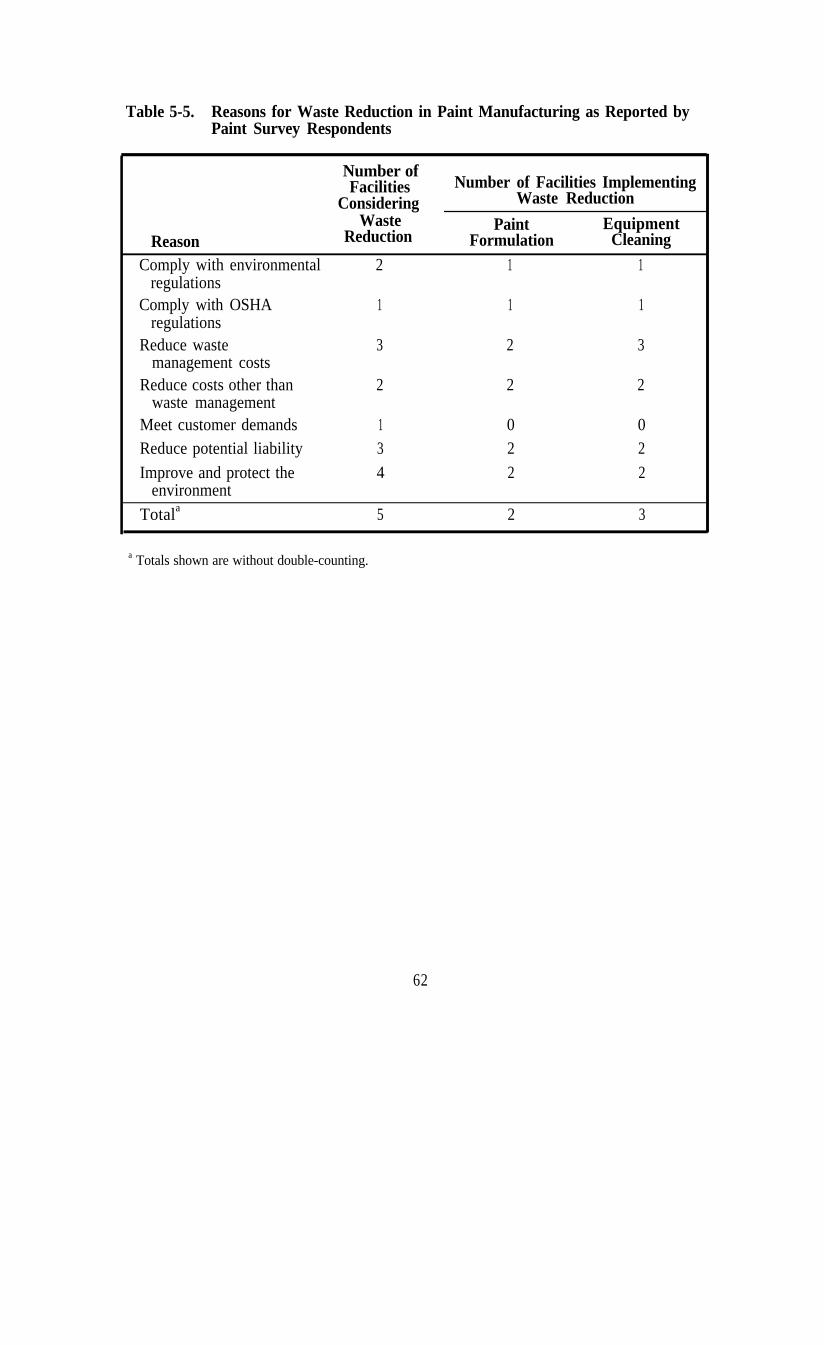
Table 5-5. Reasons for Waste Reduction in Paint Manufacturing as Reported byPaint Survey Respondents
Number ofFacilities Number of Facilities Implementing
Considering Waste ReductionWaste Paint Equipment
Reason Reduction Formulation Cleaning
Comply with environmental 2 1 1regulations
Comply with OSHA 1 1 1regulations
Reduce waste 3 2 3management costs
Reduce costs other than 2 2 2waste management
Meet customer demands 1 0 0Reduce potential liability 3 2 2
Improve and protect the 4 2 2environment
Totala 5 2 3
a Totals shown are without double-counting.
62
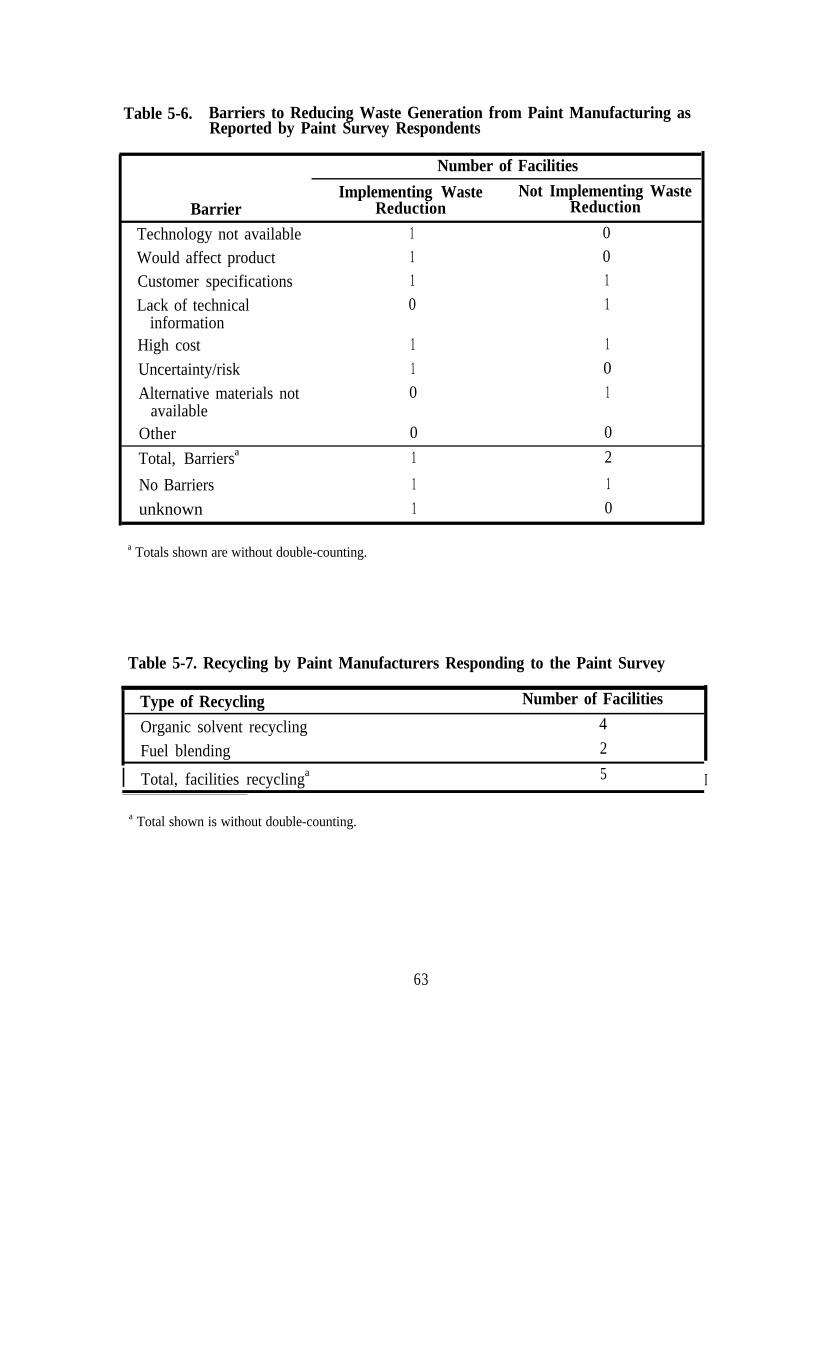
Table 5-6. Barriers to Reducing Waste Generation from Paint Manufacturing asReported by Paint Survey Respondents
Number of Facilities
Implementing Waste Not Implementing WasteBarrier Reduction Reduction
Technology not available 1 0
Would affect product 1 0
Customer specifications 1 1
Lack of technical 0 1information
High cost 1 1
Uncertainty/risk 1 0
Alternative materials not 0 1available
Other 0 0
Total, Barriersa 1 2
No Barriers 1 1
unknown 1 0
a Totals shown are without double-counting.
Table 5-7. Recycling by Paint Manufacturers Responding to the Paint Survey
Type of Recycling Number of Facilities
Organic solvent recycling 4
Fuel blending 2
I Total, facilities recyclinga 5 I
a Total shown is without double-counting.
63

5.4 PAINT APPLICATION IN ILLINOIS
5.4.1 Description of Paint Applications in Illinois
Table 5-8 reports the national total quantity of paint used by general type of use.Architectural coatings are described by the U.S. Bureau of the Census (1987) as “stocktype or shelf goods formulated for normal environmental conditions and generalapplication on new and existing residential, commercial, institutional, and industrialstructures.” Special purpose coatings include paints for refinishing automobiles (used byauto body shops), refinishing machinery, traffic marking, and aerosol packaging. Theyare described as stock items and are differentiated from architectural coatings in that theyare formulated for special purposes and environmental conditions. The Bureau of theCensus describes product coatings-OEM as “coatings formulated specifically for OEMsto meet conditions of application and product requirements and applied to such productsas part of the manufacturing process.”
Data on total Illinois consumption of paint are not available. Using certainassumptions, however, estimating paint use for some selected sectors of Illinois paintusers is possible. The following sections describe some of these sectors.
Table 5-8. Quantity of Paint Used Nationally in 1990 by Type of Use (Millions ofGallons)
Architectural Coatings
General PublicContractorsCommercial AccountsGovernment and Exports
Product Coatings-Original Equipment Manufacturers
Special Purpose Coatings
Total
Source: Rauch, 1990
530
276160
7420
335
165
1,030
5.4.1.1 Households and Painting Contractors
Households and painting contractors use architectural coatings. Overall, 63 percent ofexterior architectural paints were waterborne in 1990, but for homes the figure was 80percent. Eighty-two percent of interior paints were waterborne (Rauch, 1990).
64
As shown in Table 5-8, the general public (households) accounted for 26.8 percentand painting contractors accounted for 15.5 percent of the paint consumed in the UnitedStates in 1990 (Rauch, 1990). Assuming that paint consumption by these sectors isrelated to population, we estimated the use of paint by these sectors in Illinois by scalingthe data in Table 5-8 based on the ratio of the national and state of Illinois populations.Based on the data in Table 5-8, estimated national paint use by households is 1.133gallons per person-year and for contractors is 0.657 gallons per person-year. Applyingthese values to the Illinois population results in an estimate of paint use of 12.7 milliongallons per year by households and 7.3 million gallons per year by contractors.
5.4.1.2 Automobile Body Repair Shops
Information from the Illinois Automotive Service Association indicates thatapproximately 3,400 licensed auto body shops operate in Illinois. An unknown numberof unlicensed facilities also operate in Illinois. Auto body shops use paints class&xl asspecial purpose coatings (Rauch, 1990). Of the special purpose coatings, automobile andtruck refinishing is the largest user. Like architectural coatings, the use of paints forrefinishing automobiles is likely related to population. Thus, using the same procedure asfor households, it is possible to estimate the amount of paint used in Illinois by auto bodyshops. Nationally, about 32 million gallons of paint were used by auto body shops in1989 (Rauch, 1990). The estimated Illinois consumption, based on population, would be1.5 million gallons. This estimate does not include organic solvents used to thin paint forspray application.
5.4.1.3 Manufacturers
Paint use by manufacturers is included under the category of product coatings-OEM(original equipment manufacturer). Due to the concentration of industry in Illinois, thepercentage of total paint use in the state that is product coatings is likely higher than forthe nation as a whole. We were unable to estimate paint consumption by themanufacturing industry in Illinois with existing data. However, we did determinequalitatively which Illinois industries are likely to be large paint consumers.
Figure 5-2 indicates which Illinois industries are likely to be large consumers of paintfor products coatings (Rauch, 1990). The top three users in the product coatings categoryare manufacturers of containers, automobiles, and wood furniture. Because all theseindustries are represented in Illinois and are large users of paint, it is likely that they areamong the major paint-consuming manufacturing industries in Illinois.
5.4.2 Wastes Generated from Paint Application
Although there are a variety of paint users in Illinois, there are four primarymechanisms for generating paint-related wastes:
l surface preparation,
l VOCs emitted as part of paint application and curing,
l paint transfer inefficiency, and
l cleaning of painting equipment.
65
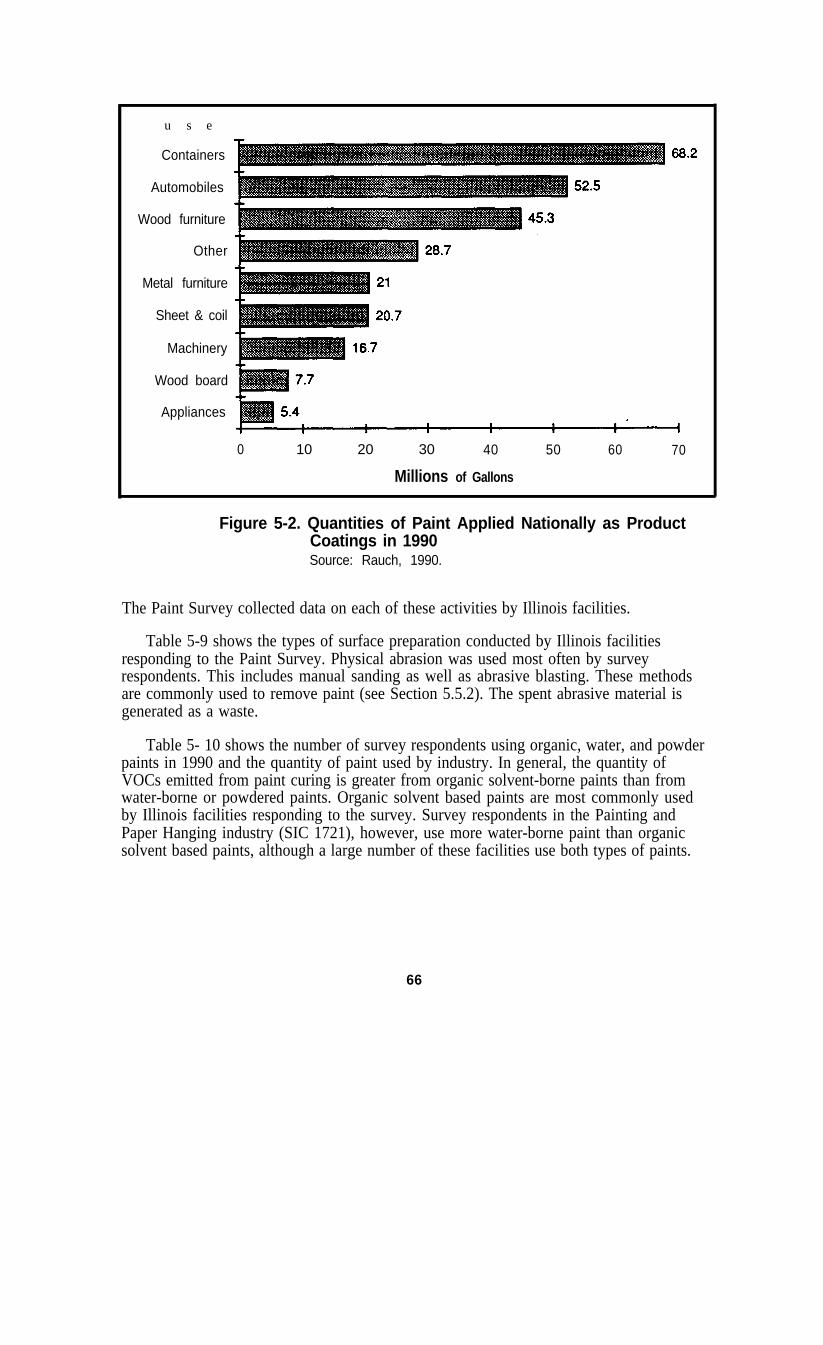
u s e
Containers
Automobiles
Wood furniture
Other
Metal furniture
Sheet & coil
Machinery
Wood board
Appliances
0 10 20 30 40
Millions of Gallons
50 60 70
Figure 5-2. Quantities of Paint Applied Nationally as ProductCoatings in 1990Source: Rauch, 1990.
The Paint Survey collected data on each of these activities by Illinois facilities.
Table 5-9 shows the types of surface preparation conducted by Illinois facilitiesresponding to the Paint Survey. Physical abrasion was used most often by surveyrespondents. This includes manual sanding as well as abrasive blasting. These methodsare commonly used to remove paint (see Section 5.5.2). The spent abrasive material isgenerated as a waste.
Table 5- 10 shows the number of survey respondents using organic, water, and powderpaints in 1990 and the quantity of paint used by industry. In general, the quantity ofVOCs emitted from paint curing is greater from organic solvent-borne paints than fromwater-borne or powdered paints. Organic solvent based paints are most commonly usedby Illinois facilities responding to the survey. Survey respondents in the Painting andPaper Hanging industry (SIC 1721), however, use more water-borne paint than organicsolvent based paints, although a large number of these facilities use both types of paints.
66
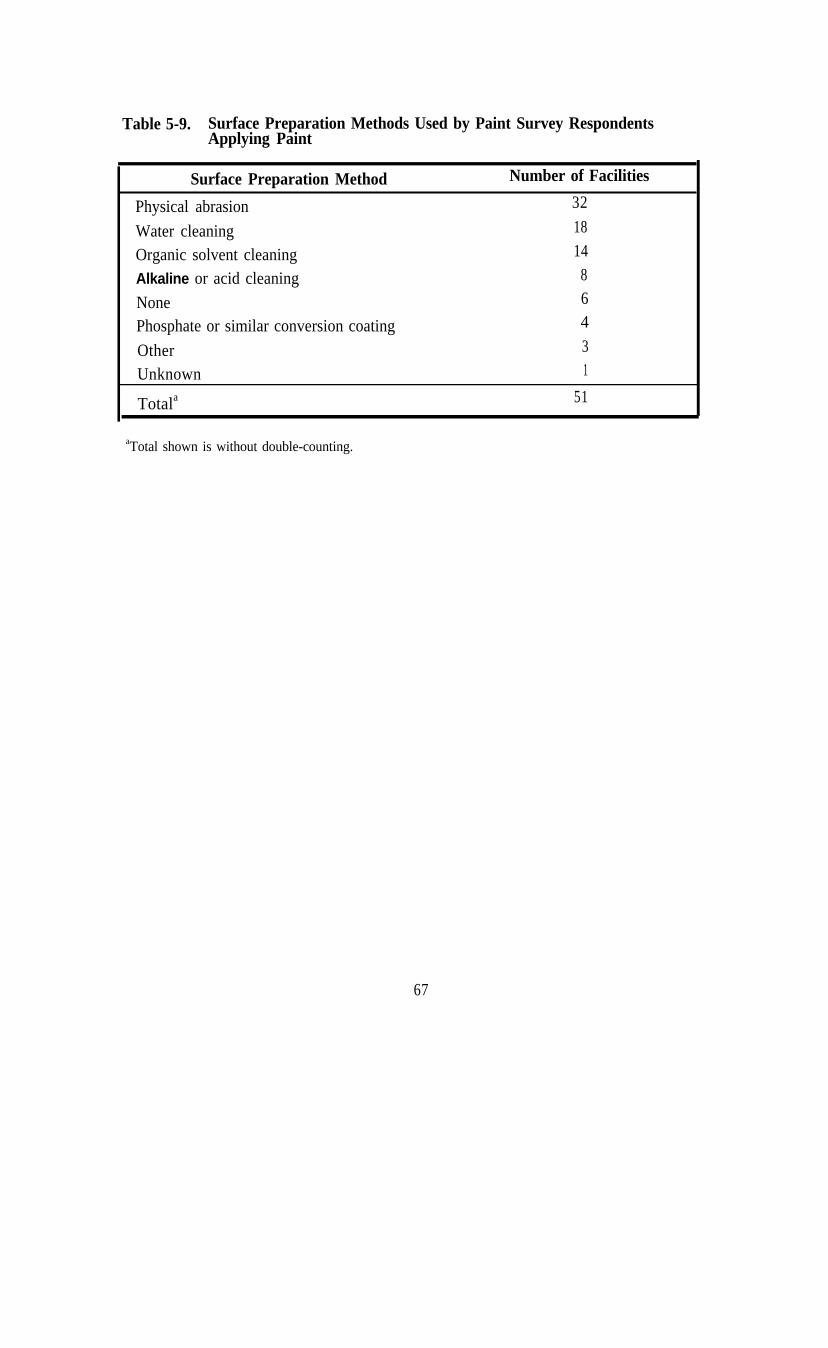
Table 5-9. Surface Preparation Methods Used by Paint Survey RespondentsApplying Paint
Surface Preparation Method
Physical abrasion
Water cleaningOrganic solvent cleaningAlkaline or acid cleaning
NonePhosphate or similar conversion coating
OtherUnknown
Totala
Number of Facilities
32
1814
864
31
51
aTotal shown is without double-counting.
67
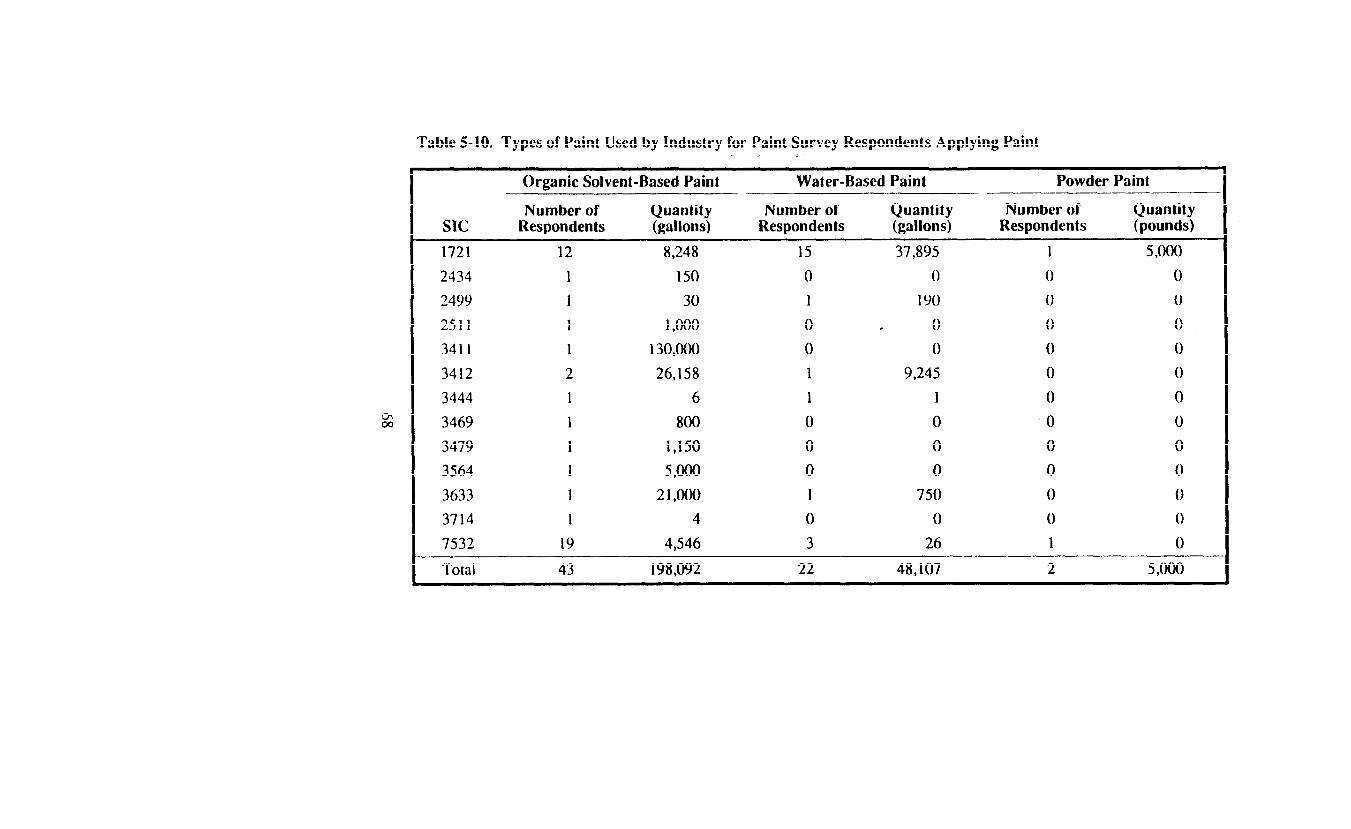
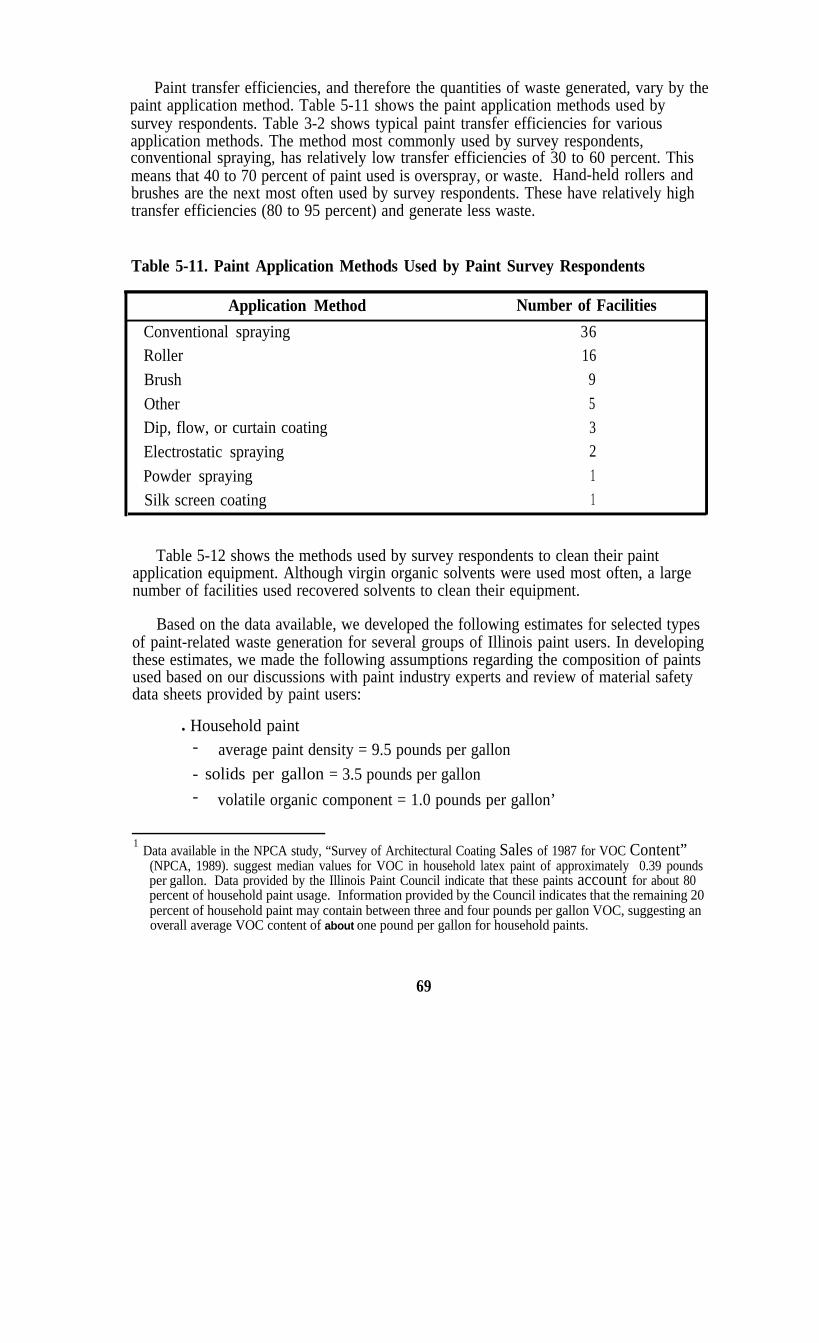
Paint transfer efficiencies, and therefore the quantities of waste generated, vary by thepaint application method. Table 5-11 shows the paint application methods used bysurvey respondents. Table 3-2 shows typical paint transfer efficiencies for variousapplication methods. The method most commonly used by survey respondents,conventional spraying, has relatively low transfer efficiencies of 30 to 60 percent. Thismeans that 40 to 70 percent of paint used is overspray, or waste. Hand-held rollers andbrushes are the next most often used by survey respondents. These have relatively hightransfer efficiencies (80 to 95 percent) and generate less waste.
Table 5-11. Paint Application Methods Used by Paint Survey Respondents
Application Method
Conventional sprayingRoller
Brush
OtherDip, flow, or curtain coating
Electrostatic spraying
Powder sprayingSilk screen coating
Number of Facilities
36169
532
11
Table 5-12 shows the methods used by survey respondents to clean their paintapplication equipment. Although virgin organic solvents were used most often, a largenumber of facilities used recovered solvents to clean their equipment.
Based on the data available, we developed the following estimates for selected typesof paint-related waste generation for several groups of Illinois paint users. In developingthese estimates, we made the following assumptions regarding the composition of paintsused based on our discussions with paint industry experts and review of material safetydata sheets provided by paint users:
l Household paint- average paint density = 9.5 pounds per gallon
- solids per gallon = 3.5 pounds per gallon- volatile organic component = 1.0 pounds per gallon’
1 Data available in the NPCA study, “Survey of Architectural Coating Sales of 1987 for VOC Content”(NPCA, 1989). suggest median values for VOC in household latex paint of approximately 0.39 poundsper gallon. Data provided by the Illinois Paint Council indicate that these paints account for about 80percent of household paint usage. Information provided by the Council indicates that the remaining 20percent of household paint may contain between three and four pounds per gallon VOC, suggesting anoverall average VOC content of about one pound per gallon for household paints.
69
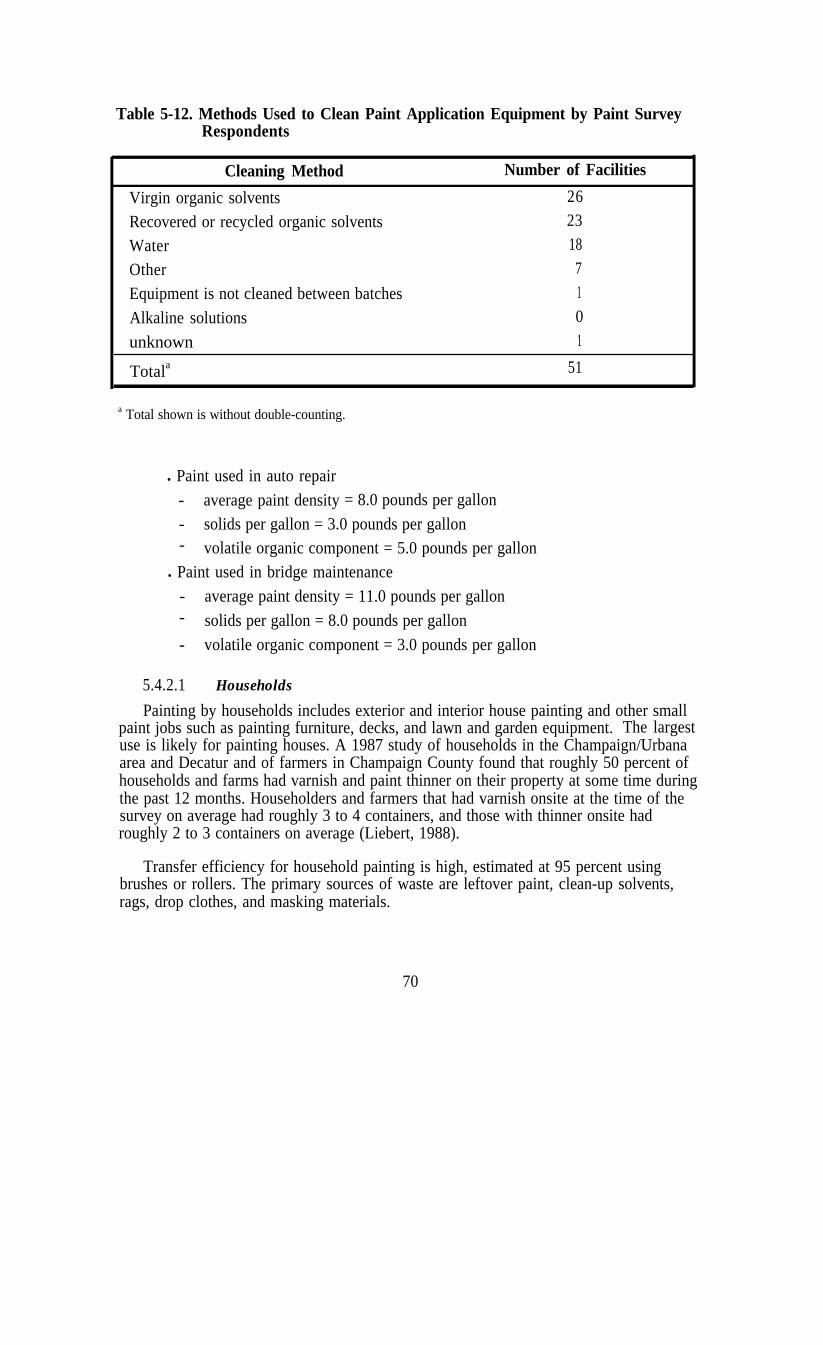
Table 5-12. Methods Used to Clean Paint Application Equipment by Paint SurveyRespondents
Cleaning Method Number of Facilities
Virgin organic solvents 26
Recovered or recycled organic solvents 23
Water 18
Other 7
Equipment is not cleaned between batches 1
Alkaline solutions 0
unknown 1
Totala 51
a Total shown is without double-counting.
l Paint used in auto repair
- average paint density = 8.0 pounds per gallon
- solids per gallon = 3.0 pounds per gallon- volatile organic component = 5.0 pounds per gallon
l Paint used in bridge maintenance
- average paint density = 11.0 pounds per gallon- solids per gallon = 8.0 pounds per gallon
- volatile organic component = 3.0 pounds per gallon
5.4.2.1 Households
Painting by households includes exterior and interior house painting and other smallpaint jobs such as painting furniture, decks, and lawn and garden equipment. The largestuse is likely for painting houses. A 1987 study of households in the Champaign/Urbanaarea and Decatur and of farmers in Champaign County found that roughly 50 percent ofhouseholds and farms had varnish and paint thinner on their property at some time duringthe past 12 months. Householders and farmers that had varnish onsite at the time of thesurvey on average had roughly 3 to 4 containers, and those with thinner onsite hadroughly 2 to 3 containers on average (Liebert, 1988).
Transfer efficiency for household painting is high, estimated at 95 percent usingbrushes or rollers. The primary sources of waste are leftover paint, clean-up solvents,rags, drop clothes, and masking materials.
70

Data from a California study (Rathje et al., 1985) indicate that each householddiscards about 1.5 pounds of paint waste in municipal trash per year. Using this figurefor Illinois households, we estimate that 3,150 tons per year of household paint waste isdiscarded in Illinois.
VOCs released from household paint during curing are estimated to be 1.0 RoundsVOC per gallon of paint. Applying this value for the estimated 12.7 million gallons peryear of paint used by households gives an estimated VOC release of 12.7 million poundsper year.
Estimating organic solvent waste and other wastes generated by clean-up inhousehold painting is more difficult. The amount of solvent used may be relatively thesame regardless of the amount of paint that is applied. That is, clean-up of brushes afterpainting a garage door may not differ from clean-up after painting an entire house.Similarly, estimating the amount of solid wastes contaminated with paint is also difficult.
5 4 . 2 2 Auto Body Shops
Data on waste generation for auto body repair shops are available from a study bySCS Engineers (SCS, 1987), from an auto body shop site visit, and from data gatheredfrom telephone contact with two additional body shops located in Illinois. The primarysources of paint-related waste in auto body shops are leftover paints, VOCs from paintcuring, paint overspray, and equipment clean-up. With typical overspray collectionmechanisms (dry filters) used in auto body shops, overspray is sent to a municipal orspecial waste landfill for disposal in the form of dry paint on filters.
Wastes generated can be estimated as follows. First, the transfer efficiency ofpainting operations is assumed to be 60 percent. VOC content is assumed to be 5.0pounds per gallon. The previously estimated annual use of paint is l,500,000 gallons.Applying the transfer efficiency to this value results in an estimate of 600,000 gallons or900 tons per year of waste from overspray. VOCs emitted from paint curing areestimated at 3,750 tons per year.
We estimated the amount of organic solvent waste generated in cleaning operationsbased on the data from the SCS study, the site visit, and the two other auto body shopscontacted. The average quantity of organic solvent used per car serviced was 0.58gallons.
Information provided by the Illinois Automotive Service Association indicates thatthe average Illinois body shop services 480 cars per year, and that there are approximately3,400 licensed auto body shops in Illinois. Using these data, we estimate that948,000 gallons of mixed solvent and paint waste are generated per year. Assuming85 percent of this volume is reclaimed, there remain 142,000 gallons, or 710 tons of paintsludge per year.
5.4.2.3 Illinois Department of Transportation
The Illinois Department of Transportation (IDOT) provided some data on paint-related waste generation during bridge maintenance and rehabilitation. Based on data
71
provided by IDOT, we estimate that 73,000 gallons of paint are used per year for thepurpose of bridge maintenance and rehabilitation. Transfer efficiencies will varydepending on the operating conditions, the operator skills, and the type of equipmentused. Assuming a transfer efficiency of 60 percent, the resultant paint waste is 29,200gallons or 117 tons per year of overspray waste. Because the painting occurs underuncontrolled conditions, the ultimate fate of the overspray is the immediate environmentof the bridge. VOC emissions from IDOT bridge maintenance and rehabilitation areestimated at 110 tons per year based on 3.0 pounds of VOC per gallon. Data were notavailable to estimate equipment clean-up wastes from bridge maintenance.
IDOT uses two types of paint for traffic markings (Grey, 1991). Polyolefin, anorganic solvent-borne paint, is used for road markings. For fiscal year 1991, IDOTpurchased 700,000 gallons of polyolefin paints. IDOT projects that the use of this paintduring the fiscal year will generate 5,000 gallons of hazardous waste and 1,000 gallons ofwastewater. The hazardous waste is generated from cleaning the striping machines at theend of a work period (usually a day) and is a mixture of xylene (an organic solvent usedto clean the equipment) and paint. The hazardous waste is shipped offsite formanagement and burned in a closed containment furnace. The wastewater generatedfrom using polyolefin paints is generated from hydroblasting the paint storage tanks toclean them at the end of the striping season each year. This waste is also managed offsite.
IDOT also uses a water-borne paint for traffic markings. The waterborne paint isused for specialty sign paintings. For fiscal year 1991, IDOT purchased 50,000 gallons ofwater-borne paint. IDOT estimates this paint will generate 500 gallons of waste paintmixed with water from equipment cleaning (Grey, 1991).
5.4.3 Waste Reduction by Illinois Industries Applying Paint
Of the 51 paint users responding to the Paint Survey, only 24 consideredimplementing waste reduction for their paint application operations. Of those facilitiesconsidering waste reduction, almost all (21 facilities) actually changed their paintapplication operations to reduce waste generation. The most common waste reductionactivities implemented were changes in the type of paint used and in equipment cleaningprocedures, although a large number of facilities (15 facilities) indicated changing thetechniques used to apply paint. The most commonly cited change in applicationtechniques was a switch from conventional to high-volume low-pressure (HVLP) sprayguns. Table 5-13 shows the number of respondents considering and implementing wastereduction by industry.
Table 5-14 shows the reasons respondents changed their paint application operationsto reduce waste generation. The reasons most commonly cited were to comply withenvironmental regulations and to reduce potential liability.
Table 5-15 shows the barriers to waste reduction for paint application operationsexperienced by facilities that implemented and those that did not implement wastereduction. The barriers experienced by the two groups of respondents differed. Mostcommonly cited barriers for facilities that implemented waste reduction included thefollowing:
72
l waste reduction technology not available,
l changes to reduce waste would affect product quality,l customer specifications, and
l alternative materials not available.
Barriers cited most often by facilities that did not implement waste reduction are a lack oftechnical information and the high cost of implementing waste reduction.
IDOT has developed a waste reduction program for its traffic markings (Grey, 1991).IDOT recently switched from chlorinated rubber paints to polyolefin paints, in part toreduce waste generated, although data are not yet available as to how much waste wasreduced due to the change. Also, IDOT has a policy to change all paint storage tanks tostainless steel tanks over time. Because less paint sticks to the stainless steel, the amountof waste generated from cleaning the tanks will be reduced. Finally, changes in painthandling and operating procedures have been implemented to reduce waste generation.DOT has set a goal to reduce the generation of hazardous waste to 2,000 gallons peryear.
For wastes that cannot be eliminated, the state of Illinois prefers environmentallysound recycling rather than treating and disposing of wastes. Table 5-16 shows thenumber of Paint Survey respondents that recycled their paint-related wastes.
73

Table 5-13. Waste Reduction in Paint Application by Industry as Reported by Paint Survey Respondents
Number of I
SIC
Total RespondentsNumber of Considering Number of Respondents Implementing Waste Reduction
Respondents Paint Surface Equipmentin Industry Reduction Paint Used Application Preparation Cleaning Total
1721 17 7 7 5 2 7 7
2434 1 0 0 0 0 0 0
2499 1 0 0 0 0 0 0
2511 1 0 0 0 0 0 0
3411 1 1 0 0 0 0 0
3412 2 2 2 0 0 2 2
3444 1 0 0 0 0 0 0
3469 1 0 0 0 0 0 0
3479 1 0 0 0 0 0 0
3564 1 0 0 0 0 0 0
3633 1 1 1 0 0 1 1
3714 1 0 0 0 0 0 0
7532 22 13 10 10 3 11 11
T o t a l 51 24 20 15 5 21 21 I

Table 5-14. Reasons for Waste Reduction in Paint Application as Reported by Paint Survey Respondents
Number ofRespondentsConsidering
WasteReduction
Number of Respondents Implementing Waste Reduction
Paint Paint Surface EquipmentUsed Application Preparation Cleaning Total
Comply with environmental 20 16 12 4 17 17regulations
comply with OSHA 13 10 10 3 11 11regulations
Reduce waste management 16 13 11 5 14 14costs
Reduce costs other than 12 10 8 1 10 10waste management
Improve process efficiency 15 13 11 4 14 14Meet customer demands 4 4 4 0 4 4
Meet community demands 5 4 4 2 4 4Reduce potential liability 17 14 11 4 15 15
Improve and protect the 14 13 12 5 14 14environment
Other 2 2 2 1 2 2
I Totala 24 20 15 5 21 21 I
aTotals shown are without double-counting.

Table 5-15, Barriers to Reducing Waste Generation from Paint Application forPaint Survey Respondents
Number of Respondents
Implementing Waste Not Implementing WasteBarrier Reduction Reduction
Technology not available 9 6Would affect product 9 4Customer specifications 9 3Lack of technical 6 12
informationHigh Cost 8 10Uncertainty/risk 3 3Alternative materials not 9 6
availableOther 1 3
Total, barriersa 19 22
No barriers 1 6unknown 1 2
aTotals shown are without double-counting.
Table 5-16. Number of Paint Survey Respondents Recycling Their PaintApplication Waste
Type of Recycling Number of Respondents
Organic solvent recycling 22
Fuel blending 4
Metals recycling 2
Total, facilities recyclinga 25
a Total shown is without double-counting.
76
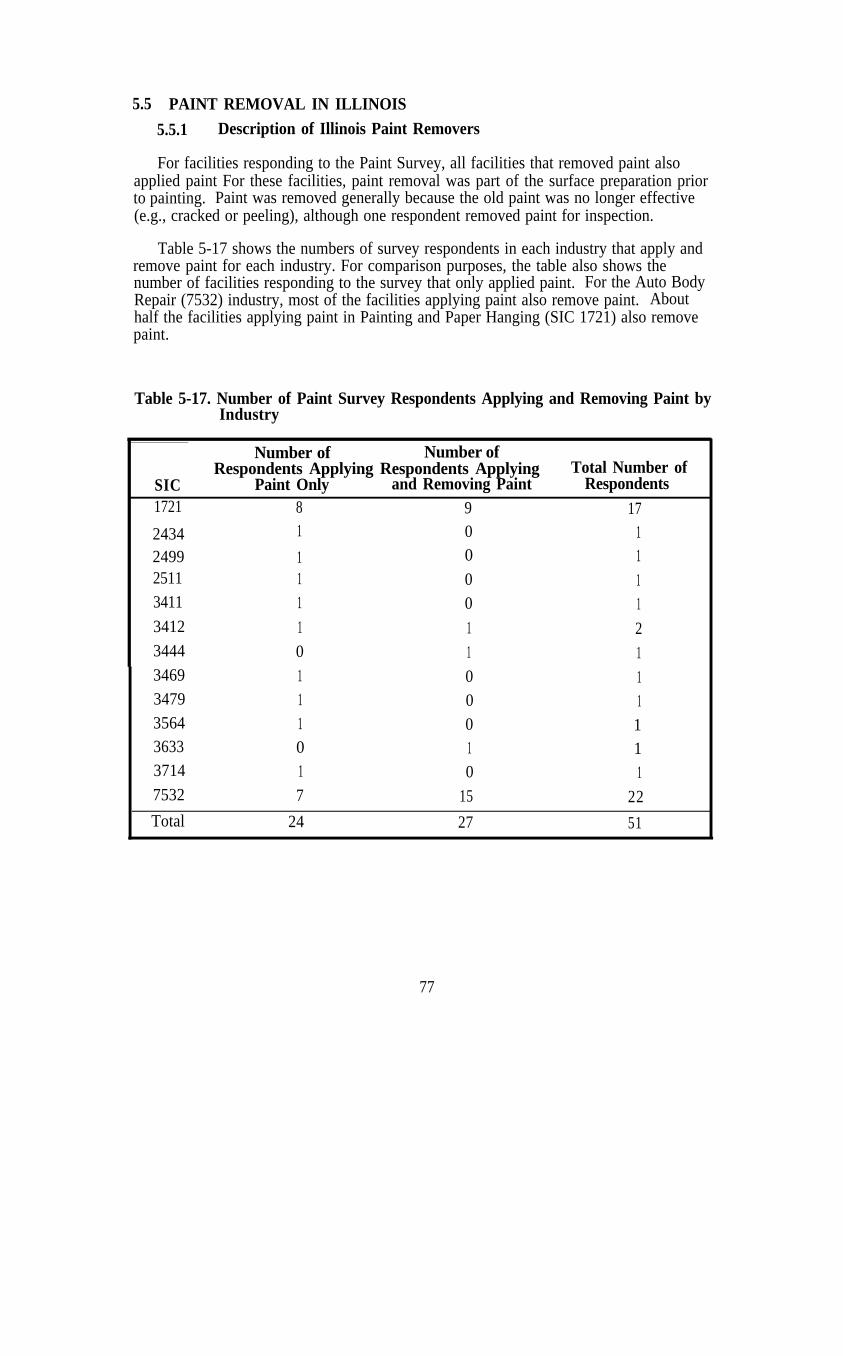
5.5 PAINT REMOVAL IN ILLINOIS
5.5.1 Description of Illinois Paint Removers
For facilities responding to the Paint Survey, all facilities that removed paint alsoapplied paint For these facilities, paint removal was part of the surface preparation priorto painting. Paint was removed generally because the old paint was no longer effective(e.g., cracked or peeling), although one respondent removed paint for inspection.
Table 5-17 shows the numbers of survey respondents in each industry that apply andremove paint for each industry. For comparison purposes, the table also shows thenumber of facilities responding to the survey that only applied paint. For the Auto BodyRepair (7532) industry, most of the facilities applying paint also remove paint. Abouthalf the facilities applying paint in Painting and Paper Hanging (SIC 1721) also removepaint.
Table 5-17. Number of Paint Survey Respondents Applying and Removing Paint byIndustry
Number of Number ofRespondents Applying Respondents Applying Total Number of
SIC Paint Only and Removing Paint Respondents1721 8 9 17
0 12434 1
2499 1 0 12511 1 0 13411 1 0 13412 1 1 23444 0 1 13469 1 0 13479 1 0 13564 1 0 13633 0 1 13714 1 0 17532 7 15 22
Total 24 27 51
77
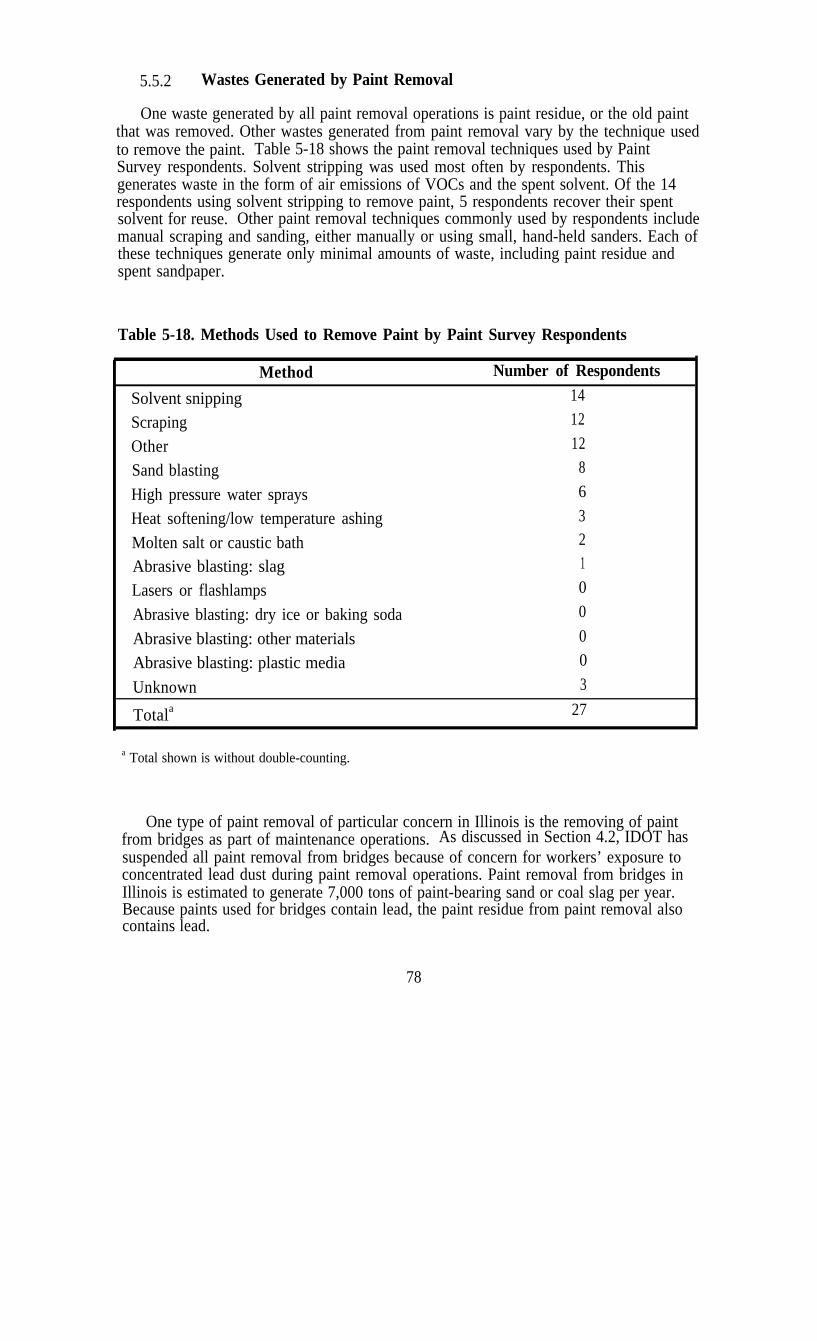
5.5.2 Wastes Generated by Paint Removal
One waste generated by all paint removal operations is paint residue, or the old paintthat was removed. Other wastes generated from paint removal vary by the technique usedto remove the paint. Table 5-18 shows the paint removal techniques used by PaintSurvey respondents. Solvent stripping was used most often by respondents. Thisgenerates waste in the form of air emissions of VOCs and the spent solvent. Of the 14respondents using solvent stripping to remove paint, 5 respondents recover their spentsolvent for reuse. Other paint removal techniques commonly used by respondents includemanual scraping and sanding, either manually or using small, hand-held sanders. Each ofthese techniques generate only minimal amounts of waste, including paint residue andspent sandpaper.
Table 5-18. Methods Used to Remove Paint by Paint Survey Respondents
Method
Solvent snippingScrapingOtherSand blasting
High pressure water spraysHeat softening/low temperature ashing
Molten salt or caustic bathAbrasive blasting: slagLasers or flashlamps
Abrasive blasting: dry ice or baking soda
Abrasive blasting: other materialsAbrasive blasting: plastic media
Unknown
Totala
a Total shown is without double-counting.
Number of Respondents1412
128
6
321
0
0
00
3
27
One type of paint removal of particular concern in Illinois is the removing of paintfrom bridges as part of maintenance operations. As discussed in Section 4.2, IDOT hassuspended all paint removal from bridges because of concern for workers’ exposure toconcentrated lead dust during paint removal operations. Paint removal from bridges inIllinois is estimated to generate 7,000 tons of paint-bearing sand or coal slag per year.Because paints used for bridges contain lead, the paint residue from paint removal alsocontains lead.
78

5.5.3 Waste Reduction for Paint Removal Operations in Illinois
Of the 27 facilities that responded to the Paint Survey and removed paint, only eightfacilities considered reducing their waste generation from paint removal and only fourfacilities actually changed their paint removal activities to reduce waste generation.Table 5- 19 shows the number of facilities considering and implementing waste reductionfor their paint removal operations by industry. Roughly one-third of respondents in thePainting and Paper Hanging (1721) and Auto Body Repair (7532) industries consideredreducing their paint removal wastes, and only one auto body shop and two Painting andPaper Hanging firms actually implemented waste reduction. In addition, onemanufacturer of household laundry equipment reduced its wastes from paint removal.
Table 5-19. Waste Reduction in Paint Removal by Industry for Paint SurveyRespondents
SIC
Total Numberof RespondentsRemoving Paint
Number of Number ofRespondents Respondents
Considering Waste Implementing WasteReductiona Reductiona
1721 93412 1
3444 13633 17532 15
3 2
0 0
0 0
1 1
4 1
Total 27 8 4
a Includes waste reduction for paint removal operations only.
Table 5-20 shows the reasons why facilities considered and implemented wastereduction for their paint removal operations. Reasons most commonly cited byrespondents include complying with environmental regulations and reducing wastemanagement costs.
Twenty-two of the twenty-seven survey respondents removing paint indicated thatthere are barriers to reducing waste generation from paint removal. The most commonlycited barrier was a lack of technical information. Other common barriers include theunavailability and expense of waste reduction techniques. Table 5-21 shows the barriersto reducing waste generation as reported by the responding Paint Survey facilities.Table 5-21 further breaks down the data on barriers by number of facilities thatimplemented waste reduction and those who did not.
79
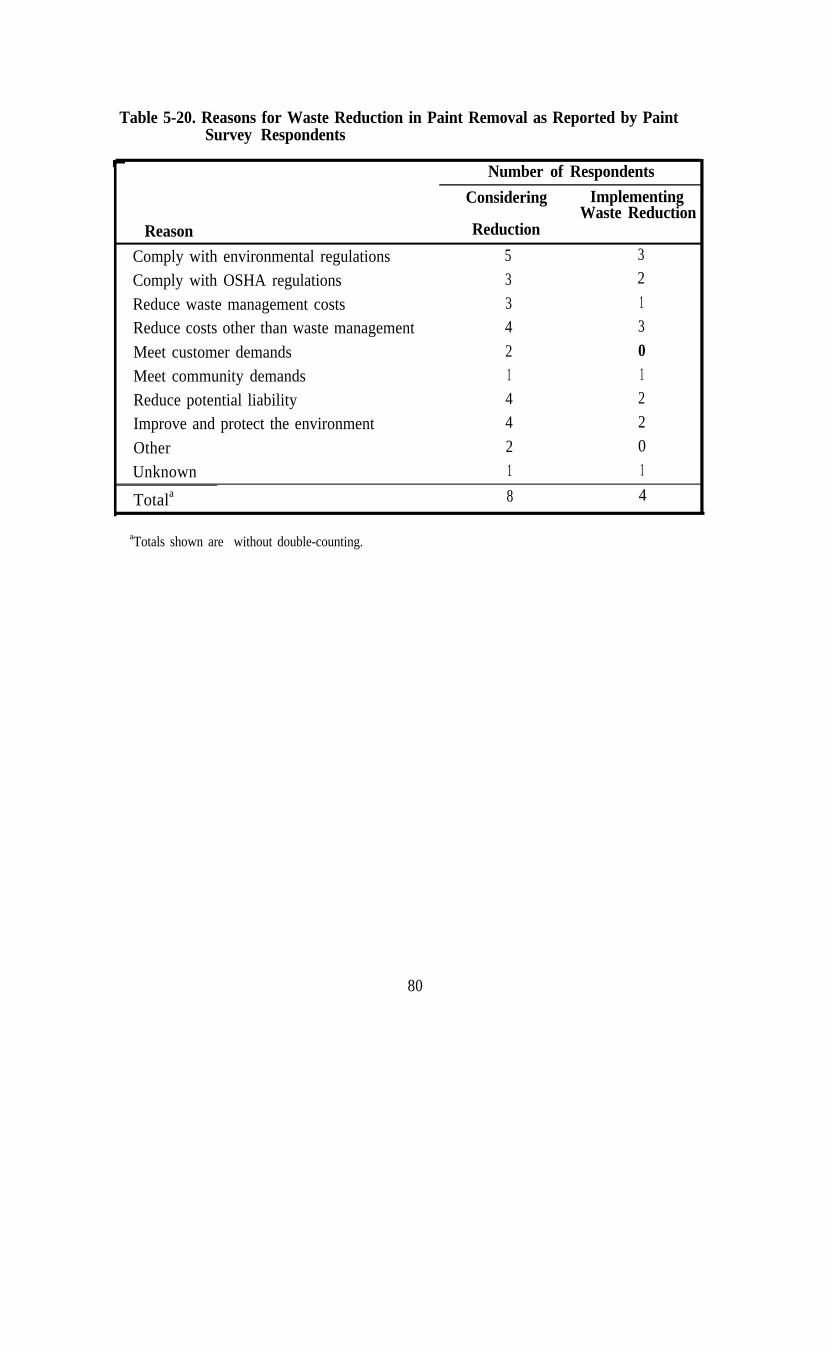
Table 5-20. Reasons for Waste Reduction in Paint Removal as Reported by PaintSurvey Respondents
Reason
Comply with environmental regulationsComply with OSHA regulationsReduce waste management costsReduce costs other than waste management
Meet customer demandsMeet community demandsReduce potential liabilityImprove and protect the environment
OtherUnknown
Number of Respondents
Considering ImplementingWaste Reduction
Reduction
5 3
3 2
3 1
4 3
2 01 1
4 2
4 2
2 0
1 1
Totala 8 4
aTotals shown are without double-counting.
80
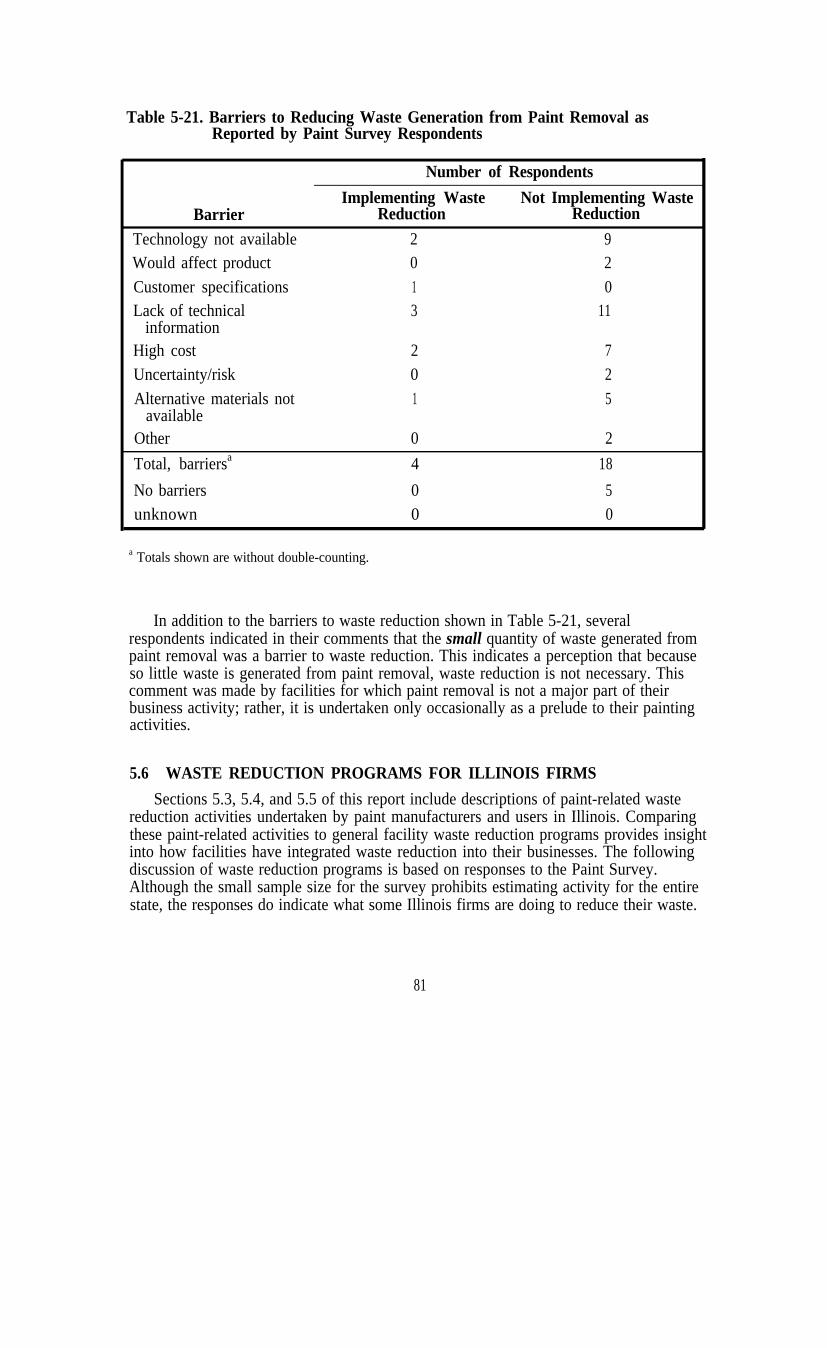
Table 5-21. Barriers to Reducing Waste Generation from Paint Removal asReported by Paint Survey Respondents
Number of Respondents
Implementing Waste Not Implementing WasteBarrier Reduction Reduction
Technology not available 2 9Would affect product 0 2
Customer specifications 1 0Lack of technical 3 11
informationHigh cost 2 7Uncertainty/risk 0 2
Alternative materials not 1 5available
Other 0 2
Total, barriersa 4 18
No barriers 0 5unknown 0 0
a Totals shown are without double-counting.
In addition to the barriers to waste reduction shown in Table 5-21, severalrespondents indicated in their comments that the small quantity of waste generated frompaint removal was a barrier to waste reduction. This indicates a perception that becauseso little waste is generated from paint removal, waste reduction is not necessary. Thiscomment was made by facilities for which paint removal is not a major part of theirbusiness activity; rather, it is undertaken only occasionally as a prelude to their paintingactivities.
5.6 WASTE REDUCTION PROGRAMS FOR ILLINOIS FIRMS
Sections 5.3, 5.4, and 5.5 of this report include descriptions of paint-related wastereduction activities undertaken by paint manufacturers and users in Illinois. Comparingthese paint-related activities to general facility waste reduction programs provides insightinto how facilities have integrated waste reduction into their businesses. The followingdiscussion of waste reduction programs is based on responses to the Paint Survey.Although the small sample size for the survey prohibits estimating activity for the entirestate, the responses do indicate what some Illinois firms are doing to reduce their waste.
81

Table 5-22 shows the numbers of facilities considering waste reduction and those thathave in place a waste reduction program. For the purposes of the Paint Survey, a facilityis considered to have a waste reduction program if it has at least one of the followingprogram elements:
l employee training/awareness program,
l employee incentives program to reward employees for reducing wastegeneration,
l written waste reduction policy,
l cost accounting program that charges the costs of waste management to theproduction activity that generated the waste,
l quantitative waste reduction goals, or
. waste audits that identify quantities and sources of waste generation.
Table 5-22. Number of Facilities Considering Waste Reduction by Reason asReported by Paint Survey Respondents
Number of RespondentsConsidering Waste
Number of Respondentswith a Waste Reduction
Reduction Programa
Reason Manufacture Use Manufacture Use
Comply with environmental 3 23 3 1 9regulations
Comply with OSHA 1 17 1 14regulations
Reduce costs waste 5 21 5 19management
Reduce costs other than 1 14 1 12waste management
Meet customer demands 1 2 1 2
Meet community demands 0 8 0 7
Reduce potential liability 5 20 5 17
Improve and protect the 5 22 5 17environment
Other 0 4 0 2
Totalb 6 30 6 29
a Of facilities considering waste reduction, the number of facilities that had at least One of the programelements defined in Table 5-23.
b Totals shown are without doublecounting.
82

All of the paint manufacturers responding to the Paint Survey have a waste reductionprogram at their facilities. However, Section 5.3.3 showed that only half of the paintmanufacturers responding to the survey (3 facilities) actually implemented wastereduction for their paint manufacturing activities. Of the 51 paint users responding to thesurvey, only 30 facilities considered waste reduction and 29 have a facility wastereduction program. As discussed in Sections 5.4.3 and 5.5.3 above, only 21 facilitiesimplemented waste reduction for their paint application operations and 4 facilitiesimplemented waste reduction for their paint removal operations.
Table 5-23 describes the program elements for respondents that have waste reductionprograms. For paint manufacturers, the most common program elements are employeetraining/awareness and conducting waste audits. Most of the waste reduction programsfor paint users also included employee training/awareness. The second most commonwaste reduction program element for paint users is quantitative waste reduction goals,although less than 40 percent of respondents with waste reduction programs had thesegoals.
Table 5-23. Number of Facilities with Waste Reduction Programs as Reported byPaint Survey Respondents
Number of Number ofProgram Element Manufacturers Users
Employee training/awareness 4 23Employee incentives 1 0Written waste reduction policy 1 4
Cost accounting 0 8Quantitative waste reduction goals 2 11
Waste audits 3 5Other 0 1
5 29
a Totals shown are without double-counting.
Paint Survey respondents also provided information on their sources of informationabout waste reduction. The most commonly used sources for both paint manufacturersand users are trade journals and vendors. This result is consistent for facilities with andwithout waste reduction programs. Nine paint users responding to the survey indicatedthat no sources of information on waste reduction were used. Four of these facilities havewaste reduction programs. Table 5-24 shows these results.
83

Table 5-24. Sources of Information about Waste Reduction as Reported by PaintSurvey Respondents
Total Numberof Respondents Number of Respondents with a
Using Source Waste Reduction Programa
Information Source Manufacture Use Manufacture UseTrade journals 5 34 5 22Other periodicals 1 8 1 7Industry associations 3 15 3 14Local government 0 1 0 1State government 0 5 0 4Federal government 0 1 0 1Vendors 4 28 4 20Customers 0 3 0 2Employees 2 10 2 9Other 1 1 1 0
Total, facilities usinginformation sourceb
No information sourcesused
Unknown
6 40 6 25
0 9 0 4
1 2 1 0
a Out of the facilities using the information source indicated, the number that had any of the wastereduction program elements listed in Table 5-23.
b Totals shown are without doublc-counting.
To assist HWRIC in developing a waste reduction education program, the PaintSurvey asked respondents what types of additional information on waste reduction wouldbe useful. As Table 5-25 shows, both paint manufacturers and users indicated a need fortechnical information on technologies to reduce waste generation and on alternativeproducts and raw materials. One paint manufacturer and eleven paint users respondedthat they do not need any additional information on waste reduction. Of the eleven paintusers indicating that they do not need any information, only three facilities have a wastereduction program.
84
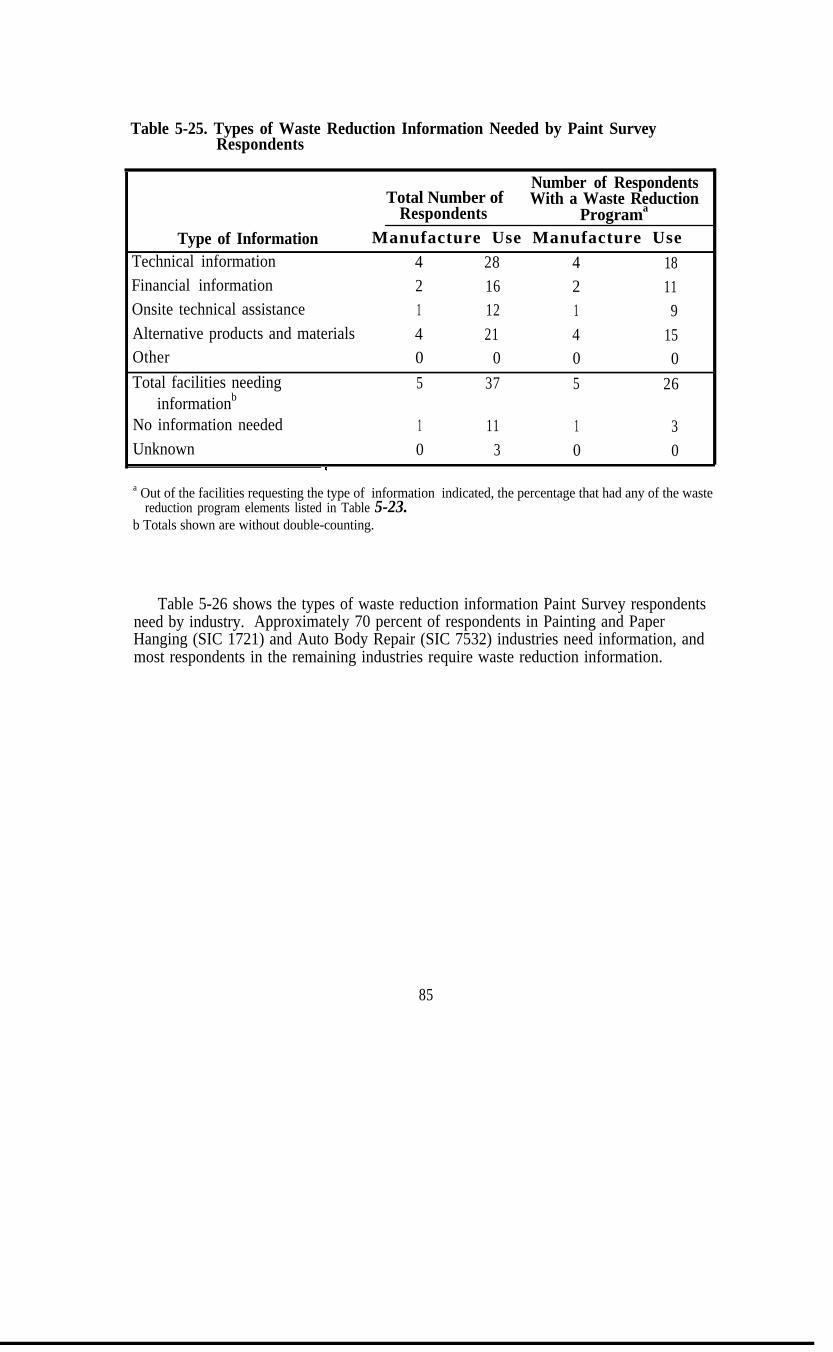
Table 5-25. Types of Waste Reduction Information Needed by Paint SurveyRespondents
Number of RespondentsTotal Number of With a Waste Reduction
Respondents Programa
Type of Information Manufacture Use Manufacture UseTechnical information 4 28 4 18Financial information 2 16 2 11Onsite technical assistance 1 12 1 9Alternative products and materials 4 21 4 15Other 0 0 0 0Total facilities needing 5 37 5 26
informationb
No information needed 1 11 1 3Unknown 0 3 0 0
a Out of the facilities requesting the type of information indicated, the percentage that had any of the wastereduction program elements listed in Table 5-23.
b Totals shown are without double-counting.
Table 5-26 shows the types of waste reduction information Paint Survey respondentsneed by industry. Approximately 70 percent of respondents in Painting and PaperHanging (SIC 1721) and Auto Body Repair (SIC 7532) industries need information, andmost respondents in the remaining industries require waste reduction information.
85
Table 5-26. Types of Waste Reduction Information Needed by Industry for PaintSurvey Respondents
CHAPTER 6WASTE MANAGEMENT, DISPOSAL, AND REDUCTION OPTIONS
FOR ILLINOIS
6.1 INTRODUCTION
After reviewing the waste reduction methods available for paint-related wastes andthe existing paint waste generation and reduction activities in Illinois, HWRIC identifiedoptions for managing, disposing of, and reducing paint-related wastes in Illinois. Thischapter discusses those options. As directed by the Illinois General Assembly (PublicAct 86-1026), this discussion focuses on options for small businesses and households thatuse paint, although a brief discussion of options for large businesses is included forcomparison.
6.2 LARGE BUSINESSES
The disposal options for paint-related waste are growing. Through the literaturesearch, we identified several companies who handle Illinois paint wastes, includingChemical Waste Management, Safety-Kleen, Ashland Chemicals, Avganic, andEnvironmental Purifcation Industries (EPI). EPI is a new firm that specializes inrecycling waste paint sludges into useable raw material. In addition, one Illinoismanufacturing facility we visited has developed a method for using paint solids reclaimedfrom aqueous sludge in making low-grade paint. Listed below are some of the currentoptions for disposing of paint-related wastes, in roughly preferential order.
l Process aqueous paint sludges to produce salable material for undercoating orlow-grade paint.
l Recycle waste organic solvent for use in cleaning operations.
l Recycle organic solvent sludges for raw material.
l Sell excess or over-age raw materials to aftermarket jobbers who advertise in apaint and coatings journal or through a waste exchange.
l Reuse organic solvent sludges for energy recovery either onsite or offsite.
l Dispose by incineration at sites licensed to receive special waste.
l Landfill solid special wastes at sites licensed to receive special waste.
6.3 SMALL BUSINESSES
Paint waste generated from small businesses can be managed using the sametechniques as large businesses (see Section 6.2). However, some states are concernedthat SQGs and CEGs are not properly managing their waste because disposal options are
87
unavailable, costly, or complicated. These states have initiated pilot programs designedto simplify and reduce the cost of hazardous waste management.
Minnesota established a pilot CEG hazardous waste collection program inconjunction with local household hazardous waste collections. Although federal RCRAregulations allow participation in such a program, Minnesota law prohibits CEGs fromtransporting their hazardous waste without a license. Special waivers from thisrequirement were issued for the pilot project. A 55-gallon maximum per participant wasestablished because of transportation safety concerns and, in part, because Minnesotabelieved larger generators could and should arrange for private disposal. Participantsfunded all project and disposal costs. Twelve CEGs participated in the project, five ofwhom brought paint for disposal. Of the 292 gallons of bulked liquid collected, 66.5gallons were paint. Paint dust from a spray booth accounted for 80 pounds of the 414pounds of lab-packed or solid waste collected. One participant commenting on theproject said it is generally difficult to “get a hazardous waste firm to be interested in verysmall quantities and usually the price is exorbitant” (Brooks and Eggleston, 1990).
In Washington, Chemical Processors, Inc. (Chempro), a hazardous waste managementfirm, conducted a three-month pilot project to collect CEG hazardous waste. QualifyingCEGs can drop off their hazardous waste on designated days once a month formanagement. To ensure that quantities are below RCRA regulatory thresholds Chemprowill not accept over 220 pounds of RCRA hazardous waste or over 2.2 pounds of RCRAacutely hazardous wastes from a participant in a single month. Chempro advertises thatthe pilot program is designed to offer CEGs a “less complicated and speedier method todispose of hazardous waste in compliance with state and federal regulations” (ChemicalProcessors, Inc., 1989).
Anchorage, Alaska, has also established a CEG collection program, designed tocollect and store hazardous waste from households and CEGs. Paint waste has been amajor component of the wastes collected from both households and CEGs. The cityestablished the collection program to help keep hazardous waste out of the wastewatertreatment plant and the new solid waste landfill. A study of Anchorage’s CEGs foundthat about 20 percent of hazardous waste generated by CEGs was disposed of in the sewersystem and 37 percent in the solid waste landfill Disposal of hazardous wastes in thesolid waste landfill or sewer system is illegal is Anchorage (Meade, 1990).
Participation has been lower than expected in the Anchorage collection program. Thecity found that although the collection program can decrease CEGs’ waste hauling costsby up to 50 percent from private hazardous waste transport, many of the CEGs are stillillegally dumping in the solid waste landfill To increase participation, the city plans tolower collection charges and increase inspections at the landfill to discourage illegaldumping (Meade, 1990).
6.3.1 Painting Contractors
The Paint Survey results suggest that one major obstacle to waste reduction by smallcompanies is a perception that little or no waste of any consequence is generated. This
88
perception was especially common among painting contractors. One survey respondentanswered that the barrier to waste reduction for his firm was that he was “not sure there isany need to change.” A second respondent mentioned that his is a “small, part-timebusiness [and] waste is not a problem.”
An educational program that provides painting contractors with information on wastegeneration and proper disposal would be useful. The following comment from onepainting contractor responding to the Paint Survey illustrates this need:
I work in private homes and clean up my equipment as most home ownerswould do. Brushes and rollers are washed out in the sink and anything elseis thrown out in the garbage. If things like old paints or solvents are to betreated and disposed of separate from regular garbage then that informationneeds to be more available to us because I have never seen any regulations onit.
The McHenry County Illinois Department of Solid Waste Management (1991) hasproduced an informational brochure on household paint disposal, Paint Management andDisposal Guide. It is distributed to residents that call the County for information onmanaging their paint wastes and has been distributed to several local retailers to be usedby their customers. In addition to describing proper paint disposal procedures, thebrochure provides guidance on waste reduction and proper storage of leftover paints toincrease their shelf life (see Se&ion 6.4.3).
Although buying too much paint is a source of waste from households, the results ofthe Paint Survey indicate that this is not as much of a problem for painting contractors.Several respondents indicated that they had little leftover paint; presumably, contractorswould be more experienced than an individual homeowner at purchasing the right amountof paint. Any leftover paints are generally given to the homeowner to be used for touch-ups. Thus, leftover paints from painting contractors become household paint waste.
The Paint Survey results suggest that an effective means of contacting paintingcontractors would be through the paint retailers. Information brochures on proper wastemanagement and disposal practices could be distributed to painting contractors throughthe retailers, as is the case in McHenry County. One survey respondent suggested thatpaint retailers would be “great sites” for the collection of leftover paints, since hiscompany goes to the paint retailer almost every day to purchase supplies.
6.3.2 Auto Body Shops
The results of the Paint Survey indicate that several auto body shops in Illinois havemade significant changes in their operations to reduce waste generation. Most of the autobody shops that made changes in their operations to reduce waste generation made all ofthe following changes: switching from siphon-fed to HVLP spray guns, switching to lesstoxic paints, and changing their equipment cleaning procedures. In addition, many of theauto body shops reuse their organic solvents, send the solvents offsite for recovery, or userecovered solvents to clean their equipment.
89

Results from the Paint Survey suggest that the information and resources to reducewaste generation are available to Illinois auto body shops. Nonetheless, only 11 of the 22facilities responding to the Paint Survey implemented waste reduction for their paintapplication operations. The challenges of a state waste reduction program are then(1) how to contact the facilities that haven’t implemented waste reduction and (2) how toimpact those facilities so that they do implement waste reduction.
Eighteen of the 22 auto body shops responding to the Paint Survey accessed sourcesof information on waste reduction. The most commonly used sources of informationwere trade journals (used by 16 facilities) and vendors (used by 12 facilities). Of these,the source most readily available for a public education campaign is trade journals. Inaddition, several auto body shops indicated that their only source of information was fromother shops through word of mouth. Regional meetings is an option for these facilities,using direct mail or trade associations to publicize these events, although the ability ofsuch an event to attract body shops that don’t generally participate in trade associations orread trade journals is questionable.
The second issue to resolve is what types of information would be most effective atencouraging waste reduction by auto body shops. Fifteen of the 22 facilities respondingto the Paint Survey indicated a need for additional information on waste reduction (seeTable 5-26). These facilities were evenly divided on what types of information theyrequired; technical information, financial information, onsite technical assistance, andinformation on alternative materials were all requested. Information on technologies,finances, and alternative materials could be provided through trade journals. This sourcecould also be used to publicize the resources available from HWRIC and other stateagencies.
In addition to information on waste reduction, trade journals could be used tocommunicate information on regulatory issues, such as disposing of paint wastes inspecial waste landfills. Although Illinois law requires most of the wastes from auto bodyshops to be disposed of in special waste landfills, the survey responses suggest that somefacilities may not be complying with these regulations. Because information on wastemanagement and disposal was not known to most survey respondents, conclusiveinformation on this is not available.
Table 6-l shows the barriers to reducing paint-related wastes indicated by auto bodyshops responding to the Paint Survey. Both those auto body shops that have implementedwaste reduction and those that have not indicated that high cost was a barrier toimplementing waste reduction. Additional study is requited to identify the source of thehigh cost and policy options to make waste reduction techniques more accessible to autobody shops.
90
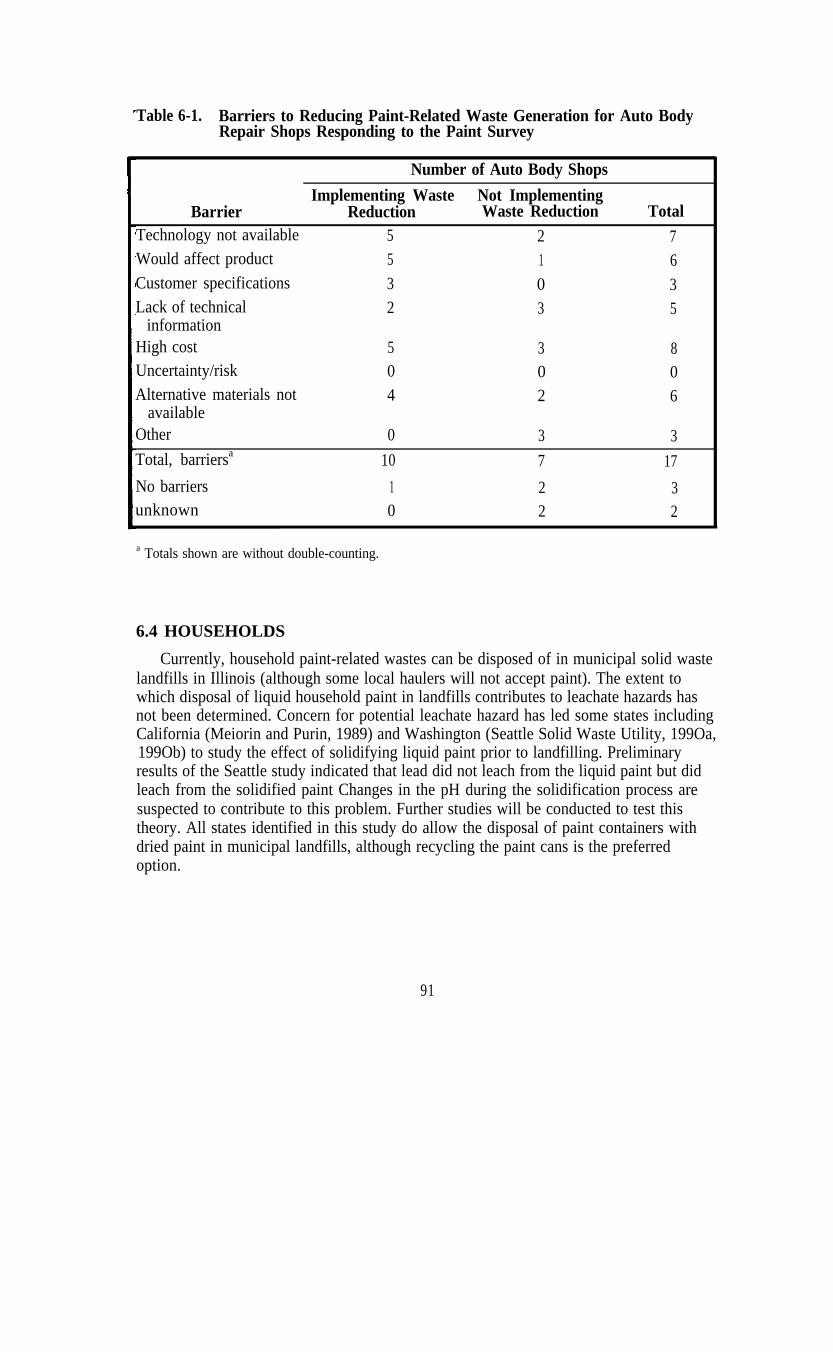
Table 6-1. Barriers to Reducing Paint-Related Waste Generation for Auto BodyRepair Shops Responding to the Paint Survey
Barrier
Number of Auto Body Shops
Implementing Waste Not ImplementingReduction Waste Reduction Total
Technology not available 5 2 7Would affect product 5 1 6Customer specifications 3 0 3Lack of technical 2 3 5
informationHigh cost 5 3 8Uncertainty/risk 0 0 0Alternative materials not 4 2 6
availableOther 0 3 3Total, barriersa 10 7 17
No barriers 1 2 3unknown 0 2 2
a Totals shown are without double-counting.
6.4 HOUSEHOLDS
Currently, household paint-related wastes can be disposed of in municipal solid wastelandfills in Illinois (although some local haulers will not accept paint). The extent towhich disposal of liquid household paint in landfills contributes to leachate hazards hasnot been determined. Concern for potential leachate hazard has led some states includingCalifornia (Meiorin and Purin, 1989) and Washington (Seattle Solid Waste Utility, 199Oa,199Ob) to study the effect of solidifying liquid paint prior to landfilling. Preliminaryresults of the Seattle study indicated that lead did not leach from the liquid paint but didleach from the solidified paint Changes in the pH during the solidification process aresuspected to contribute to this problem. Further studies will be conducted to test thistheory. All states identified in this study do allow the disposal of paint containers withdried paint in municipal landfills, although recycling the paint cans is the preferredoption.
91
6.4.1 Household Hazardous Waste Collections
To reduce the quantities of household hazardous waste disposed of in solid wastelandfills, many communities have established household hazardous waste collections.Generally, these are one-day events held periodically to allow households to drop offtheir wastes at collection sites.
In general, about 50 percent of the waste collected is paint waste. The paint collectedat San Bernardino County, California, collection sites is on average ten years old(HHWMN, 199Oc). Many programs collect only organic solvent based paints, whichgenerally fall under the RCRA definition of hazardous wastes. California, Minnesota,and Washington also recommend collecting latex because of potential mercury and leadcontent. Also, where the latex paint is recycled, the volume of solid waste disposed of isreduced. For communities collecting both organic solvent-borne paints and water-bornepaints, about half the paint waste collected is latex. GeneralIy, older communities tend tohave larger quantities of organic solvent-borne paints (HHWMN, 199Oc).
Organic solvent-borne paints collected at waste collections are generally treated as ahazardous waste; most are burned for energy recovery. Up to 10 percent of organicsolvent-borne paint waste may test over 50 parts per million for polychlorinatedbiphenyls (PCBs). The federal Toxic Substances Control Act requires burning thesewastes in an incinerator licensed for PCBs. Twenty to thirty percent of solvent paintcollected is reusable as paint, although recycling organic solvent-borne paints is notcommon (HHWMN, 199Oc). See Section 6.4.3 for a discussion of recycling paint waste.
Latex paint waste collected is reused as paint whenever possible. The proportion ofpaint that is reusable varies in part by climate. Paint that has frozen and then thawedcannot be used In Minnesota, approximately 45 percent of latex collected is reusable.Latex paint recycling is further discussed in Section 6.4.3. Most collection programs treatlatex paint that is not reused as hazardous waste, blending it for fuel or disposing of it in ahazardous waste landfill (HHWMN, 199Ob). Seattle is currently experimenting withsolidifying latex waste for safe disposal in solid waste landfills. Although further testsare needed, preliminary results indicate a potential lead leachate problem (Seattle SolidWaste Utility, 199Oa).
For the last few years, IEPA has sponsored six to ten local household hazardous wastecollections annually. IEPA pays for the cost of waste collection, packaging,transportation, and disposal, while the sponsoring community handles all publicity andpromotion (IEPA, 199Oa). A 1988 Champaign County household hazardous wastecollection brought in 5,628 containers of hazardous materials. Approximately 20 percentof these containers were organic solvent-borne paints. It is important to note thatcontainer size and capacity varies; the actual volume of paint waste collected was notdetermined (Oldakowski, 1990).
Problems exist with household hazardous waste collections. Participation rates arelow on average, as low as one or two percent of households (Meiorin and Purin, 1989).The portion of hazardous materials actually diverted from the solid waste landfills is
92
unknown. Disposal of the hazardous substances collected is very costly for thesponsoring agencies (Spencer, 1989). Some communities recycle the hazardous wastescollected to help offset these disposal costs.
6.4.2 Recycling Opportunities for Household Paint Waste
Many communities that collect household paint wastes have instituted programs torecycle the paint products. Of these programs, the most common and least expensive areprograms that give away the reusable paints, either to public agencies and nonprofitgroups or to residents through ‘drop and swap” programs. Other programs reprocess theleftover paints, sometimes adding virgin ingredients as needed to improve the quality andperformance of the recycled paint. The reprocessed paint is generally distributed topublic agencies and used in public housing and graffiti abatement programs.
An important step in recycling programs is sorting the paint waste. In general,approximately 50 percent of latex paint collected and 20 to 30 percent of organic solvent-borne paint collected is reusable, although the reuse of organic solvent-borne paints is notcommon (HHWMN, 1990c). Paint cans are opened and checked for possiblecontamination, solidification, “souring,” separation, or congealing. Paints exhibiting anyof these characteristics are not reusable and are generally disposed of as hazardouswastes. In addition, collected paint may be screened for potential toxic content. White,orange, or yellow paints manufactured before 1973 may contain lead in concentrationsexceeding regulatory limits (Seattle Solid Waste Utility, 199Oa). Latex paints labeled“mildew-resistant” may have a high mercury content; such paints should be reused onlyfor exterior applications (HHWMZV, 199Oa). In its pilot solvent paint recycling project,the city of Seattle also rejected metal primers, shellacs, stain sealers, metallic paints, andother specialty paints as likely to contain mercury, lead, or pesticides (Seattle Solid WasteUtility, 1990b). Finally, paints that are reusable are often sorted by color, light-coloredpaints are generally preferred by users.
For drop and swap programs, reusable paints are generally given away in theiroriginal containers. For other recycling programs, transportation costs can be reduced byconsolidating the paint into 55-gallon drums. The process of opening each can andscraping out the paint takes about one hour per drum (HHWMN, 199Oc).
In a pilot project, Seattle tested reprocessing organic solvent-borne paints for potentialsale to residents or public agencies. Collected organic solvent-borne paints werecarefully sorted to eliminate paints with hazardous constituents or that were no longeruseable. Paints were then sorted and consolidated based on color. The consolidated paintwas taken to a local organic solvent-borne paint manufacturer and tested for hazardouscomponents. No hazardous components were detected that compromised the use of thepaint. A second set of tests was conducted to determine the quality characteristics of thepaint. Although virgin ingredients were added to the paint to improve its performance,the recycled paint could not meet the quality specifications. The resultant low-qualitypaint was determined not to be sufficiently marketable. Seattle determined that a marketprice of $4 per gallon would be required for such a low-grade material. At that price,recycling the solvent-based paint would cost an estimated $23,000 more than hazardous
93
waste disposal over a five-year period. In addition, the city questioned whether anorganic solvent-borne paint should be marketed to residents, given that the governmentcurrently encourages residents to use latex. Based on the results of this pilot project, thecity did not recommend organic solvent-borne paint reprocessing (Seattle Solid WasteUtility, 199Ob).
In a second pilot project, Seattle studied the potential for reprocessing and marketingleftover latex paints. As with the solvent paint project, a critical step in the latexrecycling was to carefully sort the paints to eliminate unusable paints or paints withhazardous constituents. The consolidated paint was tested for ethylene and diethyleneglycols and heavy metal concentrations. (The federal government has set a labelingthreshold of 10 percent concentration for each glycol.) All constituents tested were belowregulatory thresholds. The paint was also tested for quality, and ingredients were addedto improve performance. Subsequent lab tests demonstrated that the recycled paint wasof medium quality, a conclusion that was confirmed through field tests and interviewswith users of the paint. The paint was sold to paint contractors through retail paint storesat a cost of $5 per gallon (Seattle Solid Waste Utility, 199Oa).
Based on the results of this pilot project, Seattle recommends a permanent latex paintrecycling program with the resultant recycled paint sold to public agencies in the area. Itwas determined that these agencies provide a sufficient market for current quantities ofrecycled paint; eventually, residentiaI markets can be developed to allow for growth ofthe quantities produced This program would also support city and state procurementpractices that favor recycled products. Initially, the city would retain ownership of thepaint and contract with a paint manufacturer and a distributor. After a dependable markethas been established, Seattle would contract with a paint company that would assumeownership of the paint and handle all reprocessing and marketing. Seattle estimates thatrecycling 45 percent of the latex paint collected will cut latex paint disposal costs by 25percent (Seattle Solid Waste Utility, 1990a).
McHenry County, Illinois, is developing a pilot household paint recycling project(Fisher, 1991). The county plans to hold a one-day household paint collection, withcollection points set up in each of the three major municipalities in the county. At thecollection sites, latex and solvent paints will be separated, and paints will be furthersorted based on color (light or dark) and use (interior or exterior). A local paintmanufacturer will then test the paint for contaminants, toxic metals, and quality andreblend the paints. The county will provide all administration and staffing for thecollection events, and the paint manufacturer will incur all costs for testing andreblending. The pilot project is designed to determine the following:
l quantities of paint that could be collected,
l fraction of the paint collected that is recoverable,
l level of contaminants and toxic components in the recovered paint,
l public acceptance of the recycled product, and
l costs and revenues associated with recycling the paint
94

The Association of Bay Area Governments (ABAG) in Oakland, California, hasidentified several barriers to paint recycling:
l A steady, high volume of paint is required to make the recycling practical.
l Manufacturers or retailers have little incentive to participate.
l Hazardous waste permits may be required for storage and licenses for haulers.
l There is potential liability for contaminants in the paint, and testing every drumfor a variety of potential contaminants is costly.
l Latex paints may contain mercury, solvents, or PCBs.
Like the Seattle study, ABAG concludes that latex paints offer the greatest potentialfor recycling. ABAG recommends careful screening of collected paints to exclude paintscontaining PCBs, mercury, or contaminants. ABAG also suggests that state and localgovernments take responsibility for distributing recycled paints for use in governmentoperations to avoid extensive warranty and marketing efforts. Finally, programs could beestablished to recognize paint recycling efforts to provide an added incentive forrecycling (Meiorin and Purin, 1989).
6.4.3 Other Waste Reduction Options for Household Paint Waste
Although recycling paint wastes can be more cost-effective and environmentallysound than disposing of the waste, the state of Illinois prefers reductions of wastegeneration at its source. Household paint waste reduction programs would encourageresidents to purchase only the amount of paint needed and to use the least toxic productavailable for the job.
Working with the National Paint and Coating Association (NPCA) and local retailers,the state could encourage retailing practices that reduce leftover paints. For example,smaller quantities of paint could be sold for prices comparable to larger quantities.Current retailing practice is to sell small quantities at a much higher price per gallon thanlarge quantities, encouraging larger purchases of paint In addition, retailers could beencouraged to take back unopened cans of paint for resale. These unopened cans couldbe classified as retrograde materials and therefore would not require waste handlingpermits (Meiorin and Purin, 1989).
A public education campaign could also encourage paint waste reduction.Information could be provided on the following:
l how to determine the correct amount of paint required;
l how to use less toxic paint products for different applications, or what toxiccomponents users should be aware of; and
l how to properly store leftover paints so that they can be reused (e.g., don’t letthe paint freeze or add other materials to the paint).
95
The Paint Management and Disposal Guide (McHenry County, 1991) instructshouseholders on how to reduce paint waste generation, including the followingsuggestions:
l Buy only as much as you need
l Buy latex (rather than organic solvent-borne) paints whenever possible.
l Give away leftovers to churches, schools, or friends.l If paint is saved store it properly to maintain its quality.
The guide is partly a response to the frequent number of questions concerning properpaint waste management received by the McHenry County Department of Solid WasteManagement. Several local paint retailers have asked for copies of the guide to provide totheir customers (Fisher, 1991).
Although they do not fall under the category of waste reduction, education programscould also include information to help users reduce their exposure to toxic substances(e.g., instructions to use only in well-ventilated areas and to minimize children’s exposureto fumes). The Paint Management and Disposal Guide also includes instructions for theproper disposal of paint wastes (McHenry County, 1991).
96
CHAPTER 7CONCLUSIONS AND RECOMMENDATIONS
The results of this study suggest that a variety of options are available to reduce paint-related waste generation, many of which have been implemented by Illinois paintmanufacturers and users. Many of these waste reduction options are available at low costin Illinois. The major barriers to implementing these options are a lack of technicalinformation and the perception that waste generation is not a problem. The educationprogram discussed in this chapter is designed to provide technical information on wastereduction and to educate users about the effects of waste generation, including thefinancial costs of waste generation.
Through the course of this study, we found that paint manufacturers are generallymore advanced at reducing waste generation than paint users. In part, this differenceresults from different perspectives on paint. Paint manufacturers are motivated to reducepaint-related wastes to maximize production of their finished product. Paint users,however, generally do not regard painting as their primary business, and painting is just asmall fraction of their cost of goods sold. This fact does not imply that paintmanufacturers in Illinois do not need to further reduce waste. On the contrary, the sitevisits indicated that some paint manufacturers could further reduce their waste. Thisconclusion does support our study’s focus on paint users rather than manufacturers.
Our study suggests that most paint-related liquid wastes from industry do not reachthe environment untreated. These wastes are either treated in-house or handled by asolvent recycler or fuel blender. The study indicates that the liquid waste handlingindustry in Illinois manages liquid paint-related wastes from both small and large paintusers. However, one very small paint user visited during the course of this study wasunaware of solvent recycling opportunities. We recommend efforts to educate firms ofthis size about options for handling liquid paint-related wastes, as described below. Inaddition, we recommend specific steps, also described below, for handling liquid paintwastes from households and household painting contractors.
The largest type of air emissions from both paint manufacturers and paint users isVOCs, which contribute to atmospheric ozone pollution. Currently, the Clean Air Actimposes regulations on major sources of VOC emissions (i.e., facilities that release over100 tons per year). This regulation has already served as an incentive for large facilitiesto use less paint and to switch to paints formulated with lower VOC content, such as highsolids, waterborne, and powdered paints. The 1990 Clean Air Act Amendments lowerthresholds for VOC emissions, making additional facilities subject to the Clean Air Actpermitting provisions and control technologies. We recommend an education programtargeted at facilities now subject to these regulations, to inform them of the regulatoryrequirements and how they can use waste reduction to comply with the regulations.Waste reduction options include switching to paints formulated with lower VOC contentand improving paint transfer efficiencies, which results in less paint being used andtherefore reduced VOC emissions.
Further study is needed to determine the extent of environmental hazard due to landdisposal of paint-related wastes. In particular, the leachate hazard of disposing of paintproducts in municipal landfills is unknown. Paint products containing toxic metals,
97

organic solvents, or pesticides pose the greatest potential environmental threat. Werecommend that these products be recycled in an environmentally sound manner ordisposed of in a landfill registered to receive that type of waste. Implementing thisrecommendation may require enhanced enforcement of special waste regulations forindustry and commercial operations and establishing additional household hazardouswaste collection programs. These options are further discussed below.
For the purposes of conducting this study, an Ad Hoc Advisory Group (AHAG) wasformed. AHAG consists of representatives of Illinois paint manufacturers and industrialand commercial paint users, Although initially formed to provide input and review forthis study, we recommend that this group be maintained to provide input in implementingthe recommendations. The group would fulfill two functions. First, it would provide aninsider’s view of the complex issues related to paint use in a variety of industries. Theresults of this study indicate that paint use and the types of paint used vary greatly, andany technological assistance must be tailored for each applicable industry. Second, werecognize that implementing any change involves some risk and uncertainty. BecauseAHAG members can ensure the effectiveness of recommended technologies, the groupwill encourage the implementation of recommended changes. In both functions, thegroup serves as a liaison between government agencies and the industries that themembers represent.
This chapter presents our recommendations for programs to promote paint-relatedwaste reduction and environmentally sound disposal, including an education and publiccommunication program. The state of Illinois prefers waste reduction or recycling todisposal whenever feasible. The following recommendations incorporate this statepolicy.
7.1 RECOMMENDATIONS FOR PAINT MANUFACTURERS
Waste reduction has been implemented to comply with environmental regulations andto reduce waste management costs. The results of this study suggest that paintmanufacturers have made significant progress in reducing their waste generation.Probably the greatest incentive to reduce waste generation for paint manufacturers hasbeen to reduce materials cost and the loss of product.
Two recent regulatory changes, when implemented, will create additional incentivesfor paint manufacturers to reduce waste generation. The 1990 Clean Air ActAmendments require reductions in VOC emissions and the VOC content of paint. Wastereduction options can be implemented to reduce VOC emissions. Revised RCRAregulations increase regulatory requirements on the burning of hazardous waste for fuel, acommon waste management practice for paint-related wastes. This regulation coulddecrease the availability and increase the cost of reusing hazardous waste as fuel. Wastereduction could reduce these waste management costs.
An education program for paint manufacturers could include information ontechnologies to reduce VOC emissions and waste management costs. In addition, paintmanufacturers could identify profitable waste reduction opportunities by implementingfull-cost accounting and materials accounting. Information on both these accountingmethods could also be included in an education program.
98
Finally, paint manufacturers can play an important role in waste reduction andrecycling for wastes generated from using paint. For example, reducing the VOC contentof paint reduces VOC emissions at the manufacturing facility and during paint applicationand curing. Paint manufacturers could also participate in a household waste recyclingprogram. Participation could include taking back and reusing empty paint cans orreblending leftover paints collected from households. We recommend that the state ofIllinois solicit the participation of local paint manufacturers in recycling programs.
7.2 RECOMMENDATIONS FOR INDUSTRIAL USERS OF PAINT
Because OEM manufacturers’ primary business is not painting, they do not alwaysrealize the amount of paint-related waste they are generating. Therefore, educating thesefirms on the costs of paint-related waste generation and potential waste reduction optionsshould be the focus of a waste reduction program.
The area that offers the greatest potential for waste reduction for OEM manufacturersis improving paint transfer efficiency. Because transfer inefficiencies are a large sourceof solid, liquid, and air emissions and a source of paint loss, improving them is a financialincentive. Generally, technologies are available to improve transfer efficiency. Toencourage the implementation of these technologies, we recommend
l technology demonstrations,
l the distribution of vendor lists,
l a tax credit for capital expenditures, and
l case studies and news releases (to be distributed through trade associations andtrade journals).
Liquid paint-related wastes generated by OEM manufacturers are usually sent offsiteto solvent recyclers or fuel blenders. We found this an excellent way to manage thesewastes and do not recommend any alternatives. But we do recommend that steps betaken to ensure that all users are familiar with recycling opportunities. For example, onestep provides lists of recyclers to paint users. The site visit results also indicated thatsome fuel blenders are blending solid paint wastes such as filters from overspray capturedevices. We recommend this as an alternative to landfilling these solid paint-relatedwastes and recommend that the availability of this service be advertised through tradejournals.
New RCRA regulations on fuel blending have been issued that might affect the costand availability of fuel blending. In particular, manufacturers of wood productsexpressed concern about these new regulations during site visits. We recommend furtherevaluation of the impacts of these regulations on disposal options for paint-related wastes.One possible result of these regulations, if they do limit fuel blending opportunities,would be to provide additional incentives for waste reduction.
During the course of this study, we identified a problem with the disposal of solidpaint-related wastes. Generally, these wastes are subject to Illinois special wasteregulations and should be transported by a licensed special waste hauler to landfills
99

licensed to accept the waste. However, these wastes are often disposed of in municipallandfills without using licensed haulers. This situation seems to result from a lack ofinformation on special waste regulations and a lack of enforcement of these regulations.We recommend combining an education program on special waste regulations withadditional steps to enforce these regulations. In addition to ensuring that these wastes aredisposed of properly, these additional steps will draw greater attention to these solidwastes, and the additional costs and management steps required to comply with specialwaste regulations may provide an incentive to reduce these wastes.
7.3 RECOMMENDATIONS FOR AUTO BODY REPAIR SHOPS
Auto body repair shops generate paint-related wastes similar to those generated byOEM manufacturers. The major differences are that auto body shops are generallysmaller with less available resources and paint usage is generally a larger part of theirbusinesses.
One important source of waste generation from auto body shops is leftover thinnersand paints. We recommend that any leftover paint products be reused onsite wheneverpossible. For example, old paints can be blended with thinner and used as anundercoating. Thinners and paints that cannot be reused onsite should be managed by asolvent recycler or fuel blender. We recommend that Illinois initiate an educationcampaign be initiated to ensure that all auto body shops are familiar with these recyclingopportunities. One option to increase familiarity with recycling opportunities is tocompile lists of available recyclers for paint users and include instructions to maximizethe recyclability of their wastes.
A second area that offers the potential for waste reduction from auto body shops isimproving transfer efficiency. Because improving transfer efficiency results in less paintbeing used and therefore reduced paint purchasing costs, auto body shops have a directfinancial incentive to improve paint transfer efficiency. We recommend that Illinoisencourage this improvement by relating information on changes in applicationtechniques. Information could be distributed through trade journals and paint vendors.Also, small regional conferences could be held to demonstrate the new technology.
As with OEM manufacturers, we found indications that auto body shops are notdisposing of their solid wastes in accordance with special waste regulations. Again, werecommend combining an education program on special waste regulations with additionalsteps to enforce these regulations. These steps could encourage the proper disposal ofthese wastes, and the greater attention and costs imposed by the special waste regulationsmay provide an incentive to reduce these wastes. A second option is to requite new autobody shops to demonstrate that they have arranged for a licensed waste hauler, as part ofobtaining an auto body license.
One problem unique to auto body repair shops is the potentially large number ofunlicensed shops. These shops include small, part-time operations conducted in aresidential garage or backyard We identified no information on such operations duringthe course of this study, but such shops may not utilize the recommended methods ofwaste disposal, including solvent recyclers and licensed special waste haulers.Contacting such operations as part of an education program would be difficult. One
100
option is to make information on practices to reduce waste generation available throughpaint vendors.
7.4 RECOMMENDATIONS FOR HOUSEHOLD USERS OF PAINT
Household users of paint should observe the following guidelines to reduce householdpaint waste generation:
l Buy only as much paint as needed to complete a job.
l Buy the least-toxic paint available for a given application.
l Use good application procedures to minimize spills and drippage and theamount of paint used.
l Store paints properly to ensure they maintain their effectiveness.
l Find a user for any leftover paints (e.g., donate to church, school, or communitytheater).
We recommend that these guidelines be included in education materials such a brochuresand posters displayed at paint retailers. These education materials should also includespecific instructions for proper disposal of paint-related wastes.
We also recommend that Illinois study the possibility of establishing a householdlatex paint recycling program, in conjunction with county governments and local paintmanufacturers. Prior to initiating such a program, Illinois must secure a viable market forthe reblended paints. The state could explore the possibility of purchasing the recycledpaint Paint cans collected at a household paint collection can also be recycled. Furtherstudy is needed to identify potential metal recyclers and markets for the recycled product.
The potential for leachate formation from paint and its associated hazards is unknownat this time. Because of their mobility, we recommend that liquid paints and paint-relatedwastes not be disposed of in municipal landfills.
Some communities recommend allowing paint-related wastes to dry and thendisposing of them in municipal landfills. For organic solvent-borne paints and thinners,the evaporation of VOCs during drying contributes to air pollution. Therefore, we do notrecommend that the state of Illinois advocate this method of disposing of wastescontaining organic solvents. Instead, we recommend that these products be collectedthrough household hazardous waste collection programs and then sent to a solventrecycler for management.
For latex paint waste, we recommend that toxic chemical leaching procedure (TCLP)testing be conducted to determine the potential leachate hazard of dried latex paint. Evenif studies determine that dried latex paint does not pose a leachate hazard, finding anotheruser for the paint or taking it to a collection center for reblending is preferred to air-drying and landfilling the paint.
101

7.5 RECOMMENDATIONS FOR HOUSEHOLD PAINTING CONTRACTORS
The results of this study suggest that household painting contractors generate paintwaste and manage their wastes in the same manner as household users. The educationmaterials described in Section 7.4 are also applicable to painting contractors. Paintingcontractors do not have the same incentives to minimize paint use as householders,because they pass on all the costs of the paint to their clients. Nonetheless, a painter whouses less paint could have a competitive advantage.
In Section 7.4, we recommend a latex recycling program for household users of paintthat is also applicable to painting contractors. However, Illinois special waste regulationsmight impose additional constraints on recycling paint from commercial contractors. Ifapplicable, we recommend exempting latex paint from special waste regulations to allowcontractors to participate in a latex recycling program.
A second potential regulatory constraint on recycling is federal RCRA regulations.Unlike household wastes, wastes from painting contractors are not automatically exemptfrom RCRA hazardous waste regulations. If it cannot be determined, through sorting ortesting paint waste, that all wastes taken to a latex paint recycling center are non-hazardous (based on RCRA definitions), a collection facility would need to assure thateach firm drops off less than 22 gallons of hazardous paint waste in a single month andthat no waste remains onsite for longer than 90 days.
Currently, paint wastes from household painting contractors are disposed of inmunicipal landfIlls. As explained in Section 7.4, further study is needed to determine thepotential leachate hazard these wastes pose in municipal landfills. If these wastes do posea leachate hazard, we recommend that they be collected in household hazardous wastecollections. This may require exemptions from special waste regulations and asdescribed above, steps taken to ensure compliance with federal RCRA regulations.
7.6 RECOMMENDED EDUCATION PROGRAM
The following educational program recommendations were developed from a reviewof the information collected during this study. Paint Survey results indicated the sourcesof information currently used by Illinois firms and the types of additional informationfirms require. The site visits provided information on processes used to manufacture andapply paint, management attitudes toward the use and disposal of paint, and managementattitudes toward the adoption of new technologies or procedures. A third source ofinformation was the variety of educational material and reports in the HWRIC resourcecollection, along with guides to paint use and waste management developed in otherstates. These materials demonstrated both effective and ineffective ways of promotingimproved paint use and disposal methods.
The site visits indicated that managers would be willing to make changes if thosechanges result in increased profitability, safety, compliance with state and federalregulations, or, to a lesser extent, an improved public image. The site visits alsohighlighted the extent to which training is irregular and depends on an informalapprentice-to-expert progression. Although this training may be effective, instructions
102

passed on by employees may not be consistent, even if the same employee provides theinstruction.
These recommendations are based on the recognition that Illinois firms have differentlevels of expertise in and resources for reducing and managing paint-related waste. Theytake into account the differing abilities of paint users, in particular, to adopt newprocedures. We also recognize the limited number of changes any paint manufacturer oruser is likely to make. Therefore, the education materials we recommend are designed tosuggest changes that are easy to adopt and to provide benefits that are immediatelyevident.
7.6.1 Conceptual Basis For Educational. Program Recommendations
Three concepts were used to develop the recommended education program:
l the use of case studies to demonstrate effective and ineffective practices;
l the effectiveness of insiders in encouraging the adoption of new practices; and
l the use of effective on-the-job training to change behavior.
Case studies are valuable for suggesting practices that could be applied in similarsettings. For example, conclusions based on the site visits conducted as part of this studycould be generalized to other firms in a similar setting. The site visits could be used todevelop case studies.
The site visits were complemented by a literature search that examined when and howa variety of minor and major changes are made. In particular, we reviewed literature thatemphasizes the credibility of “insiders” (those already accepted as members of aparticular group) who try a new approach and find it of value. The fact that these insidershave adopted a new approach increases the likelihood others will do the same (Rogers,1983). In addition, research by Havelock (1976) points out that the successes and failuresof early adopters are powerful examples to more conservative and less innovativecolleagues.
Finally, many studies of training as a factor in achieving behavioral change wereevaluated. Houle’s (1972) work on the importance of limited objectives for each trainingsession and the clarity of the subject matter covered at these sessions is an importantguide to developing training programs. Houle further points out that individualinstructional activities should fit into a larger context, so that individual efforts toimprove performance are related for example, to improved company profitability orincreased compliance with state and federal regulations.
In his guidelines for effective educational programs, Houle also suggests twoimportant factors that have a significant impact on the willingness of an individual tolisten and to learn: “need to know” and “teachable moments.” Employees have a need toknow if the training information eliminates an evident gap in knowledge or skill and if theinformation can be used immediately. A teachable moment occurs when employees havethe time, energy, and attitude to be active learners.
103

In addition to the Houle material, studies of industrial training (Jacobs, Kerrigan andLuke, 1987) recommend that what was presented in training be included in jobperformance expectations. For example, if procedures for handling small spills weredemonstrated in training, then employees should be expected to clean up spills usingthose procedures. These studies suggest that reminding employees of the materialcovered in training and rewarding them for following established procedures strengthenbehavior. Research on reinforcement (Grippen and Peters, 1984) suggests that informingemployees of performance expectations through training can change behavior. Theresearch also suggests that people understand a process better when it is broken down intosmall segments.
In all training activities, the role of supervisors with direct and continuing employeecontact is critical. Martin Broadwell (1967) points out that supervisors who provideon-the-job instruction, monitor performance, and correct employees who err are effectivetrainers. The supervisor’s continuing observation and emphasis on following correctprocedures is particularly important
7.6.2 Description of Educational Materials
These recommendations address materials for an overall education program as well asthe specific products that could be made available to paint manufacturers and the varietyof paint users in Illinois. Special attention is given to auto body repair shops, householdusers, and commercial painters.
The educational materials can be grouped into three categories:
l reinforcement material for those already conscious, to some extent, of the needfor effective paint-related waste management methods and who would benefitfrom guidance and support from those in their industry;
l training material for those employees and supervisors in industries whoseattention to this area is limited; and
l public information items designed to inform and potentially influence somemodest change in public practice.
All material should be developed with the appropriate trade associations to increase thelikelihood of the materials being used. Participation by trade associations will improvematerial quality and promote wider distribution. In addition, their active involvement andsupport for this educational program add credibility.
7.6.2.1 Reinforcement Materials
Reinforcement material includes items such as news releases, trade journal articles,and brief presentations at trade association meetings that emphasize effective practicesand recognize specific companies and individuals responsible for developing thesepractices. Brief case studies or easily understood descriptions are especially important toshow what actually is being done in various manufacturing and use settings, the resultsachieved, and the resulting cost-savings. The focus should be on what has and hasn’t
104
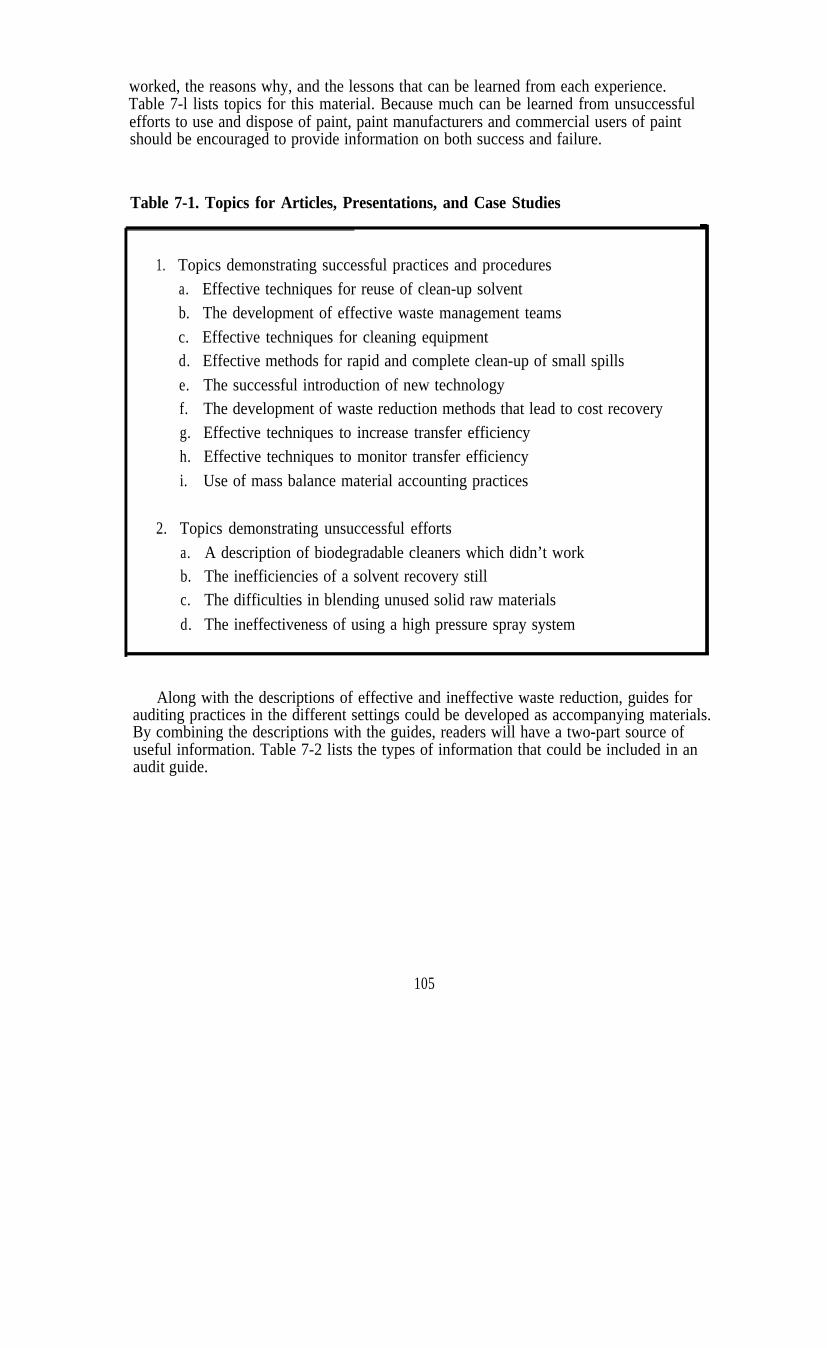
worked, the reasons why, and the lessons that can be learned from each experience.Table 7-l lists topics for this material. Because much can be learned from unsuccessfulefforts to use and dispose of paint, paint manufacturers and commercial users of paintshould be encouraged to provide information on both success and failure.
Table 7-1. Topics for Articles, Presentations, and Case Studies
1. Topics demonstrating successful practices and proceduresa. Effective techniques for reuse of clean-up solventb. The development of effective waste management teams
c. Effective techniques for cleaning equipmentd. Effective methods for rapid and complete clean-up of small spills
e. The successful introduction of new technologyf. The development of waste reduction methods that lead to cost recoveryg. Effective techniques to increase transfer efficiencyh. Effective techniques to monitor transfer efficiency
i. Use of mass balance material accounting practices
2. Topics demonstrating unsuccessful efforts
a. A description of biodegradable cleaners which didn’t workb. The inefficiencies of a solvent recovery stillc. The difficulties in blending unused solid raw materials
d. The ineffectiveness of using a high pressure spray system
Along with the descriptions of effective and ineffective waste reduction, guides forauditing practices in the different settings could be developed as accompanying materials.By combining the descriptions with the guides, readers will have a two-part source ofuseful information. Table 7-2 lists the types of information that could be included in anaudit guide.
105
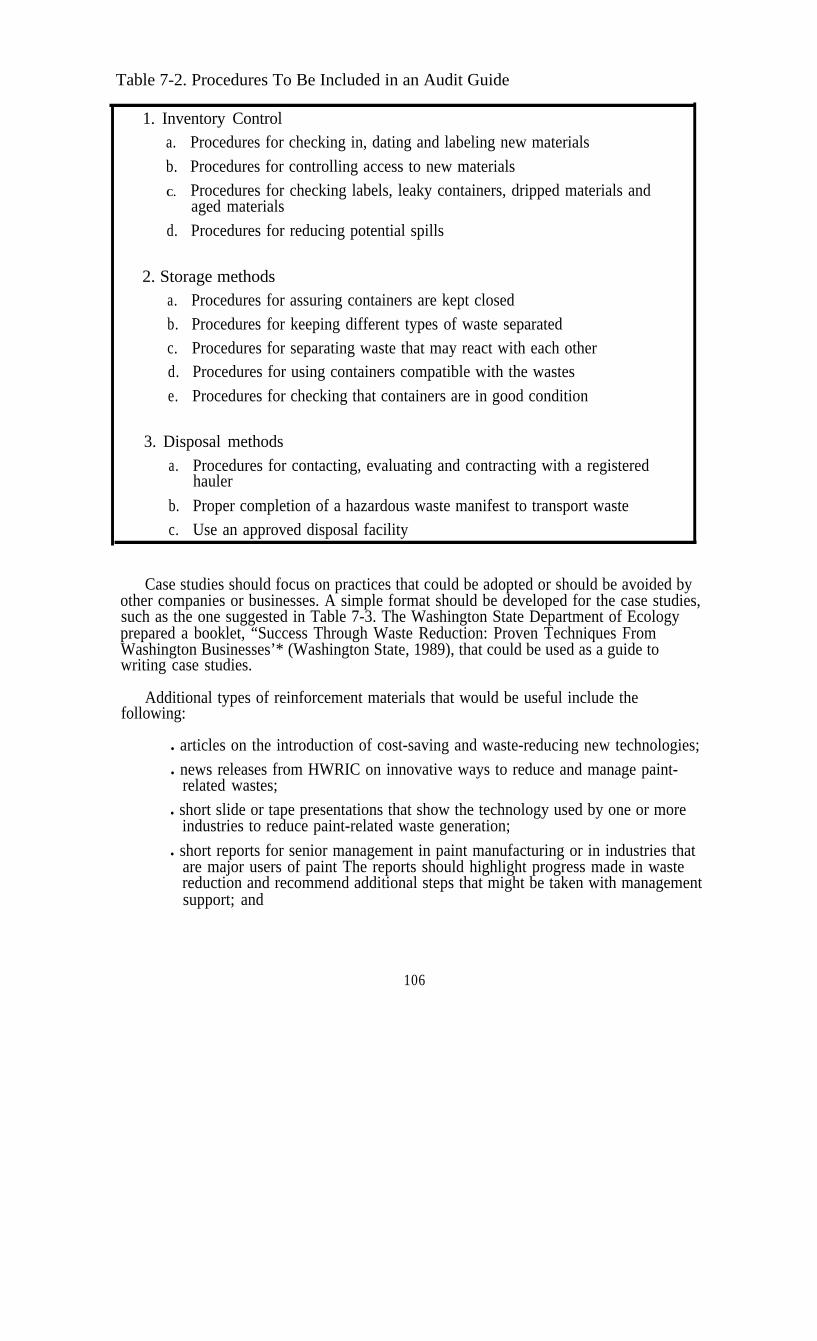
Table 7-2. Procedures To Be Included in an Audit Guide
1. Inventory Controla. Procedures for checking in, dating and labeling new materials
b. Procedures for controlling access to new materials
C. Procedures for checking labels, leaky containers, dripped materials andaged materials
d. Procedures for reducing potential spills
2. Storage methodsa. Procedures for assuring containers are kept closedb. Procedures for keeping different types of waste separatedc. Procedures for separating waste that may react with each otherd. Procedures for using containers compatible with the wastes
e. Procedures for checking that containers are in good condition
3. Disposal methodsa. Procedures for contacting, evaluating and contracting with a registered
hauler
b. Proper completion of a hazardous waste manifest to transport wastec. Use an approved disposal facility
Case studies should focus on practices that could be adopted or should be avoided byother companies or businesses. A simple format should be developed for the case studies,such as the one suggested in Table 7-3. The Washington State Department of Ecologyprepared a booklet, “Success Through Waste Reduction: Proven Techniques FromWashington Businesses’* (Washington State, 1989), that could be used as a guide towriting case studies.
Additional types of reinforcement materials that would be useful include thefollowing:
l articles on the introduction of cost-saving and waste-reducing new technologies;
l news releases from HWRIC on innovative ways to reduce and manage paint-related wastes;
l short slide or tape presentations that show the technology used by one or moreindustries to reduce paint-related waste generation;
l short reports for senior management in paint manufacturing or in industries thatare major users of paint The reports should highlight progress made in wastereduction and recommend additional steps that might be taken with managementsupport; and
106
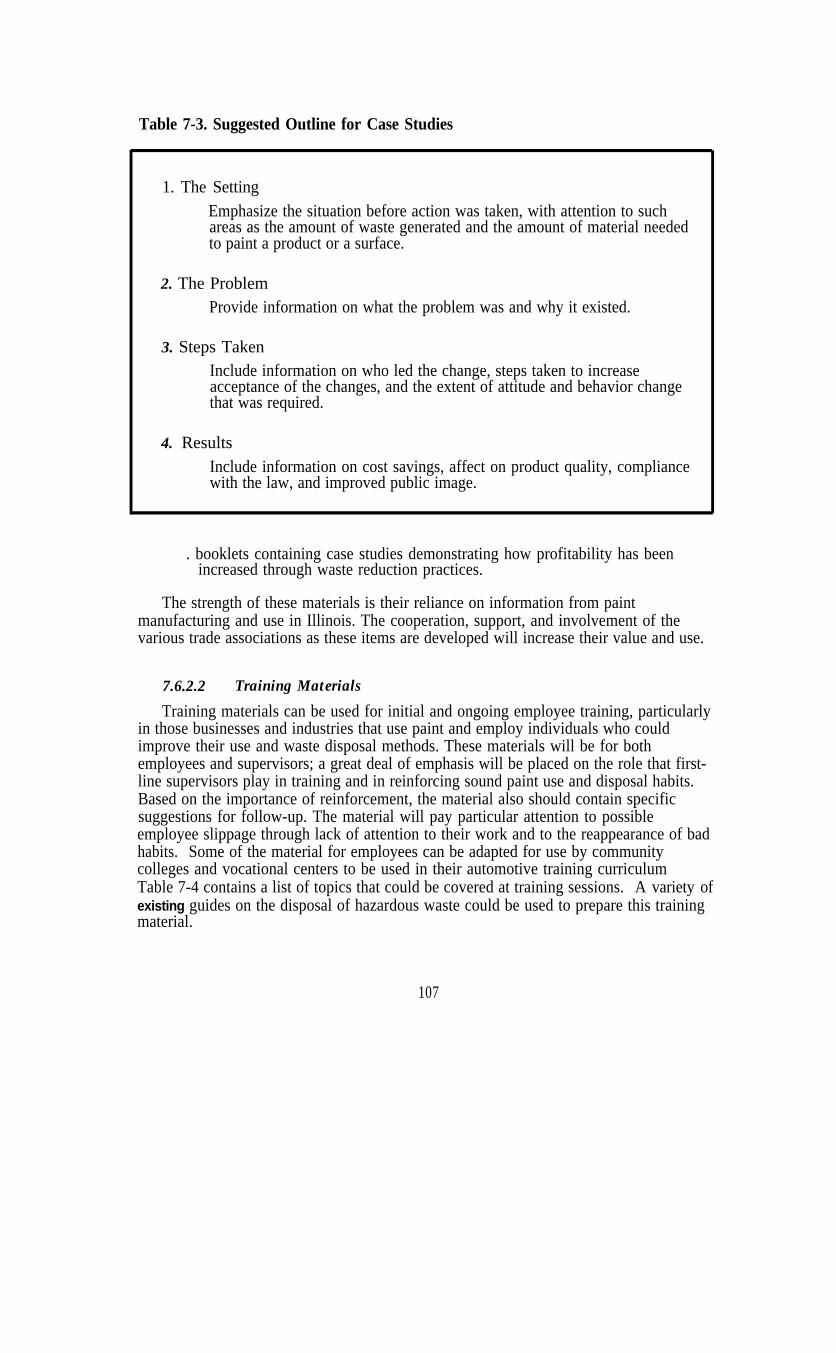
Table 7-3. Suggested Outline for Case Studies
1. The SettingEmphasize the situation before action was taken, with attention to suchareas as the amount of waste generated and the amount of material neededto paint a product or a surface.
2. The ProblemProvide information on what the problem was and why it existed.
3. Steps TakenInclude information on who led the change, steps taken to increaseacceptance of the changes, and the extent of attitude and behavior changethat was required.
4. ResultsInclude information on cost savings, affect on product quality, compliancewith the law, and improved public image.
. booklets containing case studies demonstrating how profitability has beenincreased through waste reduction practices.
The strength of these materials is their reliance on information from paintmanufacturing and use in Illinois. The cooperation, support, and involvement of thevarious trade associations as these items are developed will increase their value and use.
7.6.2.2 Training Materials
Training materials can be used for initial and ongoing employee training, particularlyin those businesses and industries that use paint and employ individuals who couldimprove their use and waste disposal methods. These materials will be for bothemployees and supervisors; a great deal of emphasis will be placed on the role that first-line supervisors play in training and in reinforcing sound paint use and disposal habits.Based on the importance of reinforcement, the material also should contain specificsuggestions for follow-up. The material will pay particular attention to possibleemployee slippage through lack of attention to their work and to the reappearance of badhabits. Some of the material for employees can be adapted for use by communitycolleges and vocational centers to be used in their automotive training curriculumTable 7-4 contains a list of topics that could be covered at training sessions. A variety ofexisting guides on the disposal of hazardous waste could be used to prepare this trainingmaterial.
107

Table 7-4. Topics for Training Sessions
1. Initial training for new employeesa. Employee’s responsibilities and their contribution to company success
b. The specific tasks to complete employee’s responsibilitiesc. The areas in need of particular attention
l Equipment operationl Position of materials when being painted
l Where waste can occur in application of paint
l Where spills are most likelyl Regular clean up of the work areal Clean up in special circumstances, such as an unexpected spill
2. Ongoing reinforcement traininga. Specific improvements needed in machine operation
b. Waste reduction possible through greater attention to the amount of paintused
c. Improve clean up of equipment and work areas
d. Preparation of products or surfaces prior to painting
The training material should be very simple, short, and easily reproduced byindividual companies or businesses. Ideally, the material should be in a package thatwould allow a manager or supervisor to select individual items for short training sessions.Typically, these sessions should be no longer than 20 minutes and be focused on one ortwo topics. In addition, materials should have similar formats so that instructors candevelop a simple routine to follow. Several options for training materials are available:
l Posters can emphasize different waste reduction steps that employees canimplement.
l Reminder sheets can be distributed to new employees at orientation sessions orposted as reminders. The materials should be specific to each industry andshould stress best practices and the value of these practices. Table 7-5 containsa sample version of a reminder sheet.
108

Table 7-5. Sample Reminder Sheet for an Auto Repair Shop
1. Clean up spills immediately with sawdust or some other absorbent.
2. Do not let waste accumulate--clean up small spills immediately with a mop orrag.
3. Launder dirty rags on a regular basis.
4. Use a drip pan if you expect a leak when working on parts of the engine.
5. Keep a log of larger spills to document quantity.
6. Keep parts cleaning equipment near service bays.
7. Allow cleaned parts to drain thoroughly.
l Guides can be created for managers to conduct 5- to 15-minute remindersessions on the best use of paint material and legally acceptable steps for paintdisposal.
l Checklists can be developed for supervisors and managers to evaluateemployees who are using or disposing of paint and to suggest ways to correct orimprove employee performance, using short on-the-job training sessions. Anadaptation of these checklists could be used by managers to evaluate howeffective supervisors are at observing employee performance and correcting itby working with individuals or by conducting group training sessions.
l Guides can be created for managers to review overall progress made in transferefficiency and in developing effective disposal methods. These guides would bein questionnaire form, which managers could require first-line supervisors tocomplete periodically.
The information gathered from monitoring can be used by managers to applaudprogress and to suggest needed improvement. Information obtained over a period of timecan demonstrate how much has been accomplished through consistent use of clearperformance standards.
7.6.2.3 Public Awareness MateriaIs
Public awareness material includes those items designed for household users thatcould be put on paint cans, distributed by paint and hardware stores, or given out throughthe schools. These materials should be developed in cooperation with paintmanufacturers and paint retailers and could be an example of how these industries areinvolved in improving the quality of the environment through promoting effective paintmanagement practices. The material should be specific, such as addressing how to bestuse paint to touch up a car or how to dispose of cans of leftover paints. Appendix Ccontains a list of the types of material already available and suggests how these materialsmight be modified.
109

Public awareness material should be simple and easily included with paint productsthat are sold to the general public or distributed to students. Different types of publicawareness materials are needed:
l Paint producers in the state could copy and give single sheets of suggestions forpaint use and disposal to retail outlets for distribution to their customers.
l Adaptations of that same information could be provided to science teachers inelementary and secondary schools in a form that students can take home toremind parents. Material also could be adapted for use in vocational and adulteducation courses in high schools and community colleges.
l News releases could be sent out in a regular sequence to newspapers in the stateto remind the general public of effective paint use and disposal methods.
l Recycling centers could make information (especially that related to leftoverpaints from home improvement projects) available to the clients they serve.That information could suggest disposal methods for the solids left after drying.The material also could be provided to Cooperative Extension Service (CES)offices throughout the state; CES is actively involved in promoting improvedwaste management.
7.6.2.4 Evaluation Methods
Some thought should be given to evaluating the effectiveness and impact of thevarious educational products. Determining exactly to what extent materials and programshave led to changes in behavior and performance is difficult. Simple evaluation formscould be developed to determine the degree to which existing training material wasaccepted and used, how it was used, and the perceived value of the various items.Following are three examples of simple evaluation methods that could be used.
l Pre-addressed post cards which contain six to eight forced choice (true/false orscaled) questions and are inserted in case study booklets or included withtraining slide or tape presentations.
l A one-page evaluation form, along with a pre-addressed return envelope,included with the training material, that either supervisors or managers couldcomplete and return to HWRIC.
l A similar evaluation form sent to high school or community college instructorswho use training material in their automotive classes.
7.7 FUNDING FOR RECOMMENDED PROGRAMS
Each of the above recommendations will require additional funding to implement.This section includes suggestions for funding alternatives.
For paint manufacturers and other manufacturers that use paint, one funding option isa fee on emissions of toxic chemicals reported in the Toxic Release Inventory (TRI).Many paint-related wastes are toxic chemicals subject to TRI reporting. If this fee wererelated to the amount of emissions, it would provide a financial incentive for Illinoisfirms to reduce their paint-related wastes.
110
A second funding option is the Clean Air Act fee. Some of the funds generated bythis fee could be apportioned for educational programs targeted at paint manufacturersand industrial users of paint
Auto body shops are not subject to TRI reporting requirements and therefore wouldnot be subject to a fee on TRI emissions. Options to finance an education programtargeted at this industry include a fee on paint purchases or an increase in licensing fees.A fee on paint purchases has the added benefit of increasing the financial incentive to usepaint more efficiently. A disadvantage of increasing licensing fees is that these fees arepaid only by the licensed members of the industry; thus, the licensed shops would befinancing technical assistance for non-licensed shops, which would not be equitable.
Currently, Illinois assesses a fee on generators of hazardous waste and special wastes.Increasing this fee is another possible source of funding for a paint waste reductionprogram. Many Illinois paint manufacturers and industrial and commercial paint usersare included in this fee requirement.
Waste reduction programs targeting household paint contractors and household usersof paint could be financed through a fee on retail paint purchases. The fee could vary bythe type of paint purchased, with a larger fee for paints containing organic solvents orspecialty paints that may contain pesticides. These types of paint may be more toxic ormay generate more waste. Such a fee would provide a financial incentive to use paintmore efficiently, buy only as much paint as needed, store paint properly to prolong itsshelf life, and purchase the least toxic or waste-generating type of paint Such a feewould be less effective at reducing paint waste from paint contractors because the clientsbear all the costs of paint purchased by contractors.
A second funding option for programs related to household users of paint is a drop-off fee for household hazardous waste collections. The disadvantage of this fundingoption is that it discourages proper disposal of household hazardous waste. To beeffective, such a fee would have to be accompanied by a ban on the disposal of householdhazardous wastes and paint products in municipal landfills that included an effectiveenforcement component.
Household waste reduction programs could be financed through an increase in tippingfees charged by municipal solid waste landfills. An increase in tipping fees is relevantbecause reducing waste going into these landfills is a major goal of a paint wastereduction program.
Paint manufacturers and users are receptive to suggestions that will reduce wastegeneration and therefore operating expenses. Development of educational programs topromote pollution prevention is essential to the development of proper wastemanagement practices by paint manufacturers and users alike. This will only be possiblethrough implementation of one or more of the funding options suggested above.
111

112
REFERENCES
American Business Information. 1991. “Businesses in the U.S.” and Manufacturers inthe U.S.” Omaha, Nebraska.
Beels, Gregory J. 1990. “1991 Market Study.” Industrial Finishing Magazine,December.
Bocchi, Greg. 1991. “Powder Coating Advantages.” Products Finishing, February.
Boxall, J., and Von Fraunhofer. 1977. Concise Paint Technology. New York: ChemicalPublishing.
Brewer, George. 1980. Calculation of Painting Wasteloads Associated with MetalFinishing. EPA-600/2-80-144.
Broadwell, Martin. 1967. The Supervisor as an Instructor. Second Edition. Reading,Massachusetts: Addison-Wesley Publishing Company.
Brooks, Ned, and Jeanne Eggleston. 1990. Very Small Quantity Generators-PilotCollection Project Report. Draft. St. Paul, Minnesota: Minnesota PollutionControl Agency. December.
Chemical Processors, Inc. 1989. “Small Quantity Generator Waste Acceptance Program:Requirements for Participation.” Three-page information booklet.
Consultant. 1990. “Paints Cause Health Concerns.” 4(5): 1.
Fisher, Hank, McHenry County Illinois Department of Solid Waste Management.August 11, 1991. Personal communication with Rachel Baker, Research TriangleInstitute.
Gardon, J.L., and Prane, J.W. 1973. Nonpolluting Coatings and Coating Processes.New York: Plenum Press.
Glaser, B. and Strauss, A. 1967. The Discovery of Grounded Theory: Strategies ‘forQualitative Research. Hawthorne, NY: Aldine.
Grace Robotics Incorporated. 1990. “Paint Recovery System.” Product Data SheetPRSDATA 1.PM3, February.
Grey, Arnold, Illinois Department of Transportation. September 19, 1991. Personalcommunication with Rachel Baker, Research Triangle Institute.
Grippen, P. and Peters, S. 1984. Learning Theory and Learning Outcomes. New York:University Press of America.
Havelock, R.G. 1976. Planning for Innovation through Dissemination and Utilization ofKnowledge. Ann Arbor, Michigan: Institute for Social Research.
Hazardous Waste Consultant. 1991 a. “Boiler and Industrial Furnace StandardsFinalized.” (March/April):2.9-2.10.
Hazardous Waste Consultant. 1991b. “The Clean Air Act Amendments of 1990-ADetailed Analysis.” Special Feature, January/February.
113

Hazardous Waste Research and Information Center (HWRIC). 1991. Annual ReportJuly 1, 1989 -June 30,199O. Edited by David L. Thomas and Christina M.Komadina. Champaign, IL.
Higgins, Thomas. 1989. “Removal of Paint and Coatings.” In Hazardous WasteMinimization Handbook. Chelsea, MI: Lewis Publishers Inc.
Hirschhorn, Joel S. and Kirsten U. Oldenburg. 1991. Prosperity Without Pollution.New York: VanNostrand Reinhold.
Houle, Cyril O. 1972. The Design of Education. San Francisco: Jossey-Bass Inc.,Publishers.
Household Hazardous Waste Management News (HHWMN). 1991. “News fromWashington.” (August):3, 10. Andover, MA: Waste Watch Center.
Household Hazardous Waste Management News (HHWMN). 199Oa. “RegionalReports.” (December):4-6.
Household Hazardous Waste Management News (HHWMN). 1990b. “ManagingUnwanted Paint Continued.” (Summer):3,7. Andover, MA: Waste Watch Center.
Household Hazardous Waste Management News (HHWMN). 199Oc. “ManagingUnwanted Paint.” (Spring):3, 8. Andover, MA: Waste Watch Center.
Illinois Environmental Protection Agency (IEPA). 1990a. (IEPA News. Springfield, IL.October 19.
Illinois Environmental Protection Agency (IEPA). 1990b. “Agency’s Newest Office hasSuccessful First Year.” Environmental Progress 15(6), November-December.Springfield, IL.
Illinois Manufacturers Directory. 1990. Manufacturers News.
Industrial Finishing. 1990. 66( 11).
Jacobs, Kerrigan, J. and Luke, J. 1987. Management Training Strategies for DevelopingCountries. Boulder, CO: Lynne Rienner.
Janssen, Jerry. 1990. The Feasibility of LaserlElectro-Optically Removing Lead-BasedPaint. Bartonville, IL: Midwest Foundation Corporation.
Kohl, Jerome, et al. 1984. Managing and Recycling Solvents--North CarolinaPractices, Facility and Regulations. Raleigh, NC: Industrial Extension Service,School of Engineering, North Carolina State University.
Kraybill, Daniel D. 1990. Illinois Small Quantity Generators’ Manual: How to ComplyEffectively with State and Federal Regulations. Third Edition. Champaign, Illinois:Hazardous Waste Research and Information Center.
Liebert, Roland J. 1988. Participation in a Household Hazardous Waste CollectionDrive and “Before” and “After” Public Knowledge and Disposal Practices:Champaign County. Urbana, IL: University of Illinois. Technical report preparedfor the Illinois Department of Energy and Natural Resources.
114

Lorton, Gregory A. 1988. “Waste Minimization in the Paint and Allied ProductsIndustry.” Journal of the Air Pollution Control Association, 38(4):422-427.
McHenry County Illinois Department of Solid Waste Management. 1991. PaintManagement and Disposal Guide. Distributed in cooperation with the IllinoisHazardous Waste Research and Information Center, Woodstock, Illinois.
Meade, Kathleen. 1990. “Keeping Alaska’s Waters Clean.” Waste Age. (July):95-100.
Meiorin, Emy Chan, and Gina Purin. 1989. “Discussion Paper on Household Paint.”Presented at the Association of Bay Area Governments Regional Workshop, June16, 1989.
Morgans, W. M. 1990. Outlines of Paint Technologies. Halsted Press.
National Paint and Coatings Association. 1989. Survey of Architectural Coating SalesVolume Marketed and Volatile Organic Compound (VOC) Content, 1987 and 1990.Washington, DC.
Office of the Federal Register. 1991. Code of Federal Regulations. Title 40, Section261.30 (40 CFR 261.30). Washington, DC: Government Printing Office.
Oldakowski, Raymond K. 1990. Survey Summary Report: 1988 Champaign CountyHousehold and Farm Hazardous Waste Collection Day. Champaign, Illinois:Survey Research Laboratory, University of Illinois at Champaign-Urbana.
Palmer, J.M. 1990. The 1990 Paint Red Book. Atlanta, GA: Communication Channels,I n c .
Perry, Lance G. 1989. Composition of Non-hazardous Special Waste Streams Generatedby Illinois Manufacturers. Savoy, IL: Hazardous Waste Research and InformationCenter, State Water Survey Division, Illinois Department of Natural Resources.February 6, 1989.
Peterson, Mark and Steve Young. 1989. Metal Finishing Guidebook and DirectoryIssue, 1989. 1988 and 1987 Summer Intern Project Reports for MnTAP (MinnesotaTechnical Assistance Program).
Rathje, William, D.C. Wilson, and W.W. Hughes. 1985. A Characterization ofHazardous Household Waste in Marin County, California. Oakland, CA:Association of Bay Area Governments.
Rauch, James. 1990. The Rauch Guide to the U.S. Paint Industry. Bridgewater, NJ:Rauch Associates, Inc.
Rogers, Everett M. 1983. The Diffusion of Innovation, 3rd ed. New York: The FreePress.
Roobol, Norman. 1990. “Coatings Application Forum.” Industrial Finishing Magazine,November.
Schrantz, J. 1990. “IQ Is for Real at Glidden.“Industrial Finishing 66(12).
SCS Engineers, Inc. 1987. Waste Audit Study, Automotive Paint Shops. CaliforniaDepartment of Health Services, January.
115

Seattle Solid Waste Utility. 1990a. “Latex Paint Final Report.” Prepared by Morley andAssociates, Seattle, Washington.
Seattle Solid Waste ‘Utility. 1990b. “Solvent-Based Paint Final Report.” Prepared byMorley and Associates, Seattle, Washington.
Spencer, Robert L. 1989. “Local Governments Take on Hazardous Waste Collection.”BioCycle. (March):42-43.
Stevens, Scot. 1990. “Powders Perpetual Progress.” Appliance, May.
Thomas Register. 1990. Thomas Publishing Co.
U.S.
U.S.
U.S.
U.S.
Air Force. 1987. “USAF PRAM Program: PRAM Project.” Flashlamp DepaintingSystem. Sacramento Air Logistics Center, McClellan Air Force Base, CA.
Bureau of the Census. 1987. Statistical Abstract of the United States: 1988.(108th edition). Washington, DC: Government Printing Office.
Department of Commerce, Bureau of the Census. 1990. Current Industrial ReportM28F, “Paint, Varnish, and Lacquer.” Washington, DC: Government PrintingOffice.
Environmental Protection Agency. 1991a. The Industrial Toxics Project, The 33/50Program: Forging an Alliance for Pollution Prevention. Washington, DC. EPA5 6 0 - l - 9 1 - 0 0 3 .
U.S. Environmental Protection Agency. 1991b. Pollution Prevention Fact Sheet.Washington, DC: Office of Pollution Prevention. March.
U.S. Environmental Protection Agency. 1991c. Toxic Release Inventory (TRI).Database prepared by the Office of Toxic Substances, Research Triangle Park,North Carolina.
U.S. Environmental Protection Agency. 199Oa Guides to Pollution PreventiotiThePaint Manufacturing Industry. Cincinnati, OH. EPA/625/7-90/005.
U.S. Environmental Protection Agency. 1990b. National Survey of Hazardous WasteGenerators (Generator Survey). Database prepared by the Office of Solid Waste,Research Triangle Park, North Carolina.
U.S. Environmental Protection Agency. 1988. The Solid Waste Dilemma: An Agendafor Action. Appendices A-B-C. Draft report prepared by the Municipal SolidWaste Task Force, Office of Solid Waste. September.
U.S. Environmental Protection Agency. 1986. Technical Resource Document:Treatment Technologies for Solvent Containing Wastes. EPA/600/2-86/095.
Washington State Department of Ecology. 1989. Success Through Waste Reduction:Proven Techniques From Washington Businesses. Seattle, Washington.
Waste Advantage, Inc. 1988. Industrial Waste Prevention: Guide to Developing anEffective Waste Minimization Program.
116
GLOSSARY
ABAG. Association of Bay Area Governments.
AHAG. Ad Hoc Advisory Group.
Additive. Any substance added in small quantities to another substance usually toimprove properties. Also sometimes called Modifier.
Airless Spraying. Process of atomization of paint by forcing it through an orifice at highpressure. This effect is often aided by the vaporization of the solvents, especially if thepaint has been previously heated. The term is not generally applied to those electrostaticspraying processes which do not use air for atomization.
Aliphatic Solvents. Solvents composed primarily of straight-chain hydrocarbons;examples: kerosene, naphtha, mineral spirits. Aromatic hydrocarbon content may rangefrom less than 1% to about 35%.
Architectural Coatings. Coatings intended for application to interior or exteriorsurfaces of residential, commercial, institutional, or industrial buildings-as opposed toindustrial coatings. They are protective and decorative finishes applied at ambienttemperatures. These coatings are distributed through wholesale-retail channels andpurchased by the general public, painters, building contractors and others. Also calledTrade Sales Coatings.
Aromatic Solvents. Solvents made of compounds that contain an unsaturated ring ofcarbon atoms, typified by benzene’s structure. Xylene and toluene are aromatic solventsused in coatings.
Baghouse. Mechanical air handling system to collect and filter out airborne particulatesfrom the work environment. The separated particulate material is then deposited into acontainer (e.g., a 55-gallon drum) for further handling and disposal.
Binder. Nonvolatile portion of the liquid vehicle of a coating. It binds or cements thepigment particles together and the paint film as a whole to the material to which it isapplied.
CEG. Conditionally exempt generator.
CES. Cooperative Extension Service.
CFC. Chloroflouroarbons.
Chlorinated Solvent. An organic solvent that contains chlorine atoms as part of themolecular structure. For example, methylene chloride and 1,l,l-trichoroethane, the mostcommon, are used in aerosol spray containers and in traffic paint. See also HalogenatedSolvents.
Coating. (1) Generic term for paints, lacquers, enamels, printing inks, etc. (2) A liquid,liquefiable or mastic composition which is converted to a solid protective, decorative, orfunctional adherent film after application as a thin layer.
117
Coil Coating. Process wherein a continuous coil of metal is unwound, cleaned, surface-treated, coated, heat-cured, cooled, and coiled in one operation. The coated coil issubsequently unwound and formed into any number of products, such as house siding,Venetian blinds, and automotive and appliance parts.
Convertible Coating. Irreversible transformation of a coating after its film formation toa film insoluble in the solvent from which it was deposited. This can be effected byoxidation, thermal crosslinking or catalytic curing.
Deposition Efficiency. See Transfer Efficiency.
Dispersant. Additive that increases the stability of a suspension of powders (pigments)in a liquid medium. Also know as Dispersing Agent.
Dispersion, Pigment. Suspension of pigment particles uniformly in a medium such as apaint vehicle, plastic matrix, etc. The process of dispersing the pigment involves theseparation of individual pigment particles, and coating them with the medium.
Dispersion. Process of dispersing a dry powder (or pigments) in a liquid medium in sucha way that the individual particles of the powder become separated from one another andare reasonably evenly distributed throughout the entire liquid medium. The dispersionprocess can be segmented into three distinct phases. In practice, these stages overlap andoccur simultaneously rather than consecutively during the dispersion process. The threestages are: (1) wetting; (2) particle separation; and (3) stabilization. Wetting involvesreplacement of the pigment-air and pigment-moisture interface with the pigment-vehicleinterface. During the particle separation stage, reduction of pigment agglomerates andaggregates is affected. Development and maintenance of a homogeneous distribution ofpigment particles (aggregates) in the liquid media is achieved during the stabilizationstage. See also Dispersion, Pigment.
Electrostatic Spraying. Methods of application spraying in which an electrostaticpotential is created between the article to be coated and the atomized paint particles. Thecharged particles of paint are attracted to the article being painted and are there depositedand discharged. The electrostatic potential is used in some processes to aid theatomization of the paint.
Emulsion Paint. Paint, the vehicle of which is an emulsion of binder in water. Thebinder may be oil, oleoresinous varnish, resin or other emulsifiable binder. Not to beconfused with a latex paint in which the vehicle is a latex.
Enamel. Topcoat which is characterized by its ability to form a smooth surface;originally associated with a high gloss, but may also include lower degrees of gloss, i.e.,flat enamels.
ENR. Illinois Department of Energy and Natural Resources.
EPI. Environmental Purification Industries.
Extender (Pigment). A specific group of achromatic pigments of low refractive index(between 1.45 and 1.70) incorporated into a vehicle system whose refractive index is in arange of 1.5 to 1.6. Consequently, they do not contribute significantly to the hidingpower of paint. They are used in paint to: reduce cost, achieve durability, alterappearance (e.g., decrease in gloss), control rheology and influence other desirable
118
properties. If used at sufficiently high concentration, an extender may contribute dryhiding and increase reflectance.
FIFRA. Federal Insecticide, Fungicide, and Rodenticide Act.
Gloss. Subjective term used to describe the relative amount and nature of mirror-like(specular) reflection. Different types of gloss are frequently arbitrarily differentiated,such as sheen, distinctness-of-image gloss, etc. Trade practice recognizes the followingstages, in increasing order of gloss: Flat (or matte)-practically free from sheen, evenwhen viewed from oblique angles (usually less than 15 on 85. meter); Eggshell-usually20-35 on 60. meter; Full gloss-smooth and almost mirror-like surface when viewedfrom all angles, usually above 70 on 60. meter.
Grinding. Process by which pigment particles ate reduced in size, mechanically.
Halogenated Solvents. The solvents containing halogen (usually chlorine) haveimproved solvency compared with the hydrocarbons from which they are derived and inaddition flammability is reduced. Some of these are highly toxic, and precautions mustbe taken to avoid inhalation of their vapors. See also Chlorinated Solvents.
Hazardous Substance. A substance which, by reason of being explosive, flammable,poisonous, corrosive, oxidizing, or otherwise harmful, is likely to cause death or injury.Element or compound which, when discharged in any quantity, presents an imminent andsubstantial danger to the public health or welfare.
HCFC. Hydrchloroflourocarbons.
Heavy Metals. Metallic elements with high molecular weights generally toxic to plantand animal life. Examples: mercury, chromium, cadmium, arsenic, lead, etc.
High Solids Coatings. Usually paints with greater than 60% solids by volume areconsidered high-solids coatings, although the term is often applied to any coating thatmeets any of EPA’s Control Technique Guidelines. Formally, under California’s Rule66, a high-solids paint is one containing not less than 80% solids by volume.
HVLP. High-volume, low-pressure.
HWRIC. Hazardous Waste Research and Information Center.
IEPA. Illinois Environmental Protection Agency.
Industrial Finishes or Coatings. Coatings which are applied to factory-made articles(before or after fabrication), usually with the help of special techniques for applying anddrying-as opposed to trade sales paints. Also refereed to as (Industrial) ProductFinishes. See Architectural Coatings.
Industrial Maintenance Paints. High performance coatings which are formulated forthe purpose of heavy abrasion, water immersion, chemical, corrosion, temperature,electrical, or solvent resistance. See also Maintenance Paints.
Industrial Product Finishes. See Industrial Finishes or Coatings.
Lacquer. Coating composition which is based on synthetic thermoplastic film-formingmaterial dissolved in organic solvent and which dries primarily by solvent evaporation.
119

APPENDIX A
PAINT SURVEY QUESTIONNAIRES

I 11
I HAZARDOUS WASTE RESEARCH & INFORMATION CENTER $ ? b b y2
One East Hazelwood Drive zChampaign, Illinois 61820
c1
(217) 333-8940 f .“!.zy
Reducing and ManagingPaint-Related Wastes

PAINT APPLICATION AND REMOVAL 1
WHO IS CONDUCTING THIS SURVEY?
The Illinois Hazardous Waste Research and information Center (HWRIC), a division of the Department ofEnergy and Natural Resources. HWRIC is a non-regulatory agency providing technical assistance toIllinois industries. Research Triangle Institute has been hired by HWRIC to administer this survey on itsbehalf.
WHY IS HWRIC CONDUCTING THIS SURVEY?
The Illinois legislature directed the Department of Energy and Natural Resources to conduct a study todevelop
. “cost effective, environmentally sound, and technically feasible waste paint disposal options forsmall businesses...” and
. ‘aneffective public education program to inform small businesses and households about the bestavailable waste paint reduction and management options.”
This voluntary survey supports this legislatively-mandated study.
WHAT IS HWRIC GOING TO DO WITH THE RESULTS?
Information will be used to:
l design a program to provide you with the lnformation you need to reduce your paint wastegeneration, reduce your management costs, and properly dispose of your paint waste.
. make recommendations to the legislature about cost effective disposal options for waste paint.
WHO IS GOING TO SEE THE RESULTS?
HWRIC and its contractors. All responses are completety confidential and will be reported on anaggregate level only. No specific information about your facility will be reported.
AFTER COMPLETlNG THIS SURVEY:
Please return the completed questionnaire to Research Triangle Institute in the envelope provided.No postage is necessary. Please return the questionnaire no later than
WEDNESDAY, JULY 31
THANK YOU FOR YOUR HELP IN COMPLETlNG THIS STUDY.
A-3

2 PAINT APPLlCATlON AND REMOVAL
WHAT YOU NEED TO KNOW TO COMPLETE THIS SURVEY
1. Answer all questions for your facility. That is, just include operations at your location. If yourcompany has more than one location, please include information just for the location receiving thissurvey.
2. Paint is defined throughout this questionnaire to include paint and all related coatings, including, butnot limited to, varnishes, stains, lacquers, and enamels.
3. Paint related waste is any non-product output from your paint manufacturing, paint application, orpaint removal operations at your facility. This includes waste from paint inventories, from surfacepreparation prior to paint application, from cleaning painting equipment, and from air pollution controlfor your painting operations. Please report information before any recycling or treatment (e.g., reportthe quantity of spent solvents before any solvent recovery).
4. If you don’t know the answer to any question, please enter “DK” for “don’t know” in the blank forthe question. If a question is not applicable to the operations at your facility, please enter “NA” for“not applicable” in the blank for the question.
5. The last page of this booklet has space for any comments or explanations you wish to provide. Ifyou have a comment that applies to a particular question in this survey, please include the questionnumber in your comments.
What are the paint-related activities currently at this facility?
(Please circle one number corresponding to your answer.)
Applicable Parts of the Questionnaire
01 Applying paint on/y Please complete Parts A, B, D, and E
02 Removing paint only Please complete Parts A, C, D, and E
03 Applying and removing paint Please complete Parts A, B, C, D, and E
04 This facility does not apply or remove paint Please complete Part E
A-4
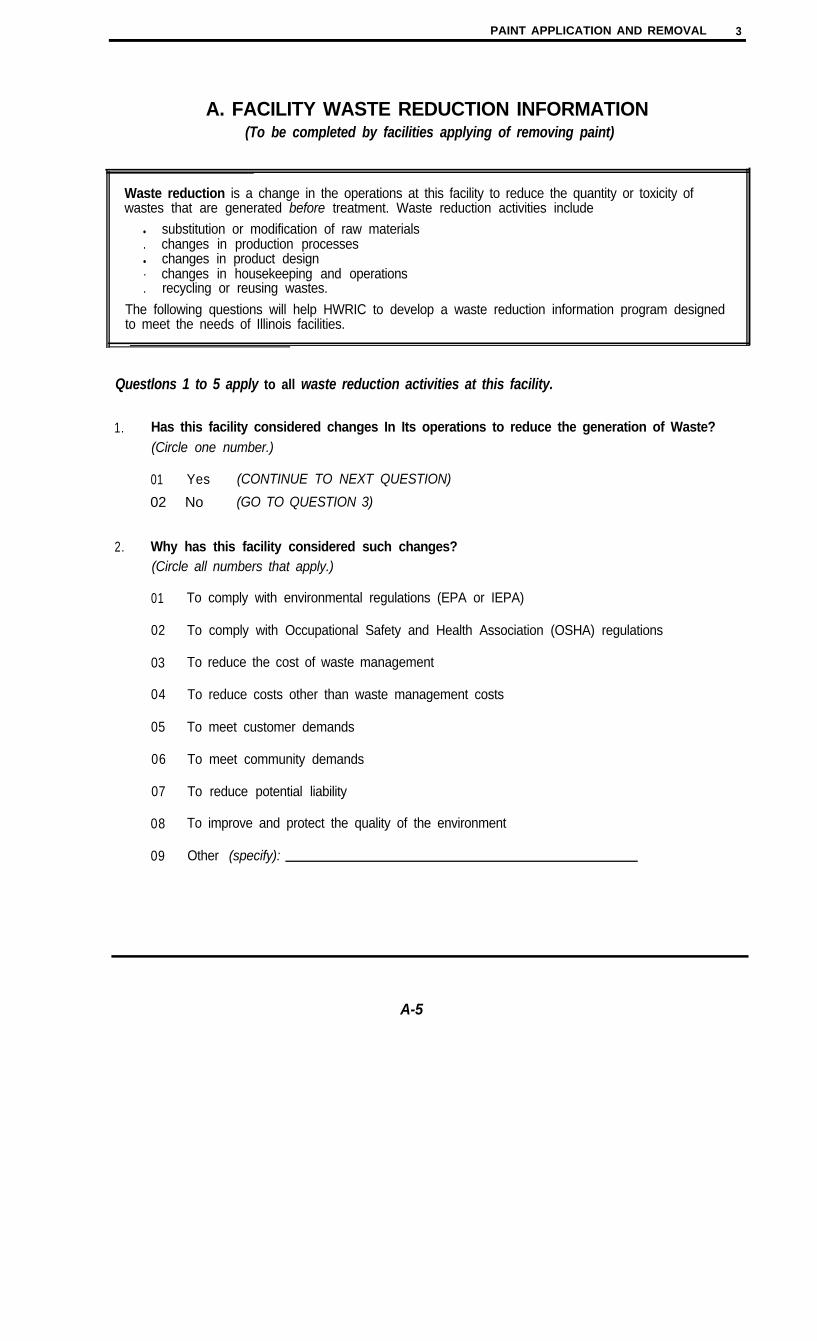
PAINT APPLICATION AND REMOVAL 3
A. FACILITY WASTE REDUCTION INFORMATION(To be completed by facilities applying of removing paint)
Waste reduction is a change in the operations at this facility to reduce the quantity or toxicity ofwastes that are generated before treatment. Waste reduction activities include
l substitution or modification of raw materials. changes in production processesl changes in product design. changes in housekeeping and operations. recycling or reusing wastes.
The following questions will help HWRIC to develop a waste reduction information program designedto meet the needs of Illinois facilities.
Questlons 1 to 5 apply to all waste reduction activities at this facility.
1.
2.
Has this facility considered changes In Its operations to reduce the generation of Waste?(Circle one number.)
01 Yes (CONTINUE TO NEXT QUESTION)
02 No (GO TO QUESTION 3)
Why has this facility considered such changes?(Circle all numbers that apply.)
01 To comply with environmental regulations (EPA or IEPA)
02 To comply with Occupational Safety and Health Association (OSHA) regulations
03 To reduce the cost of waste management
04 To reduce costs other than waste management costs
05 To meet customer demands
06 To meet community demands
07 To reduce potential liability
08 To improve and protect the quality of the environment
09 Other (specify):
A-5
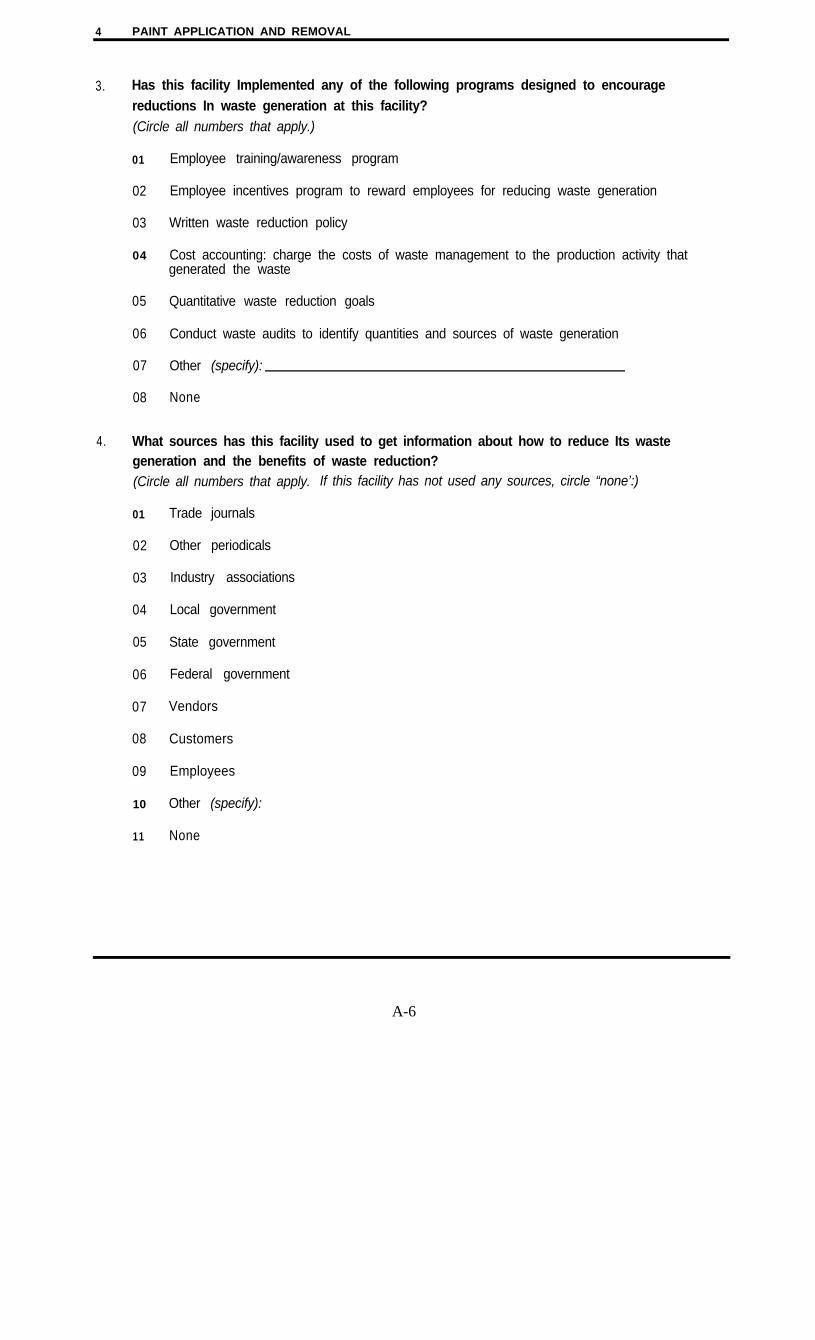
4 PAINT APPLICATION AND REMOVAL
3. Has this facility Implemented any of the following programs designed to encouragereductions In waste generation at this facility?(Circle all numbers that apply.)
01 Employee training/awareness program
02 Employee incentives program to reward employees for reducing waste generation
03 Written waste reduction policy
04 Cost accounting: charge the costs of waste management to the production activity thatgenerated the waste
05 Quantitative waste reduction goals
06 Conduct waste audits to identify quantities and sources of waste generation
07 Other (specify):
08 None
4. What sources has this facility used to get information about how to reduce Its wastegeneration and the benefits of waste reduction?(Circle all numbers that apply. If this facility has not used any sources, circle “none’:)
01 Trade journals
02 Other periodicals
03 Industry associations
04 Local government
05 State government
06 Federal government
07 Vendors
08 Customers
09 Employees
10 Other (specify):
11 None
A-6
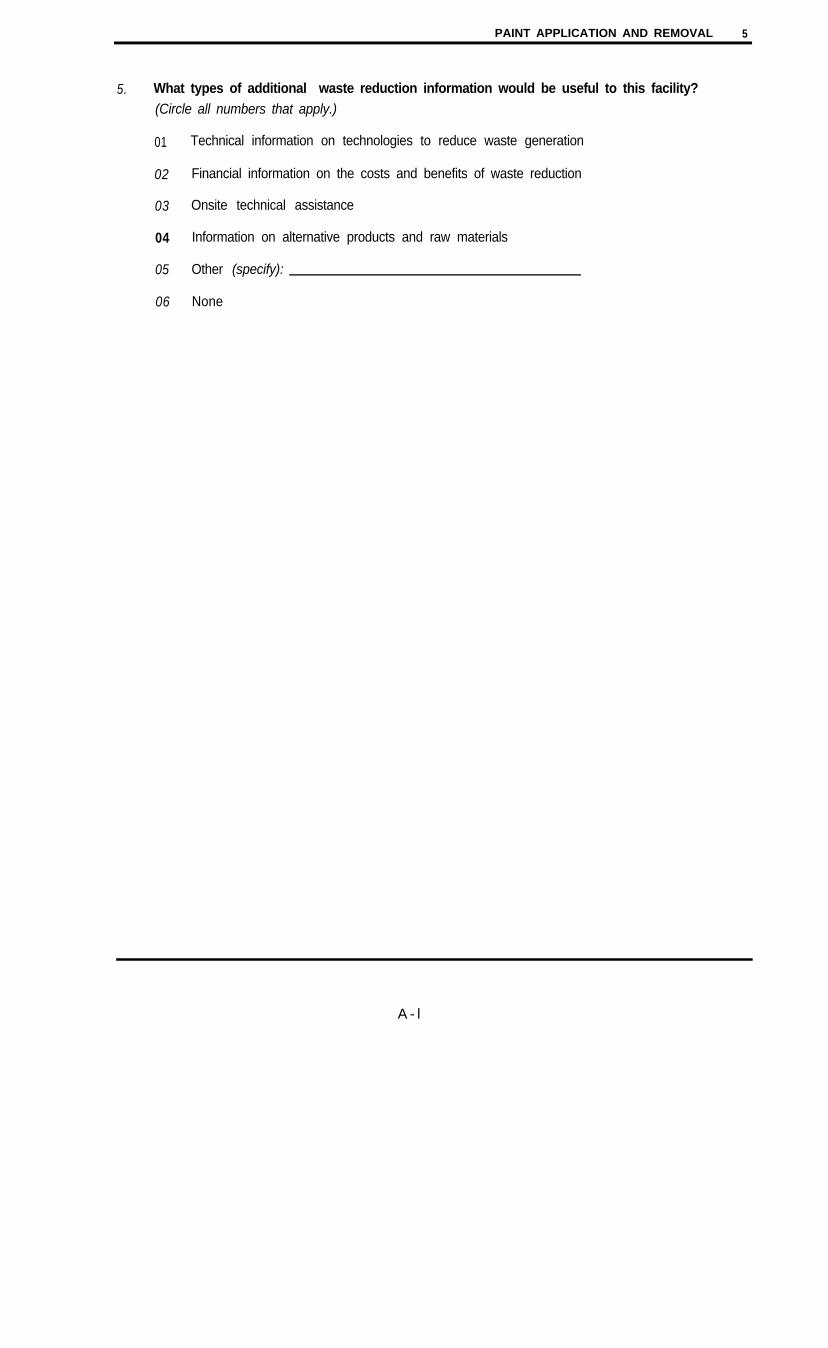
PAINT APPLICATION AND REMOVAL 5
5. What types of additional waste reduction information would be useful to this facility?(Circle all numbers that apply.)
01 Technical information on technologies to reduce waste generation
02 Financial information on the costs and benefits of waste reduction
03 Onsite technical assistance
04 Information on alternative products and raw materials
05 Other (specify):
06 None
A - l
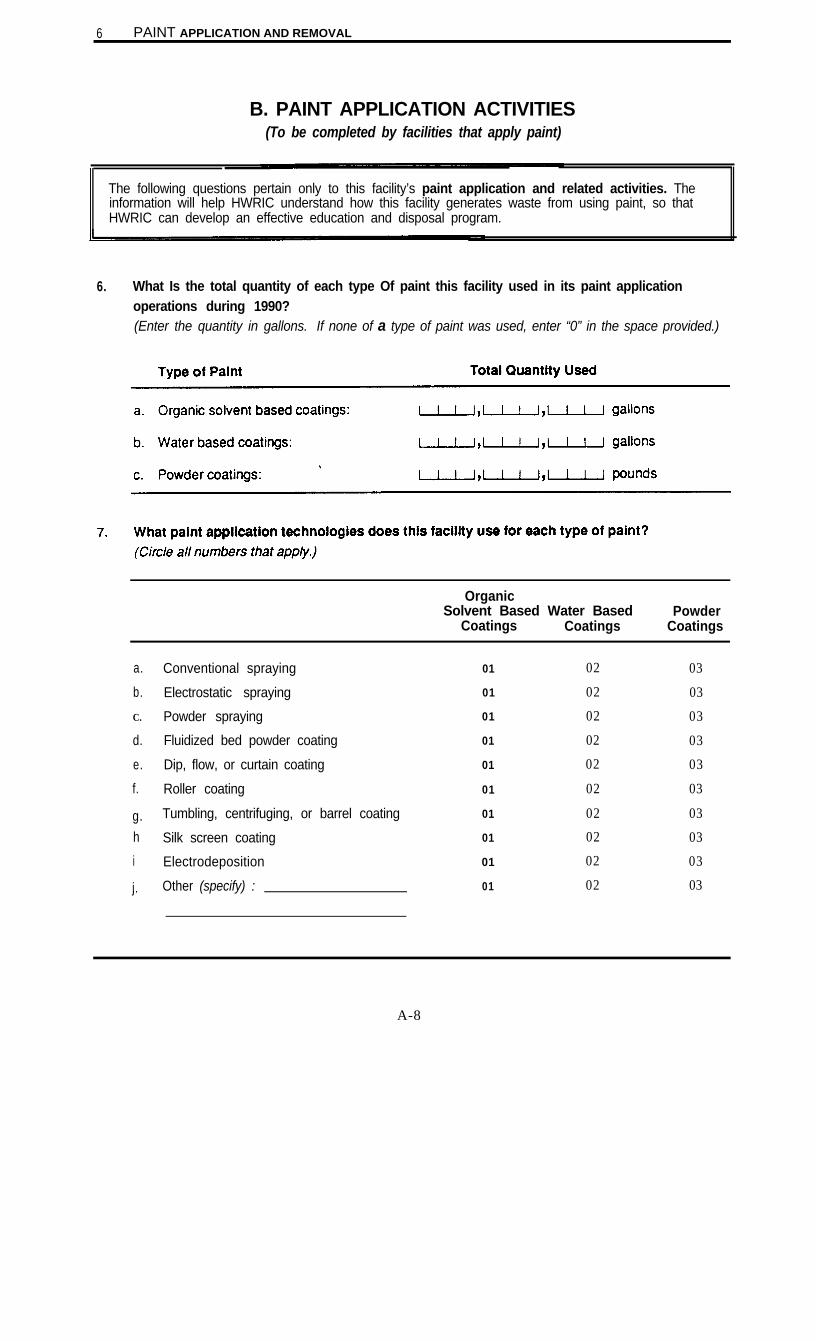
6 PAINT APPLICATION AND REMOVAL
B. PAINT APPLICATION ACTIVITIES(To be completed by facilities that apply paint)
The following questions pertain only to this facility’s paint application and related activities. Theinformation will help HWRIC understand how this facility generates waste from using paint, so thatHWRIC can develop an effective education and disposal program.
6. What Is the total quantity of each type Of paint this facility used in its paint applicationoperations during 1990?(Enter the quantity in gallons. If none of a type of paint was used, enter “0” in the space provided.)
OrganicSolvent Based Water Based
Coatings CoatingsPowder
Coatings
a.
b.
C.
d.
e.
f.
g.
h
i
j.
Conventional spraying
Electrostatic spraying
Powder spraying
Fluidized bed powder coating
Dip, flow, or curtain coating
Roller coating
Tumbling, centrifuging, or barrel coating
Silk screen coating
Electrodeposition
Other (specify) :
01
01
01
01
01
01
01
01
01
01
02
02
02
02
02
02
02
02
02
02
03
03
03
03
03
03
03
03
03
03
A-8

PAINT APPLlCATlON AND REMOVAL 7

8 PAINT APPLICATION AND REMOVAL
9. Does this facility measure the paint transfer efficiency for the paint application techniques ituses? The transfer efficiency is the quantity of paint that coats the surface divided by thetotal quantity of paint used.(Circle one number.)
01 YES, for all application techniques used
02 YES, for some application techniques used
03 NO, we do not measure the transfer efficiency of any application techniques
04 Don’t know
10. What kinds of surface preparation does this facility do prior to painting?(Circle all numbers that apply.)
01 Physical abrasion
02 Organic solvent cleaning
03 Alkaline or acid cleaning
04 Water cleaning
05 Phosphate or similar conversion coating
06 Other (specify):
07 None
08 Don’t know
11. After applying a batch of paint, how does this facility clean its application equipment?(Circle all numbers that apply.)
01 Virgin organic solvents
02 Recovered or recycled organic solvents
03 Alkaline solutions
04 Water
05 Other (specify.):
06 Equipment is not cleaned between batches
07 Don’t know
A-10
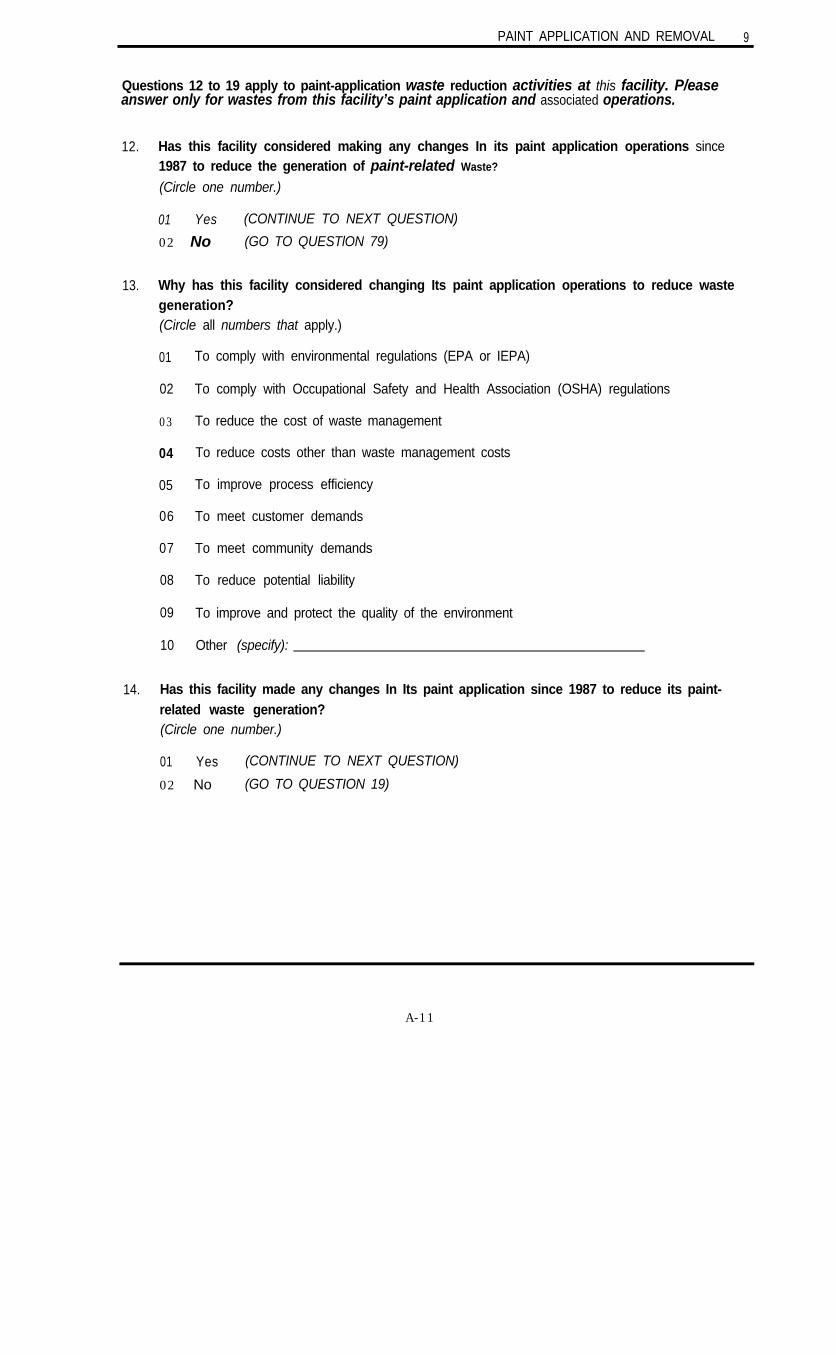
PAINT APPLICATION AND REMOVAL 9
Questions 12 to 19 apply to paint-application waste reduction activities at this facility. P/easeanswer only for wastes from this facility’s paint application and associated operations.
12. Has this facility considered making any changes In its paint application operations since1987 to reduce the generation of paint-related Waste?
(Circle one number.)
01 Yes (CONTINUE TO NEXT QUESTION)
02 No (GO TO QUESTlON 79)
13. Why has this facility considered changing Its paint application operations to reduce wastegeneration?(Circle all numbers that apply.)
01 To comply with environmental regulations (EPA or IEPA)
02 To comply with Occupational Safety and Health Association (OSHA) regulations
03 To reduce the cost of waste management
04 To reduce costs other than waste management costs
05 To improve process efficiency
06 To meet customer demands
07 To meet community demands
08 To reduce potential liability
09 To improve and protect the quality of the environment
10 Other (specify):
14. Has this facility made any changes In Its paint application since 1987 to reduce its paint-related waste generation?(Circle one number.)
01 Yes
02 No
(CONTINUE TO NEXT QUESTION)
(GO TO QUESTION 19)
A-11
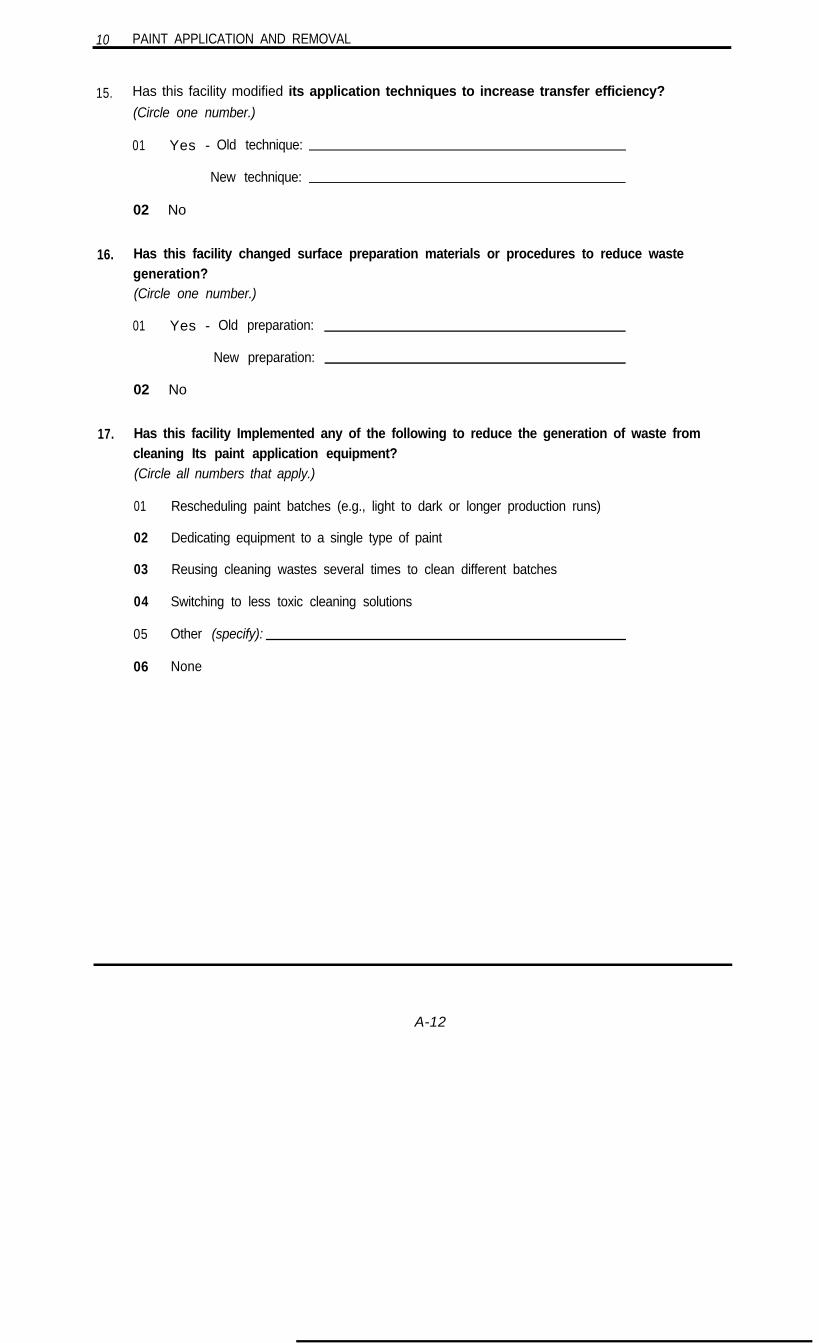
10 PAINT APPLICATION AND REMOVAL
15. Has this facility modified its application techniques to increase transfer efficiency?
(Circle one number.)
01 Yes - Old technique:
New technique:
02 No
16. Has this facility changed surface preparation materials or procedures to reduce wastegeneration?(Circle one number.)
01 Yes - Old preparation:
New preparation:
02 No
17. Has this facility Implemented any of the following to reduce the generation of waste fromcleaning Its paint application equipment?(Circle all numbers that apply.)
01 Rescheduling paint batches (e.g., light to dark or longer production runs)
02 Dedicating equipment to a single type of paint
03 Reusing cleaning wastes several times to clean different batches
04 Switching to less toxic cleaning solutions
05 Other (specify):
06 None
A-12
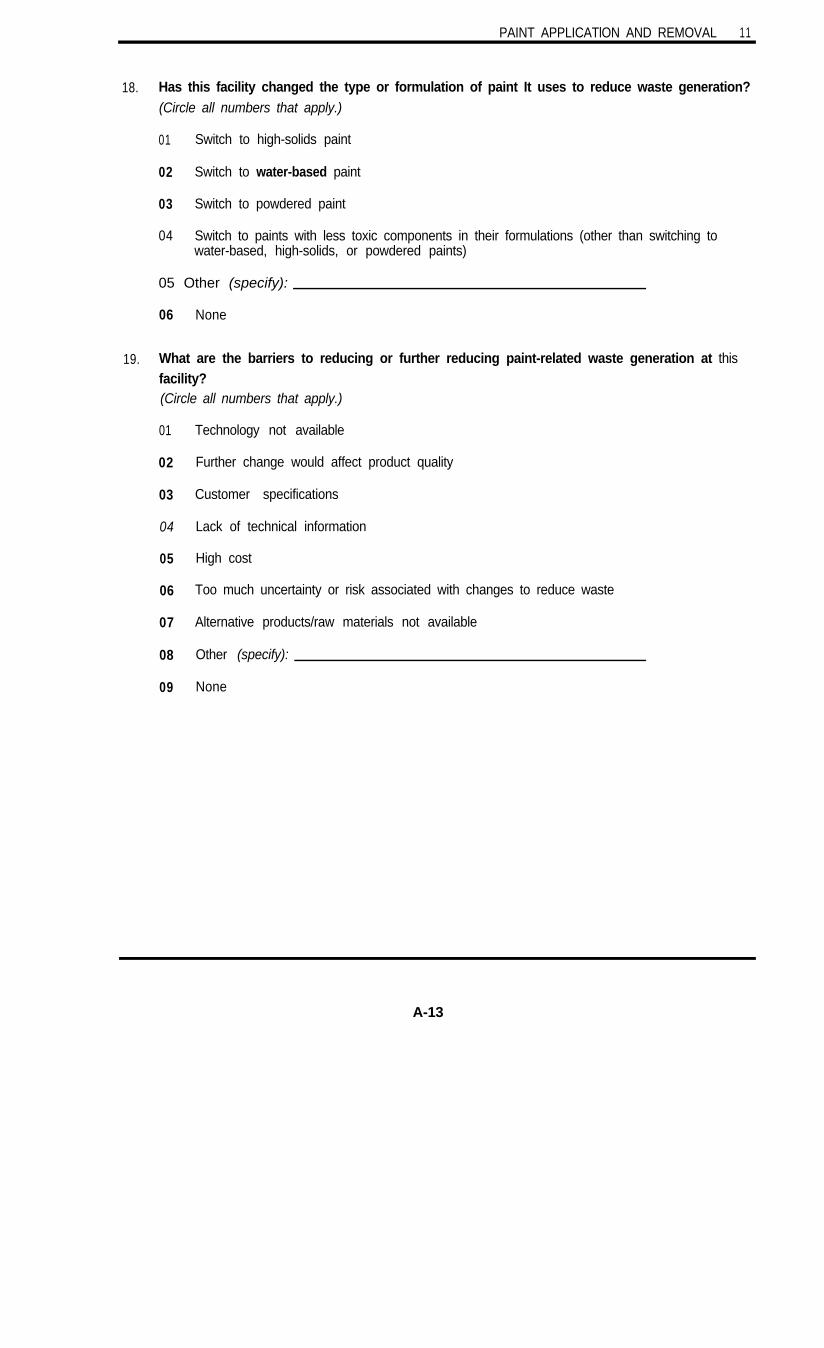
PAINT APPLICATlON AND REMOVAL 11
18.
19.
Has this facility changed the type or formulation of paint It uses to reduce waste generation?(Circle all numbers that apply.)
01 Switch to high-solids paint
02 Switch to water-based paint
03 Switch to powdered paint
04 Switch to paints with less toxic components in their formulations (other than switching towater-based, high-solids, or powdered paints)
05 Other (specify):
06 None
What are the barriers to reducing or further reducing paint-related waste generation at thisfacility?(Circle all numbers that apply.)
01
02
03
04
05
06
07
08
09
Technology not available
Further change would affect product quality
Customer specifications
Lack of technical information
High cost
Too much uncertainty or risk associated with changes to reduce waste
Alternative products/raw materials not available
Other (specify):
None
A-13
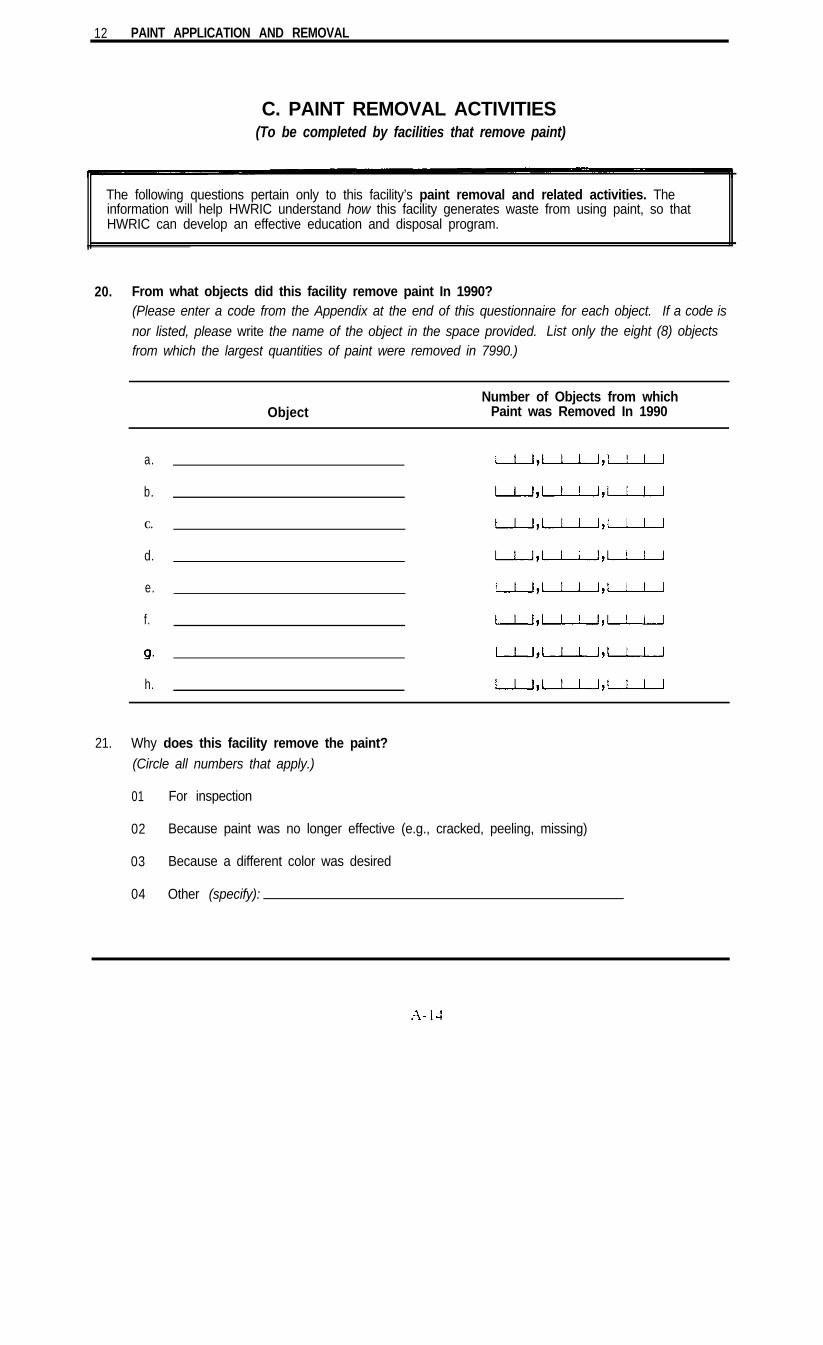
12 PAINT APPLICATION AND REMOVAL
C. PAINT REMOVAL ACTIVITIES(To be completed by facilities that remove paint)
The following questions pertain only to this facility’s paint removal and related activities. Theinformation will help HWRIC understand how this facility generates waste from using paint, so thatHWRIC can develop an effective education and disposal program.
20. From what objects did this facility remove paint In 1990?(Please enter a code from the Appendix at the end of this questionnaire for each object. If a code isnor listed, please write the name of the object in the space provided. List only the eight (8) objectsfrom which the largest quantities of paint were removed in 7990.)
ObjectNumber of Objects from which
Paint was Removed In 1990
a.
b.
C.
d.
e.
f.
h.
21. Why does this facility remove the paint?(Circle all numbers that apply.)
01 For inspection
02 Because paint was no longer effective (e.g., cracked, peeling, missing)
03 Because a different color was desired
04 Other (specify):
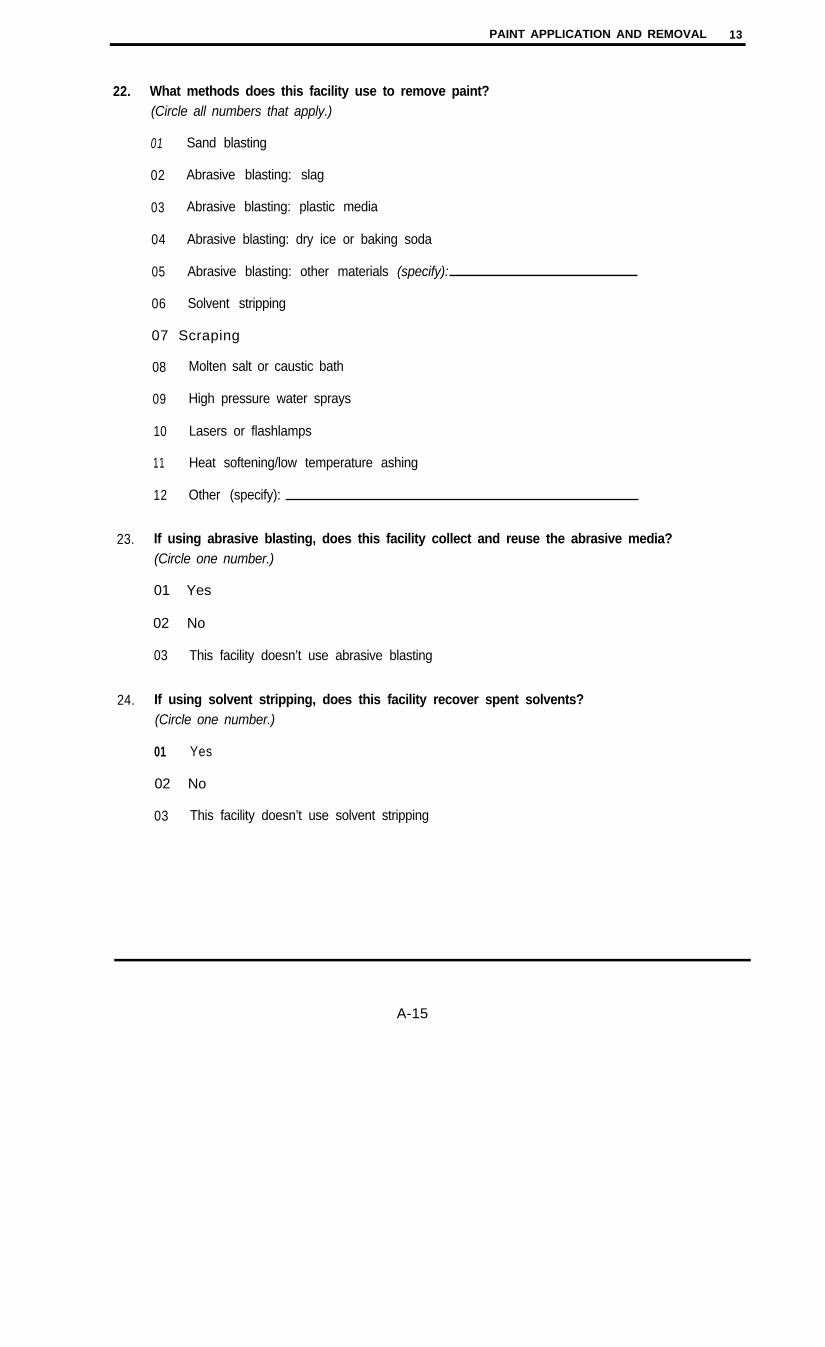
PAINT APPLICATION AND REMOVAL 13
22. What methods does this facility use to remove paint?(Circle all numbers that apply.)
01 Sand blasting
02 Abrasive blasting: slag
03 Abrasive blasting: plastic media
04 Abrasive blasting: dry ice or baking soda
05 Abrasive blasting: other materials (specify):
06 Solvent stripping
07 Scraping
08 Molten salt or caustic bath
09 High pressure water sprays
10 Lasers or flashlamps
11 Heat softening/low temperature ashing
12 Other (specify):
23. If using abrasive blasting, does this facility collect and reuse the abrasive media?(Circle one number.)
01 Yes
02 No
03 This facility doesn’t use abrasive blasting
24. If using solvent stripping, does this facility recover spent solvents?(Circle one number.)
01 Yes
02 No
03 This facility doesn’t use solvent stripping
A-15
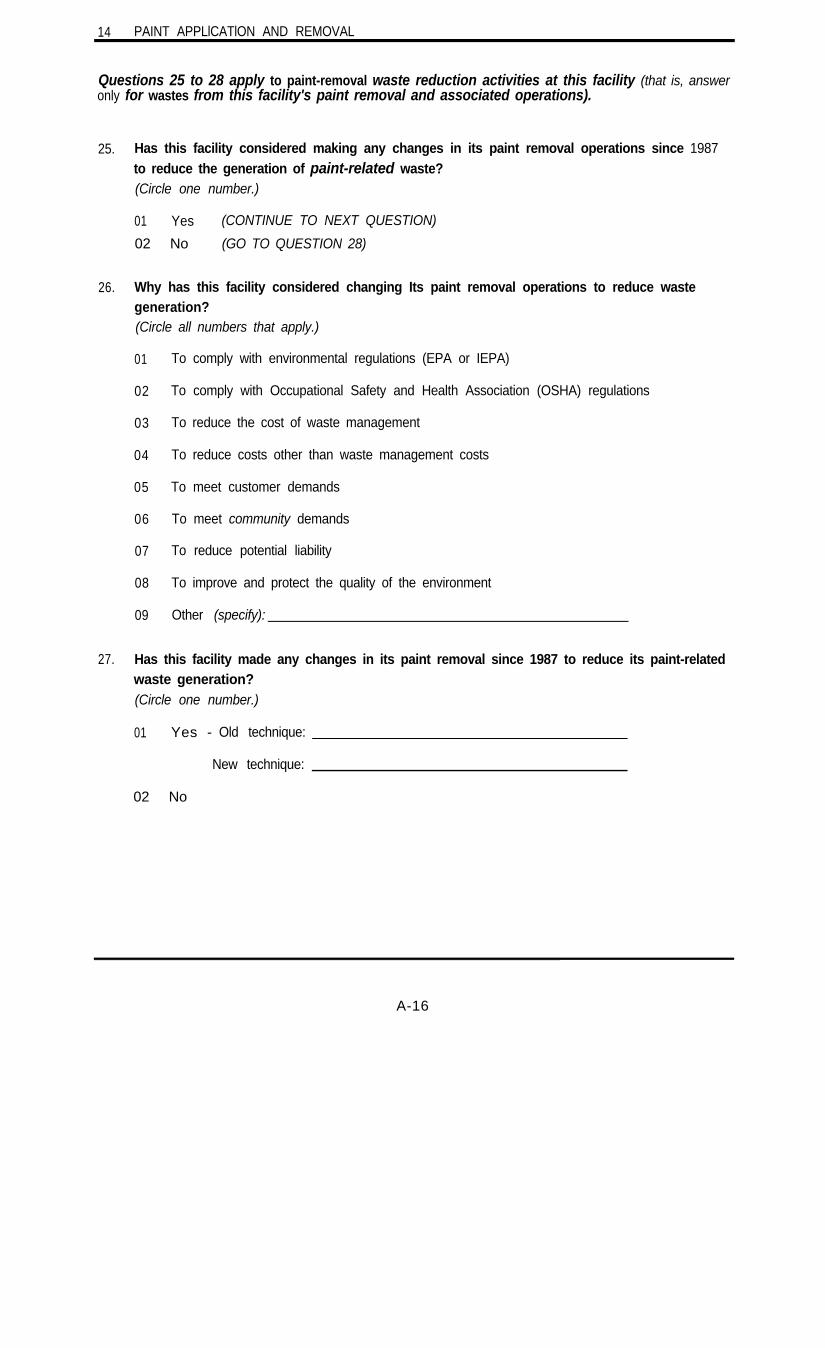
14 PAINT APPLlCATlON AND REMOVAL
Questions 25 to 28 apply to paint-removal waste reduction activities at this facility (that is, answeronly for wastes from this facility's paint removal and associated operations).
25. Has this facility considered making any changes in its paint removal operations since 1987to reduce the generation of paint-related waste?(Circle one number.)
01 Yes (CONTINUE TO NEXT QUESTION)
02 No (GO TO QUESTION 28)
26. Why has this facility considered changing Its paint removal operations to reduce wastegeneration?(Circle all numbers that apply.)
01
02
03
04
05
06
07
08
09
To comply with environmental regulations (EPA or IEPA)
To comply with Occupational Safety and Health Association (OSHA) regulations
To reduce the cost of waste management
To reduce costs other than waste management costs
To meet customer demands
To meet community demands
To reduce potential liability
To improve and protect the quality of the environment
Other (specify):
27. Has this facility made any changes in its paint removal since 1987 to reduce its paint-relatedwaste generation?(Circle one number.)
01 Yes - Old technique:
New technique:
02 No
A-16

PAINT APPLlCATlON AND REMOVAL 15
28. What are the barriers to reducing or further reducing paint-related waste generation at thisfacility?(Circle all numbers that apply.)
01
02
03
04
05
06
07
08
09
Technology not available
Further change would affect product quality
Customer specifications
Lack of technical information
High cost
Too much uncertainty or risk associated with changes to reduce waste
Alternative products/raw materials not available
Other (specify):
None
A-17

16 PAINT APPLICATION AND REMOVAL
D. WASTE GENERATION AND MANAGEMENT(To be completed by facilities that apply of remove paint)
The following questions pertain to this facility’s paint application, removal, and related activities.The information will help HWRIC understand the types and quantities of paint-related waste thisfacility generates, so that HWRIC can develop cost effective disposal options.
Please note that where the following questions ask for quantity information, you have the optionof reporting the quantities in tons or gallons. Please circle the unit of measure you used for eachquantity reported.
29. What is the quantity of waste from paint application, removal, and related operationsentering each of the following management processes onsite during 1990?(For each type of waste management, enter the quantity of paint-related waste managed using thatactivity onsite (at this facility) and circle the appropriate unit of measure.)
A-18

30. What Is the quantity of waste from paint application, removal, and related operations entering each of the following managementprocesses off site during 1990? What Is the cost for offsite waste management?(Enter the quantity of paint-related waste managed using each activity offsite (at another location) in 1990 and the typical charge for thewaste management (dollars per ton or dollars per gallon). Circle the unit of measure used for the quantity and for the cost.)
Cost per Unit Unit of Measure
Waste Management Processes Offsite Quantity (tons or gallons) Tons Gallons
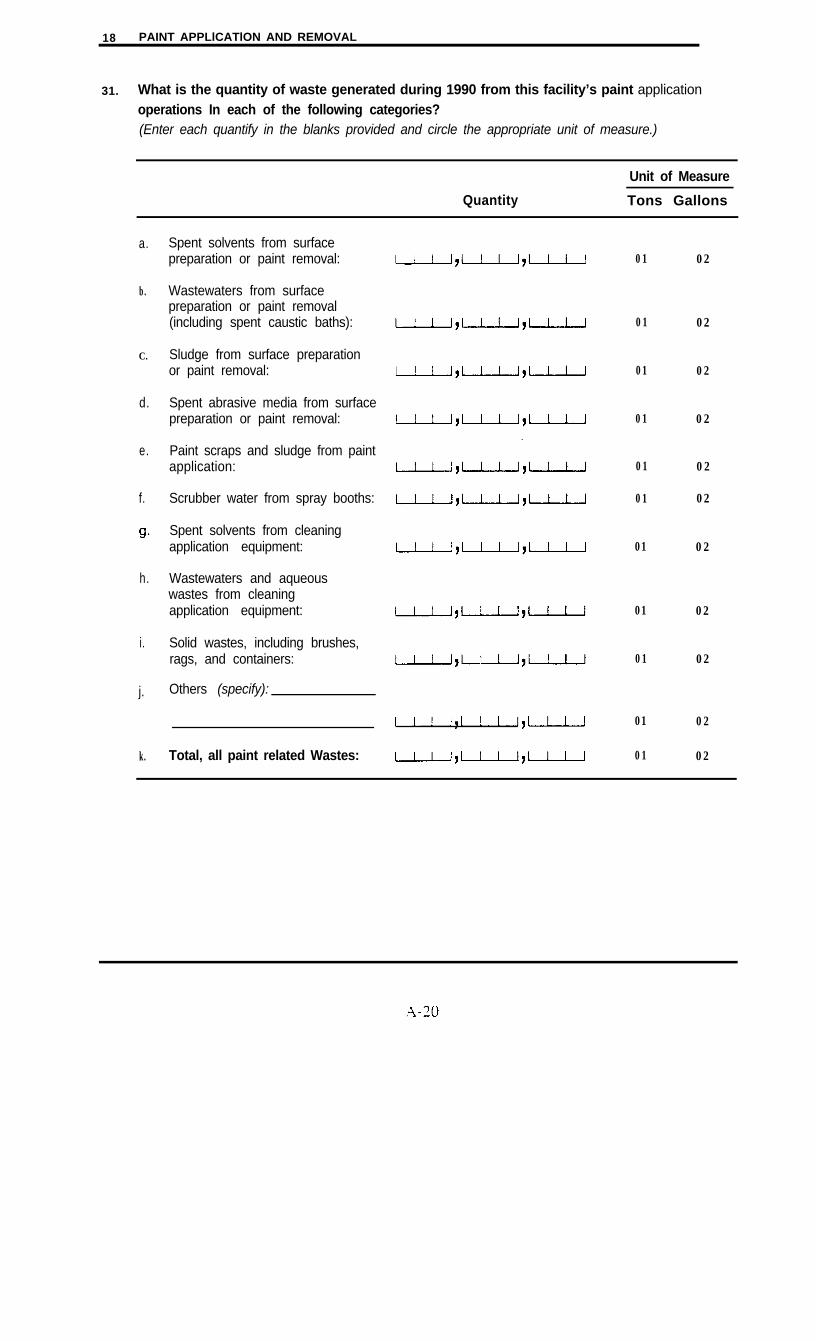
18 PAINT APPLlCATlON AND REMOVAL
31. What is the quantity of waste generated during 1990 from this facility’s paint applicationoperations In each of the following categories?(Enter each quantify in the blanks provided and circle the appropriate unit of measure.)
Unit of Measure
Quantity Tons Gallons
a. Spent solvents from surfacepreparation or paint removal:
b. Wastewaters from surfacepreparation or paint removal(including spent caustic baths):
C. Sludge from surface preparationor paint removal:
d. Spent abrasive media from surfacepreparation or paint removal:
e. Paint scraps and sludge from paintapplication:
f. Scrubber water from spray booths:
Spent solvents from cleaningapplication equipment:
h. Wastewaters and aqueouswastes from cleaningapplication equipment:
i. Solid wastes, including brushes,rags, and containers:
j. Others (specify):
k. Total, all paint related Wastes:
01
01
01
01
01
01
01
01
01
01
01
02
02
02
02
02
02
02
02
02
02
02
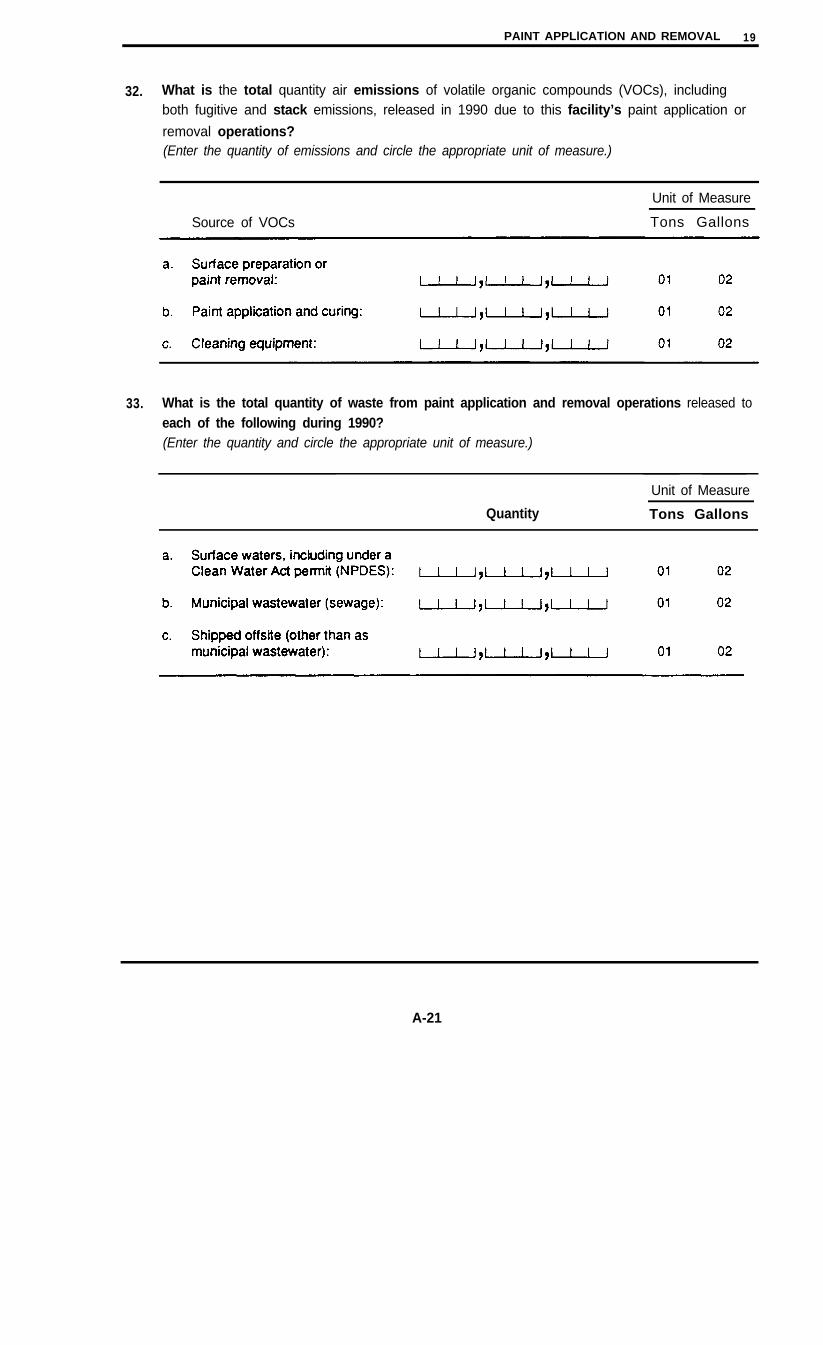
PAINT APPLlCATlON AND REMOVAL 19
32. What is the total quantity air emissions of volatile organic compounds (VOCs), includingboth fugitive and stack emissions, released in 1990 due to this facility’s paint application or
removal operations?(Enter the quantity of emissions and circle the appropriate unit of measure.)
Source of VOCs
Unit of Measure
Tons Gallons
33. What is the total quantity of waste from paint application and removal operations released toeach of the following during 1990?(Enter the quantity and circle the appropriate unit of measure.)
Unit of Measure
Quantity Tons Gallons
A-21

22 PAINT APPLICATION AND REMOVAL
APPENDIX: CODES FOR OBJECTS PAINTED OR FROM WHICHPAINT IS REMOVED
These codes are to be used to complete Question 8 (Part B) and Question 20 (Part C). If this facilityapplied paint to or removed paint from an object not listed here, please write the name of the object inthe space provided.
Code Description
21 individual homes22 commercial buildings23 architectural: other24 wood cabinets25 wood furniture26 other wood products27 metal furniture28 metal cans29 metal barrels or drums30 s h e e t m e t a l 31 metal stampings32 machined or molded metal components33 farm machinery34 construction machinery35 industrial blowers, air conditioning, or heating equipment36 household appliances37 automobile bodies38 truck bodies39 automobile parts40 railroad equipment
A-24

PAINT APPLICATION AND REMOVAL 23
COMMENTS AND EXPLANATIONS
HWRIC is interested in any comments you may have about this questionnaire or this study in general.Please use the space provided below to make any relevant comments. If commenting on or explainingyour response to a particular question in this questionnaire, please reference the question number.
QuestlonNumber Comment/Explanation
A-25

A-26

IPAINT MANUFACTURING 1
WHO IS CONDUCTING THIS SURVEY?
The Illinois Hazardous Waste Research and Information Center (HWRIC), a division of the Department ofEnergy and Natural Resources. HWRIC is a non-regulatory agency providing technical assistance toIllinois industries. Research Triangle Institute has been hired by HWRIC to administer this survey on itsbehalf.
WHY IS HWRIC CONDUCTING THIS SURVEY?
The Illinois legislature directed the Department of Energy and Natural Resources to conduct a study todevelop
. “cost effective, environmentally sound, and technically feasible waste paint disposal options forsmall businesses...” and
. “an effective public education program to inform small businesses and households about the bestavailable waste paint reduction and management options.”
This voluntary survey supports this legislatively-mandated study.
WHAT IS HWRIC GOING TO DO WlTH THE RESULTS?
Information will be used to:
l design a program to provide you with the information you need to reduce your paint wastegeneration, reduce your management costs, and properly dispose of your paint waste.
l make recommendations to the legislature about cost effective disposal options for waste paint.
WHO IS GOING TO SEE THE RESULTS?
HWRIC and its contractors. All responses are completely confidential and will be reported on anaggregate level only. No specific Information about your facility will be reported.
AFTER COMPLETING THIS SURVEY:
Please return the completed questionnaire to Research Triangle Institute in the envelope provided.No postage is necessary. Please return the questionnaire no later than
WEDNESDAY, JULY 31
THANK YOU FOR YOUR HELP IN COMPLETING THIS STUDY.
A-27

WHAT YOU NEED TO KNOW TO COMPLETE THIS SURVEY
1. Answer all questions for your facility. That is, just include operations at your location. If yourcompany has more than one location, please include information just for the location receiving thissurvey.
2. Paint is defined throughout this questionnaire to include paint and all related coatings, including, butnot limited to, varnishes, stains, lacquers, and enamels.
3. Paint related waste is any non-product output from your paint manufacturing, paint application, orpaint removal operations at your facility. This includes waste from paint inventories, from surfacepreparation prior to paint application, from cleaning painting equipment, and from air pollution controlfor your painting operations. Please report information before any recycling or treatment (e.g., reportthe quantity of spent solvents before any solvent recovery).
4. If you don’t know the answer to any question, please enter “DK” for “don’t know” in the blank forthe question. If a question is not applicable to the operations at your facility, please enter “NA” for“not applicable” in the blank for the question.
5. The last page of this booklet has space for any comments or explanations you wish to provide. Ifyou have a comment that applies to a particular question in this survey, please include the questionnumber in your comments.
A-28
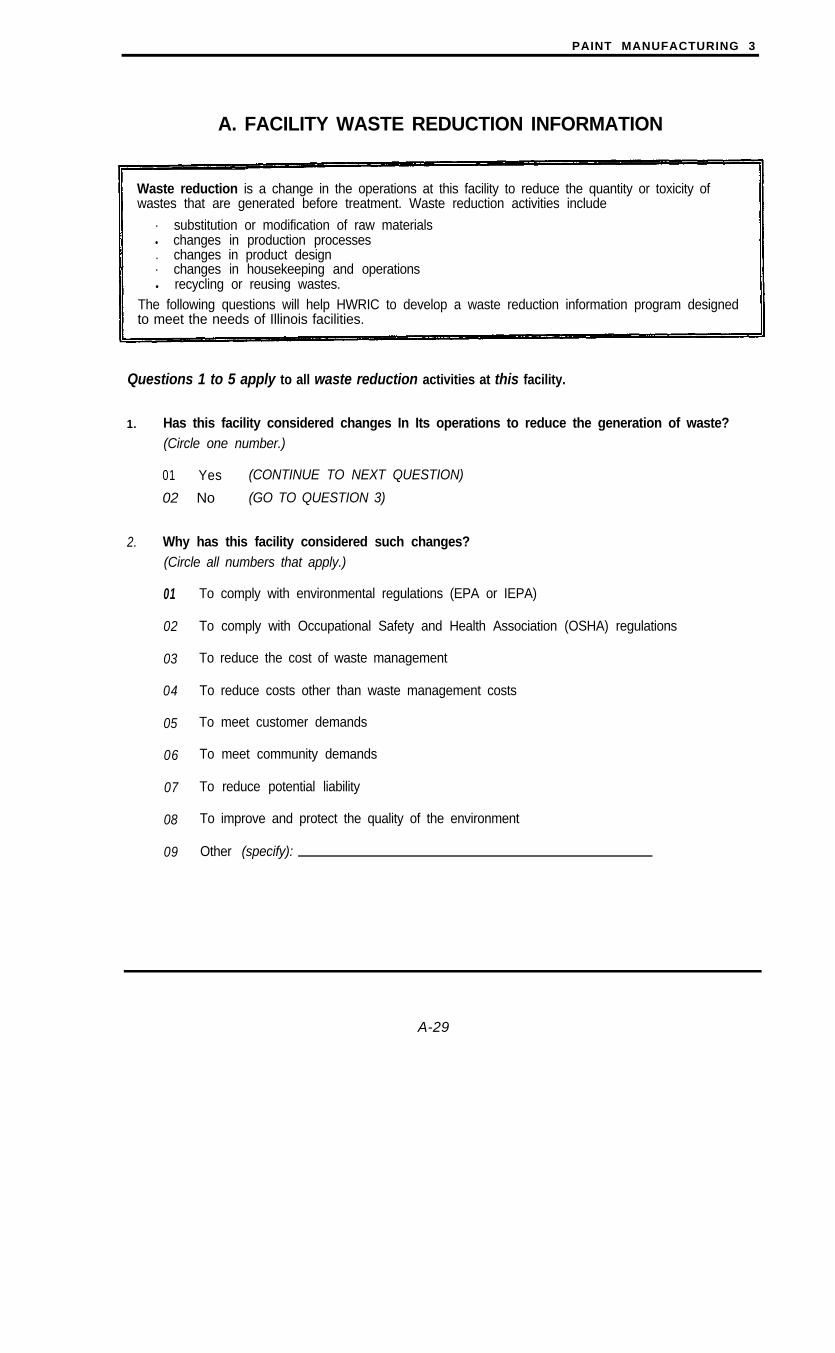
PAINT MANUFACTURING 3
A. FACILITY WASTE REDUCTION INFORMATION
Waste reduction is a change in the operations at this facility to reduce the quantity or toxicity ofwastes that are generated before treatment. Waste reduction activities include
. substitution or modification of raw materialsl changes in production processes. changes in product design. changes in housekeeping and operationsl recycling or reusing wastes.
The following questions will help HWRIC to develop a waste reduction information program designedto meet the needs of Illinois facilities.
Questions 1 to 5 apply to all waste reduction activities at this facility.
1. Has this facility considered changes In Its operations to reduce the generation of waste?(Circle one number.)
01 Yes (CONTINUE TO NEXT QUESTION)
02 No (GO TO QUESTION 3)
01
02
03
04
05
06
07
08
09
2. Why has this facility considered such changes?(Circle all numbers that apply.)
To comply with environmental regulations (EPA or IEPA)
To comply with Occupational Safety and Health Association (OSHA) regulations
To reduce the cost of waste management
To reduce costs other than waste management costs
To meet customer demands
To meet community demands
To reduce potential liability
To improve and protect the quality of the environment
Other (specify):
A-29

4 PAINT MANUFACTURING
3. Has this facility Implemented any of the following programs designed to encouragereductions In waste generation at this facility?(Circle all numbers fhat apply.)
01 Employee training/awareness program
02 Employee incentives program to reward employees for reducing waste generation
03 Written waste reduction policy
04 Cost accounting: charge the costs of waste management to the production activity thatgenerated the waste
05 Quantitative waste reduction goals
06 Conduct waste audits to identify quantities and sources of waste generation
07 Other (specify):
08 None
4. What sources has this facility used to get Information about how to reduce Its wastegeneration and the benefits of waste reduction?(Circle all numbers that apply. If this facility has not used any sources, circle *none”.)
01 Trade journals
02 Other periodicals
03 Industry associations
04 Local government
05 State government
06 Federal government
07 Vendors
08 Customers
09 Employees
10 Other (specify):
11 None
A-30

PAINT MANUFACTURING 5
5. What types of additional waste reduction Information would be useful to this facility?(Circle all numbers that apply.)
01 Technical information on technologies to reduce waste generation
02 Financial information on the costs and benefits of waste reduction
03 Onsite technical assistance
04 Information on alternative products and raw materials
05 Other (specify):
06 None
A-31
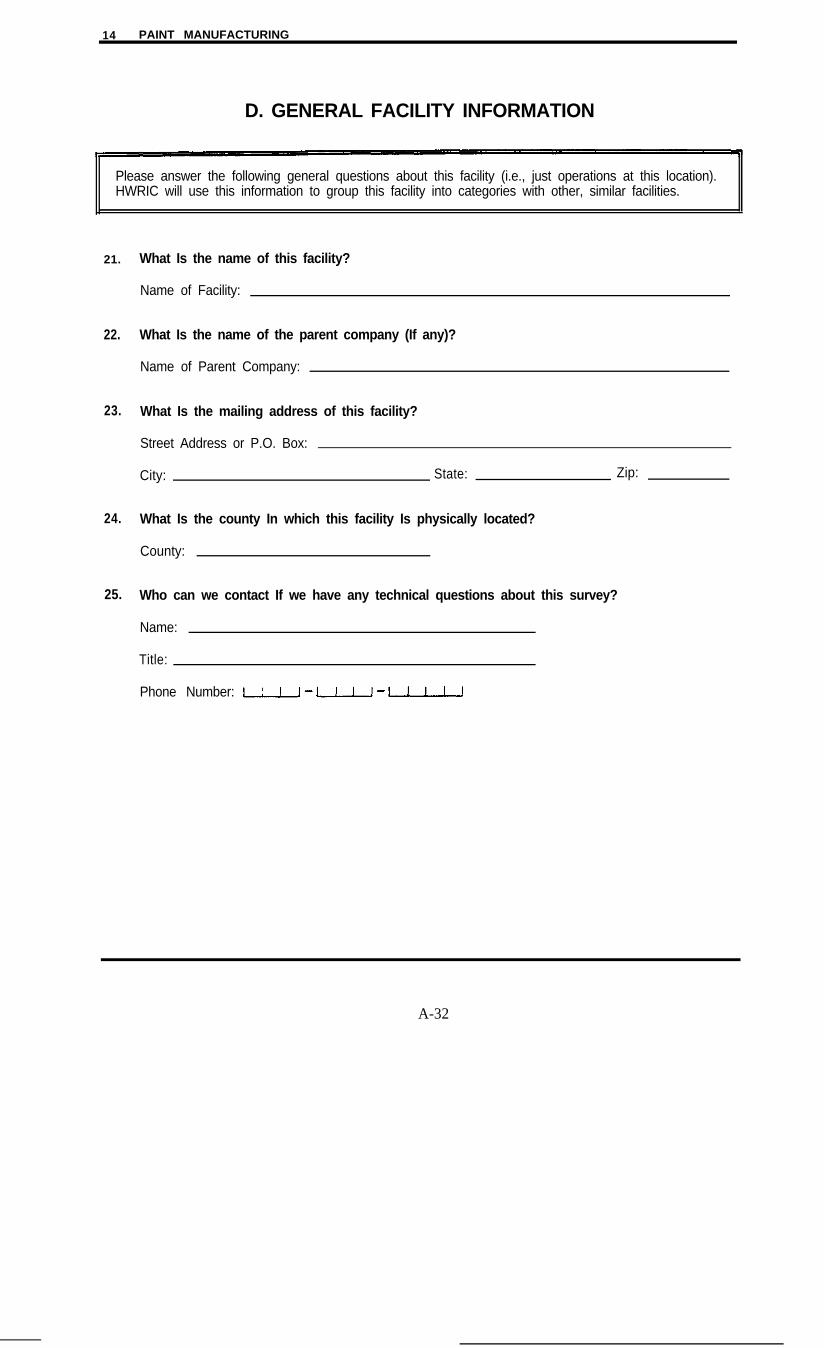
14 PAINT MANUFACTURING
D. GENERAL FACILITY INFORMATION
Please answer the following general questions about this facility (i.e., just operations at this location).HWRIC will use this information to group this facility into categories with other, similar facilities.
21.
22.
23.
24.
25.
What Is the name of this facility?
Name of Facility:
What Is the name of the parent company (If any)?
Name of Parent Company:
What Is the mailing address of this facility?
Street Address or P.O. Box:
City: State:
What Is the county In which this facility Is physically located?
County:
Zip:
Who can we contact If we have any technical questions about this survey?
Name:
Title:
Phone Number:
A-32
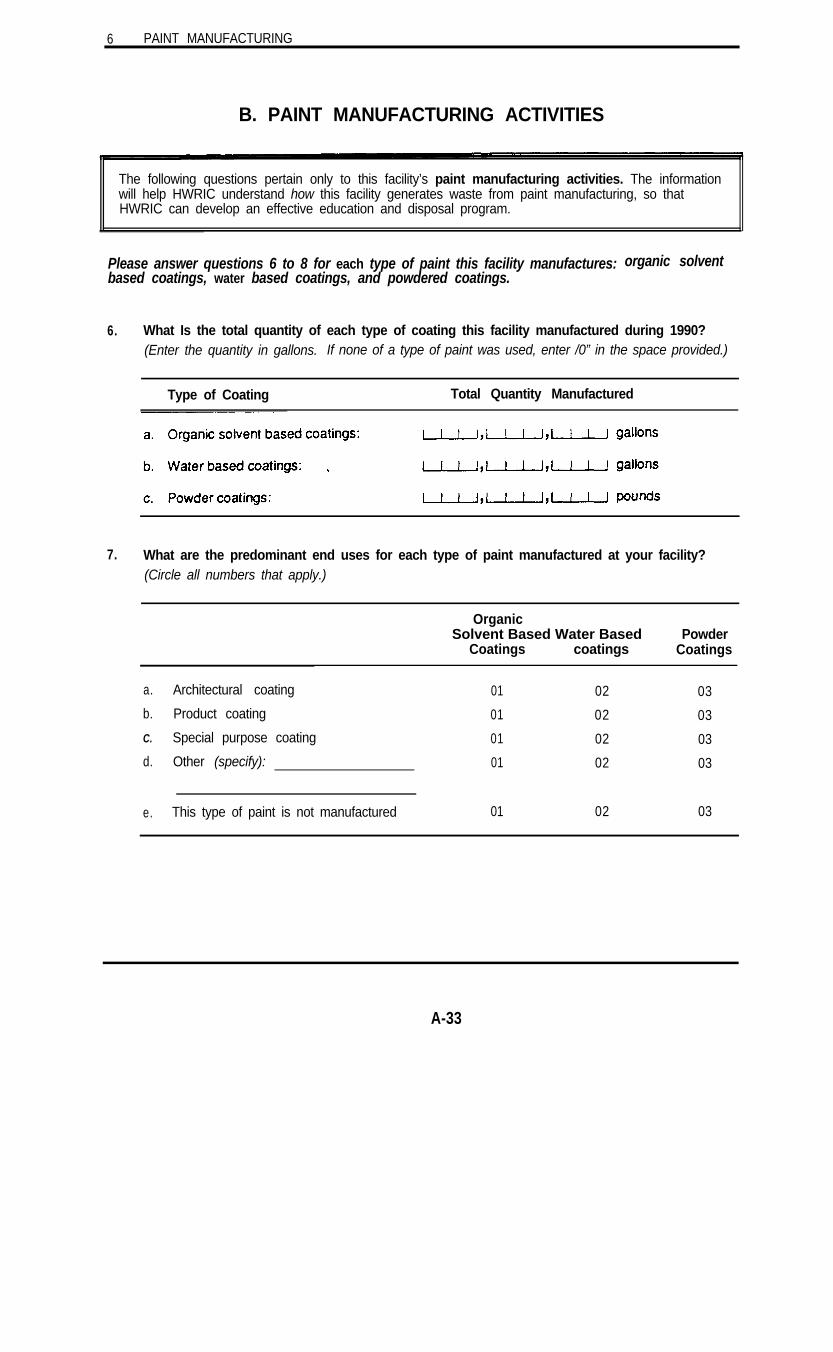
6 PAINT MANUFACTURING
B. PAINT MANUFACTURING ACTIVITIES
The following questions pertain only to this facility’s paint manufacturing activities. The informationwill help HWRIC understand how this facility generates waste from paint manufacturing, so thatHWRIC can develop an effective education and disposal program.
Please answer questions 6 to 8 for each type of paint this facility manufactures: organic solventbased coatings, water based coatings, and powdered coatings.
6. What Is the total quantity of each type of coating this facility manufactured during 1990?(Enter the quantity in gallons. If none of a type of paint was used, enter /0” in the space provided.)
Type of Coating Total Quantity Manufactured
7. What are the predominant end uses for each type of paint manufactured at your facility?(Circle all numbers that apply.)
OrganicSolvent Based Water Based
Coatings coatingsPowder
Coatings
a. Architectural coating 01 02 03
b. Product coating 01 02 03
C. Special purpose coating 01 02 03
d. Other (specify): 01 02 03
e. This type of paint is not manufactured 01 02 03
A-33
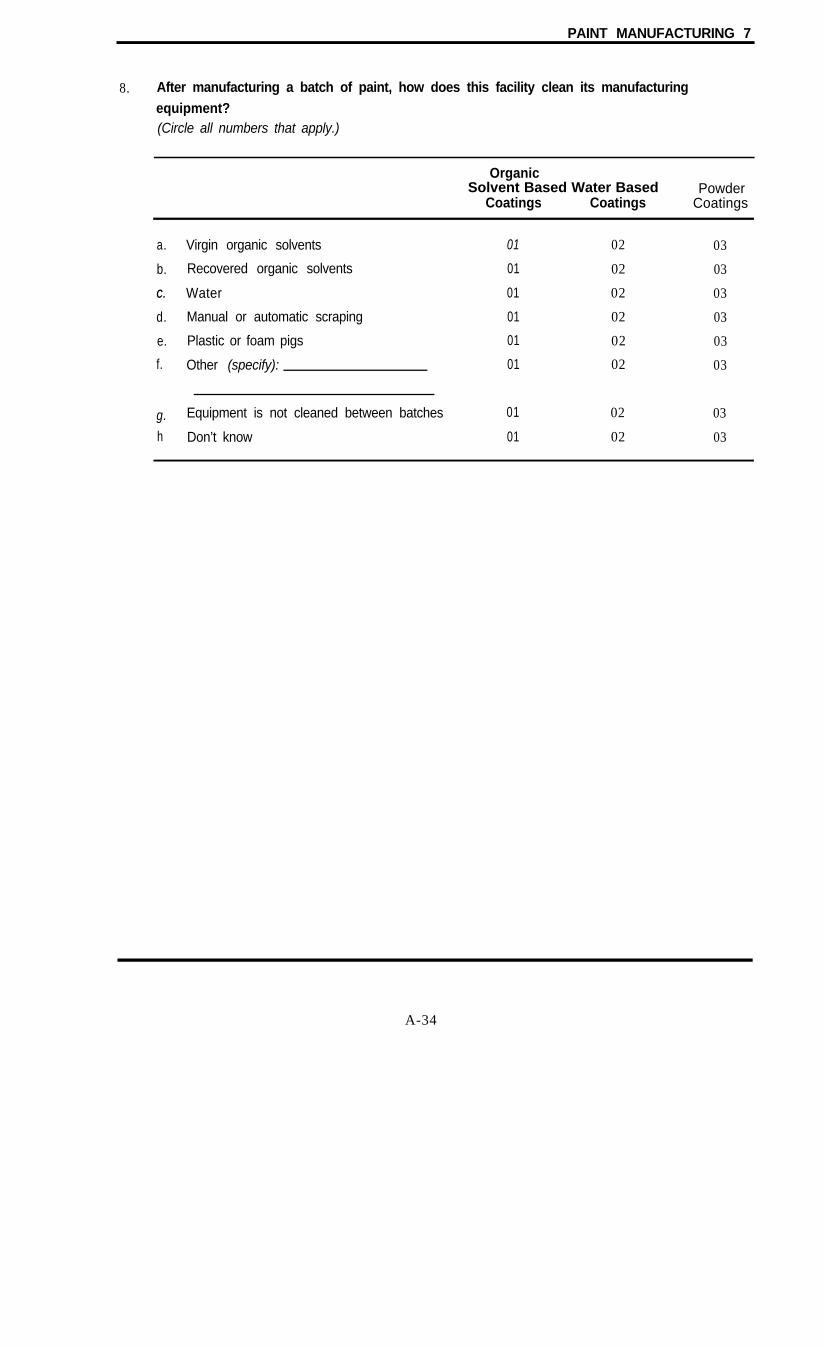
PAINT MANUFACTURING 7
8. After manufacturing a batch of paint, how does this facility clean its manufacturingequipment?(Circle all numbers that apply.)
OrganicSolvent Based Water Based
Coatings CoatingsPowder
Coatings
a. Virgin organic solvents
b. Recovered organic solvents
C. Water
d. Manual or automatic scraping
e. Plastic or foam pigs
f. Other (specify):
g.
h
Equipment is not cleaned between batches
Don’t know
01
01
01
01
01
01
01
01
02
02
02
02
02
02
02
02
03
03
03
03
03
03
03
03
A-34

8 PAINT MANUFACTURING
Questions 9 to 15 apply to paint-manufacturing waste reduction activities at this facility. Pleaseanswer only for wastes from this facility’s paint manufacturing and associated operations.
9. Does this facility measure how much waste is generated from Its paint-related activities perunit of output?(Circle one number.)
01 Yes
02 No
10. Has this facility considered making any changes in its paint manufacturing operations since1987 to reduce the generation of paint-relatedwaste?(Circle one number.)
01 Yes (CONTINUE TO NEXT QUESTION)
02 No (GO TO QUESTION 15)
11. Why has this facility considered changing its paint manufacturing operations to reducewaste generation?(Circle all numbers that apply.)
01 To comply with environmental regulations (EPA or IEPA)
02 To comply with Occupational Safety and Health Association (OSHA) regulations
03 To reduce the cost of waste management
04 To reduce costs other than waste management costs
05 To meet customer demands
06 To meet community demands
07 To reduce potential liability
08 To improve and protect the quality of the environment
09 Other (specify):
12. Has this facility made any changes In Its paint manufacturing since 1987 to reduce its paint-related waste generation?(Circle one number.)
01 Yes
02 No
(CONTINUE TO NEXT QUESTION)
(GO TO QUESTION 15)
A-35
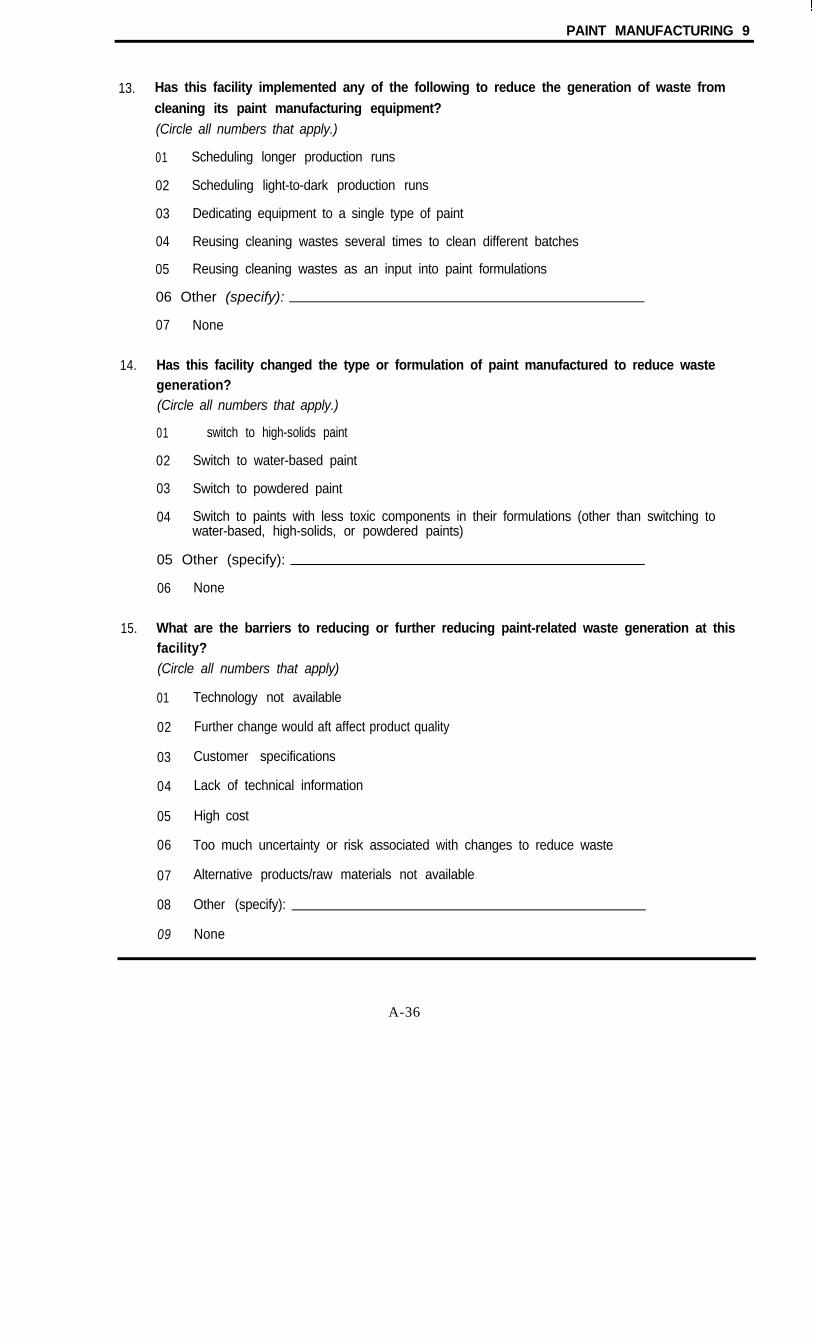
PAINT MANUFACTURING 9
13. Has this facility implemented any of the following to reduce the generation of waste fromcleaning its paint manufacturing equipment?(Circle all numbers that apply.)
01 Scheduling longer production runs
02 Scheduling light-to-dark production runs
03 Dedicating equipment to a single type of paint
04 Reusing cleaning wastes several times to clean different batches
05 Reusing cleaning wastes as an input into paint formulations
06 Other (specify):
07 None
14. Has this facility changed the type or formulation of paint manufactured to reduce wastegeneration?(Circle all numbers that apply.)
01 switch to high-solids paint
02 Switch to water-based paint
03 Switch to powdered paint
04 Switch to paints with less toxic components in their formulations (other than switching towater-based, high-solids, or powdered paints)
05 Other (specify):
06 None
15. What are the barriers to reducing or further reducing paint-related waste generation at thisfacility?(Circle all numbers that apply)
01 Technology not available
02 Further change would aft affect product quality
03 Customer specifications
04 Lack of technical information
05 High cost
06 Too much uncertainty or risk associated with changes to reduce waste
07 Alternative products/raw materials not available
08 Other (specify):
09 None
A-36

C. WASTE GENERATION AND MANAGEMENT
The following questions pertain to this facility’s paint manufacturing and related activities. Theinformation will help HWRIC understand the types and quantities of paint-related waste this facilitygenerates, so that HWRIC can develop cost effective disposal options.
Please note that where the following questions ask for quantity informatIon, you have the optionof reporting the quantities In tons or gallons. Please circle the unit of measure you used for eachquantity reported.
16. What Is the quantity of waste from paint manufacturing and related operations entering eachof the following management processes onsite during 1990?(For each type of waste management, enter the quantity of paint-related waste managed using thatactivity onsite (at this facility) and circle the appropriate unit of measure.)
Waste Management Processes Onsite Quantity
Unit of Measure
Tons Gallons
a.
b.
C.
d.
e.
f.
g.
h.
i.
j.
Solvent recovery:
Metals recovery:
Blending and reuse as fuel:
Incineration(not for energy recovery):
Solidification:
Wastewater treatment:
Hazardous waste landfill:
Special waste landfill:
Municipal landfill:
Other (specify):
01
01
01
01
01
01
01
01
01
01
02
02
02
02
02
02
02
02
02
02
A-37

17. What is the quantity of waste from paint manufacturing and related operations entering each of the following managementprocesses offsite during 1990? What is the cost for offsite waste management?(Enter the quantity of paint-related waste managed using each activity offsite (at another location) in 1990 and the typical charge for thewaste management (dollars per ton or dollars per gallon). Circle the unit of measure used for the quantity and for the cost.)
Cost per Unit Unit of Measure
Waste Management Processes Offsite Quantity (tons or gallons) Tons Gallons
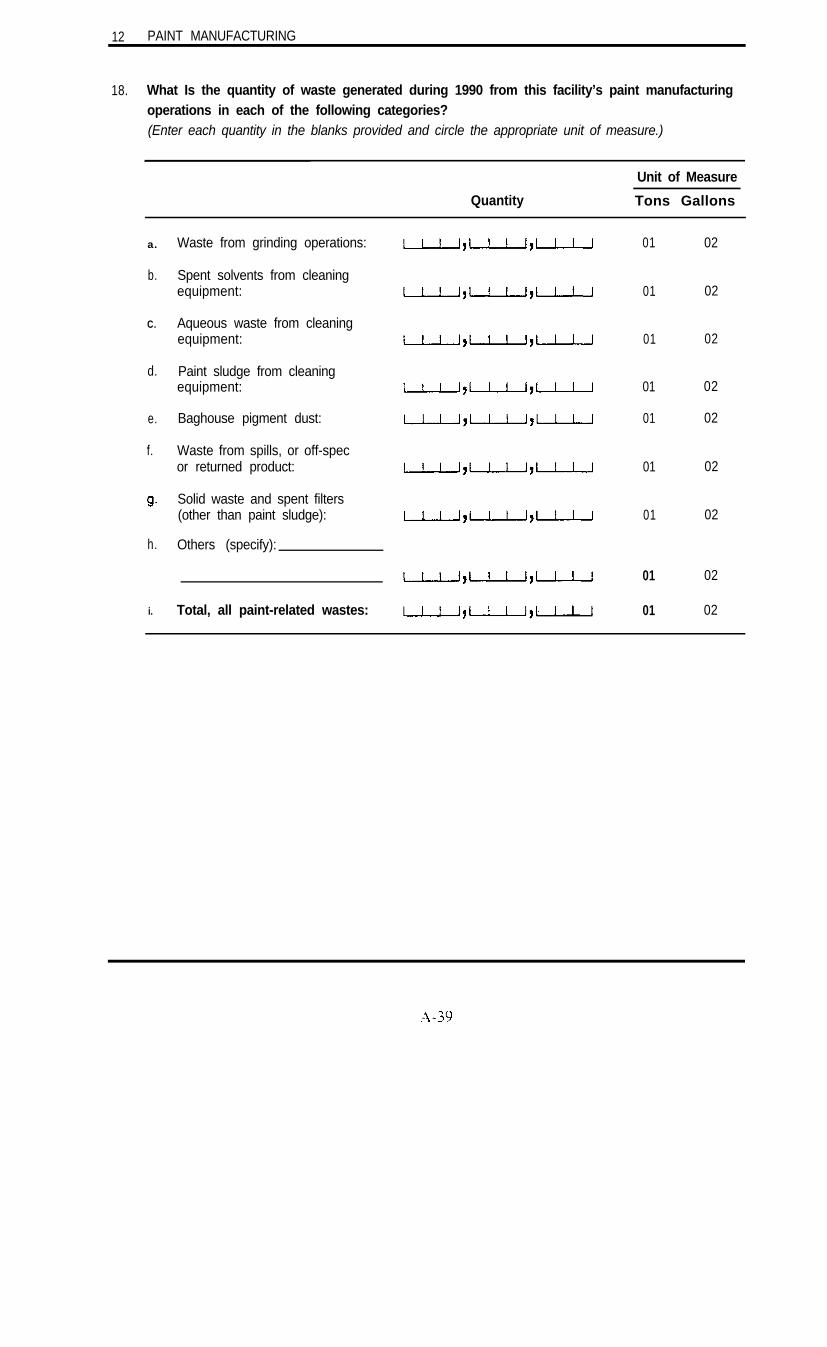
12 PAINT MANUFACTURING
18. What Is the quantity of waste generated during 1990 from this facility’s paint manufacturingoperations in each of the following categories?(Enter each quantity in the blanks provided and circle the appropriate unit of measure.)
Quantity
Unit of Measure
Tons Gallons
a.
b.
Waste from grinding operations:
Spent solvents from cleaningequipment:
C. Aqueous waste from cleaningequipment:
d. Paint sludge from cleaningequipment:
e.
f.
Baghouse pigment dust:
Waste from spills, or off-specor returned product:
Solid waste and spent filters(other than paint sludge):
h. Others (specify):
i. Total, all paint-related wastes:
01
01
01
01
01
01
01
01
01
02
02
02
02
02
02
02
02
02
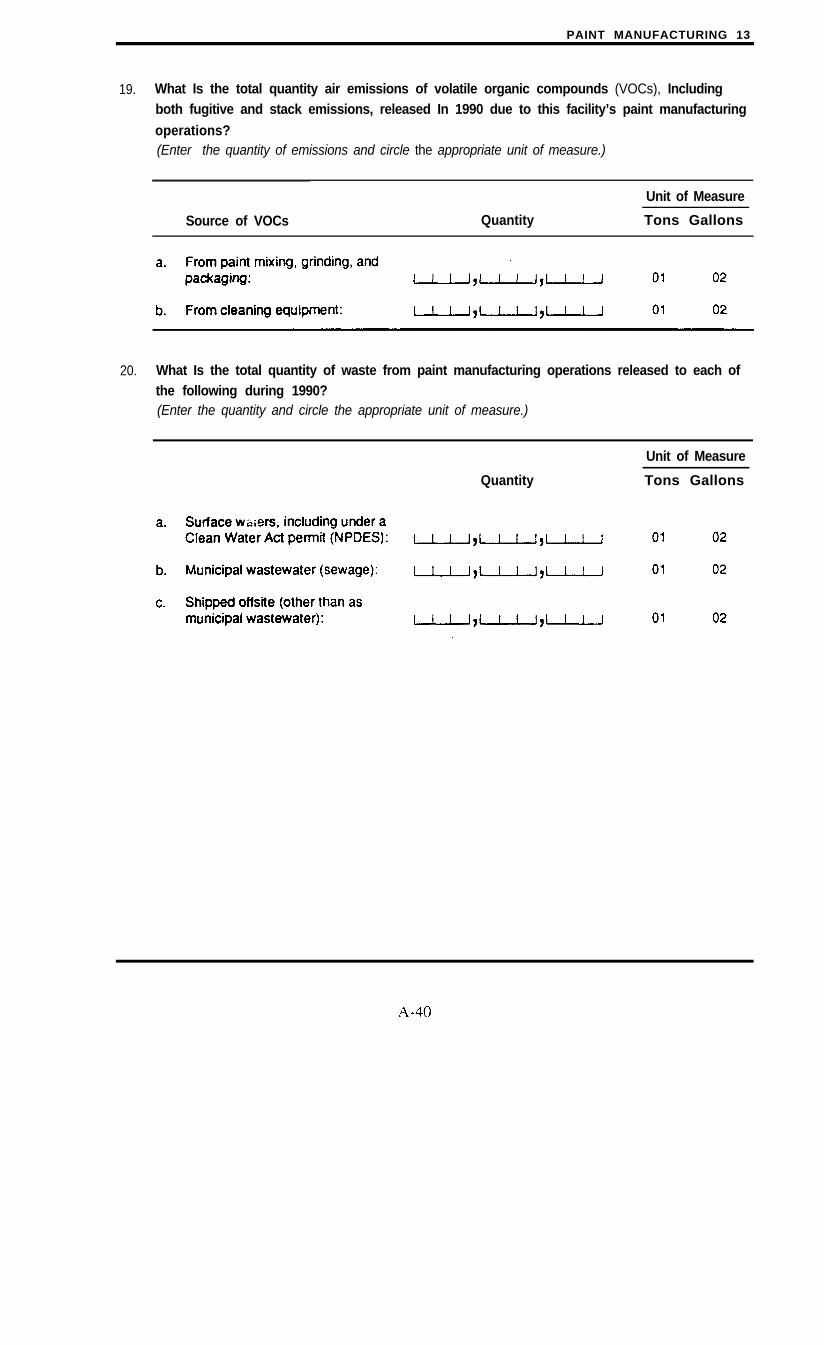
PAINT MANUFACTURING 13
19. What Is the total quantity air emissions of volatile organic compounds (VOCs), Includingboth fugitive and stack emissions, released In 1990 due to this facility’s paint manufacturing
operations?(Enter the quantity of emissions and circle the appropriate unit of measure.)
Unit of Measure
Source of VOCs Quantity Tons Gallons
20. What Is the total quantity of waste from paint manufacturing operations released to each ofthe following during 1990?(Enter the quantity and circle the appropriate unit of measure.)
Quantity
Unit of Measure
Tons Gallons
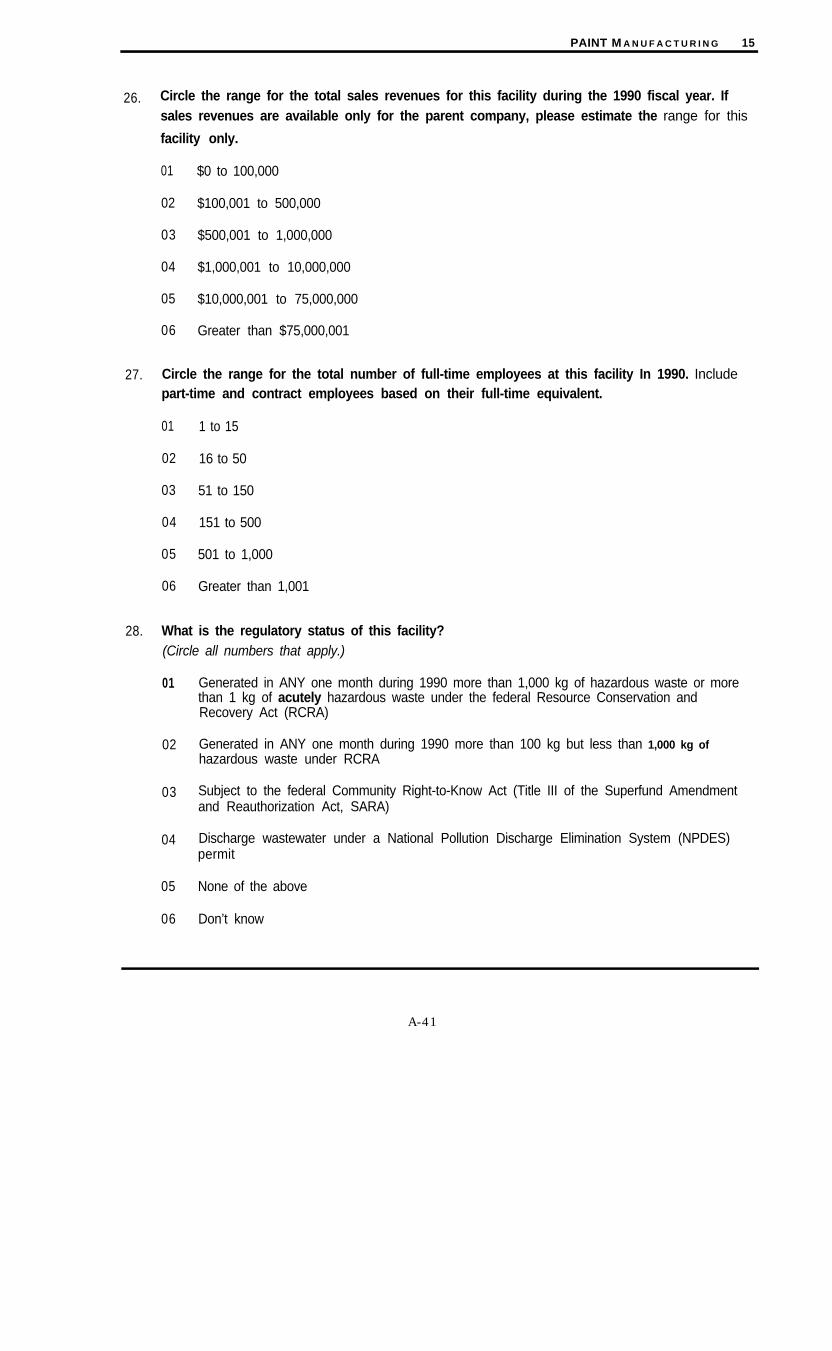
PAINT M A N U F A C T U R I N G 15
26. Circle the range for the total sales revenues for this facility during the 1990 fiscal year. Ifsales revenues are available only for the parent company, please estimate the range for this
facility only.
01 $0 to 100,000
02 $100,001 to 500,000
03 $500,001 to 1,000,000
04 $1,000,001 to 10,000,000
05 $10,000,001 to 75,000,000
06 Greater than $75,000,001
27. Circle the range for the total number of full-time employees at this facility In 1990. Includepart-time and contract employees based on their full-time equivalent.
01 1 to 15
02 16 to 50
03 51 to 150
04 151 to 500
05 501 to 1,000
06 Greater than 1,001
28. What is the regulatory status of this facility?(Circle all numbers that apply.)
01
02
03
04
05
06
Generated in ANY one month during 1990 more than 1,000 kg of hazardous waste or morethan 1 kg of acutely hazardous waste under the federal Resource Conservation andRecovery Act (RCRA)
Generated in ANY one month during 1990 more than 100 kg but less than 1,000 kg ofhazardous waste under RCRA
Subject to the federal Community Right-to-Know Act (Title III of the Superfund Amendmentand Reauthorization Act, SARA)
Discharge wastewater under a National Pollution Discharge Elimination System (NPDES)permit
None of the above
Don’t know
A-41
16 PAINT MANUFACTURING
COMMENTS AND EXPLANATIONS
HWRIC is interested in any comments you may have about this questionnaire or this study in general.Please use the space provided below to make any relevant comments. If commenting or explaining yourresponse to a particular question in this questionnaire, please reference the question number.
QuestionNumber Comment/Explanation
A-42
APPENDIX B
SITE VISIT QUESTIONNAIRE
2 General Information for All Sites
Company Name
Division
Street Address
City/State/Zip
Name of Contact
Title/Position
Telephone Number
Type of Business
SIC Code
Number of EmployeesProduction/ManufacturingPainting Operations AdministrationEnvironmental Staff
Annual Gross Sales (Units)For Year Ending 19
B-l

3 Questions for Paint Manufacturers
I. Types of paint
1. What types of paint do you manufacture? How much of each?
a. Organic solvent borneb. Water bornec. Powder
2. What are the trade names for these paints?
3. What information can you provide on the formulations of these paints?
a. Do any formulations contain heavy metal pigments or additives?b. Are any of the formulations particularly toxic?c. Has the proportion of water-borne to solvent-borne paints
manufactured changed over time, if so how?
4. Can you provide MSDS sheets?
5. What industries are the primary customers for your paint products?
6. How are your paints packaged? (Cans, toters, etc.) Typical sizes?
7. Are any of your paints formulated to reduce VOCs or otherwise reduceimpact on the environment? Which paints?
8. Are any of your paints formulated to reduce waste either inmanufacture or application?
9. Are your paints best suited for any particular application technique?Which paints? Which techniques?
10. Are any of your paints custom manufactured to meet specificationsof a particular customer?
B-2

II. How paints are manufactured
1. Please provide a simple flow chart of your paint manufacturing process.Use the reverse side of this form if necessary, or attach additional sheets.
2. What types of equipment are used in your manufacturing process?Can you provide some idea of the age of your equipment and its initialcost?
a. Grinding mills (number. type, manufacturer)b. Mixers (number, type, manufacturer)c. Storage/holding tanksd. Other equipment
3. How many people do you employ in manufacturing paint? Do theyreceive any specialized training? Who performs clean-up, manufacturingstaff or maintenance personnel?
4. What are the raw materials for each of your paint products?
5. What processes do you use in the manufacture of yourpaints? How do these processes vary from one paint typeto the next?
B-3

III. Waste Generation in the Manufacture of Paint
1. What types of waste do you generate and how much of each?
a. VOCs (other air toxics, particulate etc.)
b. Liquid wastesi. organic solventsii. aqueous wastesiii. waste paint
c. Solid wastesi. spent filtersii. other paint bearing solids
2. What are the primary causes of waste in your operations?
a. evaporation of solventsb. equipment cleaning (describe methods used)c. off-spec. paintd. spills
other
3. How do the waste types and quantities vary by paint type?
4. How often are waste streams assessed? What personnel are involved inwaste assessment?
B-4

5. What cost impacts do wastes have on your operations?
a. materialsb. energyc. labord. other (waste management and disposal, capital expenditures, etc.)
6. Do you believe the current trends in paint formulation make it easier, ormore difficult, to control waste in the paint manufacturing process?
7. Are you aware of the New Clean Air Act Requirements? Do you have AirPermit(s)?
B-5
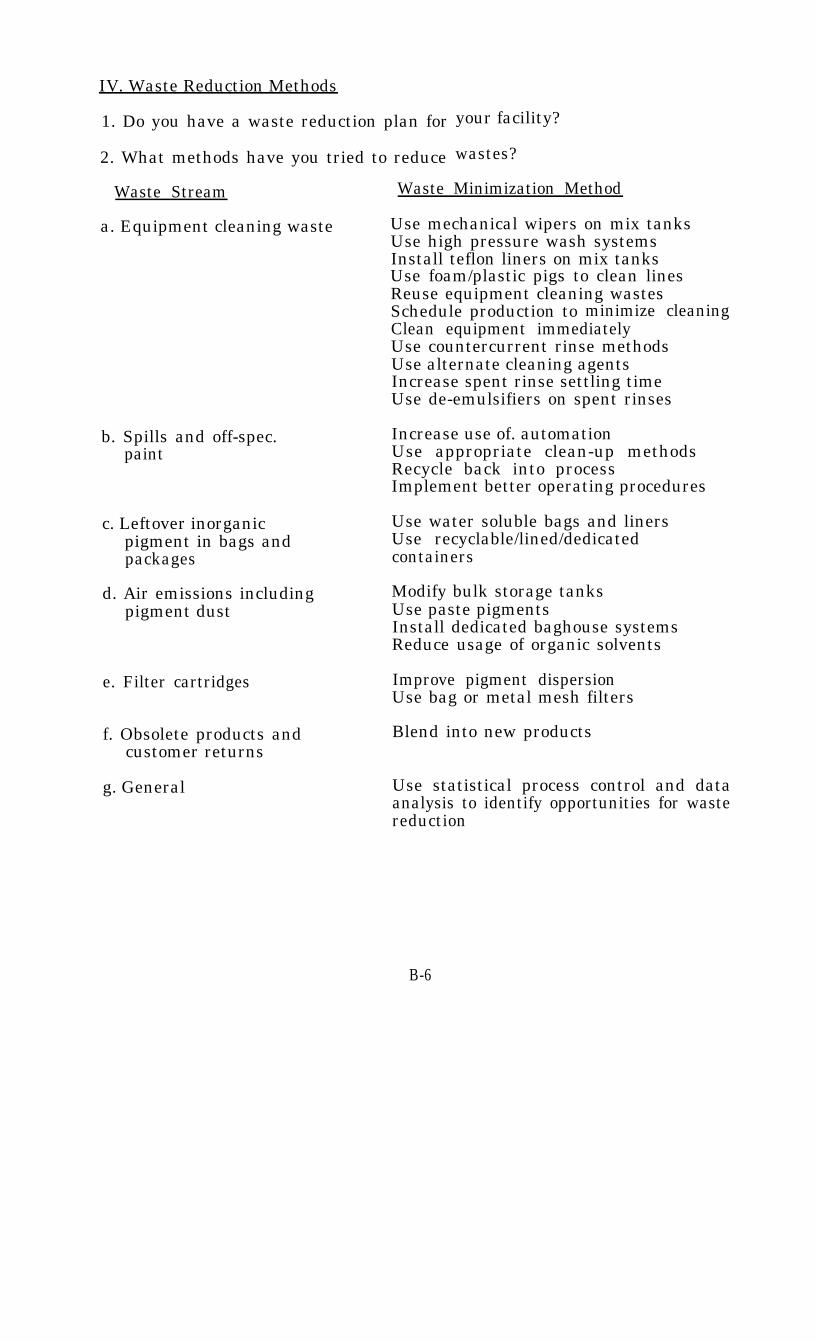
IV. Waste Reduction Methods
1. Do you have a waste reduction plan for
2. What methods have you tried to reduce
your facility?
wastes?
Waste Stream Waste Minimization Method
b. Spills and off-spec.paint
c. Leftover inorganic Use water soluble bags and linerspigment in bags and Use recyclable/lined/dedicatedpackages containers
d. Air emissions includingpigment dust
Modify bulk storage tanksUse paste pigmentsInstall dedicated baghouse systemsReduce usage of organic solvents
e. Filter cartridges
a. Equipment cleaning waste Use mechanical wipers on mix tanksUse high pressure wash systemsInstall teflon liners on mix tanksUse foam/plastic pigs to clean linesReuse equipment cleaning wastesSchedule production to minimize cleaningClean equipment immediatelyUse countercurrent rinse methodsUse alternate cleaning agentsIncrease spent rinse settling timeUse de-emulsifiers on spent rinses
Increase use of. automationUse appropriate clean-up methodsRecycle back into processImplement better operating procedures
Improve pigment dispersionUse bag or metal mesh filters
f. Obsolete products andcustomer returns
g. General
Blend into new products
Use statistical process control and dataanalysis to identify opportunities for wastereduction
B-6

3. Have you integrated your quality control programs with waste reduction?
4. What methods of waste reduction have been successful for you?
5. What methods of waste reduction have been unsuccessful? Why?, whatlessons were learned? (Technical limitations, personnel limitations, etc)
6. What is your organization’s overall approach to waste reduction?
a. Employee incentivesb. Waste management accountingc. Identify waste management responsibilityd. Who are waste management decision makers
7. What are your sources of information on waste reductiontechnologies? (trade shows, magazine articles. training courses,etc.)
8. What obstacles have you encountered in your efforts to reducewaste in your paint manufacturing operation?
V. Paint Related Waste Management
1. How do you manage (dispose, treat; recycle) the wastes which aregenerated in your paint manufacturing operation?
a. VOCs (recapture, incinerate, etc.)b. Organic solvent liquids (recycle. incinerate, fuel
blending)c. Aqueous wastes (dedicated treatment facilities. de-water,
etc.)d. Solid wastes (municipal landfill. special waste landfill)
2. What costs are associated with these waste managementactivities?
3. Is there anything the State can do to help you reduce the volumeand/or toxicity of paint related waste generated at yourfacility. (Not just compliance assistance)
B-7
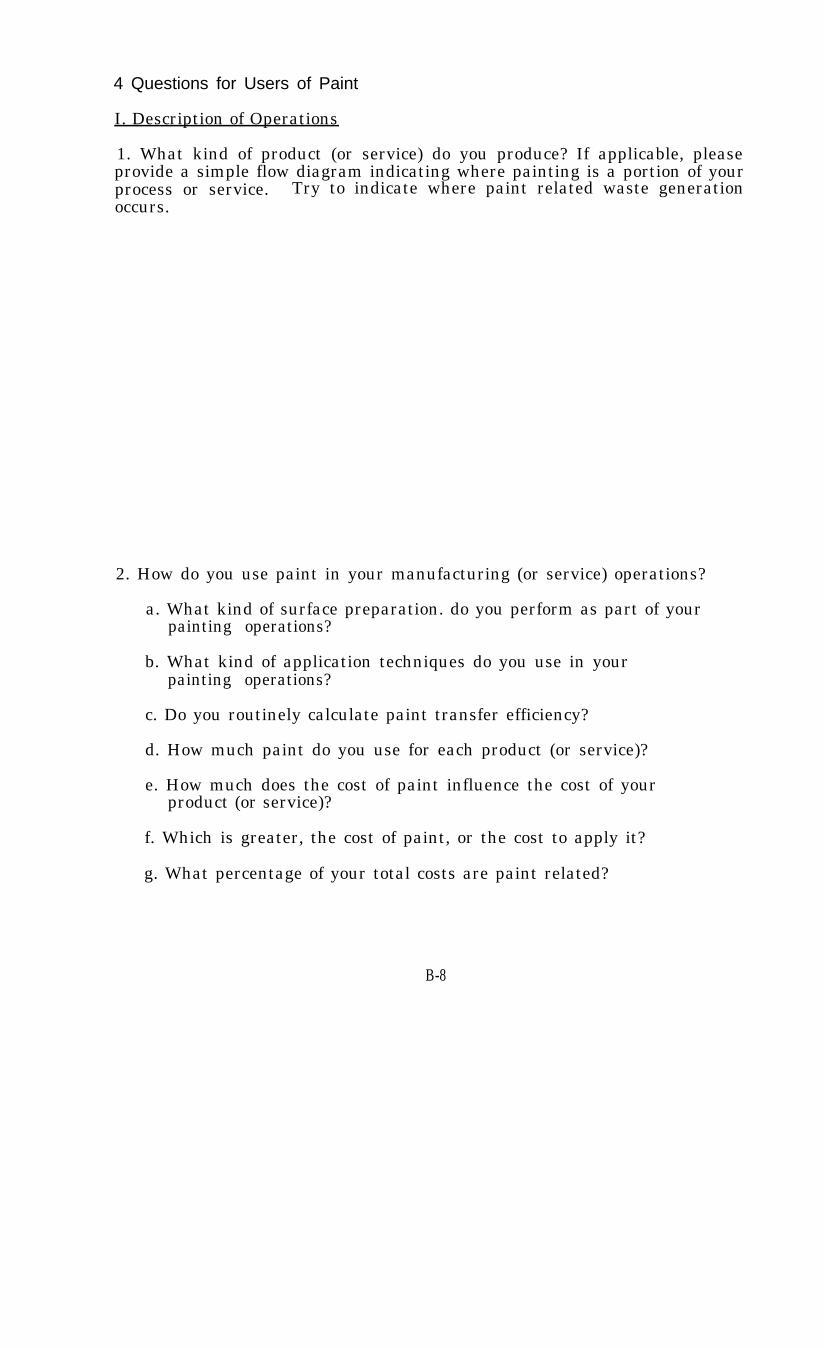
4 Questions for Users of Paint
I. Description of Operations
1. What kind of product (or service) do you produce? If applicable, pleaseprovide a simple flow diagram indicating where painting is a portion of yourprocess or service. Try to indicate where paint related waste generationoccurs.
2. How do you use paint in your manufacturing (or service) operations?
a. What kind of surface preparation. do you perform as part of yourpainting operations?
b. What kind of application techniques do you use in yourpainting operations?
c. Do you routinely calculate paint transfer efficiency?
d. How much paint do you use for each product (or service)?
e. How much does the cost of paint influence the cost of yourproduct (or service)?
f. Which is greater, the cost of paint, or the cost to apply it?
g. What percentage of your total costs are paint related?
B-8

3. How many people do you employ in painting operations? Do theyreceive any specialized training’? Who performs clean-up,manufacturing staff or maintenance personnel?
4. What kinds of paint do you use?
a.
b.
c.
d.
e.
Do you have a set of specifications for the paints used inyour operations? If so, what are the specifications?
What types of thinners do you use? Amounts?
What factors were most important in developing your paintspecifications? (cost. performance, application technique,environmental concerns etc.)
Is the paint formulation you use essential to the qualityof your product (or service)?
Have you had to switch paint types due to environmentalregulations or concerns? If so, what type of paint did youpreviously use?
B-9
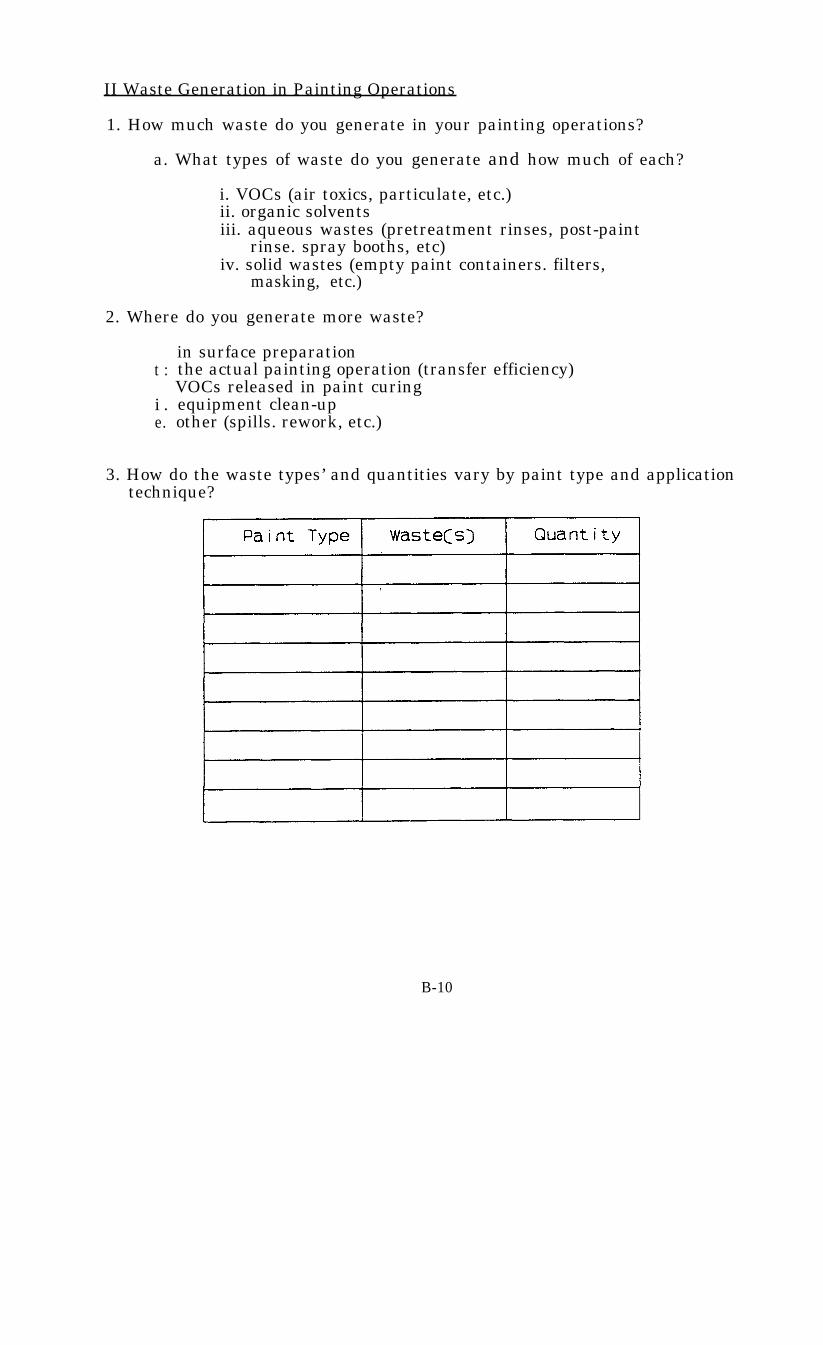
II Waste Generation in Painting Operations
1. How much waste do you generate in your painting operations?
a. What types of waste do you generate and how much of each?
i. VOCs (air toxics, particulate, etc.)ii. organic solventsiii. aqueous wastes (pretreatment rinses, post-paint
rinse. spray booths, etc)iv. solid wastes (empty paint containers. filters,
masking, etc.)
2. Where do you generate more waste?
t :
i .e.
in surface preparationthe actual painting operation (transfer efficiency)VOCs released in paint curingequipment clean-upother (spills. rework, etc.)
3. How do the waste types’ and quantities vary by paint type and applicationtechnique?
B-10

4. How often are waste streams assessed? What personnel are involved inwaste assessment?
5. What are the primary causes of waste in your painting operations?
6. What cost impacts do wastes have on your operations?
a. materialsb. energyc. labord. other (waste management and disposal, capital expenditures, etc.)
7. Do you believe the current trends in paint formulation make it easier, ormore difficult. to control waste in your painting process?
8. Are you aware of the New Clean Air Act Requirements? Do you have AirPermit(s)?
B-11
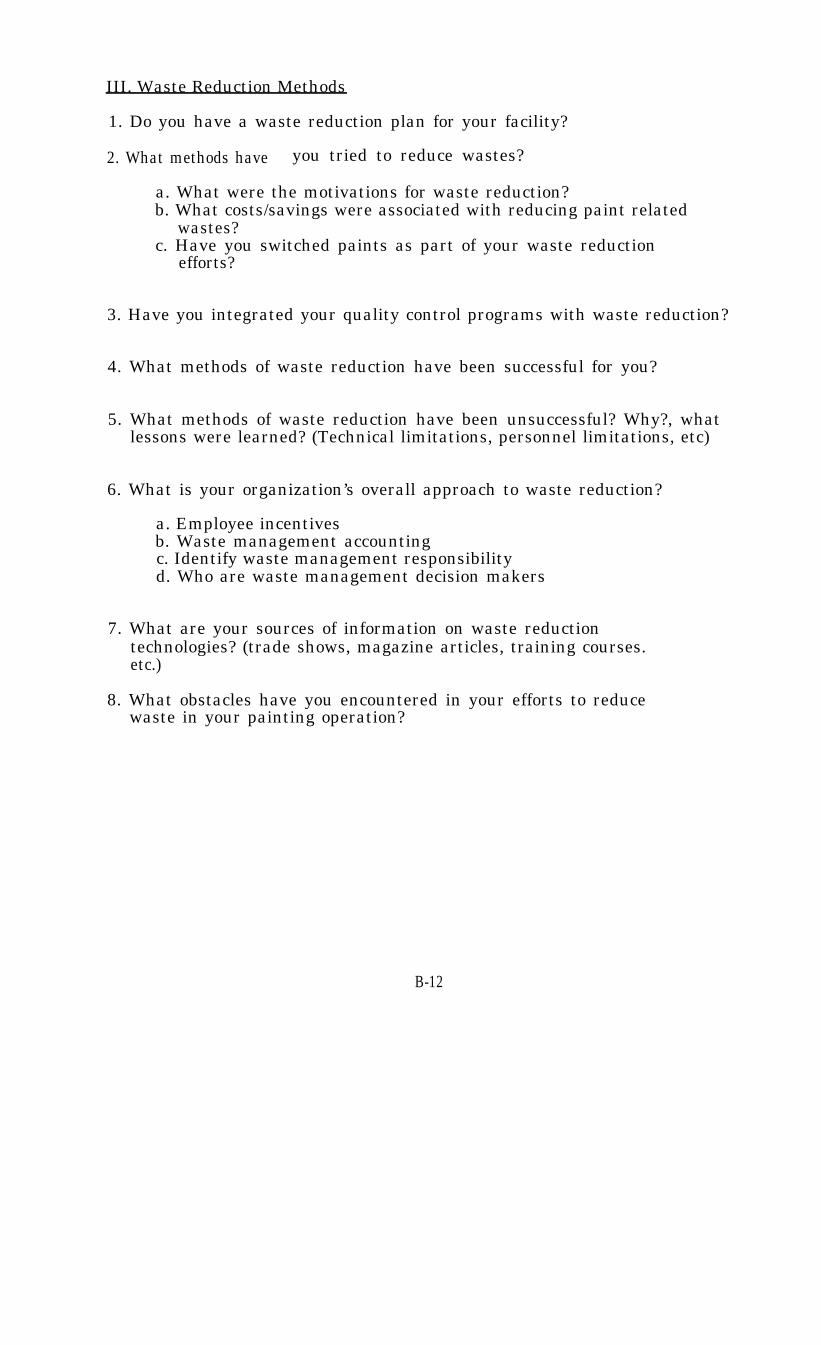
III. Waste Reduction Methods
1. Do you have a waste reduction plan for your facility?
2. What methods have you tried to reduce wastes?
a. What were the motivations for waste reduction?b. What costs/savings were associated with reducing paint related
wastes?c. Have you switched paints as part of your waste reduction
efforts?
3. Have you integrated your quality control programs with waste reduction?
4. What methods of waste reduction have been successful for you?
5. What methods of waste reduction have been unsuccessful? Why?, whatlessons were learned? (Technical limitations, personnel limitations, etc)
6. What is your organization’s overall approach to waste reduction?
a. Employee incentivesb. Waste management accountingc. Identify waste management responsibilityd. Who are waste management decision makers
7. What are your sources of information on waste reductiontechnologies? (trade shows, magazine articles, training courses.etc.)
8. What obstacles have you encountered in your efforts to reducewaste in your painting operation?
B-12
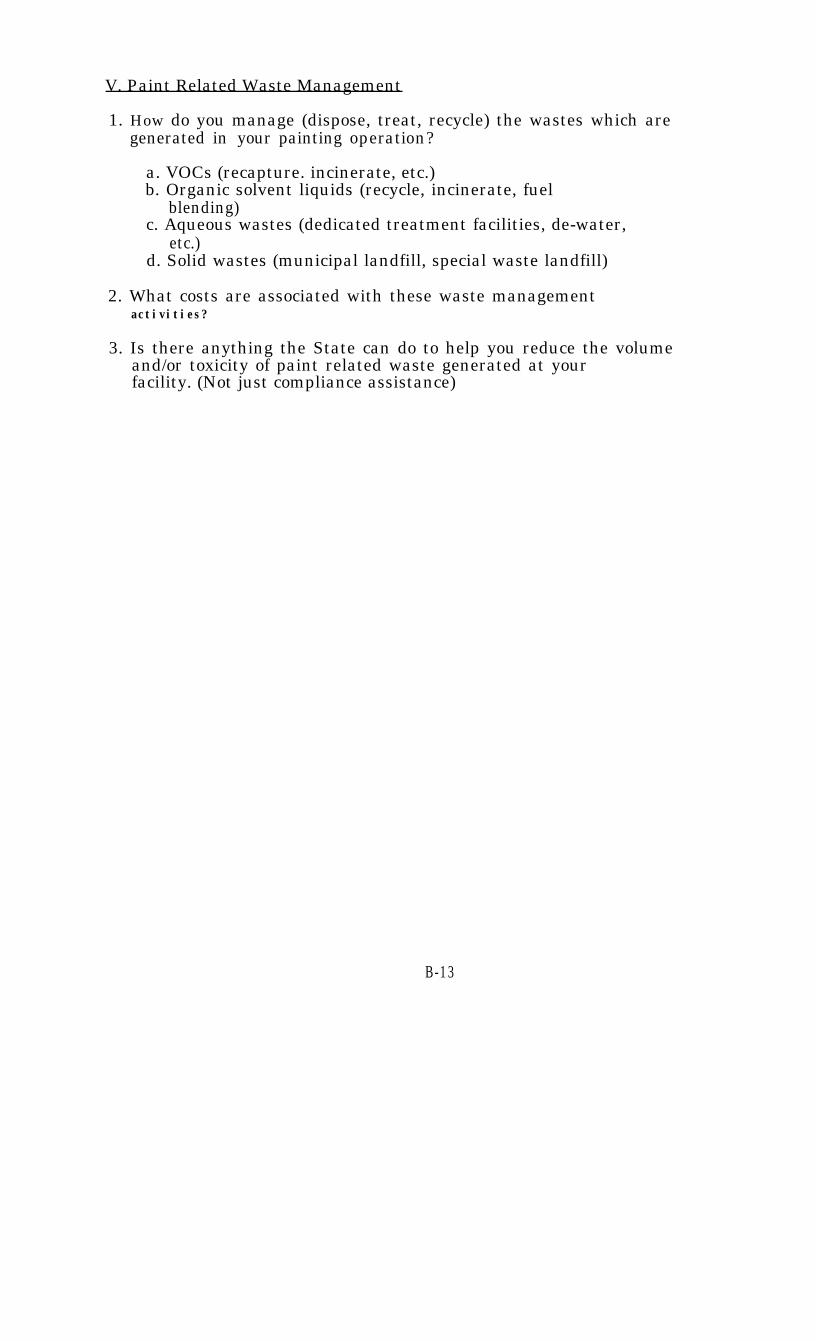
V. Paint Related Waste Management
1. How do you manage (dispose, treat, recycle) the wastes which aregenerated in your painting operation?
a. VOCs (recapture. incinerate, etc.)b. Organic solvent liquids (recycle, incinerate, fuel
blending)c. Aqueous wastes (dedicated treatment facilities, de-water,
etc.)d. Solid wastes (municipal landfill, special waste landfill)
2. What costs are associated with these waste managementactivities?
3. Is there anything the State can do to help you reduce the volumeand/or toxicity of paint related waste generated at yourfacility. (Not just compliance assistance)
B-13

APPENDIX C
PUBLIC AWARENESS MATERIALS CURRENTLY AVAILABLE

This list contains seven public information items already available and comments on the
ones containing a format or information presentation method that could be followed when futurematerial is prepared.
1. Citizen’s Guide to Pesticides, prepared by the USEPA, April, 1990. The value ofthis guide lies in the comprehensiveness of the topics covered and the clarity of thewriting. The most effective section of the guide is the section on tips for handlingpesticides; the approach used in that section could be copied in fact sheets madeavailable in a variety of ways.
2. Disposal: Do It Right-Managing Household Wastes, prepared by The HouseholdProducts Disposal Council This pamphlet is short, easy to read, and contains anumber of clear dos and don’ts. Of particular value are the suggestions on how toread product labels. This format also could be copied for new material to bedeveloped.
3. Fact Sheet: Waste Reduction for Automotive Repair Shops, prepared by CaliforniaDepartment of Health Services, 1989. This fact sheet contains useful backgroundinformation on this subject, including a list of specific suggestions and a list ofadditional publications to consult. This document is an excellent example foradditional fact sheets.
4. Hazardous Waste Reduction: The Bottom Line, prepared by Waste Pollution ControlFederation. This brochure contains a number of useful suggestions but in aconfusing format of charts and suggestions. It is the least useful of the materialreviewed.
5. Household Hazardous Waste-What You Should and Shouldn’t Do, prepared byWater Pollution Control Federation. One part of this brochure, the section onpoisoning your water, is very effective because it contains information describinghazardous materials and their dangers, along with ways to handle this material Achart of how to dispose of waste is hard to follow.
6. Paint Disposal...The Right Way, prepared by National Paint & Coatings Association.This very short brochure contains general disposal options for latex and solvent-based paint products. The suggestions are clear but not made emphatically enoughor graphically to underscore the message.
7. Understanding the Small Quantity Generator: Hazardous Waste Rules, prepared byUSEPA, 1986. This is an excellent comprehensive booklet on the subject, written inan easy to understand form. The only concern is whether small business owners andmanagers would read it, given its length.
C-l