Painel 3 - Cenários para o mercado de commodities - André Pessoa
26
BRAZILIAN AGRICULTURAL SCENARIOS Perspectivas para o Agribusiness 2016 e 2017 June 2016 Andre Pessôa
-
Upload
24x7-comunicacao -
Category
Business
-
view
114 -
download
0
Transcript of Painel 3 - Cenários para o mercado de commodities - André Pessoa

BRAZILIAN AGRICULTURAL
SCENARIOS Perspectivas para o Agribusiness 2016 e 2017
June 2016 Andre Pessôa
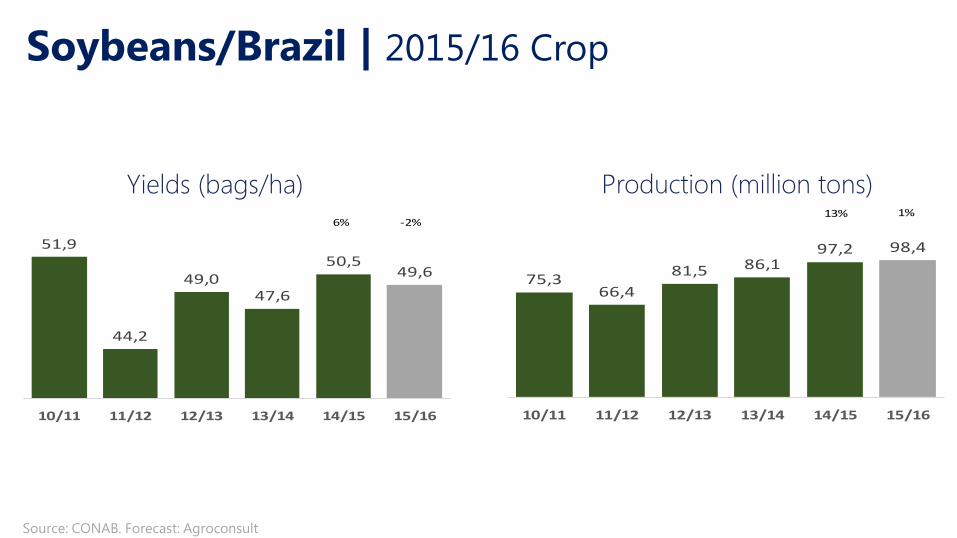
51,9
44,2
49,047,6
50,549,6
10/11 11/12 12/13 13/14 14/15 15/16
-2%6%
Source: CONAB. Forecast: Agroconsult
Yields (bags/ha)
Soybeans/Brazil | 2015/16 Crop
75,366,4
81,5 86,197,2 98,4
10/11 11/12 12/13 13/14 14/15 15/16
1%13%
Production (million tons)
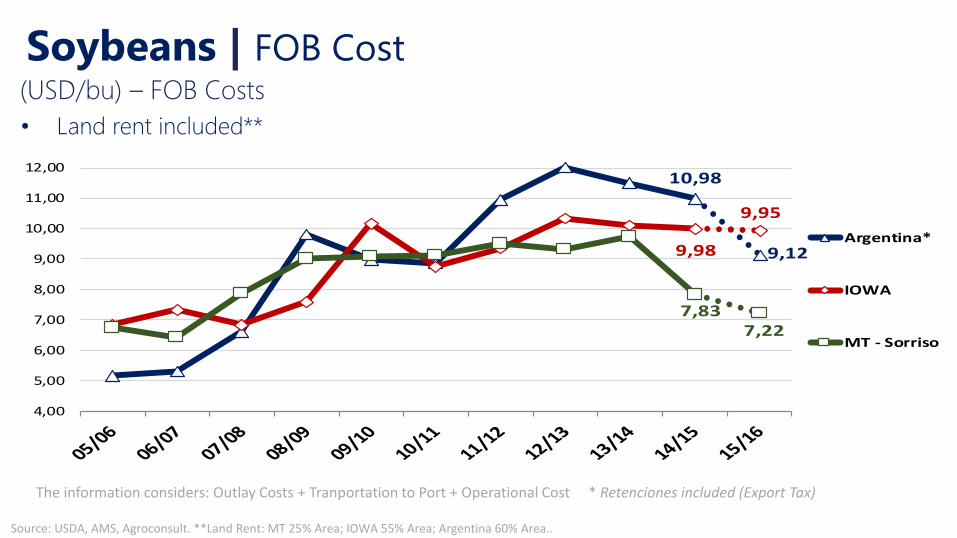
10,98
9,129,98
9,95
7,837,22
4,00
5,00
6,00
7,00
8,00
9,00
10,00
11,00
12,00
Argentina*
IOWA
MT - Sorriso
Soybeans | FOB Cost (USD/bu) – FOB Costs
• Land rent included**
Source: USDA, AMS, Agroconsult. **Land Rent: MT 25% Area; IOWA 55% Area; Argentina 60% Area..
The information considers: Outlay Costs + Tranportation to Port + Operational Cost * Retenciones included (Export Tax)
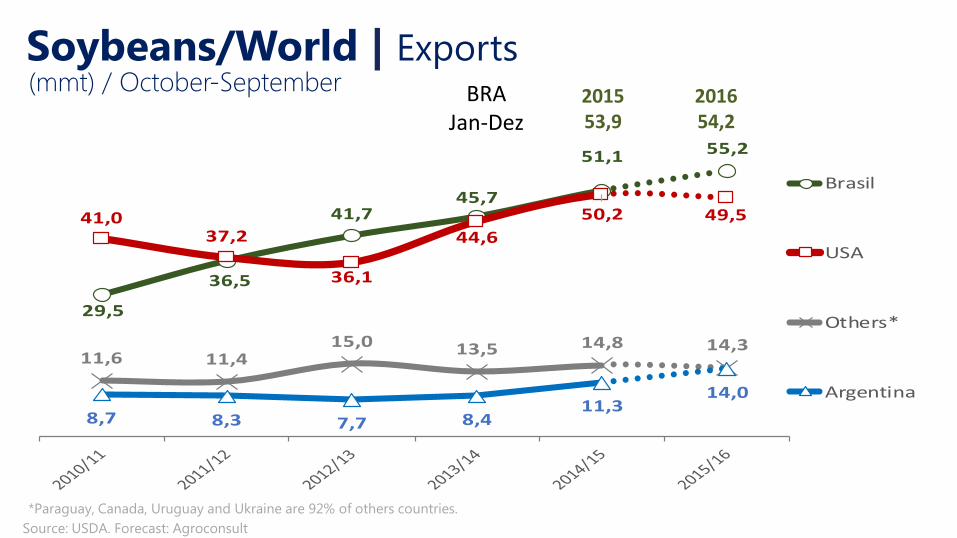
29,5
36,5
41,745,7
51,1 55,2
41,037,2
36,1
44,6
50,2 49,5
11,6 11,415,0 13,5 14,8 14,3
8,7 8,3 7,7 8,411,3
14,0
Brasil
USA
Others*
Argentina
*Paraguay, Canada, Uruguay and Ukraine are 92% of others countries.
Soybeans/World | Exports (mmt) / October-September
Source: USDA. Forecast: Agroconsult
BRA Jan-Dez
2015 53,9
2016 54,2
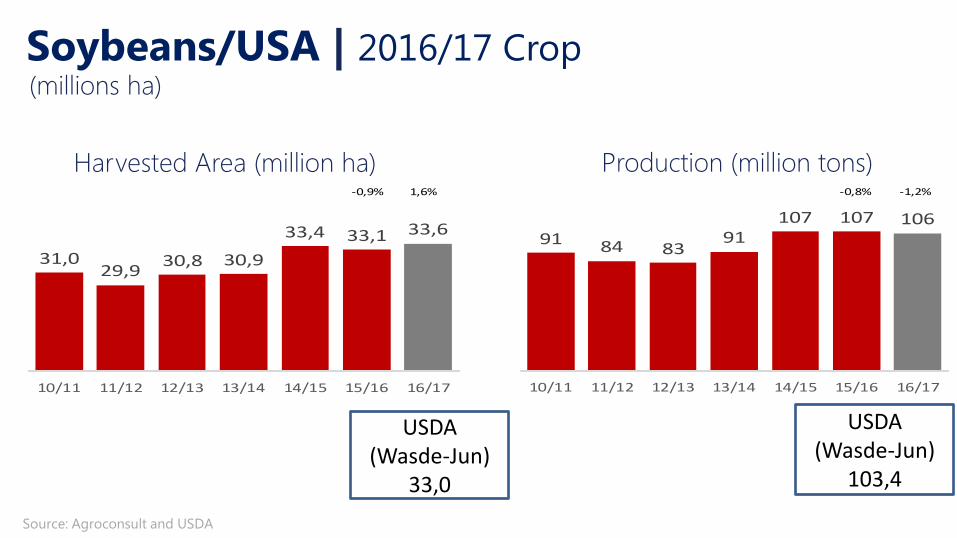
31,029,9
30,8 30,9
33,4 33,1 33,6
10/11 11/12 12/13 13/14 14/15 15/16 16/17
-0,9% 1,6%
Source: Agroconsult and USDA
(millions ha)
Soybeans/USA | 2016/17 Crop
91 84 8391
107 107 106
10/11 11/12 12/13 13/14 14/15 15/16 16/17
-0,8% -1,2%
Harvested Area (million ha) Production (million tons)
USDA (Wasde-Jun)
33,0
USDA (Wasde-Jun)
103,4
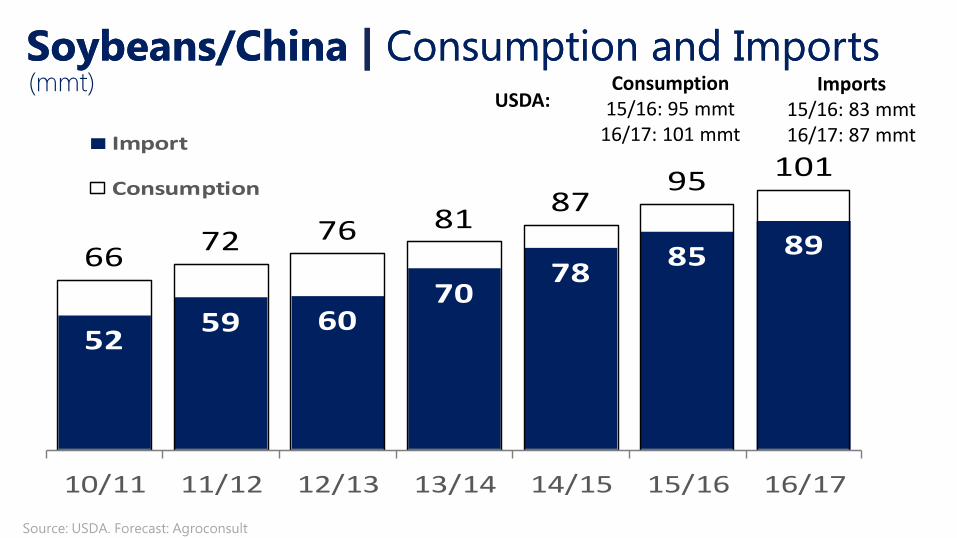
(mmt)
5259 60
7078
85 896672 76 81
8795 101
10/11 11/12 12/13 13/14 14/15 15/16 16/17
Import
Consumption
Soybeans/China | Consumption and Imports Soybeans/China | Consumption and Imports
Source: USDA. Forecast: Agroconsult
Imports 15/16: 83 mmt 16/17: 87 mmt
Consumption 15/16: 95 mmt
16/17: 101 mmt
USDA:
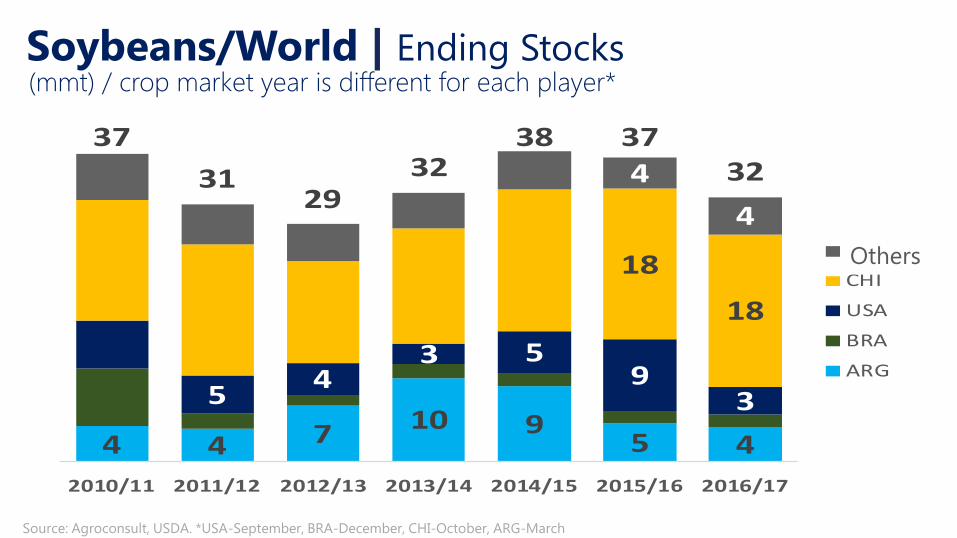
4 4 710 9
5 4
54
3 59
3
18
18
4
4
37
3129
3238 37
32
2010/11 2011/12 2012/13 2013/14 2014/15 2015/16 2016/17
Others
CHI
USA
BRA
ARG
Others
Soybeans/World | Ending Stocks (mmt) / crop market year is different for each player*
Source: Agroconsult, USDA. *USA-September, BRA-December, CHI-October, ARG-March
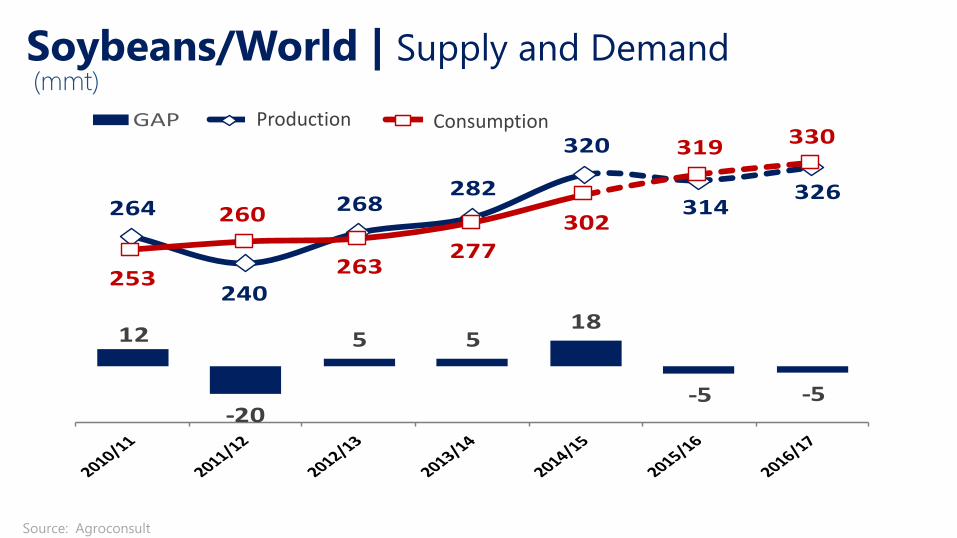
12
-20
5 518
-5 -5
264
240
268282
320
314326
253
260
263277
302
319 330GAP Produção Consumo
(mmt) Soybeans/World | Supply and Demand
Source: Agroconsult
Production Consumption
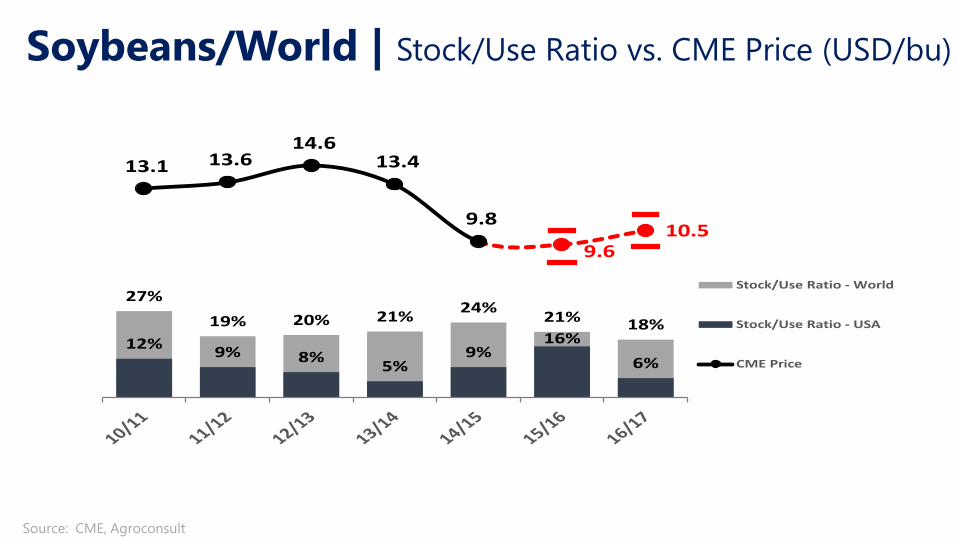
Soybeans/World | Stock/Use Ratio vs. CME Price (USD/bu)
Source: CME, Agroconsult
27%
19% 20% 21%24%
21% 18%12%
9% 8%5%
9%16%
6%
13.1 13.6 14.6
13.4
9.8
9.6 10.5
Stock/Use Ratio - World
Stock/Use Ratio - USA
CME Price
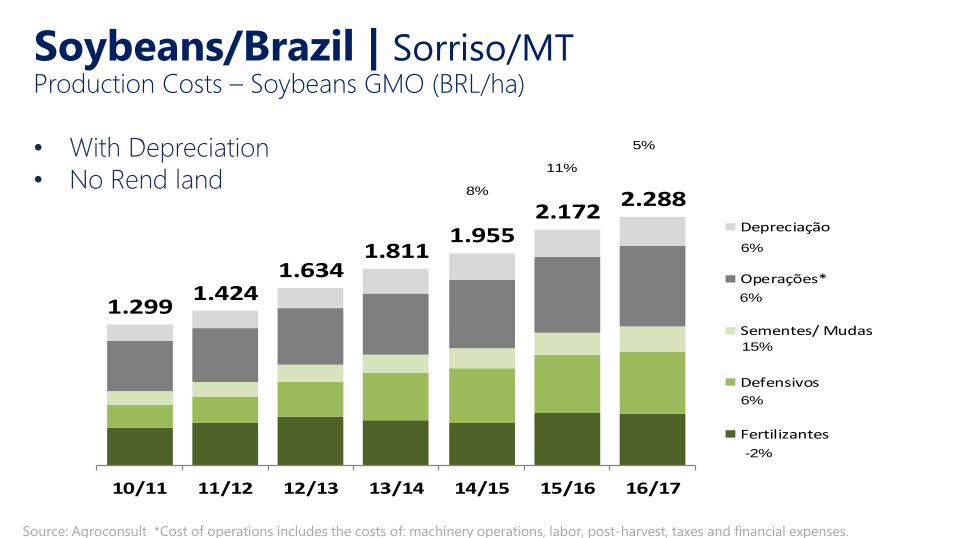
Source: Agroconsult *Cost of operations includes the costs of: machinery operations, labor, post-harvest, taxes and financial expenses.
Soybeans/Brazil | Sorriso/MT Production Costs – Soybeans GMO (BRL/ha)
• With Depreciation
• No Rend land
1.2991.424
1.6341.811
1.9552.172
2.288
10/11 11/12 12/13 13/14 14/15 15/16 16/17
Depreciação
Operações*
Sementes/ Mudas
Defensivos
Fertilizantes
11%
8%
15%
6%
-2%
6%
6%
5%

24,2 25,027,7
30,232,1 33,1 33,6
10/11 11/12 12/13 13/14 14/15 15/16 16/17
6% 3% 2%
Source: CONAB. Forecast: Agroconsult
Soybeans/Brazil | Planted Area (millions ha)

CORN
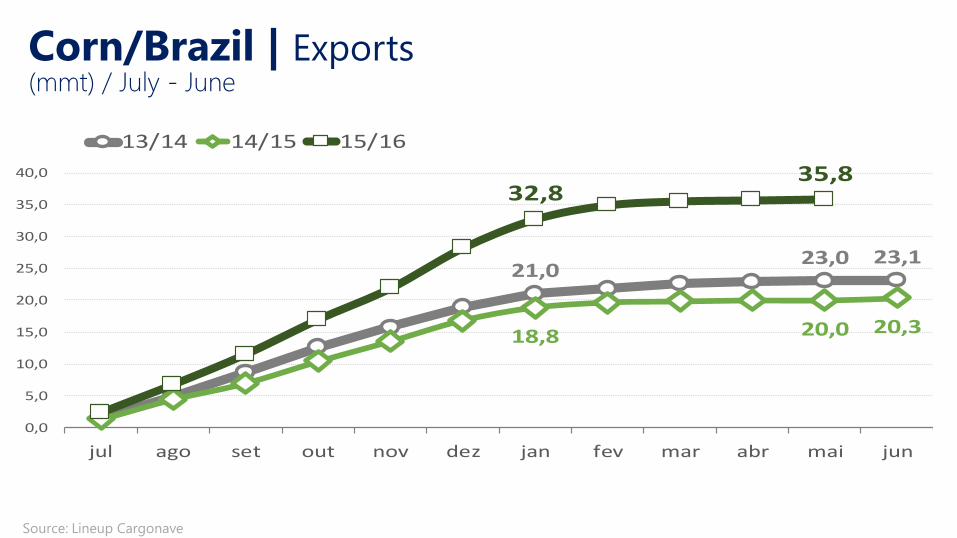
Corn/Brazil | Exports
Source: Lineup Cargonave
(mmt) / July - June
21,023,0 23,1
18,8 20,0 20,3
32,835,8
0,0
5,0
10,0
15,0
20,0
25,0
30,0
35,0
40,0
jul ago set out nov dez jan fev mar abr mai jun
13/14 14/15 15/16
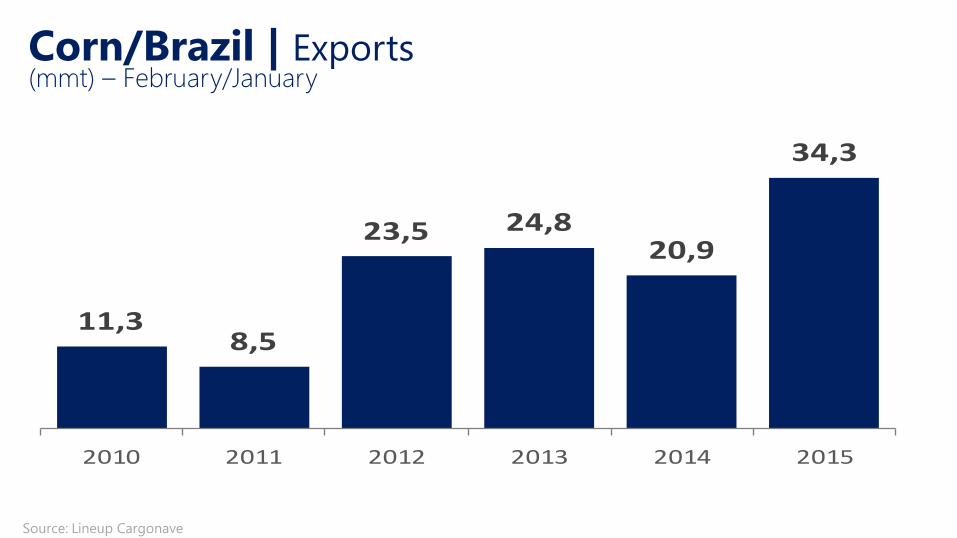
11,38,5
23,5 24,820,9
34,3
2010 2011 2012 2013 2014 2015
Corn/Brazil | Exports (mmt) – February/January
Source: Lineup Cargonave
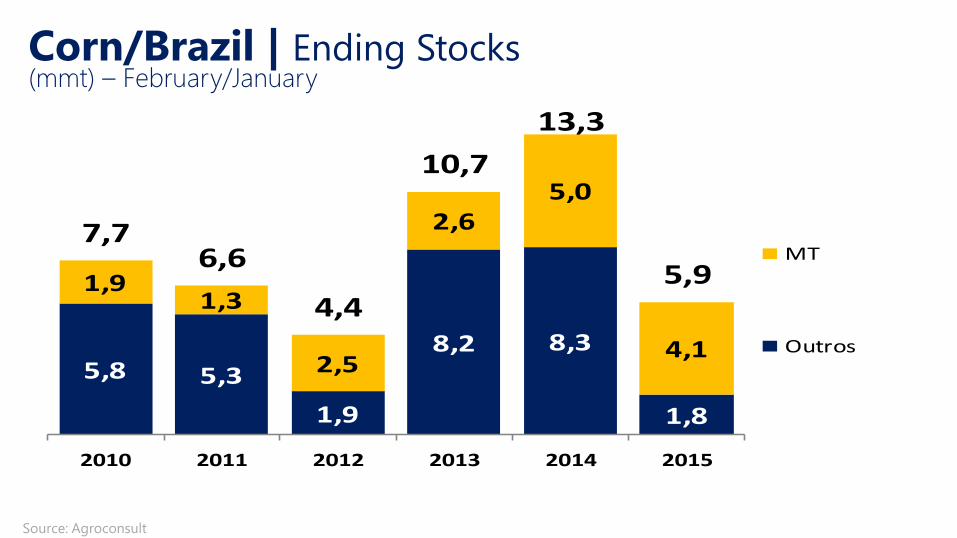
5,8 5,3
1,9
8,2 8,3
1,8
1,91,3
2,5
2,65,0
4,1
7,76,6
4,4
10,7
13,3
5,9
2010 2011 2012 2013 2014 2015
MT
Outros
Corn/Brazil | Ending Stocks
Source: Agroconsult
(mmt) – February/January
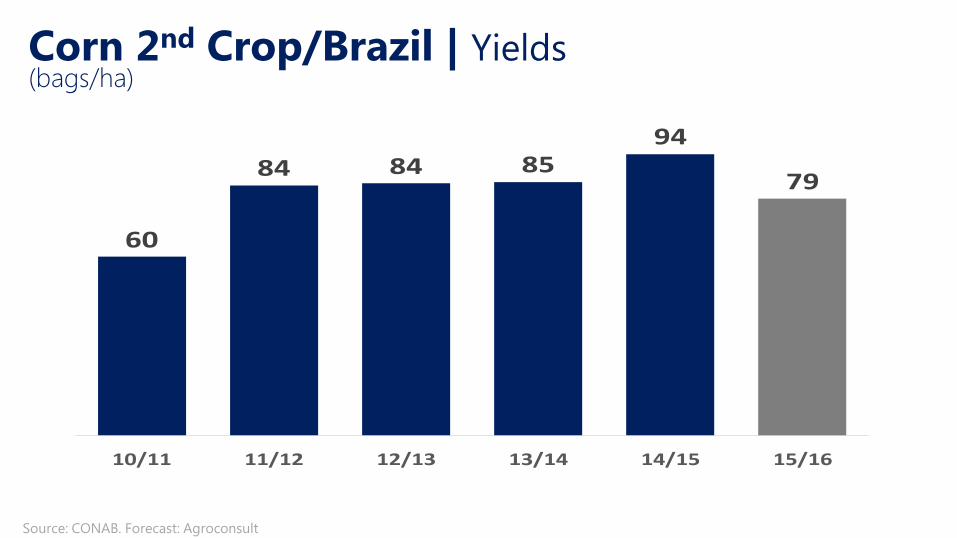
60
84 84 8594
79
10/11 11/12 12/13 13/14 14/15 15/16
Corn 2nd Crop/Brazil | Yields (bags/ha)
Source: CONAB. Forecast: Agroconsult
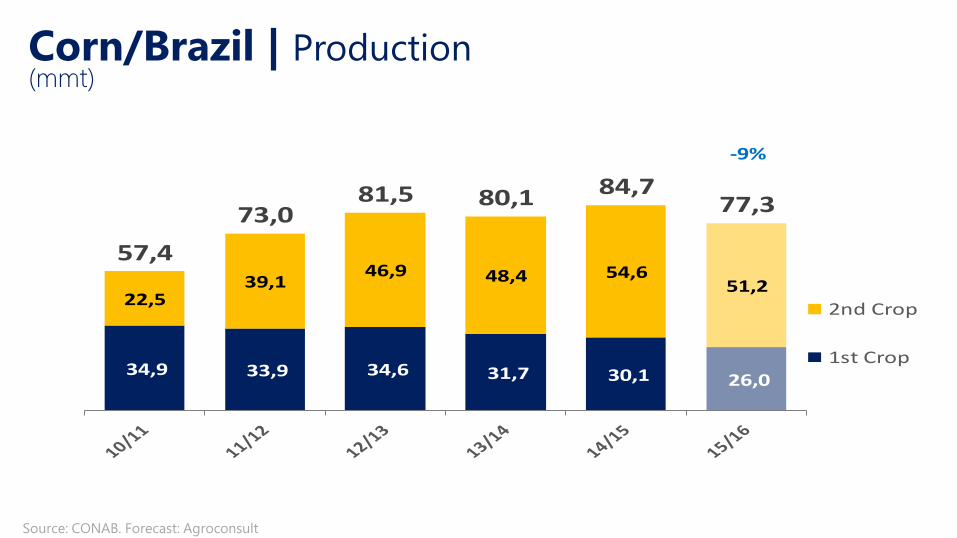
34,9 33,9 34,6 31,7 30,1 26,0
22,539,1
46,9 48,4 54,651,2
57,4
73,081,5 80,1 84,7
77,3
2nd Crop
1st Crop
-9%
(mmt) Corn/Brazil | Production
Source: CONAB. Forecast: Agroconsult

Corn 2ª Crop/MT, MS, GO | Commercialization (mmt)
6.6
19.5
25.5
0.0
5.0
10.0
15.0
20.0
25.0
30.0
35.0
40.0
13/14
14/15
15/16
Source: IMEA and Agroconsult.

20
25
30
35
40
45
50
55ARG FOB BRA BM&F
Corn | Import Parity – Paranaguá Port (BRL/sc)
Source: Agroconsult.
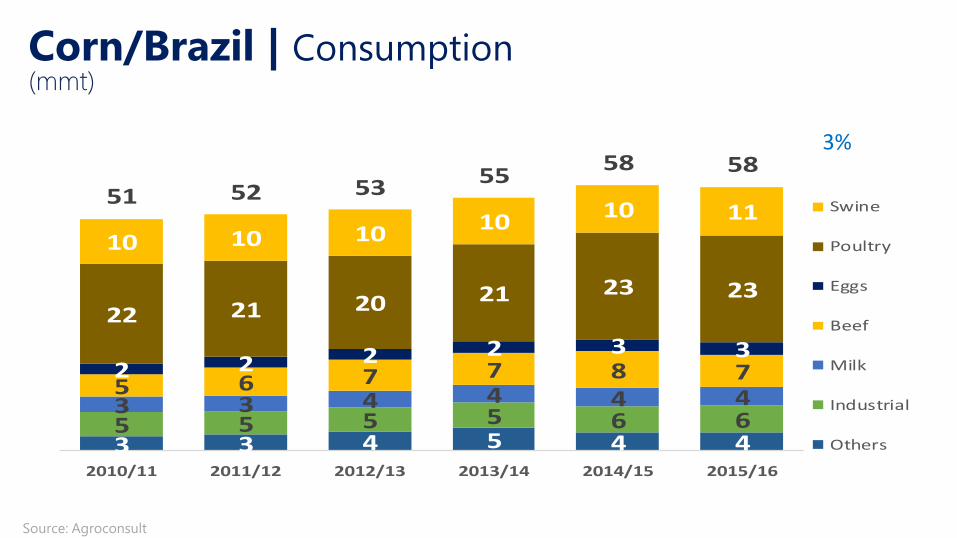
3 3 4 5 4 45 5 5 5 6 63 3 4 4 4 45 6 7 7 8 72 2 2 2 3 3
22 21 20 21 23 23
10 10 1010
10 1151 52 53
5558 58
0
10
20
30
40
50
60
70
2010/11 2011/12 2012/13 2013/14 2014/15 2015/16
Swine
Poultry
Eggs
Beef
Milk
Industrial
Others
Source: Agroconsult
Corn/Brazil | Consumption (mmt)
3%
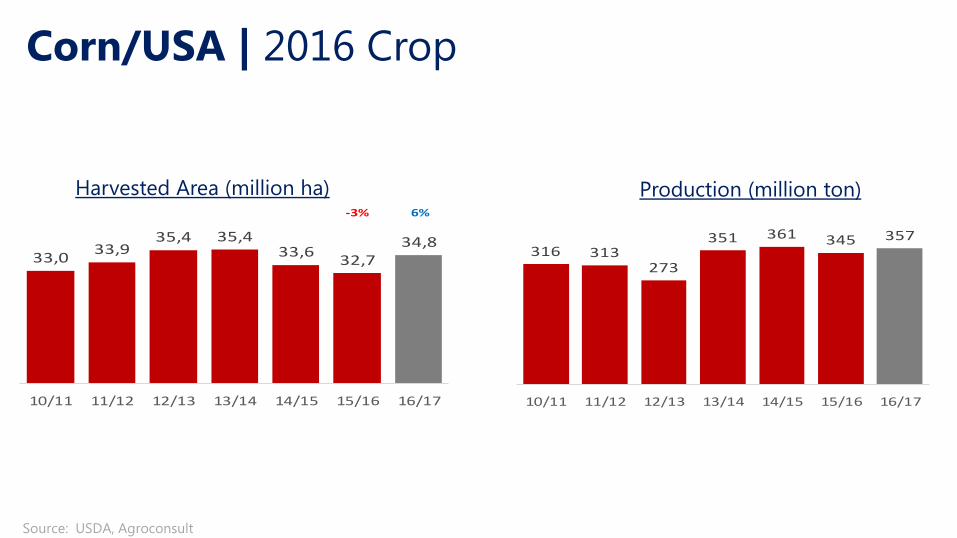
33,033,9
35,4 35,433,6
32,734,8
10/11 11/12 12/13 13/14 14/15 15/16 16/17
-3% 6%
Source: USDA, Agroconsult
Corn/USA | 2016 Crop
Harvested Area (million ha) Production (million ton)
316 313273
351 361 345 357
10/11 11/12 12/13 13/14 14/15 15/16 16/17
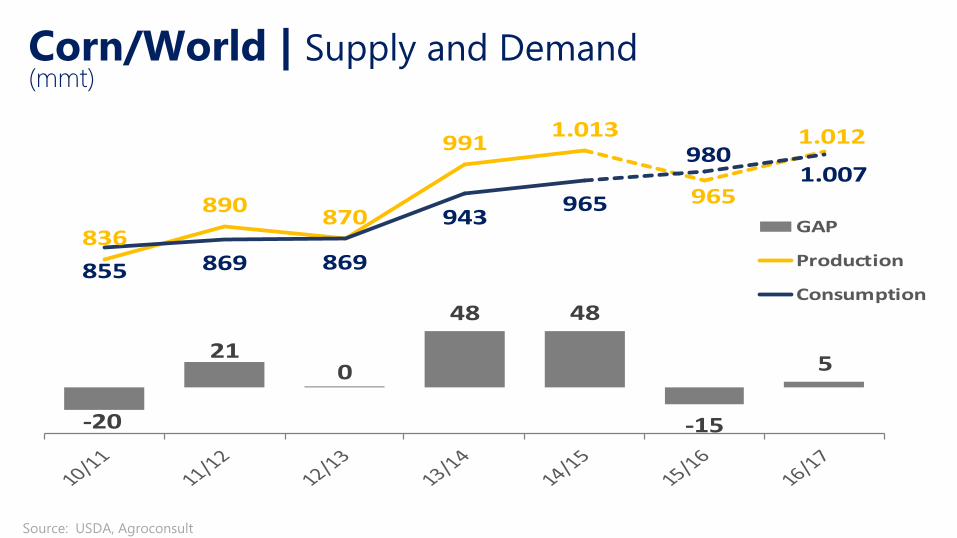
(mmt) Corn/World | Supply and Demand
Source: USDA, Agroconsult
-20
210
48 48
-15
5
836
890870
9911.013
965
1.012
855 869 869
943965
9801.007
GAP
Production
Consumption

Corn/World | Imports
Source: USDA Prepared by: Agroconsult
(mmt)
14,7 14,7 14,5
8,6 15,0 13,011,3
12,0 13,510,2
10,0 10,519,2
19,9 20,8
61,261,7 57,192,3
100,4 99,6
125,2 125,2133,2 129,4
10/11 11/12 12/13 13/14 14/15 15/16 16/17
Others
Africa
SouthKoreaMexico
EU-27
Japan
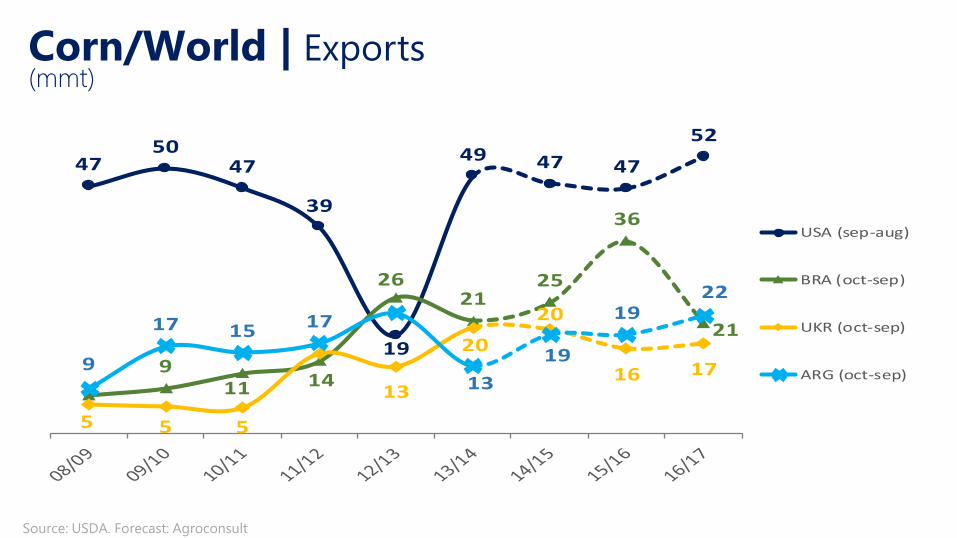
Corn/World | Exports (mmt)
Source: USDA. Forecast: Agroconsult
4750
47
39
19
49 47 47
52
911 14
2621
25
36
21
5 5 5
13
20
20
16 179
17 15 17
13
19
1922
USA (sep-aug)
BRA (oct-sep)
UKR (oct-sep)
ARG (oct-sep)
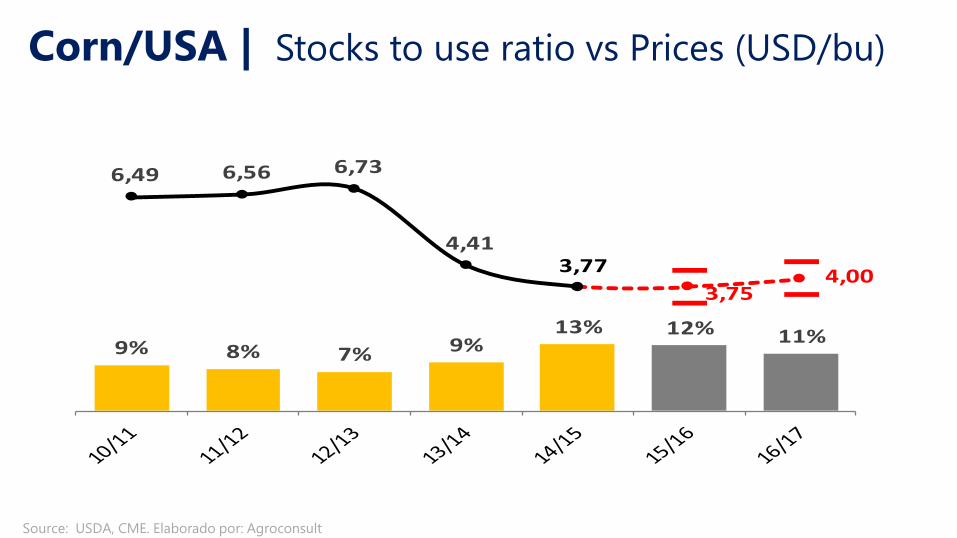
9% 8% 7% 9%13% 12% 11%
6,49 6,56 6,73
4,41 3,77
3,75 4,00
Source: USDA, CME. Elaborado por: Agroconsult
Corn/USA | Stocks to use ratio vs Prices (USD/bu)
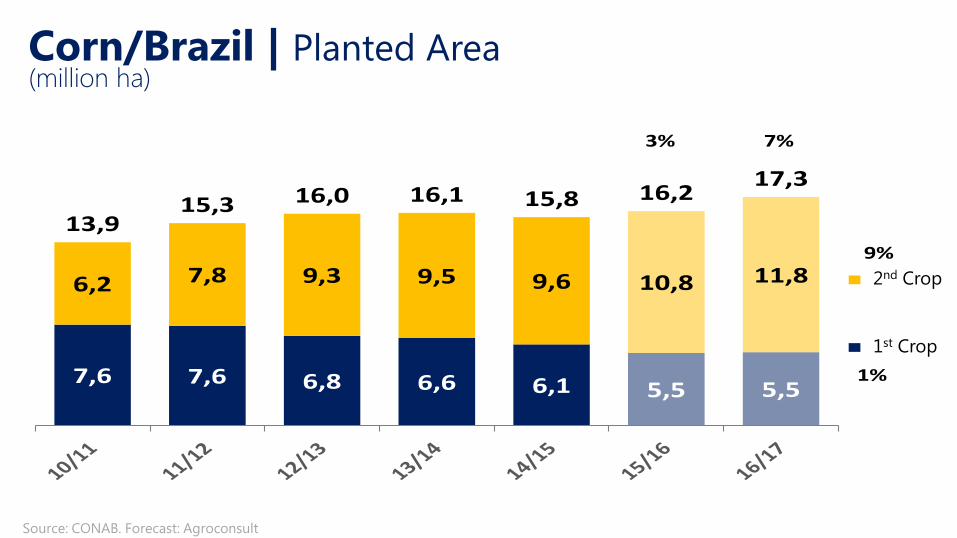
7,6 7,6 6,8 6,6 6,1 5,5 5,5
6,2 7,8 9,3 9,5 9,6 10,8 11,8
13,915,3 16,0 16,1 15,8 16,2
17,3
2ª Safra
1ª Safra
3%
1%
9%
7%
(million ha) Corn/Brazil | Planted Area
Source: CONAB. Forecast: Agroconsult
1st Crop
2nd Crop