Page 1 of 9 Details of Bureau / Delivery Unit...
9
Details of Bureau / Delivery Unit Accomplishment As of November 30, 2012 BatStateU Department Accomplishments on Cascaded Performance Targets (Form I-A) Page 1 of 9 Major Final Outputs / Responsible Bureaus or Delivery Units Performance Indicator 1 (1) (2) A. Major Final Outputs (MFOs)/Operations MFO 1: Advanced and Higher Education Services Percentage of FTE Students on Mandated and Priority Programs 4274 5137 5326 5232 27664 29378 28342 28860 786 976 1288 1132 27664 29378 28342 28860 2748 3233 3165 3199 27664 29378 28342 28860 Other Fields 371 478 449 464 27664 29378 28342 28860 293 374 352 363 27664 29378 28342 28860 76 76 72 74 27664 29378 28342 28860 9561 10599 9634 10118 27664 29378 28342 28860 5040 5332 4913 5123 27664 29378 28342 28860 2577 3173 2869 3021 27664 29378 28342 28860 Other Fields 481 650 579 615 27664 29378 28342 28860 1463 1444 1273 1359 27664 29378 28342 28860 (3) Q1 Q2 Q3 Q4 T FY 2012 Performance Targets FY 2012 QUARTERLY ACCOMPLISHMENTS (4) REMARKS (Cite reasons for exceeding or not meeting targets) 18.13% Bureau 1: Main Campus 15.45% 17.49% 18.79% Teacher Education 2.84% 3.32% 4.54% 3.92% Business and Related 9.93% 11.00% 11.17% 11.08% Customs Administration 1.34% 1.63% 1.58% 1.61% 1.26% Criminology 1.06% 1.27% 1.24% Natural Science, Mathematics and Chemistry 0.27% 0.26% 0.25% 0.26% Bureau 2: Alangilan Campus 34.56% 36.08% 33.99% 35.06% 18.15% 17.33% 17.75% Engineering 18.22% Industrial Technology 9.32% 10.80% 10.12% 10.47% 2.21% Architecture / Fine Arts 1.74% 2.13% 4.92% 4.49% 2.04% Information Technology 5.29% Some students of Information Technology shifted to other courses, hence its enrollment rate decreased while those of other programs increased. 4.71%
-
Upload
truonglien -
Category
Documents
-
view
217 -
download
1
Transcript of Page 1 of 9 Details of Bureau / Delivery Unit...

Details of Bureau / Delivery Unit AccomplishmentAs of November 30, 2012
BatStateU Department Accomplishments on Cascaded Performance Targets (Form I-A)Page 1 of 9
Major Final Outputs /Responsible Bureaus or Delivery Units
Performance Indicator 1
(1) (2)
A. Major Final Outputs (MFOs)/Operations
MFO 1: Advanced and Higher Education Services
Percentage of FTE Students on Mandated and Priority Programs
4274 5137 5326 523227664 29378 28342 28860
786 976 1288 113227664 29378 28342 288602748 3233 3165 3199
27664 29378 28342 28860
Other Fields
371 478 449 46427664 29378 28342 28860
293 374 352 36327664 29378 28342 28860
76 76 72 7427664 29378 28342 288609561 10599 9634 10118
27664 29378 28342 288605040 5332 4913 5123
27664 29378 28342 28860
2577 3173 2869 302127664 29378 28342 28860
Other Fields
481 650 579 61527664 29378 28342 288601463 1444 1273 1359
27664 29378 28342 28860
(3) Q1 Q2 Q3 Q4 T
FY 2012 Performance
Targets
FY 2012 QUARTERLY ACCOMPLISHMENTS
(4)
REMARKS(Cite reasons for exceeding or not meeting targets)
18.13%Bureau 1: Main Campus 15.45% 17.49% 18.79%
Teacher Education 2.84% 3.32% 4.54% 3.92%
Business and Related 9.93% 11.00% 11.17% 11.08%
Customs Administration 1.34% 1.63% 1.58% 1.61%
1.26%Criminology 1.06% 1.27% 1.24%
Natural Science, Mathematics and Chemistry 0.27% 0.26% 0.25% 0.26%
Bureau 2: Alangilan Campus 34.56% 36.08% 33.99% 35.06%
18.15% 17.33% 17.75%Engineering 18.22%
Industrial Technology 9.32% 10.80% 10.12% 10.47%
2.21%Architecture / Fine Arts 1.74% 2.13%
4.92% 4.49%
2.04%
Information Technology 5.29%
Some students of Information Technology shifted to other courses, hence its enrollment rate decreased while those of other programs increased.
4.71%

Details of Bureau / Delivery Unit AccomplishmentAs of November 30, 2012
BatStateU Department Accomplishments on Cascaded Performance Targets (Form I-A)Page 2 of 9
Major Final Outputs /Responsible Bureaus or Delivery Units
Performance Indicator 1
(1) (2)
12078 12955 11915 1243727664 29378 28342 288601458 1742 1715 1729
27664 29378 28342 288601587 1972 1605 1789
27664 29378 28342 28860
2722 2626 2450 253827664 29378 28342 288603933 4263 3911 4087
27664 29378 28342 28860
Other Fields
657 693 641 66727664 29378 28342 288601594 1531 1480 1506
27664 29378 28342 28860127 128 113 121
27664 29378 28342 28860
MFO 2: Research Services
Number of outputs published in CHED accredited journals/ internationally indexed journals
In Refereed National Journals
In Other National Journals
FY 2012 Performance
Targets
FY 2012 QUARTERLY ACCOMPLISHMENTS
(4)
REMARKS(Cite reasons for exceeding or not meeting targets)(3) Q1 Q2 Q3 Q4 T
43.09%44.10% 42.04%Bureau 3: Extension Campuses 43.66%
5.93% 6.05% 5.99%Teacher Education 5.27%
6.71% 5.66% 6.20%Engineering 5.74%
14.51% 13.80% 14.16%
8.94%
Business and Related 14.22%
Information Technology 5.76% 5.21% 5.22%
Industrial Technology 9.84% 8.64% 8.79%
Criminology 2.37% 2.36% 2.26% 2.31%
5.22%
Some students of Information Technology shifted to other courses, hence its enrollment rate decreased while those of other programs increased.
Agriculture, Forestry and Fisheries 0.46% 0.44% 0.40% 0.42%
1 0 4 2
0 It is really a tough task forresearchers to have their works published in refereed international and national journals.
0In Refereed International Journals
1 0 0 0
1 0 0 0 0 0
0 6

Details of Bureau / Delivery Unit AccomplishmentAs of November 30, 2012
BatStateU Department Accomplishments on Cascaded Performance Targets (Form I-A)Page 3 of 9
Major Final Outputs /Responsible Bureaus or Delivery Units
Performance Indicator 1
(1) (2)
B. Support to Operations (STO)
Number of Externally Funded Scholars obtained and served
C. General Administration and Support Services (GASS) Finance and Administration Group
Cost amount of infrastructure projects and other physical facilities funded
For Main CampusFor Alangilan CampusFor Extension Campuses
Q4 T
FY 2012 Performance
Targets
FY 2012 QUARTERLY ACCOMPLISHMENTS
(4)
REMARKS(Cite reasons for exceeding or not meeting targets)(3) Q1 Q2 Q3
17 7 8 36MFO 3: Extension Services
Number of technologies transferred / adopted
21 4
6444 4530 10974
All targets are met.
10916
80,071,705.09 103,724,243.524,154,941.43 3,899,305.09 8054246.52
76,172,400 87779898.267,890,098.74 7890098.74
100,000,000
11,607,498.26
23,652,538.43

Details of Bureau / Delivery Unit AccomplishmentAs of November 30, 2012
BatStateU Department Accomplishments on Cascaded Performance Targets (Form I-A)Page 4 of 9
Major Final Outputs /Responsible Bureaus or Delivery Units
Performance Indicator 2
(1) (5)
A. Major Final Outputs (MFOs)/Operations
MFO 1: Advanced and Higher Education Services
Average Percentage Passing in Licensure in Mandated and Priority Programs
119 83 5 123 44 255289 170 7 267 58 50267 82 122 204
218 168 258 426
15 5 25 3025 7 29 36
Other Fields
31 9 933 11 115 1 10 117 2 18 201 1 16 9 9
334 68 71 135 56 330521 78 132 152 85 447308 61 54 135 54 304465 62 106 152 82 402
Other Fields
26 7 17 2 2656 16 26 3 45
Q2 T(6) Q1 Q3 Q4
FY 2012 Performance
Targets
FY 2012 QUARTERLY ACCOMPLISHMENTS
(7)
REMARKS(Cite reasons for exceeding or not meeting targets)
71.43% 46.07%Bureau 1: Main Campus 41.18% 48.82% 75.86% 50.80%
30.73%Teacher Education 48.81% 47.29% 47.89%
Business and Related 60.00% 71.43% 86.21% 83.33%
Customs Administration 93.94% 81.82% 81.82%
71.43% 50.00% 55.56% 55.00%Criminology
16.67%Natural Science, Mathematics and Chemistry 11.11% 11.11%
87.18%
88.82% 65.85% 75.62%
Bureau 2: Alangilan Campus 64.11% 53.79% 88.82% 65.88% 73.83%
50.94%
Industrial Technology
Engineering 66.24% 98.39%
Architecture / Fine Arts 46.43% 43.75% 65.38% 66.67% 57.78%
Information Technology
The targets set for Criminology and Chemistry were not met because the performance of the previous year's exam takers set the bar quite high and this year's batch was not able to keep the track record.

Details of Bureau / Delivery Unit AccomplishmentAs of November 30, 2012
BatStateU Department Accomplishments on Cascaded Performance Targets (Form I-A)Page 5 of 9
Major Final Outputs /Responsible Bureaus or Delivery Units
Performance Indicator 2
(1) (5)75 56 70 32 158
247 149 162 68 37921 51 67 118
135 117 153 270
6 9 911 10 10
Other Fields
38 5 23 2888 32 58 90
10 3 313 9 9
MFO 2: Research Services
Number of Outputs Disseminated or Presented
In National Fora / Conferences
In Regional Fora / Conferences
FY 2012 Performance
Targets
FY 2012 QUARTERLY ACCOMPLISHMENTS
(7)
REMARKS(Cite reasons for exceeding or not meeting targets)T(6) Q1 Q2 Q4
Bureau 3: Extension Campuses 30.36% 37.58%
Q3
43.21% 47.06% 41.69%
43.79% 43.70%
Engineering
Teacher Education 15.56% 43.59%
90.00% 90.00%Business and Related 54.55%
Criminology 43.18% 15.63% 39.66% 31.11%
Industrial Technology
76.92%
Information Technology
Agriculture, Forestry and Fisheries 33.33% 33.33%
The targets set for Criminology, Agriculture and Forestry were not met because the performance of the previous year's exam takers set the bar quite high and this year's batch was not able to keep the track record.
In International Fora / Conferences
12 0 13 4 0
7 68
17
51Accomplishments are much greater than targets, especially in international conferences since some of these were held within the country.
25 8 2
6 12 0 3 0 15

Details of Bureau / Delivery Unit AccomplishmentAs of November 30, 2012
BatStateU Department Accomplishments on Cascaded Performance Targets (Form I-A)Page 6 of 9
Major Final Outputs /Responsible Bureaus or Delivery Units
Performance Indicator 2
(1) (5)
B. Support to Operations (STO)
Number of students / personnel provided with non-academic related services
Total is average of Q2 and Q4
C. General Administration and Support Services (GASS) Finance and Administration Group
Income generated as proportion to total operation cost
For Main CampusFor Alangilan CampusFor Extension Campuses
(6)
FY 2012 Performance
TargetsT
FY 2012 QUARTERLY ACCOMPLISHMENTS
(7)
REMARKS(Cite reasons for exceeding or not meeting targets)Q1 Q2 Q3 Q4
40 168Accomplishment is 93.33% of the target.
MFO 3: Extension Services
Number of trainings / extension activities assessed as very good to excellent / relevant or useful
180 39 40 49
21000 33995 31365 32680
43,514,823.67 172,898,342.06
70,284,796.01 44,568,754.87 56,071,291.28 211,541,348.4169,525,199.29 41,966,756.69 54,143,248.06 210,789,088.41539055
(70.56%)
37,600,614.18 56,871,374.05 34,911,530.16
123,371,004.8040,616,506.2545,153,884.37
595,228,778.88
Target is met.
196,681,369.35 121,447,041.72 153,729,363.01

Details of Bureau / Delivery Unit AccomplishmentAs of November 30, 2012
BatStateU Department Accomplishments on Cascaded Performance Targets (Form I-A)Page 7 of 9
Major Final Outputs /Responsible Bureaus or Delivery Units
Performance Indicator 3
(1) (8)
A. Major Final Outputs (MFOs)/Operations
MFO 1: Advanced and Higher Education Services
Percentage ofGraduates in the Mandated / Priority Fields within the prescribed period
652 587 587927 927 927103 90 90157 157 157474 451 451632 632 632
Other Fields
42 25 2583 83 8319 16 1637 37 3714 5 518 18 18
1567 2724 27243782 3782 3782604 503 503
1259 1259 1259640 2026 2026
2060 2060 2060
Other Fields
50 30 3099 99 99
273 165 165364 364 364
Q3 Q4 T
FY 2012 QUARTERLY ACCOMPLISHMENTS
(10)REMARKS
(11)(9) Q1 Q2
FY 2012 Performance
Targets
63.32%Bureau 1: Main Campus 70.33% 63.32%
57.32%Teacher Education 65.61% 57.32%
Business and Related 75.00% 71.36% 71.36%
30.12%Customs Administration 50.60% 30.12%
43.24%Criminology 51.35% 43.24%
27.78%Natural Science, Mathematics and Chemistry 77.78%
Engineering
27.78%
Bureau 2: Alangilan Campus
39.95%
72.03%41.43% 72.03%
98.35%
Incomplete and/or failing grades; and failure to submit course requirements are some of the factors as to why not all students graduate within the prescribed period.
Industrial Technology 31.07%
47.97% 39.95%
98.35%
Architecture / Fine Arts 30.30%50.51% 30.30%
Information Technology 75.00% 45.33% 45.33%
Details of Bureau / Delivery Unit AccomplishmentAs of November 30, 2012
BatStateU Department Accomplishments on Cascaded Performance Targets (Form I-A)Page 8 of 9
Major Final Outputs /Responsible Bureaus or Delivery Units
Performance Indicator 3
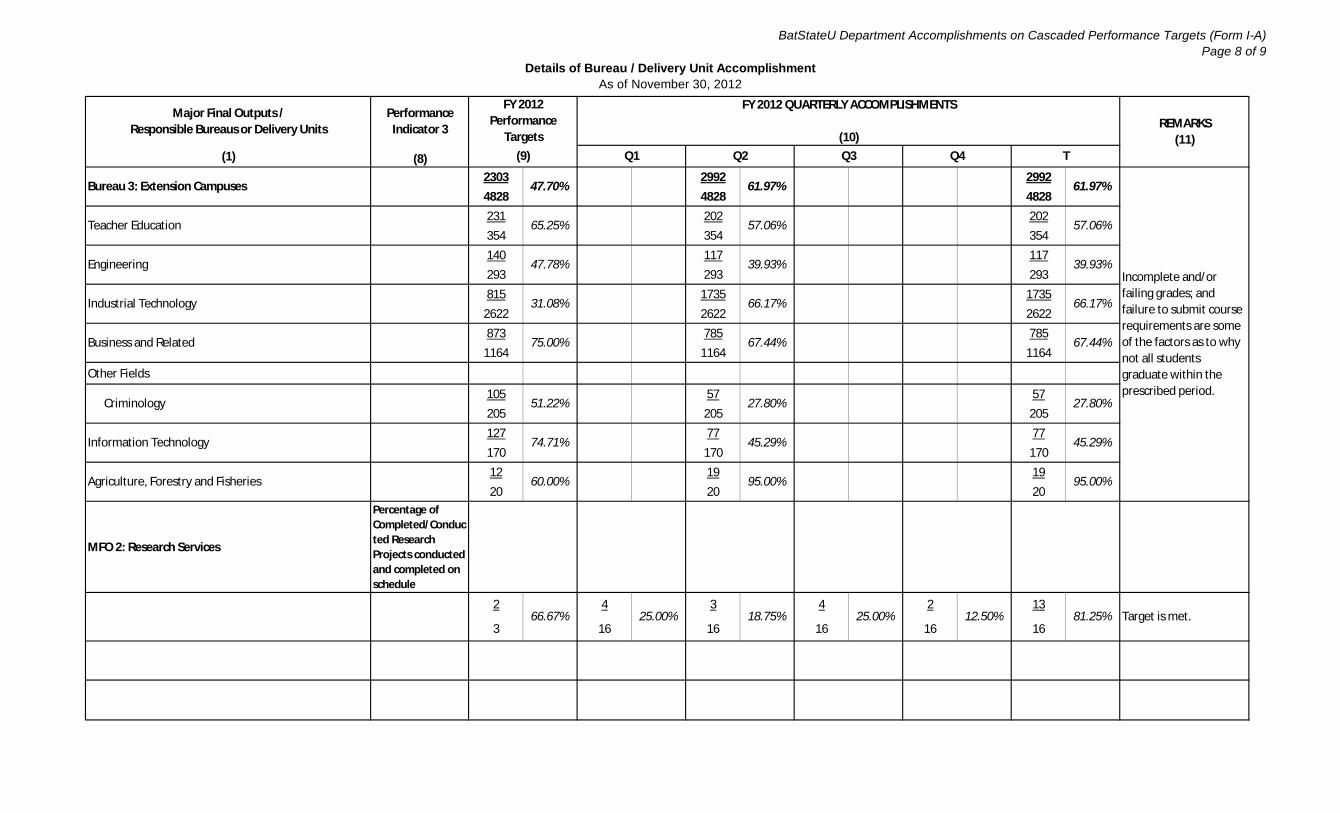
(1) (8)2303 2992 29924828 4828 4828231 202 202354 354 354140 117 117293 293 293815 1735 1735
2622 2622 2622873 785 785
1164 1164 1164
Other Fields
105 57 57205 205 205127 77 77170 170 17012 19 1920 20 20
MFO 2: Research Services
Percentage of Completed/Conducted Research Projects conducted and completed on schedule
2 4 3 4 2 13
3 16 16 16 16 16
FY 2012 Performance
Targets
FY 2012 QUARTERLY ACCOMPLISHMENTS
(10)Q3 Q4 T(9) Q1 Q2
REMARKS(11)
Bureau 3: Extension Campuses 61.97%47.70% 61.97%
57.06%Teacher Education 57.06%65.25%
39.93%Engineering 47.78%
66.17%31.08% 66.17%
39.93%
Business and Related
Industrial Technology
Criminology
67.44%75.00% 67.44%
27.80% 27.80%
45.29%
Incomplete and/or failing grades; and failure to submit course requirements are some of the factors as to why not all students graduate within the prescribed period.
Information Technology 74.71%
51.22%
45.29%
60.00% 95.00% 95.00%Agriculture, Forestry and Fisheries
25.00% 12.50% 81.25%25.00% 18.75% Target is met.66.67%

Details of Bureau / Delivery Unit AccomplishmentAs of November 30, 2012
BatStateU Department Accomplishments on Cascaded Performance Targets (Form I-A)Page 9 of 9
Major Final Outputs /Responsible Bureaus or Delivery Units
Performance Indicator 3
(1) (8)
132 31 32 41 35 139176 39 40 49 41 169
B. Support to Operations (STO) n/a There is no PI 3.
C. General Administration and Support Services (GASS) Finance and Administration Group
n/a There is no PI 3.
Prepared by:
ROMER C. CASTILLOPlanning Officer
(9) Q1 Q2
FY 2012 Performance
Targets
FY 2012 QUARTERLY ACCOMPLISHMENTS
(10)REMARKS
(11)
Target is met.MFO 3: Extension Services
Percentage of trainings/ extension activities conducted on schedule
75.00%
Q3 Q4
85.37% 82.25%
T
79.49% 80.00% 83.67%
Approved by:
Budget Officer University PresidentMARCELINA EVA T. RAYOS NORA LUMBERA-MAGNAYE, PhD