Page 1 of 6 BURIED TREASURE USING EXPERIENCE...
6
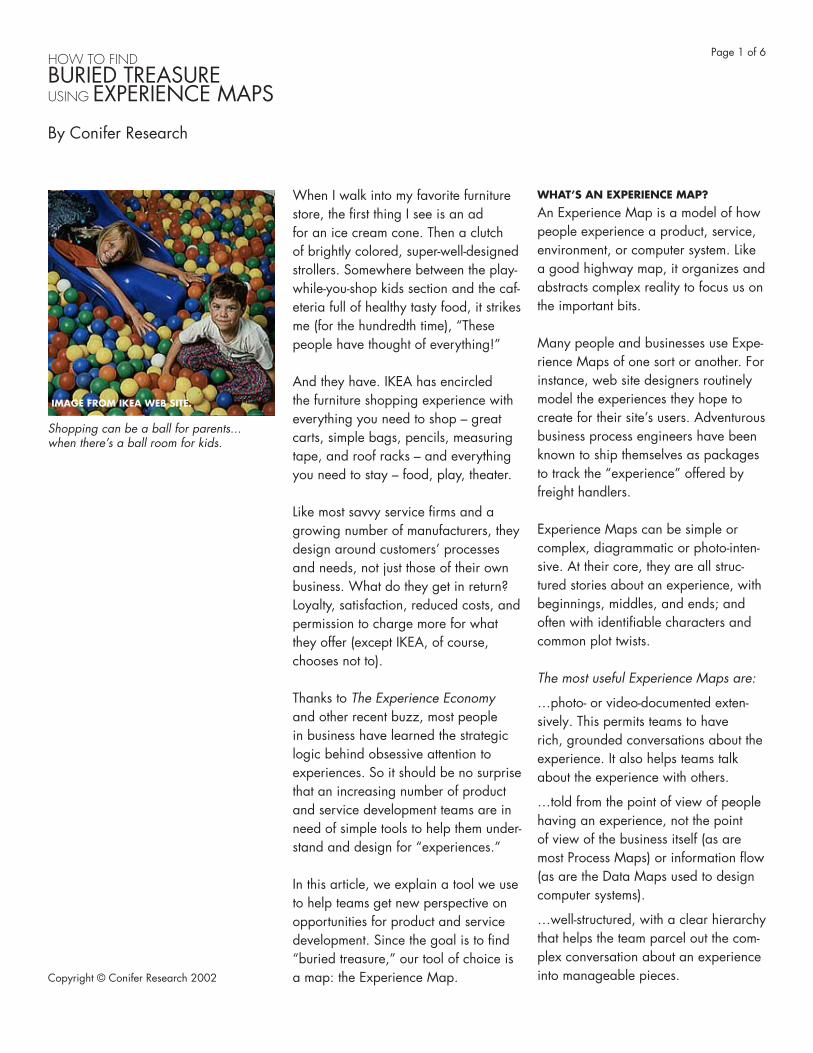
When I walk into my favorite furniture store, the first thing I see is an ad for an ice cream cone. Then a clutch of brightly colored, super-well-designed strollers. Somewhere between the play- while-you-shop kids section and the caf- eteria full of healthy tasty food, it strikes me (for the hundredth time), “These people have thought of everything!” And they have. IKEA has encircled the furniture shopping experience with everything you need to shop – great carts, simple bags, pencils, measuring tape, and roof racks – and everything you need to stay – food, play, theater. Like most savvy service firms and a growing number of manufacturers, they design around customers’ processes and needs, not just those of their own business. What do they get in return? Loyalty, satisfaction, reduced costs, and permission to charge more for what they offer (except IKEA, of course, chooses not to). Thanks to The Experience Economy and other recent buzz, most people in business have learned the strategic logic behind obsessive attention to experiences. So it should be no surprise that an increasing number of product and service development teams are in need of simple tools to help them under- stand and design for “experiences.” In this article, we explain a tool we use to help teams get new perspective on opportunities for product and service development. Since the goal is to find “buried treasure,” our tool of choice is a map: the Experience Map. WHAT’S AN EXPERIENCE MAP? An Experience Map is a model of how people experience a product, service, environment, or computer system. Like a good highway map, it organizes and abstracts complex reality to focus us on the important bits. Many people and businesses use Expe- rience Maps of one sort or another. For instance, web site designers routinely model the experiences they hope to create for their site’s users. Adventurous business process engineers have been known to ship themselves as packages to track the “experience” offered by freight handlers. Experience Maps can be simple or complex, diagrammatic or photo-inten- sive. At their core, they are all struc- tured stories about an experience, with beginnings, middles, and ends; and often with identifiable characters and common plot twists. The most useful Experience Maps are: …photo- or video-documented exten- sively. This permits teams to have rich, grounded conversations about the experience. It also helps teams talk about the experience with others. …told from the point of view of people having an experience, not the point of view of the business itself (as are most Process Maps) or information flow (as are the Data Maps used to design computer systems). …well-structured, with a clear hierarchy that helps the team parcel out the com- plex conversation about an experience into manageable pieces. HOW TO FIND BURIED TREASURE USING EXPERIENCE MAPS By Conifer Research Page 1 of 6 Copyright © Conifer Research 2002 Shopping can be a ball for parents... when there’s a ball room for kids. IMAGE FROM IKEA WEB SITE.
Transcript of Page 1 of 6 BURIED TREASURE USING EXPERIENCE...
When I walk into my favorite furniture store, the first thing I see is an ad for an ice cream cone. Then a clutch of brightly colored, super-well-designed strollers. Somewhere between the play-while-you-shop kids section and the caf-eteria full of healthy tasty food, it strikes me (for the hundredth time), “These people have thought of everything!” And they have. IKEA has encircled the furniture shopping experience with everything you need to shop – great carts, simple bags, pencils, measuring tape, and roof racks – and everything you need to stay – food, play, theater.
Like most savvy service firms and a growing number of manufacturers, they design around customers’ processes and needs, not just those of their own business. What do they get in return? Loyalty, satisfaction, reduced costs, and permission to charge more for what they offer (except IKEA, of course, chooses not to). Thanks to The Experience Economy and other recent buzz, most people in business have learned the strategic logic behind obsessive attention to experiences. So it should be no surprise that an increasing number of product and service development teams are in need of simple tools to help them under-stand and design for “experiences.”
In this article, we explain a tool we use to help teams get new perspective on opportunities for product and service development. Since the goal is to find “buried treasure,” our tool of choice is a map: the Experience Map.
WHAT’S AN EXPERIENCE MAP?
An Experience Map is a model of how people experience a product, service, environment, or computer system. Like a good highway map, it organizes and abstracts complex reality to focus us on the important bits.
Many people and businesses use Expe-rience Maps of one sort or another. For instance, web site designers routinely model the experiences they hope to create for their site’s users. Adventurous business process engineers have been known to ship themselves as packages to track the “experience” offered by freight handlers.
Experience Maps can be simple or complex, diagrammatic or photo-inten-sive. At their core, they are all struc-tured stories about an experience, with beginnings, middles, and ends; and often with identifiable characters and common plot twists.
The most useful Experience Maps are:
…photo- or video-documented exten-sively. This permits teams to have rich, grounded conversations about the experience. It also helps teams talk about the experience with others.
…told from the point of view of people having an experience, not the point of view of the business itself (as are most Process Maps) or information flow (as are the Data Maps used to design computer systems).
…well-structured, with a clear hierarchy that helps the team parcel out the com-plex conversation about an experience into manageable pieces.
HOW TO FIND BURIED TREASURE USING EXPERIENCE MAPS
By Conifer Research
Page 1 of 6
Copyright © Conifer Research 2002
Shopping can be a ball for parents...when there’s a ball room for kids.
IMAGE FROM IKEA WEB SITE.
And most importantly,
…collaborative, emerging from conver-sations among a team with multiple points of view. It’s vital that the team include people who are quite familiar with why the existing experience is the way it is but also people who don’t have preconceptions. Successful pro-cesses don’t let either of these points of view dominate.
The Experience Model
The approach we use to structure Expe-rience Maps builds on decades of anthropological research about how cultures create and perpetuate rituals – the most highly structured experiences human beings create for one another.
Across most cultures and throughout his-tory, there is a common structure to ritu-als. Anthropologist Arnold Van Gennep first laid out this structure to explain the common human rituals of transforma-tion – coming-of-age, graduation, mar-riage, coronation, dying, etc. Over the years, others have used and built on his basic theory. The version we like is streamlined and simplified a bit – to make it easy to remember and use – but it captures the basic idea.
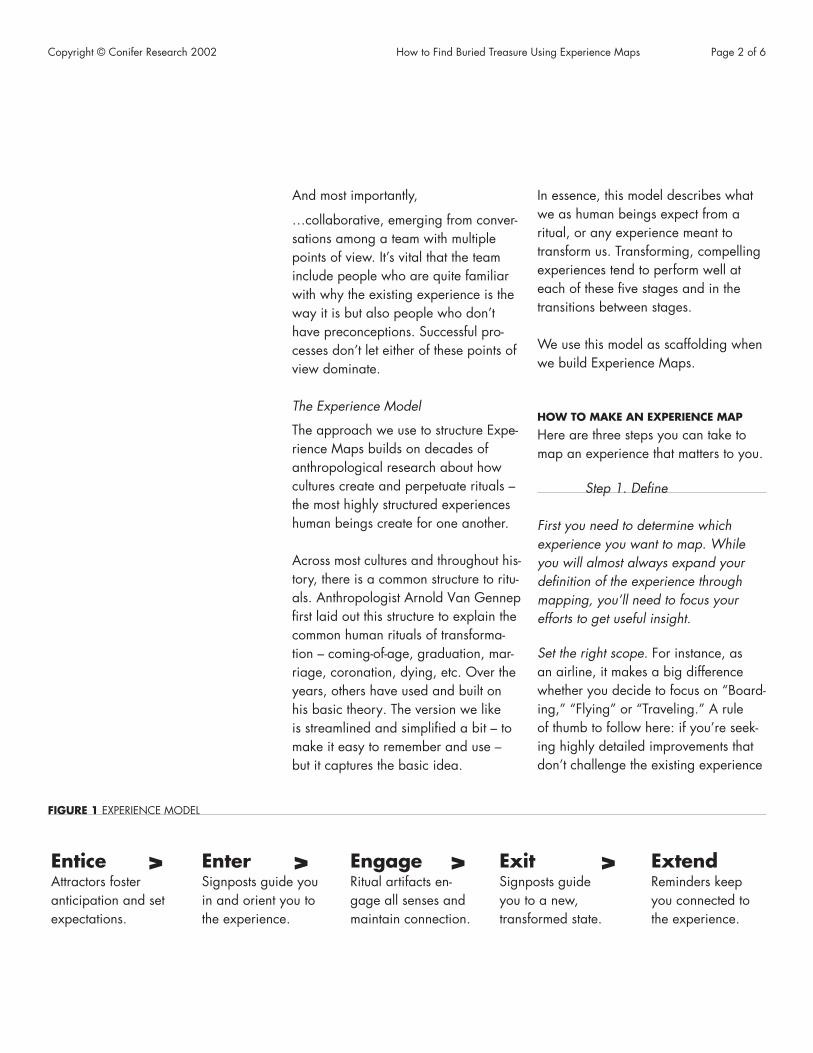
In essence, this model describes what we as human beings expect from a ritual, or any experience meant to transform us. Transforming, compelling experiences tend to perform well at each of these five stages and in the transitions between stages.
We use this model as scaffolding when we build Experience Maps.
HOW TO MAKE AN EXPERIENCE MAP
Here are three steps you can take to map an experience that matters to you.
Step 1. Define
First you need to determine which experience you want to map. While you will almost always expand your definition of the experience through mapping, you’ll need to focus your efforts to get useful insight.
Set the right scope. For instance, as an airline, it makes a big difference whether you decide to focus on “Board-ing,” “Flying” or “Traveling.” A rule of thumb to follow here: if you’re seek-ing highly detailed improvements that don’t challenge the existing experience
FIGURE 1 EXPERIENCE MODEL
EnticeAttractors foster anticipation and set expectations.
EnterSignposts guide you in and orient you to the experience.
EngageRitual artifacts en-gage all senses and maintain connection.
ExitSignposts guide you to a new, transformed state.
ExtendReminders keep you connected to the experience.
>> > >
Copyright © Conifer Research 2002 How to Find Buried Treasure Using Experience Maps Page 2 of 6
much, choose the narrowest possible scope (Boarding). If you want to find things that are completely outside the box of your current business, select the broadest (Traveling).
Agree on a Point of View. Who’s having the experience? It can work to look at the same experience from mul-tiple points of view, but only if you manage the boundaries between view-points carefully. In our airline example, the Crew experience might be very dif-ferent from that of Passengers.
Set boundaries. Every experience has a beginning, a middle, an end, and tran-sitions between these stages. Which stages interest you most and least? Which are you most likely to be able to influence with your products and ser-vices? Again, expect Mapping to chal-lenge your assumptions. But you can increase your chances of striking gold by digging in some likely spots. For instance, you might decide that you want to study Travel, but that you’re going to define the beginning as arrival at an airport, rather than at the begin-ning of trip planning.
Step 2. Document
After you’ve defined your target, gather the raw material for your map: images, written observations, diagrams, and interviews with people having the expe-rience, etc. The map will only be as useful as it is accurate. To improve accuracy and clarity you should visu-ally document the experience. Good documentation also makes conversa-tions about the meaning of the map much more participatory and robust.
Go where it happens. Experience maps are not a “thought experiment.” Don’t rely on your memory or imagination alone. It’s easy to assume you know what happens, especially if you have the experience yourself a lot. But you may be missing key insights. Our team of mostly childless business travelers was blown away by what families went through renting cars in south Florida. We ‘knew’ the process, but we’d never been through it from their perspective.
Use a mix of media. Document the experience as you see others going through it. Use photographs, sketches, video and any other tools at your dis-posal. Draw maps of environments and paths through them.
Have the experience yourself. It’s vital to participate in the process so you can know what it feels like – not just what it looks like when other people go through it. As you do so, record thoughts and observations in real time. If possible, go through the experience again from different angles and with different levels of participation.
Pick stuff up. Collect artifacts and sam-ples not just images. If you’re shop-ping, be sure to buy and bring back products. Pick up any instructions or collateral you see along the way.
Keep good track of your data. As you take pictures and video, be sure to label the media as they come back in. You will need to organize your media three ways: 1) as you collect it, by date, place, etc.; 2) as you analyze it, by theme, keyword, etc.; and 3) as you communicate it, by the story it supports.
Copyright © Conifer Research 2002 How to Find Buried Treasure Using Experience Maps Page 3 of 6
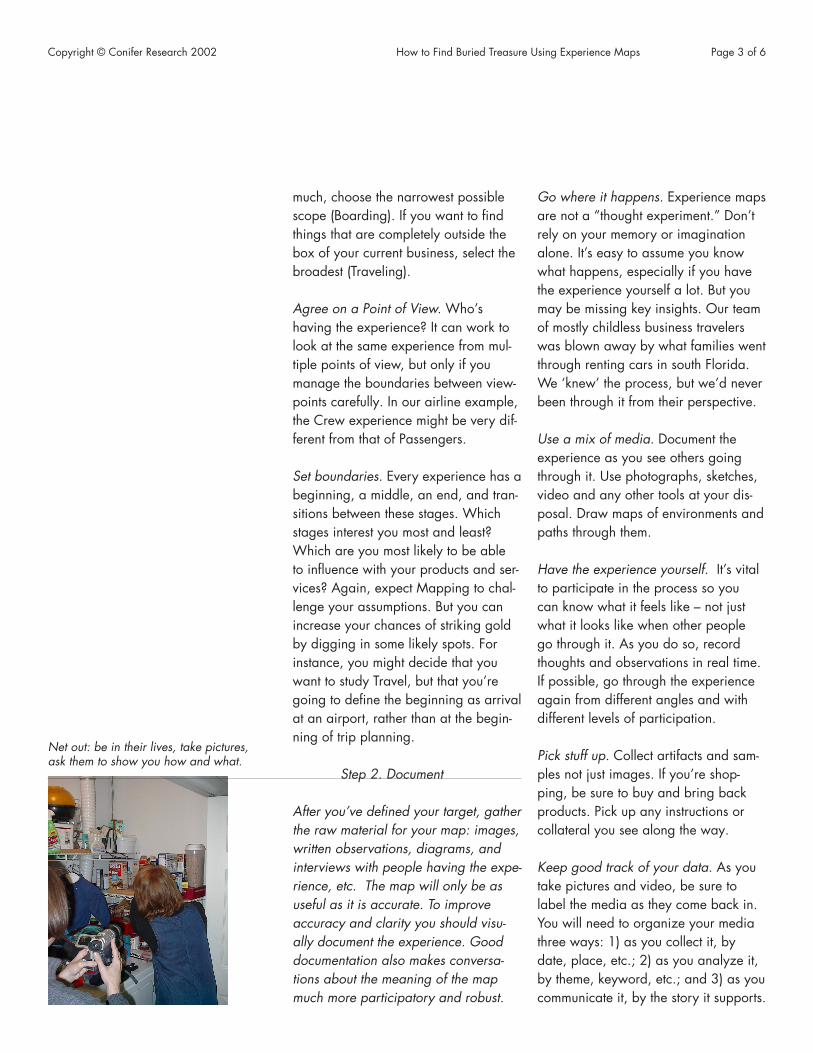
Net out: be in their lives, take pictures, ask them to show you how and what.
Step 3. Dig
Now you have what it takes to make the Map and look for treasure. We suggest that teams find a room they can dedicate to this purpose. If you can’t get a room, get a big table.
Get physical. Even if you use a digital camera to gather images, print them out. If you collected images on video, be sure to grab some still frames and print them. Also, get a TV in the room so you can refer to any video. Sort images and artifacts on a surface, or tape them to a wall with drafting dots.
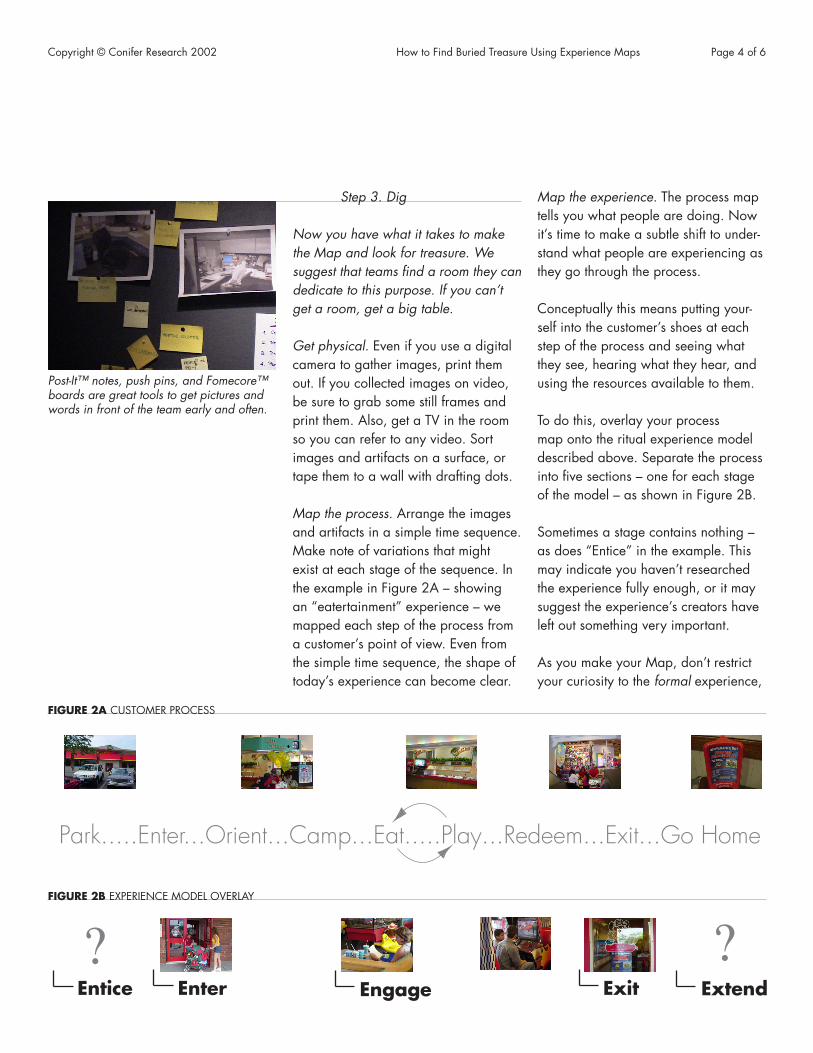
Map the process. Arrange the images and artifacts in a simple time sequence. Make note of variations that might exist at each stage of the sequence. In the example in Figure 2A – showing an “eatertainment” experience – we mapped each step of the process from a customer’s point of view. Even from the simple time sequence, the shape of today’s experience can become clear.
Map the experience. The process map tells you what people are doing. Now it’s time to make a subtle shift to under-stand what people are experiencing as they go through the process.
Conceptually this means putting your-self into the customer’s shoes at each step of the process and seeing what they see, hearing what they hear, and using the resources available to them.
To do this, overlay your process map onto the ritual experience model described above. Separate the process into five sections – one for each stage of the model – as shown in Figure 2B.
Sometimes a stage contains nothing – as does “Entice” in the example. This may indicate you haven’t researched the experience fully enough, or it may suggest the experience’s creators have left out something very important.
As you make your Map, don’t restrict your curiosity to the formal experience,
Park.....Enter...Orient...Camp...Eat.....Play...Redeem...Exit...Go Home
Entice Enter Engage Exit Extend
FIGURE 2A CUSTOMER PROCESS
FIGURE 2B EXPERIENCE MODEL OVERLAY
? ?
Copyright © Conifer Research 2002 How to Find Buried Treasure Using Experience Maps Page 4 of 6
Post-It™ notes, push pins, and Fomecore™ boards are great tools to get pictures and words in front of the team early and often.
e.g., “placing an order.” Look beyond to the informal issues customers face, e.g., “tending to an impatient child.” In the example of IKEA offered above, nearly all the notable features of the experience are aimed at things other than the steps required to shop for and buy furniture.
> Look for “bright spots.”
Where does the experience really seem to be working for people? At what points do they seem to be having a great time? Where do the things and spaces provided seem to meet their needs particularly well?
> Look for “hot spots.”
Where does the experience break down? When are people frustrated? Are they missing things they need? Where are they forced to “work around” the systems and processes in place? When do they look uncomfortable?
> Look for gaps.
At which stages of the experi-ence are there few resources offered to customers? Where are transitions poorly handled or simply ignored?
Look at the big picture. Pull back from your Map and try to characterize the experience as a whole. Look for a cen-tral theme. Identify a couple of meta-phors that capture the essence of the experience. For example, when we looked at car rental, the experience seemed like “going through customs.”
When you have a metaphor, pick out a few iconic images or artifacts that convey the metaphor particularly well.
HOW TO USE AN EXPERIENCE MAP
If you’ve followed the process so far, you have a room full of images sequenced according to process, then mapped to the stages of the experience model. You have identified key fea-tures, hot spots, bright spots, gaps, and iconic moments. Most important, your team has had a series of rich conver-sations about the experience from the user’s point of view. Now you can use an Experience Map to innovate.
Explore the metaphor. Discuss the impli-cations of the existing metaphor for your long-term relationship with custom-ers. Is the metaphor compatible with the promise of your brand? What prod-ucts, services, and processes contribute to the truth of the metaphor?
Fix hot spots. Phrase each hot spot as a problem to solve. For instance, “Travelers need help with luggage.” Then ideate around the problem state-ment, generating ideas for how to fix the problem. From these, you can cull ideas best suited to your needs.
Gather benchmarks. Where in the world have other businesses done a great job of addressing the experience issues you identified? When looking for clues about how to better divide space in the workplace, one team looked at the interiors of yachts and campers.
Build on bright spots. For each bright spot, generate a list of ways you could
Copyright © Conifer Research 2002 How to Find Buried Treasure Using Experience Maps Page 5 of 6
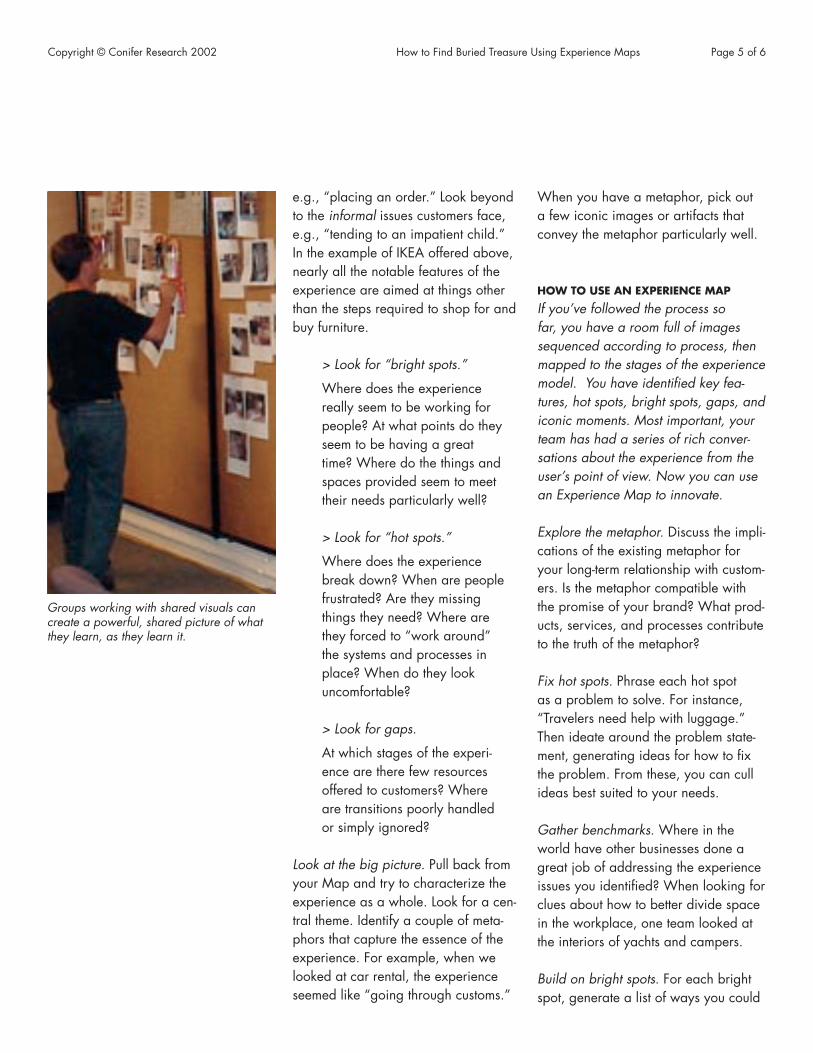
Groups working with shared visuals can create a powerful, shared picture of what they learn, as they learn it.
extend the goodwill of that moment to other parts of the experience.
Change the metaphor. Brainstorm new metaphors for the experience. These new metaphors should be more closely aligned to your brand vision and product and service goals. Use these new metaphors to generate new ideas for products, services, communications, etc. In the car rental example, the one that produced the coolest new ideas was “Vacation Mall,” suggesting a shift from the last bureaucratic stop in the travel process to the first exciting part of a vacation. The result: a plethora of new offerings – sundries, beach gear, guide books – and new spaces – a playroom, a giant map station, chang-ing rooms.
Fill in the gaps. For each stage of the experience model, brainstorm opportu-nities to improve the experience. For instance, in the restaurant experience example above, we would focus brain-storming around the “Entice” stage of the model, generating concepts about how the company might create new processes to build customer excitement and set expectations for the experience to follow.
Create an Experience Plan. Arrange ideas generated in your brainstorms into the five stages of the Experience Model. Use verbal descriptions, sketches or whatever else you have at your disposal to communicate the new stages of the experience. Share this Plan (and the Experience Map) with key stakeholders to provoke critique and improvement.
CONCLUSION (EXIT AND EXTEND)
In this article, we offer practical tips about how to make and use Experience Maps. In the real world, we expect that your team will blend elements of what we suggest here into your own approaches. We are eager to hear about how you use this tool. And we’re honored to offer advice and assistance to your team. E-mail [email protected].
ACKNOWLEDGEMENTS
The Experience Model we use above is derived from one that we helped develop when we worked with Doblin, a Chicago-based consultancy. The original model – containing great detail – is available at www.doblin.com.
If you haven’t already, read The Expe-rience Economy, by Joseph Pine and James Gilmore. It’s a smart, fast read full of great stories and wise advice.
Arnonld Van Gennep’s pioneering work on ritual is still in print and avail-able in paperback. The book is called Rites of Passage.
Finally, thanks to all the clients, friends, and colleagues who helped shape the ideas and examples in this article.
See us on the web atwww.coniferresearch.com
How to Find Buried Treasure Using Experience Maps Page 6 of 6Copyright © Conifer Research 2002
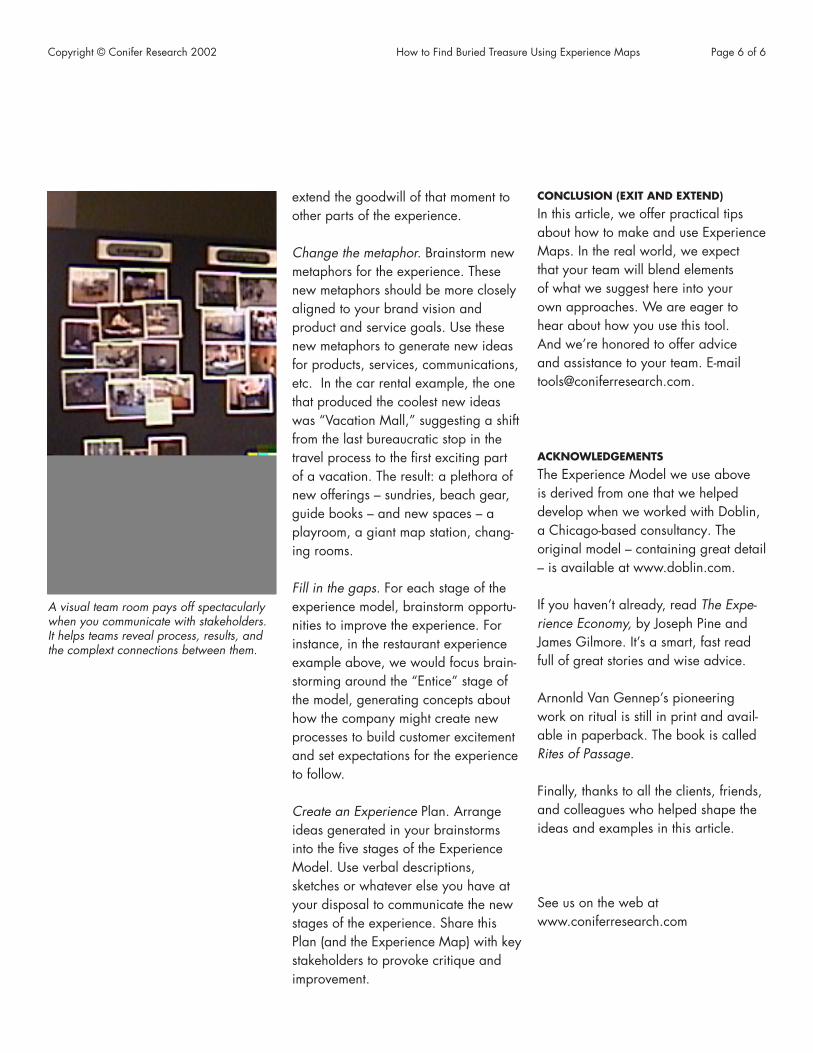
A visual team room pays off spectacularly when you communicate with stakeholders. It helps teams reveal process, results, and the complext connections between them.