
PADM 582 Quantitative and Qualitative Research Methods Basic Concepts of Statistics Soomi Lee, Ph.D.
30
PADM 582 Quantitative and Qualitative Research Methods Basic Concepts of Statistics Soomi Lee, Ph.D
-
Upload
stella-wilkerson -
Category
Documents
-
view
222 -
download
2
Transcript of PADM 582 Quantitative and Qualitative Research Methods Basic Concepts of Statistics Soomi Lee, Ph.D.
PADM 582 Quantitative and Qualitative Research Methods
Basic Concepts of Statistics Soomi Lee, Ph.D

Outline
• Syllabus• Why of Statistics?• Basic Concepts

• Information gathering– We use information gathering techniques to
obtain observation (e.g. income growth, obesity rate).
– The observations that are gathered are called data.
Why Statistics?
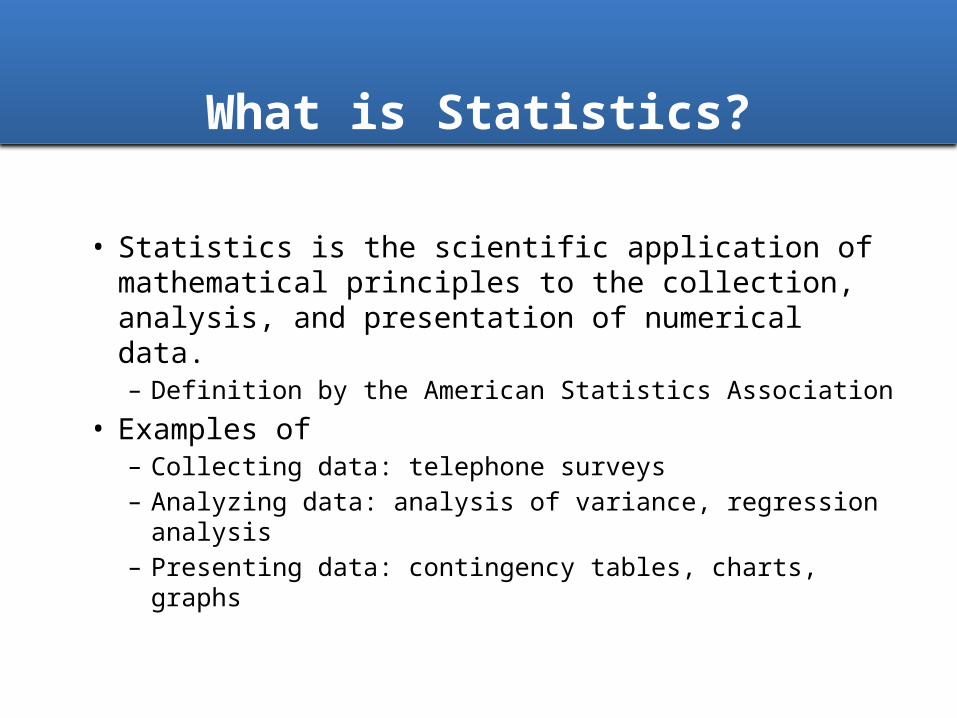
• Statistics is the scientific application of mathematical principles to the collection, analysis, and presentation of numerical data. – Definition by the American Statistics Association
• Examples of– Collecting data: telephone surveys– Analyzing data: analysis of variance, regression
analysis– Presenting data: contingency tables, charts, graphs
What is Statistics?

• Design– Determining the best way to obtain data
• Description– Summarizing and exploring the data
• Inference– Determining causality– Making predictions
Purpose of Statistics

Why should we care?
• Performance measurement• Evaluation research
• Evidence based decision making• May the best methodology win
– Misleading measurement– Misleading samples– Misleading correlations
Why Should We Care?

Why should we care?
• Misleading measurement1. No child left behind and
standardized tests–Atlanta cheating scandal–Houston miracle
2. Measuring well-being–GDP?–Happiness?
Example

• Misleading samples• Gun ownership–USA today: 89%–General Social Survey: 35%
• Misleading correlations• Ice cream sales and crime rate
Example

Why should we care?
• Population vs. Sample• Parameter vs. Statistic• Variables
Basic Concepts

Why should we care?
• Population• Total set of subjects of interest in the
study• Ex. All residents in California
• Sample• Subset of the population for which
we collect data• Ex. California’s Statewide Surveys
(PPIC)
Basic Concepts
Population vs. Sample

Why should we care?Basic Concepts
Population vs. Sample

Why should we care?Basic Concepts
Population vs. Sample

Why should we care?Basic Concepts
Parameter and a Statistic
• Parameter• Numerical summary of population• Ex. Governor’s job approval ratings
for the whole residents in California
• Statistic• Numerical summary of the sample of
the population• Ex. Governor’s job approval ratings
in the Statewide Survey

Why should we care?Basic Concepts
Who Cares?
• We distinguish between a population and a sample because every sample will have an amount of error associated with it.
• In statistics, our goal is to gather a sample that best approximates the population.

Why should we care?Basic Concepts
Who Cares?

Why should we care?
• Does the decennial data collected by the U.S. Census reflect the U.S. population or a sample of the U.S. population?
Practice Question

Why should we care?
• A recent PPIC Statewide survey indicated that 38% of the registered voters approve of the job that Governor Brown is doing. Is the value 38% a parameter of a statistic?
Practice Question
Why should we care?Basic Concepts
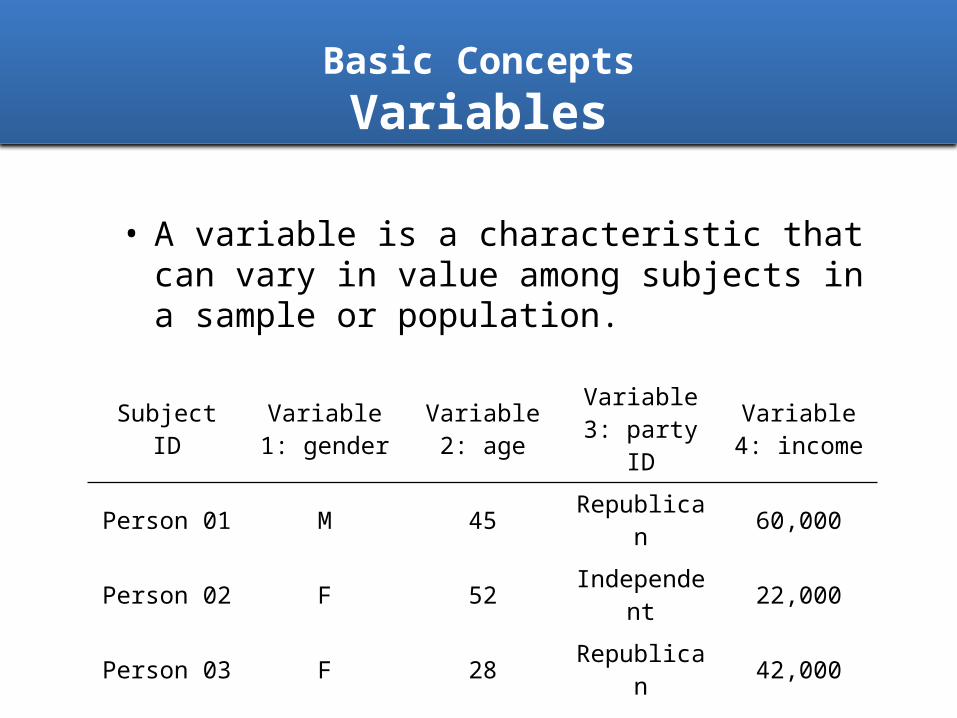
Variables
• A variable is a characteristic that can vary in value among subjects in a sample or population.
Subject ID Variable 1: gender
Variable 2: age
Variable 3: party ID
Variable 4: income
Person 01 M 45 Republican 60,000
Person 02 F 52 Independent 22,000
Person 03 F 28 Republican 42,000
Person 04 M 66 Democrat 580,000
Person 05 M 53 Democrat 79,000
Person 06 F 31 Democrat 33,000

Why should we care?Basic Concepts
Level of Variables
• Quantitative • Ordinal • Qualitative (nominal)

Why should we care?Variables: Quantitative or interval
• The values of a variable vary in magnitude (you can actually count the number)
• Continuous if it can take an infinite continuum of possible real number• Examples: income, housing price, crime
rate• Discrete if it can take on a finite number of
values• Examples: Years of education, number of
children, number of Asians, number of arrests, number of policeofficers

Why should we care?Variables: Ordinal
• The ordinal variables consists of categorical scales that have a natural ordering of values.
• It does not have defined interval distances between the values.
• We “assign” numbers for each category for statistical purposes.
• Examples• Socioeconomic status: low(1), middle (2), high (3)• Political ideology: (1) extremely liberal, (2) liberal,
(3) moderate, (4) conservative, (5) extremely conservative

Why should we care?Variables: Qualitative or nominal
• A scale for the measurement is a set of unordered categories.
• Differ in quality, not quantity or magnitude
• Examples• Gender: female, male (dichotomous)• States in the U.S.: CA, IL, FL…• Cities in LA county: La Verne, Claremont,
Pomona…
Why should we care?Practice Questions
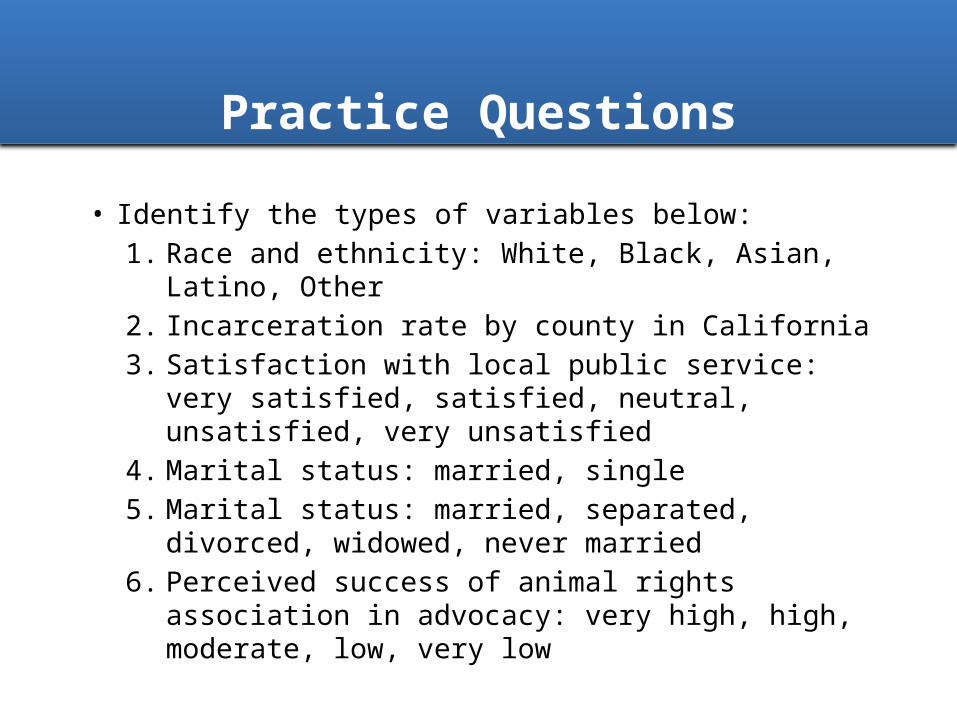
• Identify the types of variables below:1. Race and ethnicity: White, Black, Asian,
Latino, Other2. Incarceration rate by county in California3. Satisfaction with local public service: very
satisfied, satisfied, neutral, unsatisfied, very unsatisfied
4. Marital status: married, single5. Marital status: married, separated, divorced,
widowed, never married6. Perceived success of animal rights association
in advocacy: very high, high, moderate, low, very low

Why should we care?Practice Questions
• Identify the types of variables below:1. Race and ethnicity: White, Black, Asian, Latino, Other
Nominal (qualitative)2. Incarceration rate by county in California Quantitative
(continuous)3. Satisfaction with local public service: very satisfied,
satisfied, neutral, unsatisfied, very unsatisfied Ordinal4. Marital status: married, single Nominal5. Marital status: married, separated, divorced, widowed,
never married Nominal6. Perceived success of animal rights association in
advocacy: very high, high, moderate, low, very low Ordinal

Why should we care?Group Work
• Give two examples of the following types of variables1. Nominal2. Quantitative discrete3. Quantitative continuous4. Ordinal

Why should we care?Who Cares?
• A higher level of variables has more flexibility because we can always transform it into variables at lower levels of measurement. The opposite is not true.

Why should we care?Who Cares?
Subject ID Variable 1: gender
Variable 2: age
Variable 3: party ID
Variable 4: income
Person 01 M 45 Republican 60,000
Person 02 F 52 Independent 22,000
Person 03 F 28 Republican 42,000
Person 04 M 66 Democrat 580,000
Person 05 M 53 Democrat 79,000
Person 06 F 31 Democrat 33,000

Why should we care?Who Cares?
Subject ID
Variable 4: income
(quantitative variable)
Income level
(ordinal variable)
Proposed tax reform
affected
Person 01 60,000 2 0
Person 02 22,000 1 0
Person 03 42,000 2 0
Person 04 580,000 3 1
Person 05 79,000 2 0
Person 06 33,000 1 0
• Want to construct an income level variable.• Group 1: Under 50,000; Group 2: 50,001-100,000;
Group 3: over 100,001• Want to construct a variable if a person’s income tax
is affected by a proposed tax reform.

Why should we care?Who Cares?
• A higher level of variables has more flexibility because we can always transform it into variables at lower levels of measurement. The opposite is not true.
• We use different statistical technique to analyze different levels of measurement.

Next Week
• We will cover descriptive statistics.• Read Salkind’s chapters 2 and 3.• Pick your variable of interest.• We will use excel in class exercise.• Bring a calculator for in-class exercise.• There is no homework assignment this
week.


![Live Class 12:00 05:00 PM€¦ · [] Contact. : 8400-582-582, 8604-582-582 Catalytic efficiency of two different enzymes is compared by their (A) Product (B) Molecular size](https://static.fdocuments.us/doc/165x107/60d936f023313748a874a310/live-class-1200-0500-pm-contact-8400-582-582-8604-582-582-catalytic-efficiency.jpg)


