Package ‘MAd’ - R · MAd aggregation function implements Gleser & Olkin (1994; 2009) and...
56
Package ‘MAd’ August 31, 2018 Type Package Title Meta-Analysis with Mean Differences Version 0.8-2.1 Date 2014-12-23 Author AC Del Re & William T. Hoyt Maintainer AC Del Re <[email protected]> Description A collection of functions for conducting a meta- analysis with mean differences data. It uses recommended procedures as described in The Handbook of Research Synthesis and Meta-Analysis (Cooper, Hedges, & Valentine, 2009). Depends R (>= 2.10.1) Suggests metafor, R2wd, ggplot2 Enhances compute.es, irr License GPL-2 URL http://acdelre.weebly.com NeedsCompilation no Repository CRAN Date/Publication 2018-08-31 17:39:55 UTC R topics documented: MAd-package ........................................ 2 agg .............................................. 7 ancova_to_d1 ........................................ 10 ancova_to_d2 ........................................ 11 atten ............................................. 12 compute_dgs ........................................ 13 compute_ds ......................................... 14 compute_gs ......................................... 16 dat.cooper15.3 ........................................ 17 dat.cooperA2 ........................................ 17 1
Transcript of Package ‘MAd’ - R · MAd aggregation function implements Gleser & Olkin (1994; 2009) and...

Package ‘MAd’August 31, 2018
Type Package
Title Meta-Analysis with Mean Differences
Version 0.8-2.1
Date 2014-12-23
Author AC Del Re & William T. Hoyt
Maintainer AC Del Re <[email protected]>
Description A collection of functions for conducting a meta-analysis with mean differences data. It uses recommended procedures asdescribed in The Handbook of Research Synthesis and Meta-Analysis(Cooper, Hedges, & Valentine, 2009).
Depends R (>= 2.10.1)
Suggests metafor, R2wd, ggplot2
Enhances compute.es, irr
License GPL-2
URL http://acdelre.weebly.com
NeedsCompilation no
Repository CRAN
Date/Publication 2018-08-31 17:39:55 UTC
R topics documented:MAd-package . . . . . . . . . . . . . . . . . . . . . . . . . . . . . . . . . . . . . . . . 2agg . . . . . . . . . . . . . . . . . . . . . . . . . . . . . . . . . . . . . . . . . . . . . . 7ancova_to_d1 . . . . . . . . . . . . . . . . . . . . . . . . . . . . . . . . . . . . . . . . 10ancova_to_d2 . . . . . . . . . . . . . . . . . . . . . . . . . . . . . . . . . . . . . . . . 11atten . . . . . . . . . . . . . . . . . . . . . . . . . . . . . . . . . . . . . . . . . . . . . 12compute_dgs . . . . . . . . . . . . . . . . . . . . . . . . . . . . . . . . . . . . . . . . 13compute_ds . . . . . . . . . . . . . . . . . . . . . . . . . . . . . . . . . . . . . . . . . 14compute_gs . . . . . . . . . . . . . . . . . . . . . . . . . . . . . . . . . . . . . . . . . 16dat.cooper15.3 . . . . . . . . . . . . . . . . . . . . . . . . . . . . . . . . . . . . . . . . 17dat.cooperA2 . . . . . . . . . . . . . . . . . . . . . . . . . . . . . . . . . . . . . . . . 17
1
2 MAd-package
dat.hoyt . . . . . . . . . . . . . . . . . . . . . . . . . . . . . . . . . . . . . . . . . . . 18dat.sim.es . . . . . . . . . . . . . . . . . . . . . . . . . . . . . . . . . . . . . . . . . . 18dat.sim.final . . . . . . . . . . . . . . . . . . . . . . . . . . . . . . . . . . . . . . . . . 18dat.sim.raw . . . . . . . . . . . . . . . . . . . . . . . . . . . . . . . . . . . . . . . . . 19dat.sim1 . . . . . . . . . . . . . . . . . . . . . . . . . . . . . . . . . . . . . . . . . . . 19dat.sim2 . . . . . . . . . . . . . . . . . . . . . . . . . . . . . . . . . . . . . . . . . . . 19d_to_g . . . . . . . . . . . . . . . . . . . . . . . . . . . . . . . . . . . . . . . . . . . . 20f.ancova_to_d . . . . . . . . . . . . . . . . . . . . . . . . . . . . . . . . . . . . . . . . 21fail_to_d . . . . . . . . . . . . . . . . . . . . . . . . . . . . . . . . . . . . . . . . . . . 22f_to_d . . . . . . . . . . . . . . . . . . . . . . . . . . . . . . . . . . . . . . . . . . . . 23icc . . . . . . . . . . . . . . . . . . . . . . . . . . . . . . . . . . . . . . . . . . . . . . 24Kappa . . . . . . . . . . . . . . . . . . . . . . . . . . . . . . . . . . . . . . . . . . . . 26lor_to_d . . . . . . . . . . . . . . . . . . . . . . . . . . . . . . . . . . . . . . . . . . . 27macat . . . . . . . . . . . . . . . . . . . . . . . . . . . . . . . . . . . . . . . . . . . . 28macatC . . . . . . . . . . . . . . . . . . . . . . . . . . . . . . . . . . . . . . . . . . . 30mareg . . . . . . . . . . . . . . . . . . . . . . . . . . . . . . . . . . . . . . . . . . . . 32mean_to_d . . . . . . . . . . . . . . . . . . . . . . . . . . . . . . . . . . . . . . . . . . 34mean_to_d2 . . . . . . . . . . . . . . . . . . . . . . . . . . . . . . . . . . . . . . . . . 35or_to_d . . . . . . . . . . . . . . . . . . . . . . . . . . . . . . . . . . . . . . . . . . . 36p.ancova_to_d1 . . . . . . . . . . . . . . . . . . . . . . . . . . . . . . . . . . . . . . . 37p.ancova_to_d2 . . . . . . . . . . . . . . . . . . . . . . . . . . . . . . . . . . . . . . . 38plotcat . . . . . . . . . . . . . . . . . . . . . . . . . . . . . . . . . . . . . . . . . . . . 39plotcon . . . . . . . . . . . . . . . . . . . . . . . . . . . . . . . . . . . . . . . . . . . 40PubBias . . . . . . . . . . . . . . . . . . . . . . . . . . . . . . . . . . . . . . . . . . . 41p_to_d1 . . . . . . . . . . . . . . . . . . . . . . . . . . . . . . . . . . . . . . . . . . . 42p_to_d2 . . . . . . . . . . . . . . . . . . . . . . . . . . . . . . . . . . . . . . . . . . . 43r2 . . . . . . . . . . . . . . . . . . . . . . . . . . . . . . . . . . . . . . . . . . . . . . 44robustSE . . . . . . . . . . . . . . . . . . . . . . . . . . . . . . . . . . . . . . . . . . . 45r_from_chi . . . . . . . . . . . . . . . . . . . . . . . . . . . . . . . . . . . . . . . . . 46r_from_d . . . . . . . . . . . . . . . . . . . . . . . . . . . . . . . . . . . . . . . . . . 47r_from_d1 . . . . . . . . . . . . . . . . . . . . . . . . . . . . . . . . . . . . . . . . . . 48r_from_t . . . . . . . . . . . . . . . . . . . . . . . . . . . . . . . . . . . . . . . . . . . 49r_to_d . . . . . . . . . . . . . . . . . . . . . . . . . . . . . . . . . . . . . . . . . . . . 50tt.ancova_to_d . . . . . . . . . . . . . . . . . . . . . . . . . . . . . . . . . . . . . . . . 51t_to_d . . . . . . . . . . . . . . . . . . . . . . . . . . . . . . . . . . . . . . . . . . . . 52wd . . . . . . . . . . . . . . . . . . . . . . . . . . . . . . . . . . . . . . . . . . . . . . 53wgts . . . . . . . . . . . . . . . . . . . . . . . . . . . . . . . . . . . . . . . . . . . . . 54
Index 55
MAd-package Meta-Analysis with Mean Differences

MAd-package 3
Description
The Mad package contains a variety of functions for conducting a mean differences meta-analysisusing recommended procedures as described in The Handbook of Research Synthesis and Meta-Analysis (Cooper, Hedges, and Valentine, 2009). The goal in creating this package was to provideuser-friendly functions to assist researchers in the process of conducting a meta-analysis, from theinitial to final stages of their analytic endeavor. The meta-analyst can begin their project by usingMAd functions to derive d (standardized mean differences) and g (unbiased d) from a variety ofstatistics/values reported in the primary studies (e.g., raw means and sd, t-test). Then, the analystcan aggregate all within-study effect sizes (while accounting for within-study correlations amongoutcome measures and eliminating any dependencies in the dataset), calculate omnibus effect sizesunder a fixed and random effects model, and assess for significant moderators (categorical andcontinuous, single and multi-predictor models) in the dataset. Finally, the meta-analyst can use oneof several user-friendly graphics functions to visually represent their data.
Details
Package: MAdType: PackageVersion: 0.8-2Date: 2014-12-23License: GPL-2LazyLoad: yes
The MAd package has integrated functions to facilitate the meta-analytic process at nearly everyanalytical stage. There are five broad areas of analysis that the MAd package targets:
1. Computations to Calculate Mean Differences:
There are a variety of functions to compute d (standardized mean difference) and g (unbiased d)from various designs reported in the primary studies. Most functions were derived from Boren-stein’s chapter in The Handbook of Research Synthesis and Meta-Analysis (Cooper, Hedges, &Valentine, 2009; pp. 228-234). For additional conversion formulas see the compute.es package:https://CRAN.R-project.org/package=compute.es
2. Within-Study Aggregation of Effect Sizes:
This fuction will simultaneously aggregate all within-study effect sizes while taking into accountthe correlations among the within-study outcome measures (Gleser & Olkin 2009; Gleser & Olkin2009; Hedges & Olkin, 1985; Rosenthal et al., 2006). The default imputed correlation betweenwithin-study effect sizes is set at .50 (Wampold et al., 1997) and will compute an aggregated effectsize for each study. This default of .50 is adjustable and can vary between outcome types. ThisMAd aggregation function implements Gleser & Olkin (1994; 2009) and Borenstein et al. (2009)procedures for aggregating dependent effect sizes. To our knowledge, this is the first statisticalpackage/program to explicitly utilize and automate this type of aggregation procedure, which has adual effect of saving the researcher substantial time while improving the accuracy of their analyses.
3. Fixed and Random Effects Omnibus Analysis:
This package contains all the relevant functions to calculate fixed and random effects omnibuseffect sizes, outputting the omnibus (i.e., overall) effect size, variance, standard error, upper andlower confidence intervals, and the Q-statistic (heterogeneity test).

4 MAd-package
4. Moderator Analyses:
There are user-friendly functions to compute fixed and random effects moderator analyses. Theseinclude single and multiple predictor models for both categorical and continuous moderator data.
5. Graphics:
This package has a variety of functions visually representing data. This includes boxplots andmeta-regression scatterplots.
6. Sample of Additional Functions:
Export MA output to nicely formatted Word tables.
Author(s)
AC Del Re & William T. Hoyt
Maintainer: AC Del Re <[email protected]>
References
Borenstein (2009). Effect sizes for continuous data. In H. Cooper, L. V. Hedges, & J. C. Valentine(Eds.), The handbook of research synthesis and meta analysis (pp. 279-293). New York: RussellSage Foundation.
Cooper, H., Hedges, L.V., & Valentine, J.C. (2009). The handbook of research synthesis and meta-analysis (2nd edition). New York: Russell Sage Foundation.
Gleser & Olkin (1994). Stochastically dependent effect sizes. In H. Cooper, & L. V. Hedges, & J.C.(Eds.), The handbook of research synthesis (pp. 339-356). New York: Russell Sage Foundation.
Gleser & Olkin (2009). Stochastically dependent effect sizes. In H. Cooper, L. V. Hedges, & J. C.Valentine (Eds.), The handbook of research synthesis and meta analysis (pp. 357-376). New York:Russell Sage Foundation.
Viechtbauer, W (2010). metafor: Meta-Analysis Package for R. R package version 1.1-0. https://CRAN.R-project.org/package=metafor
Wampold, B. E., Mondin, G. W., Moody, M., Stich, F., Benson, K., & Ahn, H. (1997). A meta-analysis of outcome studies comparing bona fide psychotherapies: Empiricially, ’all must haveprizes.’ Psychological Bulletin, 122(3), 203-215.
See Also
RcmdrPlugin.MA package: https://CRAN.R-project.org/package=RcmdrPlugin.MA;
MAc package: https://CRAN.R-project.org/package=MAc;
compute.es package: https://CRAN.R-project.org/package=compute.es;
metafor package: https://CRAN.R-project.org/package=metafor
Examples
## EXAMPLES FOR EACH BROAD AREA
# SAMPLE DATA:

MAd-package 5
MA <- data.frame(id=factor(rep(1:5, 3)),measure=c(rep("dep",5), rep("anx",5), rep("shy",5)),es=c(rnorm(5, 0.8, .2), rnorm(5, 0.5, .1), rnorm(5, 0.4, .1)),var.es=abs(rnorm(5*3,0.05, .03)),nT=round(rnorm(5*3, 30, 5),0),nC=round(rnorm(5*3, 30, 5),0),mod1=factor(rep(c("a","b","c","d","e"),3)),mod2=rep(seq(20, 60, 10), 3))
# 1. COMPUTE MEAN DIFFERENCE STATISTIC FROM# REPORTED STATS (GENERALLY FROM A PRIMARY STUDY):
# suppose the primary study reported an log odds ratio for different# proportions between 2 groups. Then, running:
lor_to_d(.9070,.0676)
# reported log odds ratio (lor = .9070) and variance (.0676) will output the# standardized mean difference (d) and its variance (var.d) that can be used in# a meta-analysis.
## 2. ACCOUNT FOR DEPENDENCIES: WITHIN-STUDY EFFECT SIZES (ES):
## 2 EXAMPLES:# EXAMPLE 1: AGGREGATING EFFECT SIZES FOR A DATA FRAME# (MULTIPLE STUDIES AT LEAST SOME OF WHICH HAVE MULTIPLE DEPENDENT EFFECT SIZES)# EXAMPLE 2: AGGREGATING EFFECT SIZES FOR SINGLE STUDY WITH THREE OR MORE# EFFECT SIZES WHEN PAIRS OF DVS HAVE DIFFERENT CORRELATIONS
## EXAMPLE 1: MA IS A DATA FRAME CONTAINING MULTIPLE STUDIES (id),## EACH WITH MULTIPLE EFFECT SIZES (CORRELATIONS BETWEEN ALL PAIRS OF DVS ARE r=.5.)
# AGGREGATION PROCEDURE:# method="GO1"; GLESER AND OLKIN (1994) PROCEDURE WHEN d IS COMPUTED# USING POOLED SD IN THE DENOMINATOR
MA1 <- agg(id=id, es=es, var=var.es, n.1=nT, n.2=nC, cor = .5, method="GO1", data=MA)
MA1
## EXAMPLE 2: STUDY 1 COMPARES A TREATMENT AND CONTROL GROUP ON## THREE OUTCOME MEASURES (DEPRESSION, ANXIETY, and SHYNESS).# THE CORRELATION AMONG THE THREE PAIRS OF DVS ARE r12=.5, r13=.2, and r23=.3.
study1 <- data.frame( id=factor(rep(1, 3)),measure=c("dep", "anx", "shy"),es=c(0.8, 0.5, 0.4),var.es=c(0.01, 0.02, 0.1),nT=rep(30, 3),nC=rep(30, 3))
# ONE WOULD CONSTRUCT THE CORRELATION MATRIX AS FOLLOWS:

6 MAd-package
cors <- matrix(c(1,.5,.2,.5,1,.3,.2,.3,1), nrow=3)
# AGGREGATION PROCEDURE:# method="GO1"; GLESER AND OLKIN (1994) PROCEDURE WHEN d# IS COMPUTED USING POOLED SD IN THE DENOMINATOR
agg(id=id, es=es, var=var.es, n.1=nT, n.2=nC, cor=cors, method="GO1", mod = NULL, data=study1)
# where MA = data.frame with columns for id, es (standardized# mean difference), var.es (variance of es), n.1 (sample size of group# one), and n.2 (sample size of comparison group) with multiple rows per# study. Outputs an aggregated data.frame with 1 effect size per study.
## 3.OMNIBUS ANALYSIS
# FIRST ADD MODERATORS TO THE AGGREGATED DATASET:
MODS <- data.frame(id=1:5,mod1=factor(c("a","b","a","b","b")),mod2=as.numeric(c(20, 30, 25, 35, 40)))
MA2 <- merge(MA1, MODS, by='id')
# Random Effectsm0 <- mareg(es1~ 1, var = var1, method = "REML", data = MA2)
# where MA = data.frame with columns for id, es (standardized# mean difference), var.es (variance of es), n.1 (sample size of group# one), and n.2 (sample size of comparison group).
# view output:summary(m0)
# 4. MODERATOR ANALYSIS:
# Random Effectsm1 <- mareg(es1~ mod1 + mod2 , var = var1, method = "REML", data = MA2)
# view output:summary(m1)
# 5. Graphics:
## Not run: plotcon(g = es1, var = var1, mod = mod1, data = MA2, method= "random",modname= "Moderator")## End(Not run)
# Additional Functions

agg 7
# Export MA output to nicely formatted Word tables.
# install R2wd# install.packages('R2wd', dependencies = TRUE)
# Export data to Word in formatted table
# wd(m1, get = TRUE, new = TRUE)
agg Aggregate Dependent Effect Sizes
Description
This function will simultaneously aggregate all within-study effect sizes while taking into accountthe correlations among the within-study outcomes. The default correlation between outcome mea-sures is set at .50 (Wampold et al., 1997), and can be adjusted as needed. An aggregate effect sizeand its variance is computed for each study. This MAd aggregation function implements Gleser &Olkin (1994) and Borenstein et al. (2009) procedures for aggregating dependent effect sizes..
Usage
agg(id, es, var, n.1=NULL, n.2=NULL, method = "BHHR", cor = .50, mod=NULL, data)
Arguments
id Study id with multiple rows of same id.
es Effect size. Use Cohen’s d for GO1 and GO2 method and use Hedges g forBHHR method.
var Variance of g.
n.1 Sample size of group one. Only required if using method=’GO1’ or ’GO2’.
n.2 Sample size of group two. Only required if using method=’GO1’ or ’GO2’.
method ’BHHR’= Borenstein, et al. (2009) procedure.’GO1’= Gleser and Olkin (1994)procedure using pooled standard deviation (SD). ’GO2’= Gleser and Olkin (1994)procedure using group 2 SD (typically control group SD). Default is ’BHHR’.
cor Estimated correlation among within-study outcome variables. Input should ei-ther be a fixed correlation (default is r=.5) or a correlation matrix to allow dif-ferent correlations between outcome types (in which case aggregation shouldtypically be on one study at a time rather than the entire dataset–see examplesbelow).
mod To aggregate by id and one moderator. If there are multiple levels of a categoricalmoderator within study and one can in derive seperate effect size estimates foreach level within and between studies. Default is NULL.
data data.frame with above values.

8 agg
Value
Outputs a data.frame with aggregated effect sizes and variances of effect sizes where each studyis reduced to one row per study (unless aggregated by a moderator) by a weighted average formula.
Author(s)
AC Del Re & William T. Hoyt
Maintainer: AC Del Re <[email protected]>
References
Borenstein (2009). Effect sizes for continuous data. In H. Cooper, L. V. Hedges, & J. C. Valentine(Eds.), The handbook of research synthesis and meta analysis (pp. 279-293). New York: RussellSage Foundation.
Cooper, H., Hedges, L.V., & Valentine, J.C. (2009). The handbook of research synthesis and meta-analysis (2nd edition). New York: Russell Sage Foundation.
Gleser & Olkin (1994). Stochastically dependent effect sizes. In H. Cooper, & L. V. Hedges, & J.C.(Eds.), The handbook of research synthesis(pp. 339-356). New York: Russell Sage Foundation.
Gleser & Olkin (2009). Stochastically dependent effect sizes. In H. Cooper, L. V. Hedges, & J. C.Valentine (Eds.), The handbook of research synthesis and meta analysis (pp. 357-377). New York:Russell Sage Foundation.
Shadish & Haddock (2009). Analyzing effect sizes: Fixed-effects models. In H. Cooper, L. V.Hedges, & J. C. Valentine (Eds.), The handbook of research synthesis and meta analysis (pp. 257-278). New York: Russell Sage Foundation.
Examples
## 2 EXAMPLES:
# EXAMPLE 1: Aggregating effect sizes for a data frame# (multiple studies at least some of which have multiple# effect sizes), assuming equal correlations (r=.5) between# pairs of DVs.# EXAMPLE 2: Aggregating effect sizes for a single study# with 3 or more effect sizes when pairs of DVs have# different correlations.
# LOAD DATA (EXAMPLE DATA FROM HOYT & DEL RE, 2015 SIMULATION):data(dat.hoyt)
## EXAMPLE 1: dat.hoyt is a data frame with multiple studies identified## by variable 'id'. Each study has multiple effect sizes based on## multiple DVs. Correlations between all pairs of DVs are r=.5.
# NOTE: Based on a simulation study by Hoyt & Del Re (2015), it is# recommended that methods "G01" and "G02" (Gleser and Olkin)# should aggregate Cohen's d, without using Hedges & Olkin's# recommended bias correction. (Studies providing only a single# effect size should still be corrected for bias, after aggregation.)

agg 9
# Method "BHHR" should aggregate Hedges' g, after bias correction.
# Option 1: method="BHHR"; Borenstein et al. (2009) procedure.# Use with Hedges' g; can also be used with any other effect# size (e.g., z', LOR).
agg(id=id, es=g, var=vg, cor=.5,method="BHHR", mod=NULL, data=dat.hoyt)
# Option 2: method="GO1"; Gleser & Olkin (1994) procedure when# d is computed using pooled sd in denominator.
agg(id=id, es=d, var=vd, n.1=n.T, n.2=n.C, cor = .5,method="GO1", mod = NULL, data=dat.hoyt)
# Option 3: method="GO2"; Gleser & Olkin (1994) procedure when# d is computed using sd.2 (typically control group sd)# in denominator
agg(id=id, es=d, var=vd, n.1=n.T, n.2=n.C, cor = .5,method="GO2", mod = NULL, data=dat.hoyt)
## EXAMPLE 2: Single study comparing T and C group## on three DVs: depression, anxiety, and shyness## r12=.5; r13=.2; r23=.3
data <- dat.hoyt[20:22,]
# Step 1: Create the correlation matrix, based on r12, r13, and r23:
cors <- matrix(c(1,.5,.2,.5,1,.3,.2,.3,1), nrow=3)
# Step 2: Aggregate using agg() function.
# Option 1: method="BHHR"; Borenstein et al. (2009) procedure.# Use with Hedges' g; can also be used with any other effect# size (e.g., z', LOR).
agg(id=id, es=g, var=vg, cor=cors,method="BHHR", mod=NULL, data=data)
# Option 2: method="GO1"; Gleser & Olkin (1994) procedure when# d is computed using pooled sd in denominator.
agg(id=id, es=d, var=vd, n.1=n.T, n.2=n.C, cor = cors,method="GO1", mod = NULL, data=data)
# Option 3: method="GO2"; Gleser & Olkin (1994) procedure when

10 ancova_to_d1
# d is computed using sd.2 (typically control group sd)# in denominator
agg(id=id, es=d, var=vd, n.1=n.T, n.2=n.C, cor = cors,method="GO2", mod = NULL, data=data)
## Citation ### Hoyt, W. T., & Del Re, A. C. (2013). Comparison of methods for# aggregating dependent effect sizes in meta-analysis.# Manuscript submitted for publication.
ancova_to_d1 ANCOVA F-statistic to d
Description
Converts an ANCOVA F-statistic to d (standardized mean difference)
Usage
ancova_to_d1(m.1.adj, m.2.adj, sd.adj, n.1, n.2, R, q)
Arguments
m.1.adj Adjusted mean of treatment group from ANCOVA.
m.2.adj Adjusted mean of comparison group from ANCOVA.
sd.adj Adjusted standard deviation.
n.1 Treatment group sample size.
n.2 Comparison group sample size.
R Covariate outcome correlation or multiple correlation.
q Number of covariates.
Value
d Standardized mean difference (d).
var_d Variance of d.
Author(s)
AC Del Re & William T. Hoyt
Maintainer: AC Del Re <[email protected]>

ancova_to_d2 11
References
Borenstein (2009). Effect sizes for continuous data. In H. Cooper, L. V. Hedges, & J. C. Valentine(Eds.), The handbook of research synthesis and meta analysis (pp. 279-293). New York: RussellSage Foundation.
See Also
d_to_g, mean_to_d, mean_to_d2, t_to_d, f_to_d, p_to_d1, p_to_d2, ancova_to_d1, ancova_to_d2,tt.ancova_to_d, f.ancova_to_d, r_to_d, p.ancova_to_d1, p.ancova_to_d2, lor_to_d, prop_to_or,prop_to_d, r_from_chi, r_from_d, r_from_d1, r_from_t
ancova_to_d2 ANCOVA F-statistic to d II
Description
Converts an ANCOVA F-statistic with pooled standard deviation to d (standardized mean differ-ence)
Usage
ancova_to_d2(m.1.adj, m.2.adj, s.pooled, n.1, n.2, R, q)
Arguments
m.1.adj Adjusted mean of treatment group from ANCOVA.
m.2.adj Adjusted mean of comparison group from ANCOVA.
s.pooled Pooled standard deviation.
n.1 Treatment group sample size.
n.2 Comparison group sample size.
R Covariate outcome correlation or multiple correlation.
q number of covariates.
Value
d Standardized mean difference (d).
var_d Variance of d.
Author(s)
AC Del Re & William T. Hoyt
Maintainer: AC Del Re <[email protected]>

12 atten
References
Borenstein (2009). Effect sizes for continuous data. In H. Cooper, L. V. Hedges, & J. C. Valentine(Eds.), The handbook of research synthesis and meta analysis (pp. 279-293). New York: RussellSage Foundation.
See Also
d_to_g, mean_to_d, mean_to_d2, t_to_d, f_to_d, p_to_d1, p_to_d2, ancova_to_d1, ancova_to_d2,tt.ancova_to_d, f.ancova_to_d, r_to_d, p.ancova_to_d1, p.ancova_to_d2, lor_to_d, prop_to_or,prop_to_d, r_from_chi, r_from_d, r_from_d1, r_from_t
atten Correction for Attenuation
Description
Used to correct for attenuated effect sizes due to measurement unreliability.
Usage
atten(g, xx, yy, data)
Arguments
g Hedges g (unbiased estimate of d) effect size.
xx Column for reliability of predictor variable ("independent variable").
yy Column for reliability of outcome variable ("dependent variable").
data data.frame with the above values.
Value
A new column for g corrected for attenuation (g.corrected) will be added to the data, for those xx& yy columns with complete data.
Author(s)
AC Del Re & William T. Hoyt
Maintainer: AC Del Re <[email protected]>
References
Hunter, J. E., Schmidt, F. L. (2004). Methods of meta-analysis (2nd edition). Thousand Oaks, CA:Sage.

compute_dgs 13
Examples
# Sample data:
id<-c(1, 1:19)n<-c(10,20,13,22,28,12,12,36,19,12,36,75,33,121,37,14,40,16,14,20)g<-c(.68,.56,.23,.64,.49,-.04,.49,.33,.58,.18,-.11,.27,.26,.40,.49,.51,.40,.34,.42,.16)
var.g <- c(.08,.06,.03,.04,.09,.04,.009,.033,.0058,.018,.011,.027,.026,.0040,.049,.0051,.040,.034,.0042,.016)
xx<-c(.88,.86,.83,.64,.89,.84,.89,.83,.99,.88,.81,.77,.86,.70,.79,.71,.80,.74,.82,.86) # Reliability of "independent variable"
yy<-c(.99,.86,.83,.94,.89,.94,.89,.93,.99,.88,.81,.77,.86,.70,.79,.71,.80,.94,.92,.96) # Reliability of "dependent variable"
df<-data.frame(id,n,g, var.g, xx,yy)
# Exampleatten(g= g, xx = xx, yy = yy, data= df)
compute_dgs Computes Vector of Standardized Mean Differences
Description
Adds d & g (standardized mean difference) to a data.frame. Required inputs are: n.1 (sample sizeof group one), m.1 (raw post-mean value of group one), sd.1 (standard deviation of group one), n.2(sample size of group two), m.2 (raw post-mean value of group two), sd.2 (standard deviation ofgroup two).
Usage
compute_dgs(n.1, m.1, sd.1 , n.2, m.2, sd.2, data, denom = "pooled.sd")
Arguments
n.1 sample size of group one.
m.1 raw post-mean value of group one.
sd.1 standard deviation of group one.
n.2 sample size of group two.
m.2 raw post-mean value of group two.
sd.2 standard deviation of group two.
data data.frame with above values
denom Value in the denominator to standardize the means by. pooled.sd will pooltogether both groups in deriving d. control.sd uses the standard deviation ofgroup two (typically the control condition) to calculate d.

14 compute_ds
Value
d Standardized mean difference.var.d Variance of d.se.d Standard error of d.
Author(s)
AC Del Re & William T. Hoyt
Maintainer: AC Del Re <[email protected]>
References
Borenstein (2009). Effect sizes for continuous data. In H. Cooper, L. V. Hedges, & J. C. Valentine(Eds.), The handbook of research synthesis and meta analysis (pp. 279-293). New York: RussellSage Foundation.
See Also
compute_ds, compute_gs
Examples
id <- c(1:20)n.1 <- c(10,20,13,22,28,12,12,36,19,12,36,75,33,121,37,14,40,16,14,20)n.2 <- c(11,22,10,20,25,12,12,36,19,11,34,75,33,120,37,14,40,16,10,21)m.1 <- c(.68,.56,.23,.64,.49,.4,1.49,.53,.58,1.18,.11,1.27,.26,.40,.49,
.51,.40,.34,.42,.66)m.2 <- c(.38,.36,.23,.34,.29,.4,1.9,.33,.28,1.1,.111,.27,.21,.140,.149,
.51,.140,.134,.42,.16)sd.1 <- c(.28,.26,.23,.44,.49,.34,.39,.33,.58,.38,.31,.27,.26,.40,
.49,.51,.140,.134,.42,.46)sd.2 <- c(.28,.26,.23,.44,.49,.44,.39,.33,.58,.38,.51,.27,.26,.40,
.49,.51,.140,.134,.142,.36)mod1 <- c(1,2,3,4,1,2,8,7,5,3,9,7,5,4,3,2,3,5,7,1)mod2 <- factor(c(rep(c(1,2,3,4),5)))dfs <- data.frame(id, n.1,m.1, sd.1, n.2, m.2, sd.2, mod1, mod2)
# Examplecompute_dgs(n.1, m.1, sd.1, n.2, m.2, sd.2, data = dfs)
compute_ds Computes Vector of Standardized Mean Differences
Description
Adds d (standardized mean difference) to a data.frame. Required inputs are: n.1 (sample size ofgroup one), m.1 (raw post-mean value of group one), sd.1 (standard deviation of group one), n.2(sample size of group two), m.2 (raw post-mean value of group two), sd.2 (standard deviation ofgroup two).
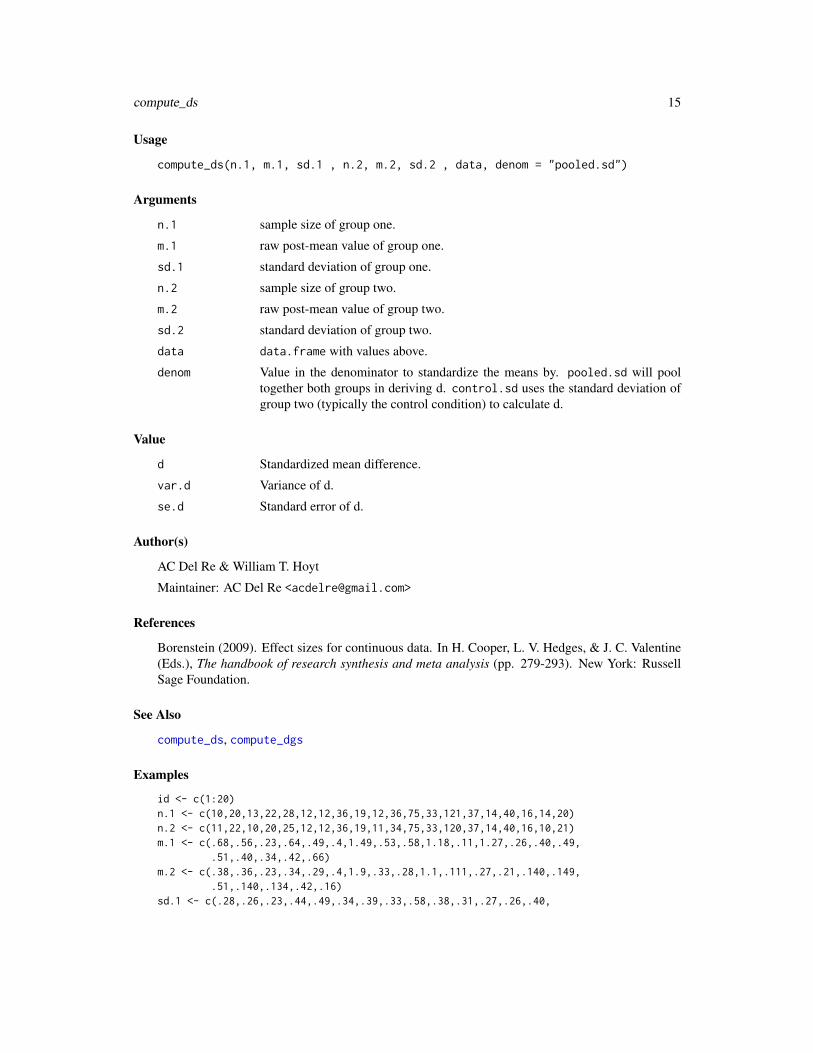
compute_ds 15
Usage
compute_ds(n.1, m.1, sd.1 , n.2, m.2, sd.2 , data, denom = "pooled.sd")
Arguments
n.1 sample size of group one.
m.1 raw post-mean value of group one.
sd.1 standard deviation of group one.
n.2 sample size of group two.
m.2 raw post-mean value of group two.
sd.2 standard deviation of group two.
data data.frame with values above.
denom Value in the denominator to standardize the means by. pooled.sd will pooltogether both groups in deriving d. control.sd uses the standard deviation ofgroup two (typically the control condition) to calculate d.
Value
d Standardized mean difference.
var.d Variance of d.
se.d Standard error of d.
Author(s)
AC Del Re & William T. Hoyt
Maintainer: AC Del Re <[email protected]>
References
Borenstein (2009). Effect sizes for continuous data. In H. Cooper, L. V. Hedges, & J. C. Valentine(Eds.), The handbook of research synthesis and meta analysis (pp. 279-293). New York: RussellSage Foundation.
See Also
compute_ds, compute_dgs
Examples
id <- c(1:20)n.1 <- c(10,20,13,22,28,12,12,36,19,12,36,75,33,121,37,14,40,16,14,20)n.2 <- c(11,22,10,20,25,12,12,36,19,11,34,75,33,120,37,14,40,16,10,21)m.1 <- c(.68,.56,.23,.64,.49,.4,1.49,.53,.58,1.18,.11,1.27,.26,.40,.49,
.51,.40,.34,.42,.66)m.2 <- c(.38,.36,.23,.34,.29,.4,1.9,.33,.28,1.1,.111,.27,.21,.140,.149,
.51,.140,.134,.42,.16)sd.1 <- c(.28,.26,.23,.44,.49,.34,.39,.33,.58,.38,.31,.27,.26,.40,
16 compute_gs
.49,.51,.140,.134,.42,.46)sd.2 <- c(.28,.26,.23,.44,.49,.44,.39,.33,.58,.38,.51,.27,.26,.40,
.49,.51,.140,.134,.142,.36)mod1 <- c(1,2,3,4,1,2,8,7,5,3,9,7,5,4,3,2,3,5,7,1)mod2 <- factor(c(rep(c(1,2,3,4),5)))dfs <- data.frame(id, n.1,m.1, sd.1, n.2, m.2, sd.2, mod1, mod2)
# Examplecompute_ds(n.1, m.1, sd.1, n.2, m.2, sd.2, data = dfs)
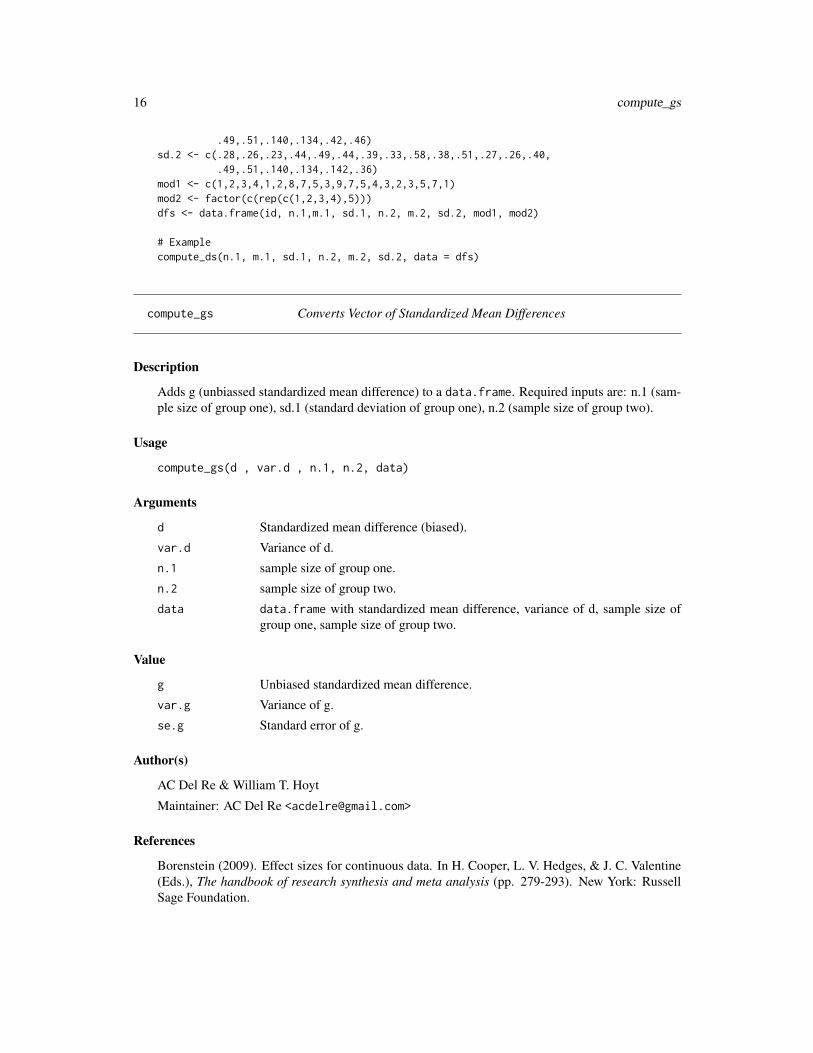
compute_gs Converts Vector of Standardized Mean Differences
Description
Adds g (unbiassed standardized mean difference) to a data.frame. Required inputs are: n.1 (sam-ple size of group one), sd.1 (standard deviation of group one), n.2 (sample size of group two).
Usage
compute_gs(d , var.d , n.1, n.2, data)
Arguments
d Standardized mean difference (biased).
var.d Variance of d.
n.1 sample size of group one.
n.2 sample size of group two.
data data.frame with standardized mean difference, variance of d, sample size ofgroup one, sample size of group two.
Value
g Unbiased standardized mean difference.
var.g Variance of g.
se.g Standard error of g.
Author(s)
AC Del Re & William T. Hoyt
Maintainer: AC Del Re <[email protected]>
References
Borenstein (2009). Effect sizes for continuous data. In H. Cooper, L. V. Hedges, & J. C. Valentine(Eds.), The handbook of research synthesis and meta analysis (pp. 279-293). New York: RussellSage Foundation.

dat.cooper15.3 17
See Also
compute_ds, compute_dgs
Examples
id <- c(1:20)n.1 <- c(10,20,13,22,28,12,12,36,19,12,36,75,33,121,37,14,40,16,14,20)n.2 <- c(11,22,10,20,25,12,12,36,19,11,34,75,33,120,37,14,40,16,10,21)m.1 <- c(.68,.56,.23,.64,.49,.4,1.49,.53,.58,1.18,.11,1.27,.26,.40,.49,
.51,.40,.34,.42,.66)m.2 <- c(.38,.36,.23,.34,.29,.4,1.9,.33,.28,1.1,.111,.27,.21,.140,.149,
.51,.140,.134,.42,.16)sd.1 <- c(.28,.26,.23,.44,.49,.34,.39,.33,.58,.38,.31,.27,.26,.40,
.49,.51,.140,.134,.42,.46)sd.2 <- c(.28,.26,.23,.44,.49,.44,.39,.33,.58,.38,.51,.27,.26,.40,
.49,.51,.140,.134,.142,.36)mod1 <- c(1,2,3,4,1,2,8,7,5,3,9,7,5,4,3,2,3,5,7,1)mod2 <- factor(c(rep(c(1,2,3,4),5)))dfs <- data.frame(id, n.1,m.1, sd.1, n.2, m.2, sd.2, mod1, mod2)
# Example
# first compute ddfs2 <- compute_ds(n.1, m.1, sd.1, n.2, m.2, sd.2, data = dfs)
# now, compute gcompute_gs(d, var.d, n.1, n.2, dfs2)
dat.cooper15.3 Data from Table 15.3 in The Handbook for Research Synthesis andMeta-Analysis (Cooper et al., 2009)
Description
Data from Table 15.3 in The Handbook for Research Synthesis and Meta-Analysis (Cooper et al.,2009)
dat.cooperA2 Data from Table A2 in The Handbook for Research Synthesis andMeta-Analysis (Cooper et al., 2009)
Description
Data from Table A2 in The Handbook for Research Synthesis and Meta-Analysis (Cooper et al.,2009)

18 dat.sim.final
dat.hoyt Subset of simulated data to demonstrate aggregation for dependenteffect sizes
Description
Subset of simulated data to demonstrate aggregation for dependent effect sizes. This data comesfrom: Hoyt, W. T., & Del Re, A. C. (2013). Comparison of methods for aggregating dependenteffect sizes in meta-analysis. Manuscript submitted for publication.
dat.sim.es Subset of simulated psychotherapy treatment studies (k=8) with de-pendent effect sizes
Description
This data set includes effect sizes for treatment vs control groups for a random subset of 8 simulatedpsychotherapy treatment studies (total population k = 1000). The known population standardizedmean difference for outcome one is g = 0.50 and for outcome two g = 0.80. The data set also in-cludes two correlated study-level variables (i.e., moderators): treatment duration (dose) and averageparticipant distress (stress).
This data accompanies a tutorial for meta-analysis:
Del Re, A. C. (2015). A Practical Tutorial on Conducting Meta-Analysis in R. The QuantitativeMethods for Psychology.
dat.sim.final Final aggregated dataset of simulated psychotherapy treatment studies(k=8)
Description
This data set includes aggregated effect sizes for treatment vs control groups for a random subsetof 8 simulated psychotherapy treatment studies (total population k = 1000). The known populationstandardized mean difference for outcome one is g = 0.50 and for outcome two g = 0.80. The dataset also includes two correlated study-level variables (i.e., moderators): treatment duration (dose)and average participant distress (stress).
This data accompanies a tutorial for meta-analysis:
Del Re, A. C. (2015). A Practical Tutorial on Conducting Meta-Analysis in R. The QuantitativeMethods for Psychology.

dat.sim.raw 19
dat.sim.raw Subset of simulated psychotherapy treatment studies (k=8) with meansand SD
Description
This data set includes means and standard deviations for treatment and control groups for a subsetof k = 8 simulated psychotherapy treatment studies from a population of k = 1000 (see dat.sim1 anddat.sim2 for the k = 1000 studies for outcome 1 and 2, respectfully). Although effect sizes are notcalculated in this dataset, the known population standardized mean difference for outcome one isd=0.50 and for outcome two g=0.80. The data set also includes two correlated study-level variables(i.e., moderators): treatment duration (dose) and average participant distress (stress).
This data accompanies a tutorial for meta-analysis:
Del Re, A. C. (2015). A Practical Tutorial on Conducting Meta-Analysis in R. The QuantitativeMethods for Psychology.
dat.sim1 Simulated psychotherapy treatment studies for ’outcome one’
Description
This data set includes 1000 simulated psychotherapy treatment studies. The population standardizedmean difference for outcome one is d=0.50. The data set also includes two correlated study-levelvariables (i.e., moderators): treatment duration (dose) and average participant distress (stress).
This data accompanies a tutorial for meta-analysis:
Del Re, A. C. (2015). A Practical Tutorial on Conducting Meta-Analysis in R. The QuantitativeMethods for Psychology.
dat.sim2 Simulated psychotherapy treatment studies for ’outcome two’
Description
This data set includes 1000 simulated psychotherapy treatment studies. The population standardizedmean difference for outcome two is d=0.80. The data set also includes two correlated study-levelvariables (i.e., moderators): treatment duration (dose) and average participant distress (stress).
This data accompanies a tutorial for meta-analysis:
Del Re, A. C. (2015). A Practical Tutorial on Conducting Meta-Analysis in R. The QuantitativeMethods for Psychology.

20 d_to_g
d_to_g Standardized Mean Difference (d) Statistic to Unbiased StandardizedMean Difference (g)
Description
Eliminates the small upward bias of d to provide an unbiased estimate of the population effect sizeparameter (g). This procedure will compute g for a single value of d.
Usage
d_to_g(d, var.d, n.1, n.2)
Arguments
d Standardized mean difference statistic (d has a slight bias).
var.d Variance of d.
n.1 Sample size of treatment group.
n.2 Sample size of comparison group.
Value
g Unbiased Standardized mean difference statistic.
var.g Variance of g.
Author(s)
AC Del Re & William T. Hoyt
Maintainer: AC Del Re <[email protected]>
References
Borenstein (2009). Effect sizes for continuous data. In H. Cooper, L. V. Hedges, & J. C. Valentine(Eds.), The handbook of research synthesis and meta analysis (pp. 279-293). New York: RussellSage Foundation.
f.ancova_to_d 21
f.ancova_to_d ANCOVA F-statistic to Standardized Mean Difference (d)
Description
Converts an ANCOVA F-statistic to d (standardized mean difference).
Usage
f.ancova_to_d(f, n.1, n.2, R, q)
Arguments
f F-test value from ANCOVA.
n.1 Treatment group sample size.
n.2 Comparison group sample size.
R Covariate outcome correlation or multiple correlation.
q number of covariates.
Value
d Standardized mean difference (d).
var_d Variance of d.
Author(s)
AC Del Re & William T. Hoyt
Maintainer: AC Del Re <[email protected]>
References
Borenstein (2009). Effect sizes for continuous data. In H. Cooper, L. V. Hedges, & J. C. Valentine(Eds.), The handbook of research synthesis and meta analysis (pp. 279-293). New York: RussellSage Foundation.
See Also
d_to_g, mean_to_d, mean_to_d2, t_to_d, f_to_d, p_to_d1, p_to_d2, ancova_to_d1, ancova_to_d2,tt.ancova_to_d, r_to_d, p.ancova_to_d1, p.ancova_to_d2, lor_to_d, prop_to_or, prop_to_d,r_from_chi, r_from_d, r_from_d1, r_from_t

22 fail_to_d
fail_to_d Failure groups to Standardized Mean Difference (d)
Description
Converts number of ’failure’ groups reported in the primary study to standardized mean difference(d).
Usage
fail_to_d(B, D, n.1, n.0)
Arguments
B Treatment failure.
D Non-treatment failure.
n.1 Treatment sample size.
n.0 Control/comparison sample size.
Value
d Standardized mean difference (d).
var_d Variance of d.
Author(s)
AC Del Re & William T. Hoyt
Maintainer: AC Del Re <[email protected]>
References
Borenstein (2009). Effect sizes for continuous data. In H. Cooper, L. V. Hedges, & J. C. Valentine(Eds.), The handbook of research synthesis and meta analysis (pp. 279-293). New York: RussellSage Foundation.
See Also
d_to_g, mean_to_d, mean_to_d2, t_to_d, f_to_d, p_to_d1, p_to_d2, ancova_to_d1, ancova_to_d2,tt.ancova_to_d, f.ancova_to_d, r_to_d, p.ancova_to_d1, p.ancova_to_d2, lor_to_d, prop_to_or,r_from_chi, r_from_d, r_from_d1, r_from_t

f_to_d 23
f_to_d F-test to Standardized Mean Difference (d)
Description
Converts F-test value to standardized mean difference (d).
Usage
f_to_d(f, n.1, n.2)
Arguments
f F-value reported in primary study.
n.1 Sample size of treatment group.
n.2 Sample size of comparison group.
Value
d Standardized mean difference (d).
var_d Variance of d.
Author(s)
AC Del Re & William T. Hoyt
Maintainer: AC Del Re <[email protected]>
References
Borenstein, M. (2009). Effect sizes for continuous data. In H. Cooper, L. V. Hedges, & J. C.Valentine (Eds.), The handbook of research synthesis and meta analysis (pp. 279-293). New York:Russell Sage Foundation.
See Also
d_to_g, mean_to_d, mean_to_d2, t_to_d, p_to_d1, p_to_d2, ancova_to_d1, ancova_to_d2,tt.ancova_to_d, f.ancova_to_d, r_to_d, p.ancova_to_d1, p.ancova_to_d2, lor_to_d, prop_to_or,prop_to_d, r_from_chi, r_from_d, r_from_d1, r_from_t

24 icc
icc Intraclass correlation coefficient (ICC) for oneway and twoway mod-els
Description
Computes single score or average score ICCs as an index of interrater reliability of quantitativedata. Additionally, F-test and confidence interval are computed.
Usage
icc(ratings, model = c("oneway", "twoway"),type = c("consistency", "agreement"),unit = c("single", "average"), r0 = 0, conf.level = 0.95)
Arguments
ratings n*m matrix or dataframe, n subjects m raters.
model a character string specifying if a oneway model (default) with row effects ran-dom, or a twoway model with column and row effects random should be applied.You can specify just the initial letter.
type a character string specifying if ’"consistency"’ (default) or ’"agreement"’ be-tween raters should be estimated. If a ’"oneway"’ model is used, only ’"consis-tency"’ could be computed. You can specify just the initial letter.
unit a character string specifying the unit of analysis: Must be one of single (de-fault) or average. You can specify just the initial letter.
r0 specification of the null hypothesis r = r0. Note that a one sided test (H1: r > r0)is performed.
conf.level confidence level of the interval.
Details
This function was created by Matthias Gamer for the irr package. For more details, see:
http://rss.acs.unt.edu/Rdoc/library/irr/html/icc.html
Details for the function:
Missing data are omitted in a listwise way. When considering which form of ICC is appropriate foran actual set of data, one has take several decisions (Shrout & Fleiss, 1979):
1. Should only the subjects be considered as random effects (oneway model) or are subjects andraters randomly chosen from a bigger pool of persons (twoway model).
2. If differences in judges’ mean ratings are of interest, interrater agreement instead of consistencyshould be computed.
3. If the unit of analysis is a mean of several ratings, unit should be changed to average. In mostcases, however, single values (unit = single) are regarded.

icc 25
Value
A list with class icclist containing the following components:
subjects the number of subjects examined.
raters the number of raters.
model a character string describing the selected model for the analysis.
type a character string describing the selected type of interrater reliability.
unit a character string describing the unit of analysis.
icc.name a character string specifying the name of ICC according to McGraw & Wong(1996).
value the intraclass correlation coefficient.
r0 the specified null hypothesis.
Fvalue the value of the F-statistic.
df1 the numerator degrees of freedom.
df2 the denominator degrees of freedom.
p.value the p-value for a two-sided test.
conf.level the confidence level for the interval.
lbound the lower bound of the confidence interval.
ubound the upper bound of the confidence interval.
Author(s)
Matthias Gamer
References
Bartko, J.J. (1966). The intraclass correlation coefficient as a measure of reliability. PsychologicalReports, 19, 3-11.
McGraw, K.O., & Wong, S.P. (1996), Forming inferences about some intraclass correlation coeffi-cients. Psychological Methods, 1, 30-46.
Shrout, P.E., & Fleiss, J.L. (1979), Intraclass correlation: uses in assessing rater reliability. Psycho-logical Bulletin, 86, 420-428.
Examples
# sample data
study <- c(1,1,2,2,3,3)rater <- c(rep(1:2,3))mod1 <- round(rnorm(6, 10, 1))mod2 <- c(5,5, 9, 9, 8, 8)mod3 <- c(10,10, 9, 9, 8, 8)w <-data.frame(study, rater, mod1, mod2, mod3)w

26 Kappa
# if data is in this format:
# study rater mod1 mod2 mod3# 1 1 9 9 10# 1 2 11 8 10# 2 1 9 10 11# 2 2 9 10 11# 3 1 9 9 8# 3 2 12 9 8## the data will need to be reshaped to be processed by the# icc function:
long <- reshape(w, varying=colnames(w)[3:5], v.names="Code",idvar=c('study', 'rater'), timevar="mods", direction='long')
wide <- reshape(long, idvar=c('mods', 'study'), timevar='rater')
# icc function (created by Matthias Gamer for the 'irr' package)
icc(cbind(wide$Code.1, wide$Code.2), type= "consistency")
Kappa Inter-Rater Agreement
Description
Kappa coefficients for assessing inter-rater agreement between two coders (for categoricalvariables/moderators).
Usage
Kappa(rater1, rater2)
Arguments
rater1 First rater of categorical variable to be analyzed. This vector needs to be in aseparate column if in a data.frame.
rater2 Second rater on same categorical variable to be analyzed. This vector needs tobe in a separate column if in a data.frame.
Value
Kappa coefficients for inter-rater reliability (categorical variables).
Author(s)
AC Del Re & William T. Hoyt
Maintainer: AC Del Re <[email protected]>

lor_to_d 27
Examples
# sample data
study <- c(1,1,2,2,3,3) # study codedrater <- rep(1:2, 3) # 2 ratersmod1 <- as.factor(round(rnorm(6, 10, 1))) # values coded for mod 1mod2 <- as.factor(round(rnorm(6, 10, 1)))mod3 <- as.factor(round(rnorm(6, 10, 1)))mod4 <- as.factor(round(rnorm(6, 10, 1)))mod5 <- as.factor(round(rnorm(6, 10, 1)))mod6 <- as.factor(round(rnorm(6, 10, 1)))w <-data.frame(study, rater,mod1, mod2, mod3, mod4, mod5, mod6)w
# if data is in this format:# study rater mod1 mod2 mod3 mod4 mod5 mod6# 1 1 8 10 9 9 10 10# 1 2 10 11 10 10 13 12# 2 1 11 10 11 11 10 12# 2 2 13 10 10 11 12 9# 3 1 11 10 11 10 10 9# 3 2 10 10 11 9 10 11## the data will need to be reshaped to be processed by the# Kappa function:
long <- reshape(w, varying=colnames(w)[3:8], v.names="code",idvar=c('study', 'rater'), timevar= 'mods', direction='long')
wide <- reshape(long, idvar=c('mods', 'study'), timevar='rater')wide
# running the function:
Kappa(wide$code.1, wide$code.2)
lor_to_d Log Odds Ratio to Standardized Mean Difference (d)
Description
Converts a log odds ratio reported in the primary study to a standardized mean difference (d).
Usage
lor_to_d(lor, var.lor)
Arguments
lor Log odds ratio reported in the primary study.var.lor Variance of the log odds ratio.

28 macat
Value
d Standardized mean difference (d).
var_d Variance of d.
Author(s)
AC Del Re & William T. Hoyt
Maintainer: AC Del Re <[email protected]>
References
Borenstein (2009). Effect sizes for continuous data. In H. Cooper, L. V. Hedges, & J. C. Valentine(Eds.), The handbook of research synthesis and meta analysis (pp. 279-293). New York: RussellSage Foundation.
See Also
d_to_g, mean_to_d, mean_to_d2, t_to_d, f_to_d, p_to_d1, p_to_d2, ancova_to_d1, ancova_to_d2,tt.ancova_to_d, f.ancova_to_d, r_to_d, p.ancova_to_d1, p.ancova_to_d2, prop_to_or, prop_to_d,r_from_chi, r_from_d, r_from_d1, r_from_t
macat Categorical Moderator Analysis
Description
Computes single predictor categorical moderator analysis under a fixed or random effects model.
Usage
macat(g, var, mod, data, method= "random")
Arguments
g Hedges g (unbiased estimate of d) effect size.
var Vaiance of g.
mod Categorical moderator variable used for moderator analysis.
method Default is random. For fixed effects, use fixed.
data data.frame with values above.
Details
See Konstantopoulos & Hedges (2009; pp. 280-288) for the computations used in this function.

macat 29
Value
mod Level of the categorical moderator.
k Number of studies for each level of the moderator.
estimate Mean effect size of each level of the moderator.
ci.l Lower 95% confidence interval.
ci.u Upper 95% confidence interval.
z z-score (standardized value).
p Significance level.
var Variance of effect size.
se Square root of variance.
Q Q-statistic (measure of homogeneity).
df Degrees of freedom for Q-statistic.
p.h p-value for homogeneity within that level of the moderator.
I2 Proportion of total variation in effect size that is due to heterogeneity rather thanchance (see Shadish & Haddock, 2009; pp. 263).
Q Q-statistic overall. Note: Whether fixed or random effects analyses are con-ducted, the Q statistic reported is for the fixed effect model. Therefore, Qb +Qw != Q in the random effects output.
Qw Q-within (or error). Measure of within-group heterogeneity.
Qw.df Degrees of freedom for Q-within.
Qw.p Q-within p-value (for homogeneity).
Qb Q-between (or model). Measure of model fit.
Qb.df Degrees of freedom for Q-between.
Qb.p Q-between p-value (for homogeneity). Qb and Qb.p provide the test of whetherthe moderator variable(s) account for significant variance among effect sizes.
Author(s)
AC Del Re & William T. Hoyt
Maintainer: AC Del Re <[email protected]>
References
Konstantopoulos & Hedges (2009). Analyzing effect sizes: Fixed-effects models. In H. Cooper,L. V. Hedges, & J. C. Valentine (Eds.), The handbook of research synthesis and meta analysis (pp.279-293). New York: Russell Sage Foundation.
Shadish & Haddock (2009). Analyzing effect sizes: Fixed-effects models. In H. Cooper, L. V.Hedges, & J. C. Valentine (Eds.), The handbook of research synthesis and meta analysis (pp. 257-278). New York: Russell Sage Foundation.
See Also
plotcat, wd

30 macatC
Examples
id<-c(1:20)n.1<-c(10,20,13,22,28,12,12,36,19,12,36,75,33,121,37,14,40,16,14,20)n.2 <- c(11,22,10,20,25,12,12,36,19,11,34,75,33,120,37,14,40,16,10,21)g <- c(.68,.56,.23,.64,.49,-.04,1.49,1.33,.58,1.18,-.11,1.27,.26,.40,.49,.51,.40,.34,.42,1.16)var.g <- c(.08,.06,.03,.04,.09,.04,.009,.033,.0058,.018,.011,.027,.026,.0040,.049,.0051,.040,.034,.0042,.016)mod<-factor(c(rep(c(1,1,2,3),5)))df<-data.frame(id, n.1,n.2, g, var.g,mod)
# Example
# Random effectsmacat(g = g, var= var.g, mod = mod, data = df, method= "random")
macatC Direct Categorical Moderator Comparison
Description
Function for a planned comparison between two levels of a moderator under a fixed or randomeffects model.
Usage
macatC(x1, x2, g, var, mod, data, method= "random", type= "post.hoc")
Arguments
x1 One level of categorical moderator.
x2 Comparison level of same categorical moderator.
g Hedges g (unbiased estimate of d) effect size.
var Vaiance of g.
mod Categorical moderator variable used for moderator analysis.
method Default is random. For fixed effects, use fixed.
type post.hoc assumes the comparison was not planned prior to conducting the metaanalysis. The a priori option, planned, assumes the researcher planned to con-duct the analysis a priori. Default is post.hoc using the Scheffe post hoc statis-tical method.
data data.frame with values above.
Details
See Konstantopoulos & Hedges (2009; pp. 280-288) for the computations used in this function.
macatC 31
Value
diff Mean difference between the two levels.
var.diff Variance of diff.
p Significance level.
Author(s)
AC Del Re & William T. Hoyt
Maintainer: AC Del Re <[email protected]>
References
Konstantopoulos & Hedges (2009). Analyzing effect sizes: Fixed-effects models. In H. Cooper,L. V. Hedges, & J. C. Valentine (Eds.), The handbook of research synthesis and meta analysis (pp.279-293). New York: Russell Sage Foundation.
Shadish & Haddock (2009). Analyzing effect sizes: Fixed-effects models. In H. Cooper, L. V.Hedges, & J. C. Valentine (Eds.), The handbook of research synthesis and meta analysis (pp. 257-278). New York: Russell Sage Foundation.
See Also
macat,
Examples
id<-c(1:20)n.1<-c(10,20,13,22,28,12,12,36,19,12,36,75,33,121,37,14,40,16,14,20)n.2 <- c(11,22,10,20,25,12,12,36,19,11,34,75,33,120,37,14,40,16,10,21)g <- c(.68,.56,.23,.64,.49,-.04,1.49,1.33,.58,1.18,-.11,1.27,.26,.40,.49,.51,.40,.34,.42,1.16)var.g <- c(.08,.06,.03,.04,.09,.04,.009,.033,.0058,.018,.011,.027,.026,.0040,.049,.0051,.040,.034,.0042,.016)mod<-factor(c(rep(c(1,1,2,3),5)))df<-data.frame(id, n.1,n.2, g, var.g,mod)
# ExamplemacatC(1, 2, g=g, var=var.g, mod=mod, data=df, method= "random",
type= "post.hoc")
32 mareg
mareg Meta-Regression
Description
Meta-regression function for a single or multiple predictor model. This function is a wrapper forthe rma() function in the metafor package (Viechtbauer, W, 2010). Please see https://CRAN.R-project.org/package=metafor for details or for more advanced functionality with the rma() function.
Usage
mareg(formula, var, data, method = "REML", subset, digits = 3, ...)
Arguments
formula This is a formula based function, similar to other functions in R (e.g., lm), wherethe criterion variable (e.g., Hedges g in this case) is dependent on (’~’) the pre-dictor variables (e.g., moderators). The formula for two moderators would takethis form: mareg(g ~ mod1 + mod2, var.g, data), where g is the criterion variablepredicted by mod1 and mod2. The variance (var) of each g is var.g in this case.
var Variance of g.
data Aggregated data.frame (see agg function for setting up the dataset for theseanalyses) with id, g (unbiased standardized mean difference), var.g (variance ofg) for each study.
method Default is REML (Restricted-Maximal Likelihood), which is the standard randomeffects method. For fixed effects, use FE. Other options are specified in themetafor package manual (’rma’ function).
subset an optional vector specifying a subset of observations to be used in the fittingprocess.
digits Number of digits to output. Default is 3.
... Additional arguments to be passed to rma().
Details
See Wolfgang Viechtbauer (2010). metafor: Meta-Analysis Package for R. R package version 1.1-0.for the details of the rma() function. https://CRAN.R-project.org/package=metafor
Value
estimate Meta-regression coefficient estimate.
se Standard error of the estimate coefficient.
z z-value.
ci.l Lower 95% confidence interval.
ci.u Upper 95% confidence interval.

mareg 33
p p-value (significance level).
QE Q-error. Measure of error in the model.
QE.df Degrees of freedom for Q-error.
QEp Q-error p-value (for homogeneity).
QM Q-model. Measure of model fit.
QM.df Degrees of freedom for Q-model.
QMp Q-between p-value (for homogeneity). QM and QMp provide the test of whetherthe moderator variable(s) account for significant variance among effect sizes.
References
Wolfgang Viechtbauer (2010). metafor: Meta-Analysis Package for R. R package version 1.1-0.https://CRAN.R-project.org/package=metafor
See Also
wd, plotcon
Examples
# install metafor# install.packages('metafor', dependencies = TRUE)
# Sample datadata(dat.sim.final)
# Examples
# OMNIBUSm0 <- mareg(es~1, var=var, data=dat.sim.final)summary(m0)
# META-REGRESSIONm1 <- mareg(es~dose, var=var, data=dat.sim.final)summary(m1) # SINGLE MODERATOR
m2 <- mareg(es~stress, var=var, data=dat.sim.final)summary(m2) # SINGLE MODERATOR
m3 <- mareg(es~dose + stress, var=var, data=dat.sim.final)summary(m3) # MULTIPLE MODERATOR

34 mean_to_d
mean_to_d Means to Standardized Mean Difference
Description
Converts raw mean scores reported in the primary study to a standardized mean difference (d).
Usage
mean_to_d(m.1, m.2, sd.1, sd.2, n.1, n.2)
Arguments
m.1 Mean of group one.
m.2 Mean of group two.
sd.1 Standard deviation of group one.
sd.2 Standard deviation of group two.
n.1 Sample size of group one.
n.2 Sample size of group two.
Value
d Standardized mean difference (d).
var.d Variance of d.
Author(s)
AC Del Re & William T. Hoyt
Maintainer: AC Del Re <[email protected]>
References
Borenstein (2009). Effect sizes for continuous data. In H. Cooper, L. V. Hedges, & J. C. Valentine(Eds.), The handbook of research synthesis and meta analysis (pp. 279-293). New York: RussellSage Foundation.
See Also
d_to_g, mean_to_d2, t_to_d, f_to_d, p_to_d1, p_to_d2, ancova_to_d1, ancova_to_d2, tt.ancova_to_d,f.ancova_to_d, r_to_d, p.ancova_to_d1, p.ancova_to_d2, lor_to_d, prop_to_or, prop_to_d,r_from_chi, r_from_d, r_from_d1, r_from_t

mean_to_d2 35
mean_to_d2 Means with Pooled SD to Standardized Mean Difference
Description
Converts raw mean scores with pooled standard deviation from the primary study to a standardizedmean difference (d).
Usage
mean_to_d2(m.1, m.2, s.pooled, n.1, n.2)
Arguments
m.1 Mean of group one.
m.2 Mean of group two.
s.pooled Pooled standard deviation.
n.1 Sample size of group one.
n.2 Sample size of group two.
Value
d Standardized mean difference (d).
var.d Variance of d.
Author(s)
AC Del Re & William T. Hoyt
Maintainer: AC Del Re <[email protected]>
References
Borenstein (2009). Effect sizes for continuous data. In H. Cooper, L. V. Hedges, & J. C. Valentine(Eds.), The handbook of research synthesis and meta analysis (pp. 279-293). New York: RussellSage Foundation.
See Also
d_to_g, mean_to_d, t_to_d, f_to_d, p_to_d1, p_to_d2, ancova_to_d1, ancova_to_d2, tt.ancova_to_d,f.ancova_to_d, r_to_d, p.ancova_to_d1, p.ancova_to_d2, lor_to_d, prop_to_or, prop_to_d,r_from_chi, r_from_d, r_from_d1, r_from_t

36 or_to_d
or_to_d Odds Ratio to Standardized Mean Difference (d)
Description
Converts odds ratio reported in the primary study to standardized mean difference (d).
Usage
or_to_d(or)
Arguments
or Odds ratio.
Value
d Standardized mean difference (d).
Author(s)
AC Del Re & William T. Hoyt
Maintainer: AC Del Re <[email protected]>
References
Borenstein (2009). Effect sizes for continuous data. In H. Cooper, L. V. Hedges, & J. C. Valentine(Eds.), The handbook of research synthesis and meta analysis (pp. 279-293). New York: RussellSage Foundation.
See Also
d_to_g, mean_to_d, mean_to_d2, t_to_d, f_to_d, p_to_d1, p_to_d2, ancova_to_d1, ancova_to_d2,tt.ancova_to_d, f.ancova_to_d, r_to_d, p.ancova_to_d1, p.ancova_to_d2, lor_to_d, prop_to_or,r_from_chi, r_from_d, r_from_d1, r_from_t

p.ancova_to_d1 37
p.ancova_to_d1 One-tailed p-value from ANCOVA to Standardized Mean Difference(d)
Description
Converts a one-tailed p-value from ANCOVA reported in the primary study to a standardized meandifference (d)
Usage
p.ancova_to_d1(p, n.1, n.2, R, q)
Arguments
p One-tailed p-value reported in primary study.
n.1 Treatment group sample size.
n.2 Comparison group sample size.
R Covariate outcome correlation or multiple correlation.
q number of covariates.
Value
d Standardized mean difference (d).
var_d Variance of d.
Author(s)
AC Del Re & William T. Hoyt
Maintainer: AC Del Re <[email protected]>
References
Borenstein (2009). Effect sizes for continuous data. In H. Cooper, L. V. Hedges, & J. C. Valentine(Eds.), The handbook of research synthesis and meta analysis (pp. 279-293). New York: RussellSage Foundation.
See Also
d_to_g, mean_to_d, mean_to_d2, t_to_d, f_to_d, p_to_d1, p_to_d2, ancova_to_d1, ancova_to_d2,tt.ancova_to_d, f.ancova_to_d, r_to_d, p.ancova_to_d2, lor_to_d, prop_to_or, prop_to_d,r_from_chi, r_from_d, r_from_d1, r_from_t

38 p.ancova_to_d2
p.ancova_to_d2 Two-tailed p-value from ANCOVA to Standardized Mean Difference(d)
Description
Converts a two-tailed p-value from ANCOVA reported in the primary study to a standardized meandifference (d)
Usage
p.ancova_to_d2(p, n.1, n.2, R, q)
Arguments
p Two-tailed p-value reported in primary study.
n.1 Treatment group sample size.
n.2 Comparison group sample size.
R Covariate outcome correlation or multiple correlation.
q number of covariates.
Value
d Standardized mean difference (d).
var_d Variance of d.
Author(s)
AC Del Re & William T. Hoyt
Maintainer: AC Del Re <[email protected]>
References
Borenstein (2009). Effect sizes for continuous data. In H. Cooper, L. V. Hedges, & J. C. Valentine(Eds.), The handbook of research synthesis and meta analysis (pp. 279-293). New York: RussellSage Foundation.
See Also
d_to_g, mean_to_d, t_to_d, f_to_d, p_to_d1, p_to_d2, ancova_to_d1, ancova_to_d2, tt.ancova_to_d,f.ancova_to_d, r_to_d, p.ancova_to_d1, p.ancova_to_d2, lor_to_d, prop_to_or, prop_to_d,r_from_chi, r_from_d, r_from_d1, r_from_t

plotcat 39
plotcat Categorical Moderator Graph
Description
Outputs boxplot graphic for each level of the specified moderator.
Usage
plotcat(g, var, mod, data, modname=NULL, title=NULL, ...)
Arguments
g Hedges g (unbiased estimate of d) effect size.
var Vaiance of g.
mod Categorical moderator variable used for moderator analysis.
data data.frame with values above.
modname Name of moderator to appear on x axis of plot. Default is NULL.
title Plot title. Default is NULL.
... Additional arguments to be passed to ggplot.
Value
Boxplot graph with median, max, min, and outliers from a fixed or random effects categoricalmoderator analysis. Places jitter points (for each study) on the boxplots. The size of each point(representing a study in the analysis) are based on study weights where more precise studies havelarger points. The ggplot2 package outputs the graphics.
Author(s)
AC Del Re & William T. Hoyt
Maintainer: AC Del Re <[email protected]>
References
Cooper, H., Hedges, L.V., & Valentine, J.C. (2009). The handbook of research synthesis and meta-analysis (2nd edition). New York: Russell Sage Foundation.
See Also
macat, plotcon

40 plotcon
Examples
id<-c(1, 1:19)n.1<-c(10,20,13,22,28,12,12,36,19,12,36,75,33,121,37,14,40,16,14,20)n.2 <- c(11,22,10,20,25,12,12,36,19,11,34,75,33,120,37,14,40,16,10,21)g <- c(.68,.56,.23,.64,.49,-.04,1.49,1.33,.58,1.18,-.11,1.27,.26,.40,.49,.51,.40,.34,.42,1.16)var.g <- c(.08,.06,.03,.04,.09,.04,.009,.033,.0058,.018,.011,.027,.026,.0040,.049,.0051,.040,.034,.0042,.016)mod<-factor(c(rep(c(1,1,2,3),5)))df<-data.frame(id, n.1,n.2, g, var.g,mod)
# Example
## Not run: plotcat(g = g, var = var.g, mod = mod, data = df, method= "random",modname= "Moderator")
## End(Not run)
plotcon Meta Regression Scatterplot
Description
Outputs a scatterplot from a fixed or random effects meta regression (continuous and/or categorical).
Usage
plotcon(g, var, mod, data, method= "random", modname=NULL,title=NULL, ...)
Arguments
g Hedges g (unbiased estimate of d) effect size.
var Vaiance of g.
mod Categorical moderator variable used for moderator analysis.
method Default is random (Restricted-Maximal Likelihood), which is the standard ran-dom effects method. For fixed effects, use fixed.
data data.frame with values above.
modname Name of moderator to appear on x axis of plot. Default is NULL.
title Plot title. Default is NULL.
... Additional arguments to be passed to ggplot.
Value
Scatterplot with fixed or random effects regression line with size of visual points based on studyweights, where the more precise studies have larger points. The ggplot2 package outputs the richgraphics.

PubBias 41
Author(s)
AC Del Re & William T. Hoyt
Maintainer: AC Del Re <[email protected]>
References
Cooper, H., Hedges, L.V., & Valentine, J.C. (2009). The handbook of research synthesis and metaanalysis (2nd edition). New York: Russell Sage Foundation.
See Also
mareg, plotcat
Examples
# SAMPLE DATAMA2 <-read.table(textConnection("id es1 var1 n.1 n.2 mod1 mod21 1 0.5695938 0.04906967 26 30 a 202 2 0.4123667 0.04362541 28 34 b 303 3 0.4084333 0.04458363 34 28 a 254 4 0.5014756 0.04186354 37 29 b 355 5 0.5540745 0.04339382 31 32 b 406 1 0.5695938 0.04906967 26 30 a 207 2 0.4123667 0.04362541 28 34 b 308 3 0.4084333 0.04458363 34 28 a 259 4 0.5014756 0.04186354 37 29 b 3510 5 0.5540745 0.04339382 31 32 b 40"))
# EXAMPLEplotcon(es1, var1, mod2, data=MA2, method= "fixed", modname="NULL",title="NULL")
PubBias Assess for Publication Bias
Description
Assess for publication bias in the meta-analytic data
Usage
PubBias(data)
Arguments
data data.frame having been analyzed by the weights function with id and z.score(standardized z-value).

42 p_to_d1
Value
k Number of studies.
Z Overall z-value for data set.
k0 Number of studies needed to include with effect size = 0 (null) in order for thep > .05 (null hypothesis retained).
k.per Number of missing studies for every observed study for the overall effect to benullified.
Author(s)
AC Del Re & William T. Hoyt
Maintainer: AC Del Re <[email protected]>
References
Sutton, A. J. (2009). Publication bias. In H. Cooper, L. V. Hedges, & J. C. Valentine (Eds.),The handbook of research synthesis and meta analysis (pp. 435-452). New York: Russell SageFoundation.
See Also
weights
p_to_d1 One-tailed p-value to Standardized Mean Difference (d)
Description
One-tailed p-value reported in the primary study to Standardized Mean Difference (d)
Usage
p_to_d1(p, n.1, n.2)
Arguments
p One-tailed p-value reported in primary study.
n.1 Sample size of treatment group.
n.2 Sample size of comparison group.
Value
d Standardized mean difference (d).
var_d Variance of d.

p_to_d2 43
Author(s)
AC Del Re & William T. Hoyt
Maintainer: AC Del Re <[email protected]>
References
Borenstein (2009). Effect sizes for continuous data. In H. Cooper, L. V. Hedges, & J. C. Valentine(Eds.), The handbook of research synthesis and meta analysis (pp. 279-293). New York: RussellSage Foundation.
See Also
d_to_g, mean_to_d, mean_to_d2, t_to_d, f_to_d, p_to_d2, ancova_to_d1, ancova_to_d2, tt.ancova_to_d,f.ancova_to_d, r_to_d, p.ancova_to_d1, p.ancova_to_d2, lor_to_d, prop_to_or, prop_to_d,r_from_chi, r_from_d, r_from_d1, r_from_t
p_to_d2 Two-tailed p-value to Standardized Mean Difference (d)
Description
One-tailed p-value reported in primary study to Standardized Mean Difference (d)
Usage
p_to_d2(p, n.1, n.2)
Arguments
p Two-tailed p-value reported in primary study.
n.1 Sample size of treatment group.
n.2 Sample size of comparison group.
Value
d Standardized mean difference (d).
var_d Variance of d.
Author(s)
AC Del Re & William T. Hoyt
Maintainer: AC Del Re <[email protected]>

44 r2
References
Borenstein (2009). Effect sizes for continuous data. In H. Cooper, L. V. Hedges, & J. C. Valentine(Eds.), The handbook of research synthesis and meta analysis (pp. 279-293). New York: RussellSage Foundation.
See Also
d_to_g, mean_to_d, mean_to_d2, t_to_d, f_to_d, p_to_d1, ancova_to_d1, ancova_to_d2, tt.ancova_to_d,f.ancova_to_d, r_to_d, p.ancova_to_d1, p.ancova_to_d2, lor_to_d, prop_to_or, prop_to_d,r_from_chi, r_from_d, r_from_d1, r_from_t
r2 Explained Variance
Description
Compares tau-squared from empty model (omnibus or overall weighted mean) to model with mod-erators and provides percentage of explained variance.
Usage
r2(x)
Arguments
x Will take either a mareg (meta-regression), or macat (single predictor categori-cal moderator analysis) object and evaluate.
Author(s)
AC Del Re & William T. Hoyt
Maintainer: AC Del Re <[email protected]>
Examples
# Sample dataid<-c(1:20)n.1<-c(10,20,13,22,28,12,12,36,19,12,36,75,33,121,37,14,40,16,14,20)n.2 <- c(11,22,10,20,25,12,12,36,19,11,34,75,33,120,37,14,40,16,10,21)g <- c(.68,.56,.23,.64,.49,-.04,1.49,1.33,.58,1.18,-.11,1.27,.26,.40,.49,.51,.40,.34,.42,1.16)var.g <- c(.08,.06,.03,.04,.09,.04,.009,.033,.0058,.018,.011,.027,.026,.0040,.049,.0051,.040,.034,.0042,.016)mod<-factor(c(rep(c(1,1,2,3),5)))mods2<-c(rep(1:5,4))df<-data.frame(id, n.1,n.2, g, var.g,mod, mods2)

robustSE 45
# Examples
# mareg fuctiontemp <- mareg(g~ mod + mods2, var = var.g, method = "REML", data = df)
r2(temp)
robustSE Robust standard error
Description
When the correlation between dependent effect sizes are unknown, one approach is to conduct themeta-analysis by assuming that the effect sizes are independent. Then, Hedges et al. (2010) robuststandard error procedure can be calculated to adjust for dependence.
Usage
robustSE(model, cluster=NULL, CI=.95, digits=3)
Arguments
model omnibus or moderator model object fitted from mareg() function.cluster Name of variable where the dependencies are present. This will typically be the
variable for study id where length(unique(study_id))>1.CI Confidence interval. Defaults to .95.digits Number of digits to output. Defaults to 3.
Value
estimate Meta-regression coefficient estimate.se Adjusted Standard error of the estimate coefficient.t t-value.ci.l Adjusted Lower 95% confidence interval.ci.u Adjusted Upper 95% confidence interval.p p-value.
Author(s)
Mike Cheung with modifications by AC Del Re
References
Hedges, L. V., Tipton, E., & Johnson, M. C. (2010). Robust variance estimation in meta-regressionwith dependent effect size estimates. Research Synthesis Methods, 1(1), 39-65. doi:10.1002/jrsm.5
Cheung, M.W.L. (2012). metaSEM: An R package for meta-analysis using structural equationmodeling. Manuscript submitted for publication.

46 r_from_chi
See Also
mareg,
Examples
# install metafor# install.packages('metafor', dependencies = TRUE)
# Sample dataid<-c(1:20)n.1<-c(10,20,13,22,28,12,12,36,19,12,36,75,33,121,37,14,40,16,14,20)n.2 <- c(11,22,10,20,25,12,12,36,19,11,34,75,33,120,37,14,40,16,10,21)g <- c(.68,.56,.23,.64,.49,-.04,1.49,1.33,.58,1.18,-.11,1.27,.26,.40,.49,.51,.40,.34,.42,1.16)var.g <- c(.08,.06,.03,.04,.09,.04,.009,.033,.0058,.018,.011,.027,.026,.0040,.049,.0051,.040,.034,.0042,.016)mod<-factor(c(rep(c(1,1,2,3),5)))mods2<-c(rep(1:5,4))df<-data.frame(id, n.1,n.2, g, var.g,mod, mods2)
# Examples
# Adjusted SErobustSE(mareg(g~ mod + mods2, var = var.g, method = "REML", data = df))
r_from_chi Chi-Squared to Correlation
Description
Converting Chi-squared statistic (with 1 degree of freedom) reported in primary study to r
Usage
r_from_chi(chi.sq, n)
Arguments
chi.sq Chi squared statistic from primary study.
n Sample size in primary study.
Value
Computes correlation coefficient (r).

r_from_d 47
Author(s)
AC Del Re & William T. Hoyt
Maintainer: AC Del Re <[email protected]>
See Also
d_to_g, mean_to_d, mean_to_d2, t_to_d, f_to_d, p_to_d1, p_to_d2, ancova_to_d1, ancova_to_d2,tt.ancova_to_d, f.ancova_to_d, r_to_d, p.ancova_to_d1, p.ancova_to_d2, lor_to_d, prop_to_or,prop_to_d, r_from_d, r_from_d1, r_from_t
r_from_d Correlation from Mean Difference
Description
Converts d (mean difference) to r where n.tmt = n.comparison (see section 12.5.4, Borenstein, 2009;pp. 234).
Usage
r_from_d(d, var.d, a = 4)
Arguments
d Mean difference statistic (d) reported in primary study.var.d Variance of d reported in primary study.a Used to compute correlation. Default is 4.
Value
Outputs a correlation coefficient (r).
Author(s)
AC Del Re & William T. Hoyt
Maintainer: AC Del Re <[email protected]>
References
Borenstein (2009). Effect sizes for continuous data. In H. Cooper, L. V. Hedges, & J. C. Valentine(Eds.), The handbook of research synthesis and meta analysis (pp. 279-293). New York: RussellSage Foundation.
See Also
d_to_g, mean_to_d, mean_to_d2, t_to_d, f_to_d, p_to_d1, p_to_d2, ancova_to_d1, ancova_to_d2,tt.ancova_to_d, f.ancova_to_d, r_to_d, p.ancova_to_d1, p.ancova_to_d2, lor_to_d, prop_to_or,prop_to_d, r_from_chi, r_from_d1, r_from_t

48 r_from_d1
r_from_d1 Correlation from Mean Difference II
Description
Converts d (mean difference) reported in primary study to r (correlation coefficient) where samplesize of the treatment group is not equal to the sample size of the comparison group (see section12.5.4, Borenstein, 2009; pp. 234).
Usage
r_from_d1(d, n.1, n.2, var.d)
Arguments
d Mean difference statistic (d) reported in primary study.
n.1 sample size of group one reported in primary study.
n.2 sample size of group two reported in primary study.
var.d variance of d reported in primary study.
Value
Computes a correlation coefficient (r).
Author(s)
AC Del Re & William T. Hoyt
Maintainer: AC Del Re <[email protected]>
References
Borenstein (2009). Effect sizes for continuous data. In H. Cooper, L. V. Hedges, & J. C. Valentine(Eds.), The handbook of research synthesis and meta analysis (pp. 279-293). New York: RussellSage Foundation.
See Also
d_to_g, mean_to_d, mean_to_d2, t_to_d, f_to_d, p_to_d1, p_to_d2, ancova_to_d1, ancova_to_d2,tt.ancova_to_d, f.ancova_to_d, r_to_d, p.ancova_to_d1, p.ancova_to_d2, lor_to_d, prop_to_or,prop_to_d, r_from_chi, r_from_d, r_from_t
r_from_t 49
r_from_t Correlation from t-test
Description
Compute correlation from t-value reported in the primary study (see section 12.5.4, Borenstein,2009; pp. 234).
Usage
r_from_t(t, n)
Arguments
t t-statistic value reported in primary study.
n Sample size reported in primary study.
Value
Outputs the correlation coefficient (r).
Author(s)
AC Del Re & William T. Hoyt
Maintainer: AC Del Re <[email protected]>
References
Borenstein (2009). Effect sizes for continuous data. In H. Cooper, L. V. Hedges, & J. C. Valentine(Eds.), The handbook of research synthesis and meta analysis (pp. 279-293). New York: RussellSage Foundation.
See Also
d_to_g, mean_to_d, mean_to_d2, t_to_d, f_to_d, p_to_d1, p_to_d2, ancova_to_d1, ancova_to_d2,tt.ancova_to_d, f.ancova_to_d, r_to_d, p.ancova_to_d1, p.ancova_to_d2, lor_to_d, prop_to_or,prop_to_d, r_from_chi, r_from_d, r_from_d1,
50 r_to_d
r_to_d Correlation (r) to Standardized Mean Difference (d)
Description
Converts a correlation (r) to standardized mean difference (d).
Usage
r_to_d(r, N)
Arguments
r Correlation coefficient.
N Total sample size.
Value
d Standardized mean difference (d).
Author(s)
AC Del Re & William T. Hoyt
Maintainer: AC Del Re <[email protected]>
References
Borenstein (2009). Effect sizes for continuous data. In H. Cooper, L. V. Hedges, & J. C. Valentine(Eds.), The handbook of research synthesis and meta analysis (pp. 279-293). New York: RussellSage Foundation.
See Also
d_to_g, mean_to_d, mean_to_d2, t_to_d, f_to_d, p_to_d1, p_to_d2, ancova_to_d1, ancova_to_d2,tt.ancova_to_d, f.ancova_to_d, p.ancova_to_d1, p.ancova_to_d2, lor_to_d, prop_to_or,prop_to_d, r_from_chi, r_from_d, r_from_d1, r_from_t
tt.ancova_to_d 51
tt.ancova_to_d t-test Value from ANCOVA to Standardized Mean Difference (d)
Description
Converts a t-test value from ANCOVA to a standardized mean difference (d)
Usage
tt.ancova_to_d(t, n.1, n.2, R, q)
Arguments
t t-test value reported in primary study.
n.1 Treatment group sample size.
n.2 Comparison group sample size.
R Covariate outcome correlation or multiple correlation.
q number of covariates.
Value
d Standardized mean difference (d)
var_d Variance of d
Author(s)
AC Del Re & William T. Hoyt
Maintainer: AC Del Re <[email protected]>
References
Borenstein (2009). Effect sizes for continuous data. In H. Cooper, L. V. Hedges, & J. C. Valentine(Eds.), The handbook of research synthesis and meta analysis (pp. 279-293). New York: RussellSage Foundation.
See Also
d_to_g, mean_to_d, mean_to_d2, t_to_d, f_to_d, p_to_d1, p_to_d2, ancova_to_d1, ancova_to_d2,f.ancova_to_d, r_to_d, p.ancova_to_d1, p.ancova_to_d2, lor_to_d, prop_to_or, prop_to_d,r_from_chi, r_from_d, r_from_d1, r_from_t

52 t_to_d
t_to_d t-test Value to Standardized Mean Difference (d)
Description
Converts a t-test value reported in the primary study to a standardized mean difference (d).
Usage
t_to_d(t, n.1, n.2)
Arguments
t t-test value reported in primary study.
n.1 Sample size of treatment group.
n.2 Sample size of comparison group.
Value
d Standardized mean difference (d).
var_d Variance of d.
Author(s)
AC Del Re & William T. Hoyt
Maintainer: AC Del Re <[email protected]>
References
Borenstein (2009). Effect sizes for continuous data. In H. Cooper, L. V. Hedges, & J. C. Valentine(Eds.), The handbook of research synthesis and meta analysis (pp. 279-293). New York: RussellSage Foundation.
See Also
d_to_g, mean_to_d, mean_to_d2, f_to_d, p_to_d1, p_to_d2, ancova_to_d1, ancova_to_d2,tt.ancova_to_d, f.ancova_to_d, r_to_d, p.ancova_to_d1, p.ancova_to_d2, lor_to_d, prop_to_or,prop_to_d, r_from_chi, r_from_d, r_from_d1, r_from_t

wd 53
wd Output to Word in formatted tables
Description
Function for exporting MA output to nicely formatted Word tables.
Usage
wd(object, get = FALSE, new = FALSE, ...)
Arguments
object Will take either an omni (Omnibus), mareg (meta-regression), or macat (singlepredictor categorical moderator analysis) object and export to Word in a format-ted table.
get Start up the Word program? TRUE if an instance of Word is not currently open.
new Output data into a new Word document? TRUE or FALSE.
... Additional arguments to be passed to R2wd functions.
Details
This function depends of the R2wd package. See Christian Ritter (2010). R2wd: Write MS-Worddocuments from R. R package version 1.3 for the details of the R2wd package.
Author(s)
AC Del Re & William T. Hoyt
Maintainer: AC Del Re <[email protected]>
References
Christian Ritter (2010). R2wd: Write MS-Word documents from R. R package version 1.3.
See Also
omni, mareg, macat
Examples
# Sample dataid<-c(1:20)n.1<-c(10,20,13,22,28,12,12,36,19,12,36,75,33,121,37,14,40,16,14,20)n.2 <- c(11,22,10,20,25,12,12,36,19,11,34,75,33,120,37,14,40,16,10,21)g <- c(.68,.56,.23,.64,.49,-.04,1.49,1.33,.58,1.18,-.11,1.27,.26,.40,.49,.51,.40,.34,.42,1.16)var.g <- c(.08,.06,.03,.04,.09,.04,.009,.033,.0058,.018,.011,.027,.026,.0040,

54 wgts
.049,.0051,.040,.034,.0042,.016)mod<-factor(c(rep(c(1,1,2,3),5)))mods2<-c(rep(1:5,4))df<-data.frame(id, n.1,n.2, g, var.g,mod, mods2)
# Examples
# install R2wd# install.packages('R2wd', dependencies = TRUE)
# mareg fuctiontemp <- mareg(g~ mod + mods2, var = var.g, method = "REML", data = df)
# Export data to Word in formatted table## Not run: wd(temp, get = TRUE, new = TRUE)
wgts Weights added to Meta Data
Description
Adds weights to the meta-analysis data set.
Usage
wgts(g, var.g, data)
Arguments
g Hedges g (unbiased standardized mean difference estimate).
var.g Variance of g.
data data.frame with values above.
Value
Adds fixed and random-effects weights and confidence intervals to meta data set.
Author(s)
AC Del Re & William T. Hoyt
Maintainer: AC Del Re <[email protected]>

Index
∗Topic aggregationagg, 7
∗Topic aplotplotcat, 39plotcon, 40
∗Topic arithancova_to_d1, 10ancova_to_d2, 11d_to_g, 20f.ancova_to_d, 21f_to_d, 23fail_to_d, 22lor_to_d, 27mean_to_d, 34mean_to_d2, 35or_to_d, 36p.ancova_to_d1, 37p.ancova_to_d2, 38p_to_d1, 42p_to_d2, 43r_from_chi, 46r_from_d, 47r_from_d1, 48r_from_t, 49r_to_d, 50t_to_d, 52tt.ancova_to_d, 51
∗Topic dataatten, 12compute_dgs, 13compute_ds, 14compute_gs, 16dat.cooper15.3, 17dat.cooperA2, 17dat.hoyt, 18dat.sim.es, 18dat.sim.final, 18dat.sim.raw, 19dat.sim1, 19
dat.sim2, 19PubBias, 41wgts, 54
∗Topic modelsmacat, 28macatC, 30
∗Topic packageMAd-package, 2
∗Topic wordr2, 44wd, 53
agg, 7ancova_to_d1, 10, 11, 12, 21–23, 28, 34–38,
43, 44, 47–52ancova_to_d2, 11, 11, 12, 21–23, 28, 34–38,
43, 44, 47–52atten, 12
compute_dgs, 13, 15, 17compute_ds, 14, 14, 15, 17compute_gs, 14, 16
d_to_g, 11, 12, 20, 21–23, 28, 34–38, 43, 44,47–52
dat.cooper15.3, 17dat.cooperA2, 17dat.hoyt, 18dat.sim.es, 18dat.sim.final, 18dat.sim.raw, 19dat.sim1, 19dat.sim2, 19
f.ancova_to_d, 11, 12, 21, 22, 23, 28, 34–38,43, 44, 47–52
f_to_d, 11, 12, 21, 22, 23, 28, 34–38, 43, 44,47–52
fail_to_d, 22
icc, 24
55

56 INDEX
Kappa, 26
lor_to_d, 11, 12, 21–23, 27, 34–38, 43, 44,47–52
macat, 28, 31, 39, 53macatC, 30MAd (MAd-package), 2MAd-package, 2mareg, 32, 41, 46, 53mean_to_d, 11, 12, 21–23, 28, 34, 35–38, 43,
44, 47–52mean_to_d2, 11, 12, 21–23, 28, 34, 35, 36, 37,
43, 44, 47–52
omni, 53or_to_d, 36
p.ancova_to_d1, 11, 12, 21–23, 28, 34–36,37, 38, 43, 44, 47–52
p.ancova_to_d2, 11, 12, 21–23, 28, 34–38,38, 43, 44, 47–52
p_to_d1, 11, 12, 21–23, 28, 34–38, 42, 44,47–52
p_to_d2, 11, 12, 21–23, 28, 34–38, 43, 43,47–52
plotcat, 29, 39, 41plotcon, 33, 39, 40prop_to_d, 11, 12, 21, 23, 28, 34, 35, 37, 38,
43, 44, 47–52prop_to_or, 11, 12, 21–23, 28, 34–38, 43, 44,
47–52PubBias, 41
r2, 44r_from_chi, 11, 12, 21–23, 28, 34–38, 43, 44,
46, 47–52r_from_d, 11, 12, 21–23, 28, 34–38, 43, 44,
47, 47, 48–52r_from_d1, 11, 12, 21–23, 28, 34–38, 43, 44,
47, 48, 49–52r_from_t, 11, 12, 21–23, 28, 34–38, 43, 44,
47, 48, 49, 50–52r_to_d, 11, 12, 21–23, 28, 34–38, 43, 44,
47–49, 50, 51, 52robustSE, 45
t_to_d, 11, 12, 21–23, 28, 34–38, 43, 44,47–51, 52
tt.ancova_to_d, 11, 12, 21–23, 28, 34–38,43, 44, 47–50, 51, 52
wd, 29, 33, 53weights, 42wgts, 54