![Robust Bayesian Max-Margin Clusteringlcarin/BMMC_nips2014.pdf · Robust Bayesian Max-Margin Clustering Changyou Cheny Jun Zhuz Xinhua Zhang] yDept. of Electrical and Computer Engineering,](https://static.fdocuments.us/doc/165x107/5f10c4b27e708231d44ab96c/robust-bayesian-max-margin-clustering-lcarinbmmc-robust-bayesian-max-margin.jpg)
Package ‘erer’ - The Comprehensive R Archive Network ‘erer’ February 25, 2016 Title...
52
Package ‘erer’ February 25, 2016 Title Empirical Research in Economics with R Version 2.5 Date 2016-2-25 Author Changyou Sun <[email protected]> Maintainer Changyou Sun <[email protected]> Depends R (>= 3.0.0), lmtest Imports systemfit, tseries, urca Suggests MASS Description Functions, datasets, and sample codes related to the book of 'Empirical Research in Eco- nomics: Growing up with R' by Dr. Changyou Sun are included. Marginal effects for bi- nary or ordered choice models can be calculated. Static and dynamic Almost Ideal Demand Sys- tem (AIDS) models can be estimated. A typical event analysis in finance can be con- ducted with several functions included. License GPL (>= 2) LazyLoad yes NeedsCompilation no Repository CRAN Date/Publication 2016-02-25 23:01:12 R topics documented: erer-package ......................................... 2 aiData ............................................ 3 aiDiag ............................................ 5 aiDynFit ........................................... 6 aiElas ............................................ 9 aiStaFit ........................................... 10 aiStaHau ........................................... 12 bsFormu ........................................... 13 bsLag ............................................ 14 bsStat ............................................ 16 1
Transcript of Package ‘erer’ - The Comprehensive R Archive Network ‘erer’ February 25, 2016 Title...

Package ‘erer’February 25, 2016
Title Empirical Research in Economics with R
Version 2.5
Date 2016-2-25
Author Changyou Sun <[email protected]>
Maintainer Changyou Sun <[email protected]>
Depends R (>= 3.0.0), lmtest
Imports systemfit, tseries, urca
Suggests MASS
Description Functions, datasets, and sample codes related to the book of 'Empirical Research in Eco-nomics: Growing up with R' by Dr. Changyou Sun are included. Marginal effects for bi-nary or ordered choice models can be calculated. Static and dynamic Almost Ideal Demand Sys-tem (AIDS) models can be estimated. A typical event analysis in finance can be con-ducted with several functions included.
License GPL (>= 2)
LazyLoad yes
NeedsCompilation no
Repository CRAN
Date/Publication 2016-02-25 23:01:12
R topics documented:erer-package . . . . . . . . . . . . . . . . . . . . . . . . . . . . . . . . . . . . . . . . . 2aiData . . . . . . . . . . . . . . . . . . . . . . . . . . . . . . . . . . . . . . . . . . . . 3aiDiag . . . . . . . . . . . . . . . . . . . . . . . . . . . . . . . . . . . . . . . . . . . . 5aiDynFit . . . . . . . . . . . . . . . . . . . . . . . . . . . . . . . . . . . . . . . . . . . 6aiElas . . . . . . . . . . . . . . . . . . . . . . . . . . . . . . . . . . . . . . . . . . . . 9aiStaFit . . . . . . . . . . . . . . . . . . . . . . . . . . . . . . . . . . . . . . . . . . . 10aiStaHau . . . . . . . . . . . . . . . . . . . . . . . . . . . . . . . . . . . . . . . . . . . 12bsFormu . . . . . . . . . . . . . . . . . . . . . . . . . . . . . . . . . . . . . . . . . . . 13bsLag . . . . . . . . . . . . . . . . . . . . . . . . . . . . . . . . . . . . . . . . . . . . 14bsStat . . . . . . . . . . . . . . . . . . . . . . . . . . . . . . . . . . . . . . . . . . . . 16
1

2 erer-package
bsTab . . . . . . . . . . . . . . . . . . . . . . . . . . . . . . . . . . . . . . . . . . . . 17daBed . . . . . . . . . . . . . . . . . . . . . . . . . . . . . . . . . . . . . . . . . . . . 19daBedRaw . . . . . . . . . . . . . . . . . . . . . . . . . . . . . . . . . . . . . . . . . . 20daEsa . . . . . . . . . . . . . . . . . . . . . . . . . . . . . . . . . . . . . . . . . . . . 22daExp . . . . . . . . . . . . . . . . . . . . . . . . . . . . . . . . . . . . . . . . . . . . 23daIns . . . . . . . . . . . . . . . . . . . . . . . . . . . . . . . . . . . . . . . . . . . . . 24daInsNam . . . . . . . . . . . . . . . . . . . . . . . . . . . . . . . . . . . . . . . . . . 26daLaw . . . . . . . . . . . . . . . . . . . . . . . . . . . . . . . . . . . . . . . . . . . . 27daPe . . . . . . . . . . . . . . . . . . . . . . . . . . . . . . . . . . . . . . . . . . . . . 28daRoll . . . . . . . . . . . . . . . . . . . . . . . . . . . . . . . . . . . . . . . . . . . . 29download.lib . . . . . . . . . . . . . . . . . . . . . . . . . . . . . . . . . . . . . . . . 30evReturn . . . . . . . . . . . . . . . . . . . . . . . . . . . . . . . . . . . . . . . . . . . 31evRisk . . . . . . . . . . . . . . . . . . . . . . . . . . . . . . . . . . . . . . . . . . . . 34head . . . . . . . . . . . . . . . . . . . . . . . . . . . . . . . . . . . . . . . . . . . . . 35listn . . . . . . . . . . . . . . . . . . . . . . . . . . . . . . . . . . . . . . . . . . . . . 36lss . . . . . . . . . . . . . . . . . . . . . . . . . . . . . . . . . . . . . . . . . . . . . . 37maBina . . . . . . . . . . . . . . . . . . . . . . . . . . . . . . . . . . . . . . . . . . . 38maTrend . . . . . . . . . . . . . . . . . . . . . . . . . . . . . . . . . . . . . . . . . . . 40ocME . . . . . . . . . . . . . . . . . . . . . . . . . . . . . . . . . . . . . . . . . . . . 41ocProb . . . . . . . . . . . . . . . . . . . . . . . . . . . . . . . . . . . . . . . . . . . . 43summary.aiFit . . . . . . . . . . . . . . . . . . . . . . . . . . . . . . . . . . . . . . . . 45systemfitAR . . . . . . . . . . . . . . . . . . . . . . . . . . . . . . . . . . . . . . . . . 46ur.df2 . . . . . . . . . . . . . . . . . . . . . . . . . . . . . . . . . . . . . . . . . . . . 48write.list . . . . . . . . . . . . . . . . . . . . . . . . . . . . . . . . . . . . . . . . . . . 49
Index 51
erer-package Empirical Research in Economics with R
Description
Functions, datasets, and sample codes related to the book of ’Empirical Research in Economics:Growing up with R’ by Dr. Changyou Sun are included. Marginal effects for binary or orderedchoice models can be calculated. Static and dynamic Almost Ideal Demand System (AIDS) modelscan be estimated. A typical event analysis in finance can be conducted with several functionsincluded.
Close to 100 sample programs and data sets are used in the book. They are included in the packagefolder on your local drive, e.g., c:/.../R-3.2.2/library/erer/doc/. Alternatively, download the tar.gzversion of this package from the CRAN site to view them.
The ISBN of the book is 9780996585408. The book is available at http://www.amazon.com. Apreview of the book and some supplementary materials are available at http://csun.cfr.msstate.edu.

aiData 3
Details
Package: ererType: PackageVersion: 2.5Date: 2016-2-25Depends: R (>= 3.0.0), lmtestImports: systemfit, tseries, urcaSuggests: MASSLicense: GPL (>= 2)LazyLoad: yes
Author(s)
Changyou Sun (<[email protected]>)
aiData Transforming Raw Data for Static AIDS Model
Description
This function transforms import values and quantities into a data format that are needed for a staticAIDS model.
Usage
aiData(x, label, label.tot = "WD", prefix.value = "v",prefix.quant = "q", start = NULL, end = NULL, stone = TRUE,dummy = NULL, season = c("none", "m", "q"), ...)
Arguments
x raw time series data such as daBedRaw.
label names of supplying countries; this can be as long as needed.
label.tot names of the world total (default label is "WD").
prefix.value prefix for value variables.
prefix.quant prefix for quantity varibles.
start start date for the transformed time series; this can be used to select a smallerwindow; the default is the start date of the raw data x.
end end date for the transformed time series.

4 aiData
stone whether the Stond Price Index is constructed (default TRUE); if FALSE, theversion of log-linear analog to the Paasche index with lagged budget shares inMoschini (1995) is used. See references for detail.
dummy adding dummy variables if date ranges are provided as a list.
season adding seasonality variables or not; if yes, either monthly dummy or quarterlydummy; this is prepared mainly for monthly data.
... additional arguments to be passed.
Details
This transforms raw import data into a format needed for a static AIDS model. This separationof data prepraration from model fitting allows greater flexibility in using aiStaFit in estimating astatic AIDS model. In addition, when the raw data contain zero, a small number is substituted toavoid NA when the price variable (value/quantity) is calculated. The values for the residual supplierwill change when the label is different.
Value
Return a list object with two components:
out a time series object ready for static AIDS models.
share a time series object of the share data.
price a time series object of the price data.
quantity a time series object of the quantity data.
value a time series object of the value data.
m a vector of the total expenditure.
call a record of the system call; this allows update.default to be used.
Methods
One method is defined as follows:
print: print the first several observations of the final data needed for the AIDS model.
Author(s)
Changyou Sun (<[email protected]>)
References
Moschini, G. 1995. Units of measurement and the Stone index in demand system estimation. Amer-ican Journal of Agricultural Economics 77(1):63-68.
Singh, K., M.M. Dey, and G. Thapa. 2011. An error corrected almost ideal demand system for crus-taceans in the United States. Journal of International Food & Agribusiness Marketing 23(3):271-284.
Wan, Y., C. Sun, and D.L. Grebner. 2010. Analysis of import demand for wooden beds in theUnited States. Journal of Agricultural and Applied Economics 42(4):643-658.

aiDiag 5
See Also
aiStaFit; daBedRaw; daBed.
Examples
data(daBedRaw)dumm <- list(dum1 = c(2003, 10, 2003, 10), dum2 = c(2004, 7, 2004, 7),
dum3 = c(2005, 1, 2005, 1))imp8 <- aiData(x = daBedRaw,
label = c("CN", "VN", "ID", "MY", "CA", "BR", "IT"),label.tot = "WD", prefix.value = "v", prefix.quant = "q",start = c(2001, 1), end = c(2008, 12), dummy = dumm)
imp4 <- update(imp8, label = c("CN", "VN", "ID"))imp5 <- update(imp4, label = c("CN", "VN", "ID", "MY"))imp8; imp4; imp5daTest <- imp8$outcolnames(daTest)[18:20] <- c("dum1", "dum2", "dum3")head(daTest)
data(daBed)head(daTest); head(daBed)identical(daBed, daTest)
aiDiag Diagnostic Statitics for Static or Dynamic AIDS Model
Description
Report a set of diagnostic statistics for static or dynamic AIDS models
Usage
aiDiag(x, digits = 3, ...)
Arguments
x an object of class aiFit from the function of aiStaFit or aiDynFit.
digits number of digits used in rounding outputs.
... additional arguments to be passed.
Details
Compute several diagnostic statistics for each equation in a AIDS model. Tests includes are BG,BP, RESET, and JB. See the reference paper for detail.
Value
Return a data frame object with the statistics and p values for the four tests by equation.

6 aiDynFit
Author(s)
Changyou Sun (<[email protected]>)
References
Wan, Y., C. Sun, and D.L. Grebner. 2010. Analysis of import demand for wooden beds in theUnited States. Journal of Agricultural and Applied Economics 42(4):643-658.
See Also
aiStaFit; aiDynFit.
Examples
# see the examples for 'aiDynFit'.
aiDynFit Fitting a Dynamic AIDS Model
Description
Estimate a dynamic AIDS model for a system.
Usage
aiDynFit(w, dum.dif = FALSE, AR1 = FALSE,rho.sel = c("all", "mean"), ...)
Arguments
w a object of class aiStaFit.
dum.dif a logical value (default of FALSE) of whether to take a difference on the dummyvariables passed from w.
AR1 whether first-degree autocorrelation should be corrected.
rho.sel if AR1 = TRUE, there are two ways of computing the autocorrelation coefficient.
... additional arguments to be passed.
Details
This estimates a dynamic AIDS model. The residuals from the statis AIDS model are included.As it is programmed now, only one lag is allowed for the share variables on the right-hand side.Autocorrelation in the residuals can be corrected following the treatment in Berndt (1975).

aiDynFit 7
Value
Return a list object of class "aiFit" and "aiDynFit" with the following components:
w a object of class aiStaFit.
y data for fitting the static AIDS model, passed down by w.
dum.dif a logical value (default of FALSE) of whether to take a difference on the dummyvariables passed from w.
daDyn data for fitting the dynamic AIDS model.
share names of shares by commodity, used as depedent variables.
price names of prices by commodity, used as independent variables.
expen names of expenditure variable.
shift names of the shifters.
omit names of the omitted share variable.
nOmit position of the omitted share variable in the name of share variable.
hom a logical value of homogeneity test.
sym a logical value of symmetry test.
nShare number of share variables.
nExoge number of exogenous variables (lagged share, residual, expenditure, and shifters).
nParam number of parameters in one equation.
nTotal number of parameters in the whole system estimated.
formula formula for estimating the system.
res.matrix restriction matrix for hom or sym, or both.
res.rhs right-hand values for tests of hom or sym, or both.
est the dynamic AIDS model estimated.
Methods
One method is defined as follows:
print: print the first several observations of the final data.
Author(s)
Changyou Sun (<[email protected]>)
References
Berndt, E.R., and N.E. Savin. 1975. Estimation and hypothesis testing in singular equation systemswith autoregressive disturbances. Econometrica 43(5/6):937-957.
Wan, Y., C. Sun, and D.L. Grebner. 2010. Analysis of import demand for wooden beds in theUnited States. Journal of Agricultural and Applied Economics 42(4):643-658.

8 aiDynFit
See Also
systemfitAR; aiStaFit; aiDiag; aiElas; summary.aiFit.
Examples
# --- Step 1: Read datadata(daExp, daBedRaw, daBed)
# --- Step 2: Hausman Test# 2.1 Getting started with a static AIDS modelsh <- c("sCN", "sVN", "sID", "sMY", "sCA", "sBR", "sIT", "sRW")pr <- c("lnpCN", "lnpVN", "lnpID", "lnpMY",
"lnpCA", "lnpBR", "lnpIT", "lnpRW")du3 <- c("dum1","dum2","dum3")rSta <- aiStaFit(y = daBed, share = sh, price = pr, shift = du3,
expen = "rte", omit = "sRW", hom = TRUE, sym = TRUE)summary(rSta)
# The following steps should work. It takes about 20 seconds.## Not run:# 2.2 The final Hausman test and new data(dg <- daExp[, "dg"])rHau <- aiStaHau(x = rSta, instr = dg, choice = FALSE)names(rHau); colnames(rHau$daHau); colnames(rHau$daFit); rHautwo.exp <- rHau$daFit[, c("rte", "rte.fit")]bsStat(two.exp, digits = 4)plot(data.frame(two.exp)); abline(a = 0, b = 1)daBedFit <- rHau$daFit
# --- Step 3: Static and dynamic AIDS models# 3.1 Diagnostics and coefficientshSta <- update(rSta, y = daBedFit, expen = "rte.fit")hSta2 <- update(hSta, hom = FALSE, sym = FALSE)hSta3 <- update(hSta, hom = FALSE, sym = TRUE)hSta4 <- update(hSta, hom = TRUE, sym = FALSE)lrtest(hSta2$est, hSta$est)lrtest(hSta2$est, hSta3$est)lrtest(hSta2$est, hSta4$est)
hDyn <- aiDynFit(hSta)hDyn2 <- aiDynFit(hSta2); lrtest(hDyn2$est, hDyn$est)hDyn3 <- aiDynFit(hSta3); lrtest(hDyn2$est, hDyn3$est)hDyn4 <- aiDynFit(hSta4); lrtest(hDyn2$est, hDyn4$est)
(table.2 <- rbind(aiDiag(hSta), aiDiag(hDyn)))(table.3 <- summary(hSta))(table.4 <- summary(hDyn))
# 3.2 Elasticity calculationes <- aiElas(hSta); esm <- es$marshed <- aiElas(hDyn); edm <- ed$marsh
aiElas 9
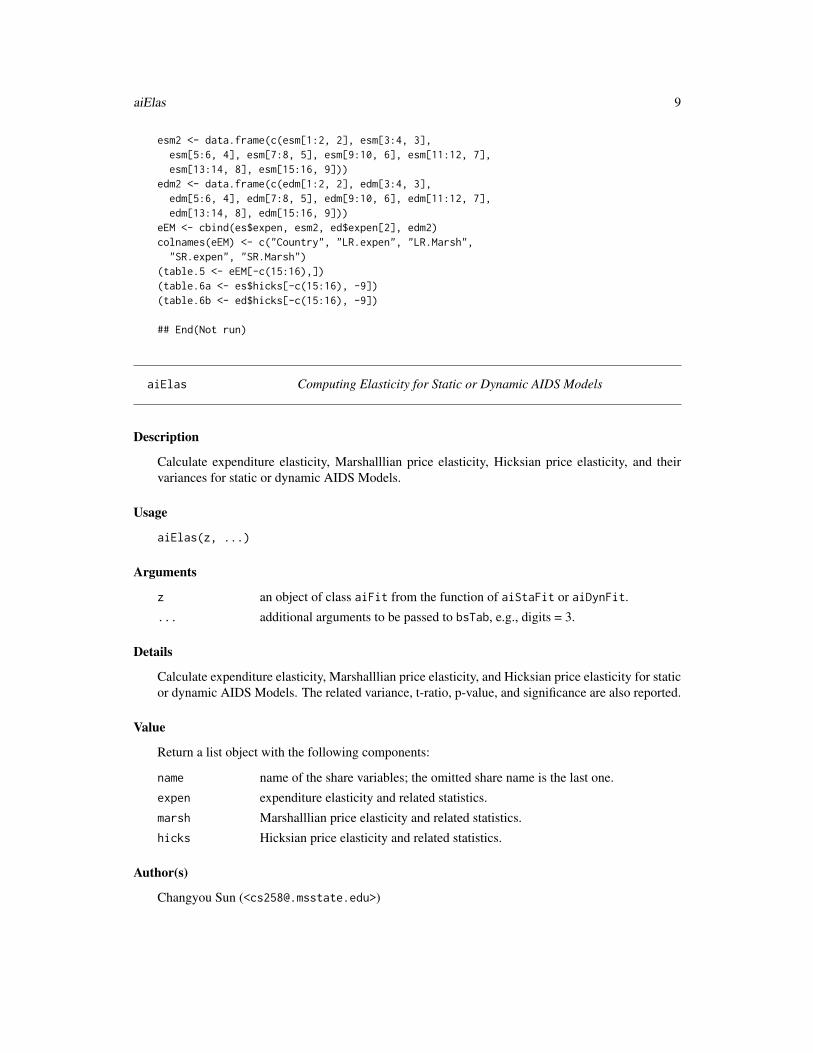
esm2 <- data.frame(c(esm[1:2, 2], esm[3:4, 3],esm[5:6, 4], esm[7:8, 5], esm[9:10, 6], esm[11:12, 7],esm[13:14, 8], esm[15:16, 9]))
edm2 <- data.frame(c(edm[1:2, 2], edm[3:4, 3],edm[5:6, 4], edm[7:8, 5], edm[9:10, 6], edm[11:12, 7],edm[13:14, 8], edm[15:16, 9]))
eEM <- cbind(es$expen, esm2, ed$expen[2], edm2)colnames(eEM) <- c("Country", "LR.expen", "LR.Marsh",
"SR.expen", "SR.Marsh")(table.5 <- eEM[-c(15:16),])(table.6a <- es$hicks[-c(15:16), -9])(table.6b <- ed$hicks[-c(15:16), -9])
## End(Not run)
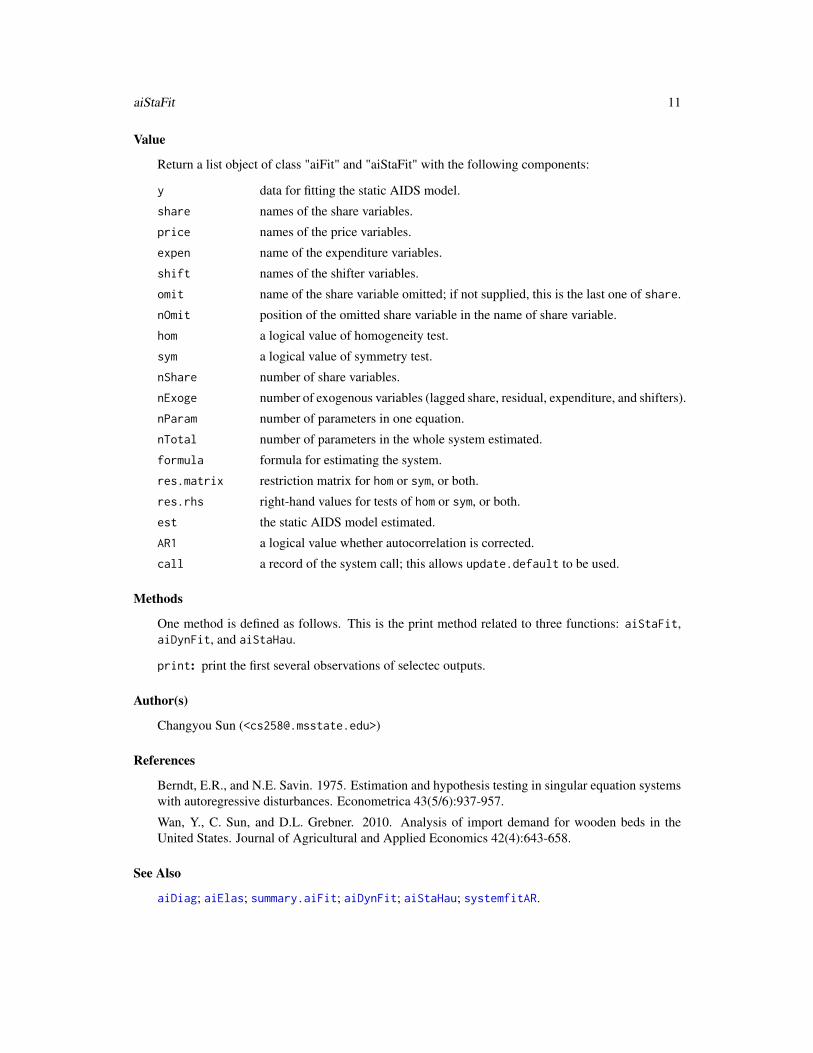
aiElas Computing Elasticity for Static or Dynamic AIDS Models
Description
Calculate expenditure elasticity, Marshalllian price elasticity, Hicksian price elasticity, and theirvariances for static or dynamic AIDS Models.
Usage
aiElas(z, ...)
Arguments
z an object of class aiFit from the function of aiStaFit or aiDynFit.
... additional arguments to be passed to bsTab, e.g., digits = 3.
Details
Calculate expenditure elasticity, Marshalllian price elasticity, and Hicksian price elasticity for staticor dynamic AIDS Models. The related variance, t-ratio, p-value, and significance are also reported.
Value
Return a list object with the following components:
name name of the share variables; the omitted share name is the last one.
expen expenditure elasticity and related statistics.
marsh Marshalllian price elasticity and related statistics.
hicks Hicksian price elasticity and related statistics.
Author(s)
Changyou Sun (<[email protected]>)

10 aiStaFit
References
Wan, Y., C. Sun, and D.L. Grebner. 2010. Analysis of import demand for wooden beds in theUnited States. Journal of Agricultural and Applied Economics 42(4):643-658.
See Also
aiStaFit; aiDynFit.
Examples
# see the examples for 'aiDynFit'.
aiStaFit Fitting a Static AIDS Model
Description
Estimate a static AIDS model for a system.
Usage
aiStaFit(y, share, price, expen, shift = NULL, omit = NULL,hom = TRUE, sym = TRUE, AR1 = FALSE, rho.sel = c("all", "mean"), ...)
Arguments
y a multiple time series data.
share names of the share variables.
price names of the price variables.
expen name of the expenditure variables.
shift names of the shifter variables.
omit name of the share variable omitted; if not supplied, this is the last one of share.
hom a logical value of homogeneity test.
sym a logical value of symmetry test.
AR1 whether first-degree autocorrelation should be corrected.
rho.sel if AR1 = TRUE, there are two ways of computing the autocorrelation coefficient.
... additional arguments to be passed.
Details
This estimates a static AIDS model. The data supplied should be in the final format. Autocorrelationin the residuals can be corrected following the treatment in Berndt (1975).
aiStaFit 11
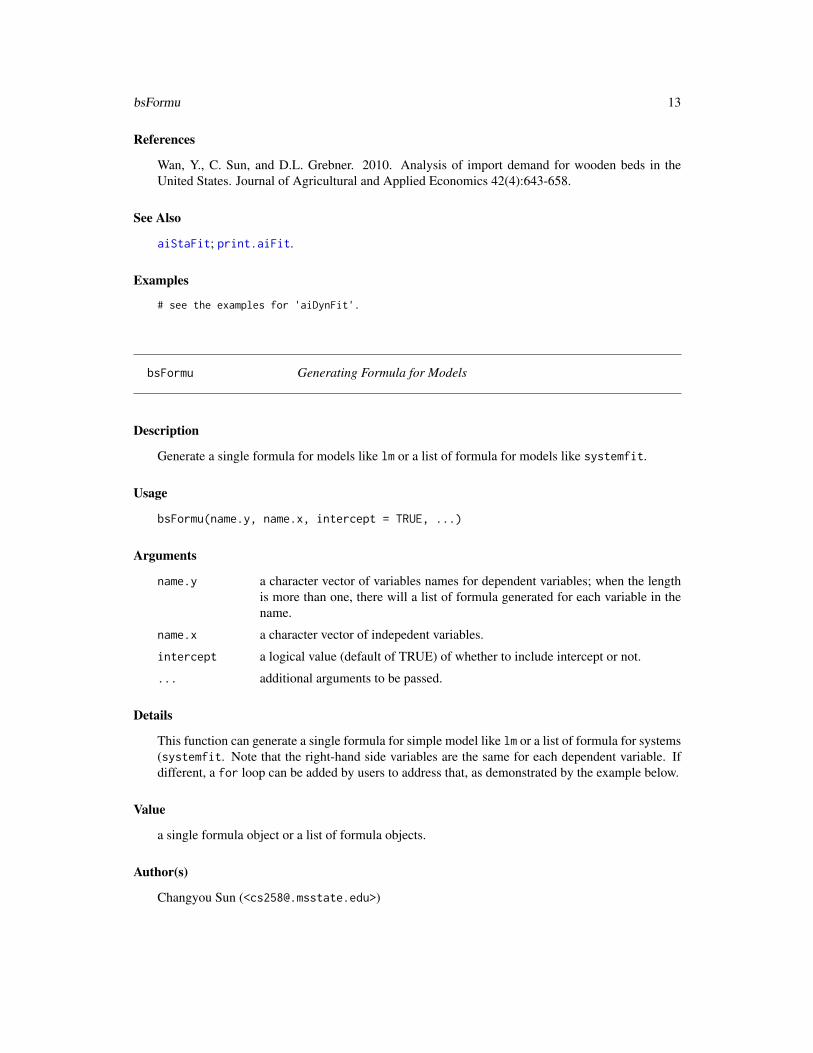
Value
Return a list object of class "aiFit" and "aiStaFit" with the following components:
y data for fitting the static AIDS model.
share names of the share variables.
price names of the price variables.
expen name of the expenditure variables.
shift names of the shifter variables.
omit name of the share variable omitted; if not supplied, this is the last one of share.
nOmit position of the omitted share variable in the name of share variable.
hom a logical value of homogeneity test.
sym a logical value of symmetry test.
nShare number of share variables.
nExoge number of exogenous variables (lagged share, residual, expenditure, and shifters).
nParam number of parameters in one equation.
nTotal number of parameters in the whole system estimated.
formula formula for estimating the system.
res.matrix restriction matrix for hom or sym, or both.
res.rhs right-hand values for tests of hom or sym, or both.
est the static AIDS model estimated.
AR1 a logical value whether autocorrelation is corrected.
call a record of the system call; this allows update.default to be used.
Methods
One method is defined as follows. This is the print method related to three functions: aiStaFit,aiDynFit, and aiStaHau.
print: print the first several observations of selectec outputs.
Author(s)
Changyou Sun (<[email protected]>)
References
Berndt, E.R., and N.E. Savin. 1975. Estimation and hypothesis testing in singular equation systemswith autoregressive disturbances. Econometrica 43(5/6):937-957.
Wan, Y., C. Sun, and D.L. Grebner. 2010. Analysis of import demand for wooden beds in theUnited States. Journal of Agricultural and Applied Economics 42(4):643-658.
See Also
aiDiag; aiElas; summary.aiFit; aiDynFit; aiStaHau; systemfitAR.

12 aiStaHau
Examples
# see the examples for 'aiDynFit'.
aiStaHau Conducting a Hausman Test on a Static AIDS Model
Description
Conduct a Hausman test on a static AIDS model and report the result of likelihood ratio test.
Usage
aiStaHau(x, instr, choice = FALSE, ...)
Arguments
x an object of class aiStaFit from a static AIDS model.
instr a single time series data as instrument for the expenditure variable in AIDSmodel.
choice a logical value of whether to take a difference on the right-hand price and instrvariables.
... additional arguments to be passed.
Details
Conduct a Hausman test on a static AIDS model and report the result of likelihood ratio test. Notethat logarithm is taken on every variable in the auxiliary regression. These variables are the realtotal expenditure and its lagged value, instrumental variable, and the price variables.
Value
Return a data frame object with the statistics and p values for the four tests by equation.
daHau data used in estimating the Hausman test.
formuHau formula for estimating the Hausman test.
regHau regression for the Hausman test.
daFit revised data with the fitted value of expenditure included.
aiBase the base static AIDs model estimated.
aiHaus the reestimated static AIDS model using the fitted value of expenditure.
ratio result of the likelihood ration test for the Hausman test.
Author(s)
Changyou Sun (<[email protected]>)
bsFormu 13
References
Wan, Y., C. Sun, and D.L. Grebner. 2010. Analysis of import demand for wooden beds in theUnited States. Journal of Agricultural and Applied Economics 42(4):643-658.
See Also
aiStaFit; print.aiFit.
Examples
# see the examples for 'aiDynFit'.
bsFormu Generating Formula for Models
Description
Generate a single formula for models like lm or a list of formula for models like systemfit.
Usage
bsFormu(name.y, name.x, intercept = TRUE, ...)
Arguments
name.y a character vector of variables names for dependent variables; when the lengthis more than one, there will a list of formula generated for each variable in thename.
name.x a character vector of indepedent variables.
intercept a logical value (default of TRUE) of whether to include intercept or not.
... additional arguments to be passed.
Details
This function can generate a single formula for simple model like lm or a list of formula for systems(systemfit. Note that the right-hand side variables are the same for each dependent variable. Ifdifferent, a for loop can be added by users to address that, as demonstrated by the example below.
Value
a single formula object or a list of formula objects.
Author(s)
Changyou Sun (<[email protected]>)
14 bsLag
Examples
# fake datay <- c("y")ym <- c("y1", "y2", "y3")x <- c("x")xAll <- c("x", "xx", "xxx", "xxxx")
bsFormu(name.y = y, name.x = x)bsFormu(name.y = ym, name.x = xAll)fm.ym <- bsFormu(name.y = ym, name.x = xAll, intercept = FALSE)fm.ym
# If independent variables differ by equation,# add a loop to address the differentiation.xInd <- c("x1", "x2", "x3")fm.ym <- list()for (i in 1:length(ym)) {
ny <- ym[i]nx <- c(xInd[i], xAll)fm.ym[[i]] <- bsFormu(name.y = ny, name.x = nx, intercept = FALSE)
}fm.ym
# real datadata(daIns)(xx <- colnames(daIns)[-c(1, 14)])fm.ins <- bsFormu(name.y = "Y", name.x = xx, intercept = TRUE)fm.ins(ra <- glm(formula = fm.ins,
family = binomial(link="logit"),data = daIns, x = TRUE))
bsLag Lagged Time Series
Description
Generate a set of lagged time series for time series data.
Usage
bsLag(h, lag, prefix = "", var.name, suffix = ".t_",include.orig = TRUE, by.lag = FALSE, ...)
Arguments
h time series data
lag number of lags

bsLag 15
prefix prefix for the name of lagged time series.
var.name varible name of the lagged time series.
suffix suffix of the name of lagged time series.
include.orig logical value (default of TRUE) of whether to include the original series (i.e.,lag zero) in the final output.
by.lag logical value (default of FALSE) of whether to order the column by variable(FALSE) or by lag (TRUE).
... additional arguments to be passed.
Details
The input data can be a single time series or a set of multiple time series data. The output is a setof lagged time series with the specified lag dimension. All the series are aligned with the shortestwindow so the loss of observations is equal to lag. The original series (e.g., without lag but just lossof beginning observations) can be included or excluded by setting the logical value of include.org.
The name of the output data is composed of four parts: prefix, var.name, suffix, and an indexnumber of lag. Users can control the first three parts only because the lag number is added au-tomatically. prefix and suffix can be fixed for all the output series. var.name provides someflexibility when bsLag is used within a function and the variable name is unknown a priori.
The column of the output can be ordered either by the variable name (e.g., diff.GA.t_0, diff.GA.t_1,diff.ND.t_0, diff.ND.t_1), or by the lag order ((e.g., diff.GA.t_0, diff.ND.t_0, diff.GA.t_1, diff.ND.t_1).
Value
Return a multiple time series object.
Author(s)
Changyou Sun (<[email protected]>)
Examples
# simple exampleh1 <- ts(data=cbind(1:24), start=c(2001, 1), frequency=12)h2 <- ts(data=cbind(1:24, 25:48), start=c(2001, 1), frequency=12)h3 <- ts(data=cbind(1:4, 5:8, 9:12), start=c(2001, 1), frequency=4)colnames(h2) <- c("aa", "bb")colnames(h3) <- c("cc", "dd", "ee")h1; h2; h3
bsLag(h=h1, lag=0, prefix="", suffix=".t_")bsLag(h=h1, lag=2, prefix="price.", var.name="fl", suffix=".t_")bsLag(h=h1, lag=2, prefix="price.", var.name="fl", suffix=".t_", by.lag=TRUE)bsLag(h=h1, lag=23, prefix="price.", suffix=".t_", include.orig=FALSE)
bsLag(h=h2, lag=4, prefix="", suffix=".t_", include.orig = TRUE)bsLag(h=h2, lag=4, prefix="", suffix=".t_", include.orig = FALSE)bsLag(h=h2, lag=4, prefix="", suffix=".t_", include.orig = FALSE, by.lag=TRUE)bsLag(h=h2, lag=0, prefix="", var.name=c("nc", "sc"), suffix=".t_")
16 bsStat
bsLag(h=h3, lag=2, prefix="", suffix=".t_", include.orig=FALSE)bsLag(h=h3, lag=1, prefix="", var.name=c("nd", "sd", "mi"), suffix=".lag.")bsLag(h=h3, lag=2, prefix="NY.", suffix=".t_", by.lag=TRUE)bsLag(h=h3, lag=3, prefix="NY.", suffix=".t_", include.orig=FALSE)
# with real datadata(daBedRaw)small <- daBedRaw[, c("vCN", "qCN")](lag.small <- bsLag(h=small, lag=4))colnames(lag.small)
resid <- residuals(lm(qCN ~ vCN, data = small))res <- ts(resid, start=start(small), end=end(small),
frequency=tsp(small)[3])lag.res <- bsLag(h=res, lag=2, prefix="resid.", var.name="china")str(lag.res)head(lag.res)tail(lag.res)
bsStat Summary of Basic Statistics
Description
Calcluate basic statistics of data.
Usage
bsStat(y, two = NULL, digits = c(2, 2), use = 'complete.obs',na.rm = TRUE, ...)
Arguments
y input data for summary statistics.
two a logical value of whether to report the correlation and summary statistics sepa-rately; if NULL and the number of variables is less than 11, its value will be setto TRUE.
digits digits for the output data, one for correlation coefficients and the other for meanand others; if a single scalar is supplied, it will be used for both.
use an argument for correlation coefficient; see cor for detail.
na.rm an argument for mean, sd, min, and max.
... additional arguments to be passed.
bsTab 17
Details
Two set of summary statistics are generated. One is correlation coefficients and the other is mean,minimum, maximum, standard deviation, and number of observations. When two is unspecifiedand the number of variables is bigger than ten, the two sets are reported separately; otherwise, it isreported as a single data frame object.
Value
A dataframe or list of the summary statistics.
Author(s)
Changyou Sun (<[email protected]>)
Examples
data(daIns)(sum.daIns <- bsStat(y=daIns, digits=c(3,2)))
bsTab Generating Pretty Statistical Tables
Description
Format statistics from regressions into pretty outputs
Usage
bsTab(w,need = c("1T", "1E", "2T", "2E", "3T", "3E", "4T", "4E", "5"),wrap.TE = c("(", "", "["),add.sig = c("coef", "TE"),percent = c(0.01, 0.05, 0.10),symbol = c("***", "**", "*", ""),digits = c(3, 3, 3, 2), ... )
Arguments
w statistical results from regression models; an object of class glm, lm, and systemfitcan be supplied directly, or a data frame with at least four columns with the se-quence of estimates, errors, t-values, and p-values.
need a choice of output formats; default of 1T is one column with t ratio and signif-icance symbols; 1 to 5 is the number of columns; T is t ratios; E is standarderrors. This argument must be a character string.
wrap.TE parentheses, none, or brackets can be used to enclose t ratios or standard errors;default value is parenthses for one-column format and none for other formats.

18 bsTab
add.sig a chacter string to indicate where to add the significance symbol, either to thecoefficents ("coef") or the t-value and error ("TE").
percent percentage values used to categorize p values.
symbol symbols used to represent p-value categories; the default values can be changedto symbols like a, b, c, or different combinations of *.
digits digits for outputs; the default values are 3, 3, 3, and 2 for estimate, error, t value,and p value, correspondingly. A single value like 4 can be supplied and it willbe recycled for all of them.
... additional arguments to be passed.
Details
Format statistics from regressions into tables that are often reported in economic journals. Thecolumn of ’Variable’ in the outuput is the row names of the input data so the raw data shouldcontain meaningful rownames. Besides the variable name column, the maximum number of outputis five columns: estimate, error, t ratio, p value, and significance. wrap.TE and add.sig are onlyvalid for column widths of 1 and 2.
Value
A dataframe of statistical results.
Author(s)
Changyou Sun (<[email protected]>)
Examples
# a simulated datates <- data.frame(est = c(4, 56, 12), err = c(0.3, 0.56, 0.789),
t.rat = c(2.56, 7.9, 1.2), p.val = c(0.002, 0.23, 0.061))tesbsTab(tes)bsTab(w = tes, need = "2E")
# real datadata(daIns)ra <- glm(formula = Y ~ Injury + HuntYrs + Nonres +
Lspman + Lnong + Gender + Age +Race + Marital + Edu + Inc + TownPop,
family = binomial(link="logit"),data = daIns, x = TRUE)
(ca <- data.frame(summary(ra)$coefficients))
# an object of class 'glm' as inputbsTab(w = ra, add.sig = "TE")bsTab(w = ra, wrap.TE = "[")bsTab(w = ra, need = "5")bsTab(w = ra, need = "4T", wrap.TE = "[")

daBed 19
final <- bsTab(w = ra, need = "3T",percent = c(0.01, 0.05, 0.10),symbol = c("a", "b", "c", ""), digits = 4)
finalprint(final, right = FALSE)
# any matrix with at least four columns can be suppliedcbind(bsTab(ca), bsTab(ra))
daBed Transformed Wooden Beds Import Data for Static AIDS Models
Description
This data set contains transformed values related to wooden beds imports by the United States fromJanuary 2001 to December 2008. There are 96 observations and 20 variables.
sCN monthly import share of wooden beds from ChinasVN monthly import share of wooden beds from VietnamsID monthly import share of wooden beds from IndonesiasMY monthly import share of wooden beds from MalaysiasCA monthly import share of wooden beds from CanadasBR monthly import share of wooden beds from BrazilsIT monthly import share of wooden beds from ItalysRW monthly import share of wooden beds from the rest of worldrte real total expenditure in logarithmlnpCN monthly import price of wooden beds from China in logarithminpVN monthly import price of wooden beds from Vietnam in logarithmlnpID monthly import price of wooden beds from Indonesia in logarithmlnpMY monthly import price of wooden beds from Malaysia in logarithmlnpCA monthly import price of wooden beds from Canada in logarithminpBR monthly import price of wooden beds from Brazil in logarithmlnpIT monthly import price of wooden beds from Italy in logarithmlnpRW monthly import price of wooden beds from the rest of world in logarithmdum1 a pulse dummy variable (1 for October 2003, 0 otherwise)dum2 a pulse dummy variable (1 for July 2004, 0 otherwise)dum3 a pulse dummy variable (1 for January 2005, 0 otherwise)
Usage
data(daBed)
Format
Monthly time series from Janurary 2001 to December 2008 with 96 observations for each of the 20variables.

20 daBedRaw
Details
This is the transformated data set for static AIDS model. The transformation detail is described inWan et al. (2010).
Source
U.S. ITC, 2010. Interactive tariff and trade data web. US International Trade Commission (As-secced on March 1, 2010).
References
Wan, Y., C. Sun, and D.L. Grebner. 2010. Analysis of import demand for wooden beds in theUnited States. Journal of Agricultural and Applied Economics 42(4):643-658.
See Also
aiStaFit; daBedRaw.
Examples
data(daBed)class(daBed); dim(daBed); colnames(daBed)daBed
daBedRaw Wooden Beds Import Data
Description
This data set contains a mulitiple time series related to wooden beds imports by the United States.The time covered is January 1996 to December 2008 with 156 observations. There are 34 variablesin total: 17 import values (dollars) and 17 import quantities (dollars / piece). In total, 16 countriesare covered and the world total is also reported.
vBR cost-insurance-freight import values in dollar from BrazilvCA cost-insurance-freight import values in dollar from CanadavCN cost-insurance-freight import values in dollar from ChinavDK cost-insurance-freight import values in dollar from DenmarkvFR cost-insurance-freight import values in dollar from FrancevHK cost-insurance-freight import values in dollar from Hong KongvIA cost-insurance-freight import values in dollar from IndiavID cost-insurance-freight import values in dollar from IndonesiavIT cost-insurance-freight import values in dollar from ItalyvMY cost-insurance-freight import values in dollar from MalaysiavMX cost-insurance-freight import values in dollar from MexicovPH cost-insurance-freight import values in dollar from PhilippinesvTW cost-insurance-freight import values in dollar from Taiwan
daBedRaw 21
vTH cost-insurance-freight import values in dollar from ThailandvUK cost-insurance-freight import values in dollar from United KingdomvVN cost-insurance-freight import values in dollar from VietnamvWD cost-insurance-freight import values in dollar from World in totalqBR quantity in piece from BrazilqCA quantity in piece from CanadaqCN quantity in piece from ChinaqDK quantity in piece from DenmarkqFR quantity in piece from FranceqHK quantity in piece from Hong KongqIA quantity in piece from IndiaqID quantity in piece from IndonesiaqIT quantity in piece from ItalyqMY quantity in piece from MalaysiaqMX quantity in piece from MexicoqPH quantity in piece from PhilippinesqTW quantity in piece from TaiwanqTH quantity in piece from ThailandqUK quantity in piece from United KingdomqVN quantity in piece from VietnamqWD quantity in piece from World in total
Usage
data(daBedRaw)
Format
Monthly time series from Janurary 1996 to December 2008 with 156 observations for each of the34 variables.
Details
Under the Harmonized Tariff Schedule (HTS) system, the commodity of wooden beds is classifiedas HTS 9403.50.9040. The monthly cost-insurance-freight values in dollar and quantities in pieceare reported by country from U.S. ITC (2010).
Source
U.S. ITC, 2010. Interactive tariff and trade data web. US International Trade Commission (As-secced on March 1, 2010).
References
Wan, Y., C. Sun, and D.L. Grebner. 2010. Analysis of import demand for wooden beds in theUnited States. Journal of Agricultural and Applied Economics 42(4):643-658.

22 daEsa
See Also
aiStaFit; daBed.
Examples
data(daBedRaw)class(daBedRaw); dim(daBedRaw); colnames(daBedRaw)
daEsa Daily returns of 14 public firms from 1990 to 2004
Description
This data set contains daily returns of 14 public firms, three-month treasury bill, and SP 500 Indexfrom 1990 to 2004.
date Eight-digit numbers for date of 1990-2004; the format is YYMMDD, e.g., 19900102 for Jan 2, 1990tb3m Daily returns for three-month treasury billssp500 Daily returns for SP 500 Indexbcc Daily returns for Boise Cascadebow Daily returns for Bowatercsk Daily returns for Chesapeake Corp VAgp Daily returns for Georgia-Pacificip Daily returns for International Paperkmb Daily returns for Kimberly Clarklpx Daily returns for Louisiana Pacificmwv Daily returns for MeadWestvacopch Daily returns for Potlatchpcl Daily returns for Plum Creekpop Daily returns for Pope and Talbottin Daily returns for Temple Inlandwpp Daily returns for Wausau Mosinee Paperwy Daily returns for Weyerhaeuser
Usage
data(daEsa)
Format
A data frame object with daily returns for firms or indexes from 1994 to 2004. There are 17 columnsand 3747 rows. The date is not regular because there is no trading on weekends and holidays.Therefore, the date is represented by a number, not a date.

daExp 23
Details
This is the transformated data set used in the study of Sun and Liao (2011).
Source
The daily returns for SP 500 and individual firms are from the database of the Center for Researchin Security Prices (CRSP). The risk-free rate of return is the secondary market rate for the 3-monthUS Treasury bills from the Federal Reserve Bank.
References
Sun, C., and X. Liao. 2011. Effects of litigation under the Endangered Species Act on forest firmvalues. Journal of Forest Economics 17(4):388-398.
See Also
evReturn; evRisk.
Examples
data(daEsa)dim(daEsa); colnames(daEsa)head(daEsa); tail(daEsa)str(daEsa)
# if dates are stored as a date object in R, then it can be converted into# numbers as the following example shows.
raw <- as.Date(c('1990-01-02', '1991-11-12')); raw; str(raw)raw2 <- as.numeric(strftime(raw, format = "%Y%m%d")); raw2; str(raw2)
daExp Expenditure Data for a Hausman Test in AIDS Model
Description
This data set contains seven monthly times series for expenditure from 2001 to 2008.
pinc Billions of dollars, personal incomedpi Billions of dollars, disposable personal incomepce Billions of dollars, personal consumption expendituresdg Billions of dollars, Personal consumption expenditures for durable goodsrdpi Billions of dollars, real disposable personal incomerpce Billions of dollars, real personal consumption expendituresrdg Billions of dollars, real personal consumption expenditures for durable goods

24 daIns
Usage
data(daExp)
Format
Monthly time series from Janurary 2001 to December 2008 with 96 observations for each of theseven variables.
Details
This is the data set for conducting a Hausman test in a static AIDS model, as detailed in Wan etal. (2010). The test focuses on whether the expenditure variable in a AIDS model is exogenousor not. Each of the seven expenditure data can be used as an instrumental variable in an auxiliaryregression.
Source
Federal Reserve Bank of St. Louis. Economic Data - Fred. Internet site: http://stlouisfed.org(Accessed February 25, 2010).
References
Wan, Y., C. Sun, and D.L. Grebner. 2010. Analysis of import demand for wooden beds in theUnited States. Journal of Agricultural and Applied Economics 42(4):643-658.
Examples
data(daExp)class(daExp); dim(daExp); colnames(daExp)daExp
daIns Liability Insurance Coverage for Hunters and Anglers in Mississippi
Description
This data set contains a survey result about liability insurance purchase decision by hunters andanglers in Mississippi. There are 1653 observations for 14 variables.
Y Binary dependent variable = 1 if had liability insurance; 0 otherwiseInjury Times of bodily injuries or property damages in the past three yearsHuntYrs Years of huntingNonres Dummy = 1 if nonresidents; 0 if Mississippi residentsLspman Dummy = 1 if purchased the license of resident sportsman; 0 otherwiseLnong Dummy = 1 if purchased the license of nonresident all game; 0 otherwiseGender Dummy = 1 if male; 0 otherwiseAge Age of the hunter or anglerRace Dummy = 1 if Caucasian; 0 otherwise

daIns 25
Marital Dummy = 1 if married; 0 otherwiseEdu Years of educationInc Household income in 2004 (1,000 dollars)TownPop Population size of the residence town (1,000)FishYrs Years of fishing
Usage
data(daIns)
Format
A cross sectional data with 1653 observations and 14 variables.
Details
The data set is from a telephone survey conducted in 2005 in Mississippi.
Source
Sun, C., S. Pokharel, W.D. Jones, S.C. Grado, and D.L. Grebner. 2007. Extent of recreationalincidents and determinants of liability insurance coverage for hunters and anglers in Mississippi.Southern Journal of Applied Forestry 31(3):151-158.
See Also
daInsNam
Examples
data(daIns)class(daIns); dim(daIns)head(daIns); tail(daIns)
ra <- glm(formula = Y ~ Injury + HuntYrs + Nonres +Lspman + Lnong + Gender + Age +Race + Marital + Edu + Inc + TownPop,
family = binomial(link="logit"),data = daIns, x = TRUE, y= TRUE)
names(ra); summary(ra)
(ins.me <- maBina(w = ra))(ins.mt <- maTrend(q=ins.me, nam.c="Age", nam.d="Nonres"))plot(ins.mt)

26 daInsNam
daInsNam Liability Insurance Coverage for Hunters and Anglers in Mississippi:Variable Definitions
Description
This data set contains variable defintions for the a survey result about liability insurance purchasedecision by hunters and anglers in Mississippi, as documented in daIns. It contains 14 observationsand 2 columns.
Variable 14 variable abbrevationsDefinition Detailed definitions for the 14 variables
Usage
data(daInsNam)
Format
A data frame with 2 columns and 14 rows.
Details
The data set contains the definitions of 14 variables collected from a telephone survey as detailed indaIns
Source
Sun, C., S. Pokharel, W.D. Jones, S.C. Grado, and D.L. Grebner. 2007. Extent of recreationalincidents and determinants of liability insurance coverage for hunters and anglers in Mississippi.Southern Journal of Applied Forestry 31(3):151-158.
See Also
daIns
Examples
data(daInsNam)str(daInsNam); dim(daInsNam); daInsNam

daLaw 27
daLaw Data for statutory reforms and retention of prescribed fire liabilitylaws on forest land by state
Description
This data set contains a cross-sectional data set for current adoption of statutory laws with regard toprescribed fire liability on forest landowners. It has 50 observations and 16 variables.
SHORT Two-letter abbreviations of 50 state namesSTATE Full state namesY Categorical dependent variable (Y = 0, 1, 2, or 3)FYNFS National Forests area in a state (million acres)FYIND Industrial forest land area in a state (million acres)FYNIP Nonindustrial private forest land area in a state (million acres)AGEN Permanent forestry program personnel in a statePOPRUR Rural population in a state (million)EDU Population 25 years and older with advanced degrees in a state (million)INC Per capita income in a state (thousand dollars)DAY The maximum length of legislative sessions in calendar days in a stateBIANN A dummy variable equal to one for states with annual legislative sessions, zero with biannual (or less)SEAT Total number of legislative seats (Senate plus House) in the legislative body in a stateBICAM Level of bicameralism in a state, defined as the size of the Senate divided by the size of the HouseCOMIT Total number of standing committees in a stateRATIO Total number of standing committees in a state divided by the number of legislators
Usage
data(daLaw)
Format
A data frame object with 50 rows and 16 variables.
Details
This is the final data set used in the study of Sun (2006).
Source
See Table 2 in Sun (2006) for detail of data sources.
References
Sun, C. 2006. State statutory reforms and retention of prescribed fire liability laws on US forestland. Forest Policy and Economics 9(4):392-402.
28 daPe
Examples
data(daLaw)str(daLaw); head(daLaw); names(daLaw)
daPe Program Effectiveness of a New Method of Teaching Economics
Description
This data set contains the evaluation results of a new program of teaching in economics. There are32 observations for 4 variables.
grade a binary variable indicating grade increase (1) and decrease (0) after participation.gpa a continous variable measuring studens’ grade point average.tuce a continous variable measuring students’ scores on an economics test.psi a binary variable indicating whether a student participates the program or not.
Usage
data(daPe)
Format
A data frame of cross sectional data with 32 observations and 4 variables.
Details
Evaluation results on 32 students of the impact of a new teaching methods.
Source
Spector, L.C., and M. Mazzeo. 1980. Probit analysis and economic education. Journal of EconomicEducation 11(2):37-44.
Examples
data(daPe)dim(daPe)summary(daPe)daPe

daRoll 29
daRoll Voting records for the Healthy Forests Restoration Act in 2003 and theassociated characteristics of congressmen
Description
This data set contains the voting records for the Healthy Forests Restoration Act in 2003, as usedin Sun (2006). The characteristics of individual congressmen are also included. There are 537observations and 22 variables.
state state name for a congressmandistrict district for a congressman; 0 for senatorsname Family name of a congressmanvoteMay voting record in May 2003 in the House; 1 if yes, 0 if no, and NA if not votedvoteNov voting record in Nov 2003 in both the House and SenateRepParty Dummy equals one if RepublicanEast Regional dummy for 11 northeastern statesWest Regional dummy for 11 western statesSouth Regional dummy for 13 southern statesPopDen Population density - 1000 persons per km2PopRural Population density per km2Edu Percentage of population over 25 with a Bachelor’s degreeIncome Median family income ($1,000)FYland Percentage of federal lands in total forestlands 2002Size Value of shipments of forest industry 1997 (million dollars)ContrFY Contribution from forest firms (1,000 dollars)ContrEN Contribution from environmental groups (1,000 dollars)Sex Dummy equals one if maleLawyer Dummy equals one if lawyerMember Dummy equals one if a committee member for the HFRAYear Number of years in the positionChamber Dummy equals one if House and zero if Senate
Usage
data(daRoll)
Format
A data frame object with 537 rows and 22 variables. This is a cross-sectional dataset that aregenerating from merging several raw datasets.
Details
This is the combinded final data set used in the study of Sun (2006).
30 download.lib
Source
See Table 1 in Sun (2006) for detail.
References
Sun, C. 2006. A roll call analysis of the Healthy Forests Restoration Act and constituent interestsin fire policy. Forest Policy and Economics 9(2):126-138.
See Also
glm; maBina.
Examples
# generate four datasets used in Sun (2006)data(daRoll)xn <- c('RepParty', 'East', 'West', 'South', 'PopDen',
'PopRural', 'Edu', 'Income', 'FYland', 'Size','ContrFY', 'ContrEN', 'Sex', 'Lawyer', 'Member', 'Year', 'Chamber')
f1 <- daRoll[!is.na(daRoll$voteMay), c('voteMay', xn)]f2 <- daRoll[!is.na(daRoll$voteNov) & daRoll$Chamber == 1, c('voteNov', xn)]f3 <- daRoll[!is.na(daRoll$voteNov), c('voteNov', xn)]f4 <- daRoll[!is.na(daRoll$voteNov) & daRoll$RepParty == 0, c('voteNov', xn)]rownames(f1) <- 1:nrow(f1); rownames(f2) <- 1:nrow(f2)rownames(f3) <- 1:nrow(f3); rownames(f4) <- 1:nrow(f4)colnames(f1)[1] <- colnames(f2)[1] <- 'Vote'colnames(f3)[1] <- colnames(f4)[1] <- 'Vote'dim(f1); dim(f2); dim(f3); dim(f4)tail(f3)
download.lib Downloading source and PDF version of R packages
Description
This function can download three documents for each package: zip version, source version (tar.gz),and PDF manual.
Usage
download.lib(pkgs, destdir = getwd(), mode = "wb",pdf.url = "http://cran.r-project.org/web/packages/",f.zip = TRUE, f.pdf = TRUE)

evReturn 31
Arguments
pkgs A character vector for the names of one or multiple packages
destdir The directory where documents are saved (e.g., C:/myFile; the default directoryis the current working directory.
mode The argument for download.file; the default is ’wb’ for PDF version.
pdf.url The url for PDF documents online.
f.zip A logical value indicating whether a zip version is downloaded; by default, a zipversion is downloaded by download.packages
f.pdf A logical value indicating whether a PDF mannual for a package should bedownloaded from the internet.
Details
This function is mainly used to download the source version of one or multiple packages. A zipversion and a PDF manual can also be downloaded at the same time.
Value
Return the packge names.
Author(s)
Changyou Sun (<[email protected]>)
See Also
download.packages; download.file.
Examples
## Not run:download.lib(pkgs = 'erer', destdir = 'c:/aErer/Rcode',f.zip = FALSE, f.pdf = TRUE)
## End(Not run)
evReturn Estimating Abnormal Return from Event Analysis
Description
Conduct an event analysis and estimate abnormal returns over time and across firms.

32 evReturn
Usage
evReturn(y, firm, event.date, y.date = "date",index = "sp500", event.win = 3, est.win = 250, digits = 4, ...)
Arguments
y a data frame object with one column for date, return series by firms, a returnseries for a stock market index, and a return series for a risk free asset.
firm a character vector of firm names; this is the name of the return series in y.
event.date event dates for each firm as specified in firm; this should be a numerical vectorand can match the values in y$y.date; if event dates are the same for all thefirms, this can be specificed as a single number.
y.date a character value for the column name of date in y.
index a character value for the column name of index in y.
event.win the one-side width of event window in days; the default value of 3 correspondsto a 7-day window (i.e., 3 + 1 + 3).
est.win the width of estimation window in days.
digits number of digits used to format outputs.
... additional arguments to be passed.
Details
This is the core function for event analysis. It estimates a market model by firm and then calcu-late abnormal returns by firm and over time. The time series of stock returns have irregular timefrequency because of varying trading days. Thus, the time dimension is explicitly specified as ay.date column in the data of y.
Value
Return a list object of class "evReturn" with the following components:
y a data frame of raw return data.
y.date a character value for the column name of date in y..
firm a character vector of firm names.
N the number of firms.
index a character value for the column name of index in y.
event.date event dates for each firm as specified in firm.
event.win the one-side width of event window in days.
event.width total number of days in an event window.
est.win the width of estimation window in days..
daEst data used to estimate the market model for the last firm as specified in codefirm.
daEve data over the event window for the last firm.
ra fitted market model for the last firm.

evReturn 33
digits number of digits used to format outputs.
reg regression coefficients by firm.
abr abnormal returns by day over the event window and by firm.
abc average abnormal returns across firms.
call a record of the system call; this allows update.default to be used.
Methods
Two methods are defined as follows:
print: print three selected outputs.
plot: plot average cumulative abnormal returns from event analysis versus days in event window.
Author(s)
Changyou Sun (<[email protected]>)
References
Mei, B., and C. Sun. 2008. Event analysis of the impact of mergers and acquisitions on the financialperformance of the U.S. forest products industry. Forest Policy and Economics 10(5):286-294.
Sun, C., and X. Liao. 2011. Effects of litigation under the Endangered Species Act on forest firmvalues. Journal of Forest Economics 17(4):388-398.
See Also
evRisk
Examples
data(daEsa)
# event analysis for one firm and one event windowhh <- evReturn(y = daEsa, firm = "wpp",
y.date = "date", index = "sp500", est.win = 250, digits = 3,event.date = 19990505, event.win = 5)
hh; plot(hh)
# event analysis for many firms and one event windowhh2 <- update(hh, firm = c("tin", "wy", "pcl", "pch")); hh2
# event analysis for many firms and many event windows: need a for loop

34 evRisk
evRisk Risk Evaluation for Event Analysis
Description
Conduct a risk analysis by firm and evaluate the change of risk before and after an event. The modelused is the Captial Asset Pricing Model.
Usage
evRisk(x, m = 50, r.free = "tbill", ...)
Arguments
x a object from evReturn.
m the number of days before and after the event date for estimating CAPM.
r.free the column name of risk free asset in y.
... additional arguments to be passed.
Details
This fits CAPM for each firm and reports the statistics for alpha, beta, and gamma. The statistics ofgamma reveal the change of risk before and after the event.
Value
Return a list object of class "evReturn" with the following components:
x a object from evReturn.
daEst data used to estimate CAPM for the last firm as specified in codefirm.
rb fitted CAPM for the last firm.
reg regression coefficients by firm.
Methods
One method is defined as follows:
print: print selected outputs.
Author(s)
Changyou Sun (<[email protected]>)
References
Mei, B., and C. Sun. 2008. Event analysis of the impact of mergers and acquisitions on the financialperformance of the U.S. forest products industry. Forest Policy and Economics 10(5):286-294.

head 35
See Also
evReturn
Examples
data(daEsa)
hh <- evReturn(y = daEsa, firm = "wpp",y.date = "date", index = "sp500", est.win = 250, digits = 3,event.date = 19990505, event.win = 5)
hh2 <- update(hh, firm = c("tin", "wy", "pcl", "pch"))
kk <- evRisk(x = hh2, m = 100, r.free="tb3m")kk
head Return the first or last part of time series data
Description
Return the first of last parts of an object of time series data.
Usage
## S3 method for class 'ts'head(x, n = 5, ...)## S3 method for class 'ts'
tail(x, n = 5, ...)
Arguments
x input time seires data.
n a single integer for the length or row of returned data
... additional arguments to be passed.
Details
The data can be an univariate or multivariate time series data.
Value
An object like x but generally smaller.
Author(s)
Changyou Sun (<[email protected]>)

36 listn
Examples
h1 <- ts(data=cbind(1:24), start=c(2001, 1), frequency=12)h2 <- ts(data=cbind(1:24, 25:48), start=c(2001, 1), frequency=12)h3 <- ts(data=cbind(1:4, 5:8, 9:12), start=c(2001, 1), frequency=4)colnames(h2) <- c("aa", "bb")colnames(h3) <- c("cc", "dd", "ee")h1; h2; h3
h1; head(h1); tail(h1, 28)h2; head(h2); tail(h2, 50)h3; head(h3, 2); tail(h3); tail(h3, 8)
data(daBed); head(daBed); tail(daBed)
listn Generate a list object with names
Description
Generate a list object with names.
Usage
listn(...)
Arguments
... individual objects to be included in a list.
Details
This generates a list object by addressing the naming problem. For list, if no names are given, thelist generated will have no names. In some situations, the number of individual objects is large andthe names of these individual objects can be used as the names. This function addresses this need.If names are given, they will be used. If not, the names of individual objects will be used.
Value
Return a list object with names.
Author(s)
Changyou Sun (<[email protected]>)

lss 37
Examples
y1 <- 1:10y2 <- c("a", "b")listn(y1, y2)listn(y1 = y1, y2)listn(y1 = y1, y2.rev = y2, y2, 5:8, c("d", "f"))
identical(listn(y1, y2), listn(y1 = y1, y2)) # TRUEidentical(listn(y1, y2), list(y1 = y1, y2)) # FALSEidentical(listn(y1, y2), list(y1 = y1, y2=y2)) # TRUE
lss List Objects with Their Sizes
Description
Show the name and memory size of objects in an R session.
Usage
lss(n = 5, pos = 1, decreasing = TRUE, order.by=c("Size", "Type"))
Arguments
n number of objects to show.
pos specifying the environment; see ls.
decreasing sorting order.
order.by sorting variable.
Details
This function shows the names and sizes of objects in an R session. This is useful for managingavaiable memory in an R Session.
Value
Return a dataframe object with the following columns: name, type, size, prettysize, rows, andcolumns.
Author(s)
Changyou Sun (<[email protected]>)
See Also
ls.

38 maBina
Examples
lss()ls()
maBina Marginal Effect for Binary Probit and Logit Model
Description
This function calculates marginal effects for a binary probit or logit model and their standard errors.
Usage
maBina(w, x.mean = TRUE, rev.dum = TRUE, digits = 3,subset.name = NULL, subset.value)
Arguments
w a binary probit or logit model object estimated from glm().
x.mean a logical value (default of TRUE) of whether to calculate marginal effects at themeans of independent variables. If FALSE, marginal effects are calculated foreach observation and then averaged.
rev.dum a logical value (default of TRUE) of whether to revise the estimates and standarderros for binary independant variables. If FALSE, derivatives are taken on binaryindependant variables as continuous variables.
digits number of digits for output.
subset.name a variable name for subsetting the data (e.g., a dummy variable).
subset.value if subset.name is not NULL, this value is used to subset the data set for thevariable specified in subset.name.
Details
Marginal effects from a binary probit or logit model is calculated. The two choices are the methodof averaging effects and revising estimates for dummy variables. Marginal effects can be calculatedat the mean of the independent variables (i.e., x.mean = TRUE), or as the average of individualmarginal effects at each observation (i.e., x.mean = FALSE). rev.dum = TRUE allows marginaleffects for dummy variables are calculated differently, instead of treating them as continuous vari-ables.
In addition, the data set used for calculating the marginal effect can be the whole data set, or asubsect of the whole data set. In subsetting the data, a variable name and its value should besupplied. This is generally applied on a dummy variable, as shown in the example.

maBina 39
Value
Return a list object of class "maBina" with the following components:
link link function used in the binary model;
f.xb scale factor of marginal effects, calculated as the density function evaluated atthe means of the variables when x.mean = TRUE is specified or the averagedensity value for all individual observations when x.mean = FALSE is specified;
w a binary probit or logit model object estimated from glm();
x the data set used in computing marginal effects.
out a data frame object of marginal effects, t-value, and p-value.
Methods
One method is defined as follows:
print: print the key output of marginal effects.
Author(s)
Changyou Sun (<[email protected]>)
References
Greene, W.H. 2003. Econometric Analysis (5th ed.). Prentice Hall, New York. 1026 P.
See Also
maTrend; plot.maTrend.
Examples
data(daPe)ma <- glm(grade ~ gpa + tuce + psi, x = TRUE,
data = daPe, family = binomial(link = "probit"))
ea <- maBina(w = ma, x.mean = TRUE, rev.dum = TRUE)eb <- maBina(w = ma, x.mean = TRUE, rev.dum = TRUE,
subset.name = "psi", subset.value = 0)ec <- maBina(w = ma, x.mean = TRUE, rev.dum = TRUE,
subset.name = "psi", subset.value = 1)ea; eb; eceb$x; ec$x

40 maTrend
maTrend Trend of probability values in a binary choice model
Description
This function computes the change of probability for a continuous variable based on a binary choicemodel (either probit or logit), and furthermore, stratifies the probability through a binary indepen-dant variable.
Usage
maTrend(q, n = 300, nam.c, nam.d, simu.c = TRUE)
Arguments
q a object of class of "maBina" estimated from maBina().
n number of points for calculating probability; the large the number, the smootherthe curve.
nam.c a name of a continuous indepedent variable; this must be given for the functionto work.
nam.d an optional name of a binary independent variable; this is used to stratify theprobability.
simu.c Whether simulation data for the continuous variable of nam.c should be used(default is TRUE); if not, the original data for this variable is used.
Details
For a continous variable, its probability values can be computed on the basis of a binary probit orlogit model. The trend can be stratified by a binary independent variable. In addition, the standarderrors of each probability series are also computed using delta method.
Value
Return a list object of class "maTrend" with the following components:
q a list object of class "maBina"
nam.c the name of a continous variable
mm matrix of independant variables for all
trend if nam.d is not specified, this is a data frame of the continous variable, its prob-ability values, standard errors, t values, and p values; if nam.d is specified, thedata frame contains the continuous variable, the probability values for all, andtwo additional probability series stratified by the dummy variable
nam.d if nam.d is specified, the name of a binary variable .
m1 if nam.d is specified, the matrix of mm with the column value for nam.d replacedby 1
ocME 41
m0 if nam.d is specified, the matrix of mm with the column value for nam.d replacedby 0
trend1 if nam.d is specified, this is a data frame reporting the probability value, standarderror, t value, and p value associated with the dummy variable being 1
trend0 if nam.d is specified, this is a data frame reporting the probability value, standarderror, t value, and p value associated with the dummy variable being 0
Methods
Two methods are defined as follows:
print: print the probability output.
plot: Plot the probability values for a continuous variable. If a strata is specified through nam.d inmaTrend(), then the stratified values also are shown.
Author(s)
Changyou Sun (<[email protected]>)
References
Greene, W.H. 2003. Econometric Analysis (5th ed.). Prentice Hall, New York. 1026 P.
See Also
maBina; print.maTrend; plot.maTrend.
Examples
data(daPe)ma <- glm(grade ~ gpa + tuce + psi, x = TRUE,
data = daPe, family = binomial(link = "probit"))summary(ma)
(ea <- maBina(w = ma, x.mean = TRUE, rev.dum = TRUE))(ta <- maTrend(q = ea, nam.c = "gpa", simu.c = FALSE))(tb <- maTrend(q = ea, nam.c = "gpa", nam.d= "psi", simu.c = TRUE, n=100))plot(ta)plot(tb)
ocME Marginal Effect for Ordered Choice Model
Description
This function calculates marginal effects for an ordered chioce model and their standard errors.Either an ordered probit or logit model can be accommodated.

42 ocME
Usage
ocME(w, rev.dum = TRUE, digits = 3)
Arguments
w an ordered probit or logit model object estimated by polr from the MASS li-brary.
rev.dum a logical value (default of TRUE) of whether to revise the estimates and standarderros for binary independant variables. If FALSE, derivatives are taken on binaryindependant variables as continuous variables.
digits number of digits for output.
Details
Marginal effects from an ordered probit or logit model is calculated. Marginal effects are calculatedat the mean of the independent variables. rev.dum = TRUE allows marginal effects for dummyvariables are calculated differently, instead of treating them as continuous variables. The standarderrors are computed by delta method. The software of LIMDEP is used to compare and benchmarkthe results.
Value
Return a list object of class "ocME" with the following components:
w input of an ordered choice model
out a list object of marginal effects, standard errors, t-values, and p-values by factorlevel.
Methods
One method is defined as follows:
print: print the key output of marginal effects.
Author(s)
Changyou Sun (<[email protected]>)
References
Greene, W.H. 2003. Econometric Analysis (5th ed.). Prentice Hall, New York. 1026 P.
See Also
ocProb

ocProb 43
Examples
# Loading data from the MASS librarylibrary(MASS)data(housing)str(housing); head(housing)
# Fit an ordered choice model with polr from the MASS library# This is the original specification used in MASS.fm <- Sat ~ Infl + Type + Contra <- polr(fm, data = housing, weights = Freq, Hess = TRUE, method = "probit")rb <- polr(fm, data = housing, weights = Freq, Hess = TRUE, method = "logistic")summary(ra); summary(rb)
# Compute the marginal effectmea <- ocME(w = ra); meameb <- ocME(w = rb); mebmeb$out
ocProb Probability trend for a continuous variable in an ordered choice model
Description
This function computes the probability values for a continuous variable, based on an ordered choicemodel. Either an ordered probit or logit model can be used.
Usage
ocProb(w, nam.c, n = 100, digits = 3)
Arguments
w a object of class of "polr" estimated from polr from the MASS library.
n number of points for calculating probability; the large the number, the smootherthe curve.
nam.c a name of a continuous indepedent variable; this must be given for the functionto work.
digits number of digitis for output formatting.
Details
This function computes the probability values associated with a continous variable in an orderedprobit or logit model. The standard errors of each probability value by factor level is computedusing delta method. The software of LIMDEP is used to compare and benchmark the results.
44 ocProb
Value
Return a list object of class "ocProb" with the following components:
w, nam.c, method=w$method, mean.x=colMeans(x), out, lev)
w an object of class "polr"
nam.c the name of a continous variable
method type of the ordered choice model of w, either "probit" or "logistic"
mean.x mean values of the independent variables used in w
out This is a list object with the estimated probability values, standard errors, t val-ues, and p values for each of the factor level in lev.
lev a character string representing the factor level used in w
Methods
Two methods are defined as follows:
print: print the probability output.
plot: Plot the probability values for a continuous variable.
Author(s)
Changyou Sun (<[email protected]>)
References
Greene, W.H. 2003. Econometric Analysis (5th ed.). Prentice Hall, New York. 1026 P.
See Also
ocME
Examples
# Loading data from the MASS librarylibrary(MASS)data(housing)str(housing); head(housing)
# Fit an ordered choice model with polr from the MASS library# Note this is a fake specification# The variable of "Freq" is included to have a# continuous variable for demonstration.fm2 <- Sat ~ Infl + Type + Cont + Freqrc <- polr(fm2, data = housing, Hess = TRUE, method = "probit")rd <- polr(fm2, data = housing, Hess = TRUE, method = "logistic")summary(rc); summary(rd)
# Compute predicated probabilities with one continous variable(fa <- ocProb(w = rc, nam.c = 'Freq', n = 300))

summary.aiFit 45
(fb <- ocProb(w = rd, nam.c = 'Freq', n = 300))plot(fa)plot(fb)
summary.aiFit Summary of Results from Static or Dynamic Models
Description
This summarizes the main results from AIDS models.
Usage
## S3 method for class 'aiFit'summary(object, digits=3, ...)
Arguments
object an object of class aiFit from the function of aiStaFit or aiDynFit.
digits number of digits for rounding outputs
... additional arguments to be passed.
Details
This wraps up the coefficents and statistics from aiFit by equation.
Value
A data frame object with coefficients and related statistics by equation.
Author(s)
Changyou Sun (<[email protected]>)
See Also
aiStaFit and aiDynFit.
Examples
# see the examples for 'aiDynFit'.
46 systemfitAR
systemfitAR Linear Equation System Estimation with Correction on Autocorrela-tion
Description
Fits a set of linear structural equations using Ordinary Least Squares (OLS), Weighted Least Squares(WLS), Seemingly Unrelated Regression (SUR), with the option of autocorrelation correlation.
Usage
systemfitAR(formula, method = "OLS", inst = NULL, data = list(),restrict.matrix = NULL, restrict.rhs = NULL, restrict.regMat = NULL,pooled = FALSE, control = systemfit.control( ... ),AR1 = FALSE, rho.sel = c("all", "mean"), model = c("static", "dynamic"), ...)
Arguments
formula an object of class formula (for single-equation models) or (typically) a list ofobjects of class formula (for multiple-equation models).
method the estimation method, one of "OLS", "WLS", "SUR"; iterated estimation meth-ods can be specified by setting control parameter maxiter larger than 1 (e.g.500).
inst one-sided model formula specifying instrumental variables or a list of one-sidedmodel formulas if different instruments should be used for the different equa-tions (only needed for 2SLS, W2SLS, and 3SLS estimations).
data an optional data framecontaining the variables in the model.restrict.matrix
an optional j x k matrix to impose linear restrictions on the coefficients byrestrict.matrix * b = restrict.rhs (j = number of restrictions, k = numberof all coefficients, b = vector of all coefficients)
restrict.rhs an optional vector with j elements to impose linear restrictions (see restrict.matrix);default is a vector that contains j zeros.
restrict.regMat
an optional matrix to impose restrictions on the coefficients by post-multiplyingthe regressor matrix with this matrix (see details).
control list of control parameters. The default is constructed by the function systemfit.control.See the documentation of systemfit.control for details.
pooled logical, restrict coefficients to be equal in all equations (only for panel-like data).
AR1 whether first-order autocorrelation is corrected
rho.sel how rho is computed; rho.sel = "all" means that the system is estimatedas a single equation and the residuals are used to compute rho. If "mean", eachequation in the system is estimated separately and the average of rhos from allthe equations are used.
systemfitAR 47
model Static model has interceipt, while dynamic model has no intercept; see translogcost function and the package for detail.
... arguments passed to systemfit.control.
Details
This is a wrapper of systemfit with an addition of autocorrelation correction. It is mainly usedfor SUR model with autocorrelation. The main reference sources are Greene (2003), LIMDEP 9.0manual, Judge et al. (1985), and Berndt and Savin (1975).
Value
systemfit returns a list of the class systemfit. This list contains one special object: "eq".It is a list and contains one object for each estimated equation. These objects are of the classsystemfit.equation and contain the results that belong only to the regarding equation. In addi-tion, there are four new items in the output:
The objects of the class systemfit and systemfit.equation have the following components (theelements of the latter are marked with an asterisk (∗)):
rho autocorrelation coefficient
rho_ste standard error of rho; if rho.sel = "mean", then it is a vector of the standarerrors for individual equations.
data data used for systemfit; this is data adjusted for autocorrelation if AR1 = TRUE;otherwise, it is just the raw data.
formula forumula used for systemfit. This can be adjusted for autocorrelation; costantis adjusted as (1 - rho).
Author(s)
Changyou Sun (<[email protected]>)
References
Greene, W. H. (2003) Econometric Analysis, Fifth Edition, Prentice Hall.
Judge, George G.; W. E. Griffiths; R. Carter Hill; Helmut Luetkepohl and Tsoung-Chao Lee (1985)The Theory and Practice of Econometrics, Second Edition, Wiley.
LIMDEP 9.0 software manual.
Berndt, E.R., and N.E. Savin. 1975. Estimation and hypothesis testing in singular equation systemswith autoregressive disturbances. Econometrica 43(5/6):937-957.
See Also
lm; aiStaFit; systemfit

48 ur.df2
Examples
# Check Berndt and Savin (1975) dataset
# Check Kemenda data
ur.df2 Augmented-Dickey-Fuller Unit Root Test revised
Description
Augmented-Dickey-Fuller Unit Root Test revised
Usage
ur.df2(y, type = c("none", "drift", "trend"), lags = 1,selectlags = c("Fixed", "AIC", "BIC"))
Arguments
y Vector to be tested for a unit root.type Test type, either "none", "drift" or "trend"..lags Number of lags for endogenous variable to be included.selectlags Lag selection can be achieved according to the Akaike "AIC" or the Bayes "BIC"
information criteria. The maximum number of lags considered is set by lags.The default is to use a "fixed" lag length set by lags.
Details
This is a modification of ur.df in the library of urca. The function was written in S4, and it ischanged into S3. The lag selected by AIC or BIC is reported explicitly through lag.used in theoutput list. In addition, the values of AIC and BIC statistics are reported
Value
Return an object of class ur.df2: the new outputs are lag.used, aic, and bic.
y input of ymodel input of modelcval critical valueslags input of lagslag.used acutal lags usedteststat test statisticsres resiuals of the test regressionaic aic valuesbic bic valuestest.name test name

write.list 49
Methods
One method is defined as follows:
print: print test statistics and critical values.
Author(s)
Changyou Sun (<[email protected]>)
See Also
ur.df in urca library.
Examples
# see the code for TD.Link: Japan and China wood product imports
write.list Output and Write a List Object
Description
Print or write its required argument z to a file
Usage
write.list(z, file, t.name = NULL, row.names = FALSE, ...)
Arguments
z A list object to be written. Each item in the list is perferably a data frame. If not,it is converted into a data frame. All the contents are coerced into characters toavoid loss of information (e.g., a loss of zero in 5.130.
file a character string naming a file.
t.name table names. This can be given explicitly, or given by the list name, or by default,named as "table 1" for the first item in z.
row.names whether the row names in each table should be written (default is FALSE). IfTRUE, a new column of the row names is added to each table.
... Other arguments that can be passed to write.table
Details
This function is a wrap-up of write.table. It is convenient to write a set of tables to C drive.
See Also
write.table.
50 write.list
Examples
h1 <- ts(data=cbind(1:24), start=c(2001, 1), frequency=12)h2 <- ts(data=cbind(1:24, 25:48), start=c(2001, 1), frequency=12)h3 <- ts(data=cbind(1:4, 5:8, 9:12), start=c(2001, 1), frequency=4)colnames(h2) <- c("aa", "bb")colnames(h3) <- c("cc", "dd", "ee")h1; h2; h3
test <- list(t1 = h1, t2 = h2, t3 = h3)
## Not run:# test.csv can be saved at a specific working directorygetwd(); setwd("c:/aERER"); getwd()write.list(z = test, file = "test.csv")
## End(Not run)

Index
∗Topic datasetsdaBed, 19daBedRaw, 20daEsa, 22daExp, 23daIns, 24daInsNam, 26daLaw, 27daPe, 28daRoll, 29
∗Topic manipaiData, 3bsFormu, 13bsLag, 14bsStat, 16bsTab, 17download.lib, 30listn, 36lss, 37ur.df2, 48write.list, 49
∗Topic methodshead, 35summary.aiFit, 45
∗Topic modelssystemfitAR, 46
∗Topic packageerer-package, 2
∗Topic regressionaiDiag, 5aiDynFit, 6aiElas, 9aiStaFit, 10aiStaHau, 12evReturn, 31evRisk, 34maBina, 38maTrend, 40ocME, 41
ocProb, 43systemfitAR, 46
aiData, 3aiDiag, 5, 8, 11aiDynFit, 6, 6, 10, 11, 45aiElas, 8, 9, 11aiStaFit, 5, 6, 8, 10, 10, 13, 20, 22, 45, 47aiStaHau, 11, 12
bsFormu, 13bsLag, 14bsStat, 16bsTab, 17
daBed, 5, 19, 22daBedRaw, 5, 20, 20daEsa, 22daExp, 23daIns, 24, 26daInsNam, 25, 26daLaw, 27daPe, 28daRoll, 29download.file, 31download.lib, 30download.packages, 31
erer (erer-package), 2erer-package, 2evReturn, 23, 31, 35evRisk, 23, 33, 34
glm, 30
head, 35
listn, 36lm, 47ls, 37lss, 37
51

52 INDEX
maBina, 30, 38, 41maTrend, 39, 40
ocME, 41, 44ocProb, 42, 43
plot.evReturn (evReturn), 31plot.maTrend, 39, 41plot.maTrend (maTrend), 40plot.ocProb (ocProb), 43print.aidata (aiData), 3print.aiFit, 13print.aiFit (aiStaFit), 10print.evReturn (evReturn), 31print.evRisk (evRisk), 34print.maBina (maBina), 38print.maTrend, 41print.maTrend (maTrend), 40print.ocME (ocME), 41print.ocProb (ocProb), 43print.urdf2 (ur.df2), 48
summary.aiFit, 11, 45systemfit, 47systemfit.control, 46, 47systemfitAR, 8, 11, 46
tail.ts (head), 35
ur.df, 49ur.df2, 48
write.list, 49write.table, 49