
pacifica larval abundance was 6 1 significant (growth mass ... · PDF fileThey found that,...
18
Vol. 173: 163-180.1998 i MARINE ECOLOGY PROGRESS SERIES Mar Ecol Prog Ser Published November 12 Interannual variations in the population biology and productivity of Euphausia pacifica in Barkley Sound, Canada, with special reference to the 1992 and 1993 warm ocean years R. W. Tanasichuk* Department of Fisheries and Oceans, Pacific Biological Station, Nanairno, British Columbia V9R 5K6, Canada ABSTRACT: I monitored the size composition, abundance, growth, reproductive biomass and produc- tivity characteristics of Euphausia pacifica in Barkley Sound. Canada, from March 1991 through March 1997. Sea temperatures were anomalously warm in 1992 (El Nilio Southern Oscillation, ENSO) and in 1993; the strongest upwelling over the study period occurred in 1992. Mean annual E. pacifica larval abundance was 6 times greater in 1992 than in 1991, the pre-ENS0 year. Adult abundance in 1992 and 1993 was twice that for 1991 due to the strong recruitment moving through the population. Larval abundance fluctuated substantially since the warming while adult abundance returned to pre-ENS0 levels in 1994. Growth condihons, as indicated by variations in the condtion factor, did not vary signif- icantly over the 6 yr study period. Length-at-maturity increased over the spawning season but interan- nual variations were too small to influence adult abundance The sex ratio fluctuated randomly around a grand mean of 0.56 males w~thin and between years. I present a procedure for defining spawning events as a function of larval development time and its variability. I found a number of discrete spawn- ing~ annually and suggest that there has been no change in spawning frequency or duration over the study perlod. 1 found no significant change in the size of any larval stage over the study period. The relationship between parental and larval abundance follows a Ricker stock-recrult relationship; larval abundance decreased at high parental abundances. Mean annual larval biomass and productivity (growth + moult) ranged from being the same as to 9 times greater than 1991 levels. Mean adult bio- mass was 1.2 and 2 times greater in 1992 and 1993 respectively than in 1991; productivity was 1.8 and 2.3 times higher in 1992 and 1993 respectively and has returned to pre-ENS0 levels. P:B ratios for total production ranged from 55 to 89 and from 8.6 to 12.4 for larvae and adults respect~vely. Population P:B ratios fluctuated between 10.7 and 23.3. KEY WORDS: Euphausia pacifica . Euphausiid . Population biology . Productivity Ocean variability INTRODUCTION Mauchline (1980) describes euphausiids as an often abundant and conspicuous component of marine macrozooplankton, where they can play a significant role in the flow of energy and matter in pelagic food webs. Euphausia pacifica appears then to be a typical euphausiid species because of its abundance in mid- and higher latitude Pacific coastal ecosystems and its importance to energy flow within some marine ecosys- terns. Smiles & Pearcy (1971) reported that E. pacifica is preyed upon by a number of invertebrate, fish and marine mammal species. Brodeur & Pearcy (1992) refer to the importance of euphausiids, including E. pacifica, to the coastal upwelling zone off Oregon and Washing- ton, USA. Tanasichuk et al. (1991) found that eu- phausiids (E. pacifica, Thysanoessa spinifera) are the most important food item for commercially important fish species in a productive fishing area along the southwest coast of Vancouver Island, Canada. Nemoto (1957) described the importance of E. pacifica as food for fish and whale species in Japanese waters. O Inter-Research 1998 Resale of full a]-ticle not permitted
Transcript of pacifica larval abundance was 6 1 significant (growth mass ... · PDF fileThey found that,...

Vol. 173: 163-180.1998 i MARINE ECOLOGY PROGRESS SERIES
Mar Ecol Prog Ser Published November 12
Interannual variations in the population biology and productivity of Euphausia pacifica in
Barkley Sound, Canada, with special reference to the 1992 and 1993 warm ocean years
R. W. Tanasichuk*
Department of Fisheries and Oceans, Pacific Biological Station, Nanairno, British Columbia V9R 5K6, Canada
ABSTRACT: I monitored the size composition, abundance, growth, reproductive biomass and produc- tivity characteristics of Euphausia pacifica in Barkley Sound. Canada, from March 1991 through March 1997. Sea temperatures were anomalously warm in 1992 (El Nilio Southern Oscillation, ENSO) and in 1993; the strongest upwelling over the study period occurred in 1992. Mean annual E. pacifica larval abundance was 6 times greater in 1992 than in 1991, the pre-ENS0 year. Adult abundance in 1992 and 1993 was twice that for 1991 due to the strong recruitment moving through the population. Larval abundance fluctuated substantially since the warming while adult abundance returned to pre-ENS0 levels in 1994. Growth condihons, as indicated by variations in the condtion factor, did not vary signif- icantly over the 6 yr study period. Length-at-maturity increased over the spawning season but interan- nual variations were too small to influence adult abundance The sex ratio fluctuated randomly around a grand mean of 0.56 males w~thin and between years. I present a procedure for defining spawning events as a function of larval development time and its variability. I found a number of discrete spawn- i n g ~ annually and suggest that there has been no change in spawning frequency or duration over the study perlod. 1 found no significant change in the size of any larval stage over the study period. The relationship between parental and larval abundance follows a Ricker stock-recrult relationship; larval abundance decreased at high parental abundances. Mean annual larval biomass and productivity (growth + moult) ranged from being the same as to 9 times greater than 1991 levels. Mean adult bio- mass was 1.2 and 2 times greater in 1992 and 1993 respectively than in 1991; productivity was 1.8 and 2.3 times higher in 1992 and 1993 respectively and has returned to pre-ENS0 levels. P:B ratios for total production ranged from 55 to 89 and from 8.6 to 12.4 for larvae and adults respect~vely. Population P:B ratios fluctuated between 10.7 and 23.3.
K E Y WORDS: Euphausia pacifica . Euphausiid . Population biology . Productivity Ocean variability
INTRODUCTION
Mauchline (1980) describes euphausiids as an often abundant and conspicuous component of marine macrozooplankton, where they can play a significant role in the flow of energy and matter in pelagic food webs. Euphausia pacifica appears then to be a typical euphausiid species because of its abundance in mid- and higher latitude Pacific coastal ecosystems and its importance to energy flow within some marine ecosys-
terns. Smiles & Pearcy (1971) reported that E. pacifica is preyed upon by a number of invertebrate, fish and marine mammal species. Brodeur & Pearcy (1992) refer to the importance of euphausiids, including E. pacifica, to the coastal upwelling zone off Oregon and Washing- ton, USA. Tanasichuk et al. (1991) found that eu- phausiids (E. pacifica, Thysanoessa spinifera) are the most important food item for commercially important fish species in a productive fishing area along the southwest coast of Vancouver Island, Canada. Nemoto (1957) described the importance of E. pacifica as food for fish and whale species in Japanese waters.
O Inter-Research 1998 Resale of full a]-ticle not permitted

164 Mar Ecol Prog Ser 173: 163-180, 1998
There have been a number of studies on the biology of Euphausia pacifica, but few have considered the in- fluence of environmental variability. Research on E. pacifica ranges from the early work by Lasker (1966), who investigated growth and respiration in the labo- ratory, to Brinton's (1976) exhaustive study of the pop- ulation biology in the California Bight over 4 years and Ross' series of reports (Ross 1981, 1982a, b, Ross et al. 1982) on reproductive biology and energetics, through to the most recent work by Iguchi & Ikeda (1995) on temperature effects on growth and metabo- lism. Brinton (1976) endeavoured to select a series of consecutive years (1953 to 1956) from the CalCOFI sampling time series when variability was minimal. His purpose was to develop baseline information on E. pacifica population biology which could be used to measure the effects of oceanic variability. The only study which describes an effect of environmental vari- ation on E. pacifica is that of Brinton & Reid (1986). They found that, while showing conservative biologi- cal responses to recent variations in ocean climate, individual euphausiid species can locally undergo 5- to 10-fold interannual changes in biomass. In their case, the southern species (Nyctiphanes simplex) dominated in warm times and the northern species (E. paclfica) in cool times. In general, there are sur- prisingly few studies which examine the influence of interannual variations in ocean climate on the biology and productivity of euphausiids. Drobysheva (1987) reported results for Thysanoessa inermis and T. raschii in the Barents Sea over a 30 yr period which are similar to those presented by Brinton & Reid (1986). Most recently, Loeb et al. (1997) described
how variations in winter ice condition may influence year-class strength in E. superba.
The goal of this study was to monitor the population biology and productivity of Euphausia pacdica, to hope- fully track the responses of this euphausiid through a period of anomalous change in ocean temperature. There was substantial ocean warming in 1992 (ENSO) and 1993. The Canadian Department of Fisheries and Oceans began studying the waters along the southwest coast of Vancouver Island (La Perouse Bank area) in 1985 to determine how changes in ocean climate affect fish production. The results presented here complement this long-term program by showing how changes in ocean climate affect E. pacifica, an important food item for many commercially important fish species.
MATERIALS AND METHODS
I have been sampling euphausiid.~ i.n Barkley Sound since March 1991 (Fig. 1). I chose Barkley Sound be- cause it can be sampled conveniently using a small boat virtually all through the year, and it is adjacent to the La Perouse Bank area.
Euphausiids were collected during 42 cruises. There are 4 sampling stations which collectively reflect the bathymetric and circulation characteristics of the Sound (Fig. 1). Cruises were made 9 times annually between March 1991 and 1994 to define accurately the seasonal growth, abundance, size composition and reproduction patterns. Since then, I collected samples 5 times a year (January, March, June, August and October) to monitor interannual variations.
Samples were taken at night using obliquely towed bongo nets (60 cm mouth diameter, 330 pm mesh nets) which traveled to within 10 m of the bottom. All samples were preserved in 5% formalin. A sub- sample of adult-sized euphausiids (>9 mm total length) from one cod- end was taken for surplus energy analyses when the hepatopan- creas and gonad were weighed. The entire sample from the other
Fig. 1. Study area. C (Coaster Channel), S (Swale Rock), R (Robber's Passage) and M (Mackenzie Anchorage) are Barkley Sound sampling sites. Amphi- trite Point shows the lighthouse loca- tion. C2, C3: offshore plankton sam- pllng stations. A l : the offshore mooring which provided data for current veloc-
ity indices

Tanasichuk: Population biology a ~ n d productivity of Euphaus~a pacifica 165
cod-end was preserved. This sample was size-fraction- ated using 250, 500 and 1700 pm sieves to separate adults and sub-adults. All adult-sized euphausiids were identified to species and then counted and measured. Individuals from stratified random sub-samples (a max- imum of 5 individuals per millimeter length interval) were weighed, sexed and their maturity described (immature: no secondary sexual characters; male: petasma and with or without spermatophores; female: thelycum and unfertilized, fertilized or gravid). All mass measurements were multiplied by 0.20 because Parsons et al. (1984) reported a water content of 80% for North Pacific euphausiids. Samples of sub-adults were split using a Folsom splitter. The goal was to have 50 calyptopes and furcilia in the split to be analysed. Eggs and nauplii were counted and measured. Calyp- topis and furcilia larva were identified to species and stage, and then counted and measured. Larvae were identified using the descriptions presented by Boden (1950) for Euphausia pacifica. E. pacifica larvae were distinguished from Thysanoessa larvae using the key developed in our laboratory. We based this key on the larval descriptions of T. spinifera, the other abundant euphausiid species in Barkley Sound, that Summers (1993) presented.
Abundance (no, m-2) was estimated from no, m-" tow depth. Volume of water filtered was measured with a TSK flowmeter. Abundance is expressed as the mean over the 4 stations weighted by station-specific volume filtered.
I used log-transformed total length, total mass and ovarian mass estimates to develop cruise-specific length - mass and year-specific total mass - ovarian mass relationships. I measured ovarian mass until 1995 only. Differences were tested using analysis of covari- ance (ANCOVA). I used the GT-2 method described by Sokal & Rohlf (1981) to test for the significance of slope and then intercept differences.
I developed a procedure for identifying discrete spawnings using the data presented by Ross (1981) and the effect of temperature on Euphausia pacifica development time described by Iguchi & Ikeda (1994). Ross presented cumulative percentage plots for E. pacifica larvae reared at 8 and 12°C. I used the sample size and mortality data for 12°C to estimate the number of larvae at each stage. By using the daily percentage increase in the number of larvae at a given larval stage, and the sample size information, I calculated the number of larvae attaining a larval stage at a certain age. I used probability plots, as recommended by Wil- kinson et al. (1996), to test for normality for age at which a certain larval stage was reached. In those instances where data were normally distributed, I cal- culated the mean, variance and 95 % confidence limits (Table 1). I assumed, as indicated in Ross (1981), that
variability in age at a given larval stage was indepen- dent of temperature. Iguchi & Ikeda (1994) reported that development time was a negative exponential function of temperature. I used the median develop- ment times Ross (1981) presented for 8 and 12"C, and non-linear parameter estimation (SYSTAT 1994), to calculate equations which estimated stage-specific median development time as a function of tempera- ture. By knowing larval stage and sea temperature at Amphitrite Point (see below) over the lifetime of the larva, I back-calculated a temperature-corrected birth- date and assigned 95% confidence limits to the esti- mate. Estimates for all larval stages sampled during the study were arranged by increasing birthdate. Instances where confidence limits for any larval stage did not overlap indicated times when there was no spawning.
I estimated growth and moult production between successive sampling dates. Growth production was estimated using the Petrovich method described by Ritz & Hosie (1982). Although spawnings were not completely continuous (see 'Results'), spawning was considered protracted enough to justify using this pro- cedure. Length-speclfic mass at each interval was esti- mated using the cruise-specific length- total mass regression. Length-specific age (t, days) was calculated using the the growth curve (see 'Results') and the equation:
where L,,, 1, and Kare the parameters from the von Ber- talanffy fit to the growth curve and to = 0 (Ricker 1975). I estimated length-specific moult production PmZi as:
(Sameoto 1976) where i is length interval, W is length- specific dry mass, N is the length-specific abundance
Table 1 Euphausia pacifica. Estimated age (days, mean k 2 SE) at development stage for euphausiids reared at 12°C
Stage Age
C 1 7 * 1.5 C2 11 k 4 . 0 C3 14" F1 19 * 6 5 F2 22 t 13.2 F3 27" F4 35 * 3.0 F5 37h F6 38 * 6.5 F7 42 * 11.8 J 47 k 6.0
"Median values given where data are not normally distnb- uted
hEstimated as midpoint of F4 and F6 ages

I66 Mar Ecol Prog Ser 173: 163-180, 1998
RESULTS
2 study period. Fig. 2 shows the sea temperature anom- alies at Amphitrite Point. Sea temperatures were warmer than average from 1992 through 1996. There were large positive anomalies in 1992 and 1993 and
.- large negative anomalies during the winters of 1993-
0 P. 94, 1994-95 and 1996-97 0 - L Trends in the current velocity index are sh.own in - r: g Fig. 3. Although the data record is somewhat incom- Q
$ 0 plete, it shows the strongest upwelling during the
X - m study period occurred in 1992. The strongest down- E welling event occurred in the winter of 1994-95. C
Li V)
-I
Sampling bias
I anticipated 3 potential sources of bias: (1) between-
-2 station variability, (2) the effect of reduced sampling 1991 1992 1993 1994 1995 1996 1997 intens~ty and (3) differences between samples collected
Year i.n Barkley Sound and offshore, in the La Perouse study Fig. 2. Monthly sea surface temperature anomalies measured area. I found relatively few instances of substantial
at Amphitrite Point Lighthouse between-station variability for a given cruise. Fig. 4 shows the time series of abundance for all sampling sta-
and IP is the intermoult period. Jerde & Lasker (1966) tions. There were 5 instances where there were large found that Euphausia pacifica moults represented differences in abundances between stations. I excluded about 10.6 % of the dry body mass. IP was estimated these samples from any calculations which considered using the equation Iguchi & Ikeda (1995) developed for abundance. Next, the reduction in sampling intensity E. pacifica: could potentially bias the estimates of mean annual
logloIP = 0.0321 X L + 10' 0340-00435T abundance, biomass and productivity by missing peaks and/or troughs in trends. Fig. 5 shows the mean annual
where L is length and T is the mean sea temperature abundance estimates for larval and adult Euphausia at Amphitrite Point (see below) between sampling pacifica. Means for the years 1991 through 1993 were events. I did not estimate egg production because estimated using all sampling data, and then using data there is no conclusive information on E. pacifica fecun- dity (brood size X number of spawnings) (see 'Discus-
Sea conditions over the study period
40000 sion'). All annual estimates were made considering a year
to begin in March and end in February. This was 30000
because spawnings in a calendar year began in March, which I considered to signify the beginning of a new
20000 'biological year'.
An appropriate examination of the influence of vari- ations In sea temperature must begin wlth an under- s tand~ng of how sea temperature fluctuated over the
I I I I I I I I I I I I I I I I I I I I
-
-
-30000 87 I d9 do 91 d2 d3 94 95 W 97 1 l I I I 1 I l I I I I
Year
Fig. 3. Current velocity index. Positive values ~ndicate up- welling. Bars show intensity
Sea surface temperature data came from Amphitrite Point. This is a lighthouse station located 20 nautical 4 IOOOO miles west of the study area (Fig. l ) . I used the current g .- velocity index developed by Thomson & Ware (1996) to 3 - describe the intensity of summer upwelling over the study period. E
5 -l0000
-20000
- -
- -

Tanasichuk: Population biology and productivity of Euphausia pacifica 167
for the 5 months (January, March, June, August and October) which were sampled in all years. These fig- ures show that any bias due to the reduced sampling in- tensity is much smaller than the interannual variations in abundance. Therefore, the reduction in sampling in- tensity would not affect the comparison of abundance, biomass or productivity between years. Finally, I com- pared the size distributions and abundances of adult E. pacifica collected in Barkley Sound with those from samples collected at the offshore stations (Fig. 1). These offshore stations are occupied by a long-term coastal zooplankton sampling program (COPRA). Samples are collected whenever research vessels are in the vicinity; unfortunately, there were only 3 instances when sam- ples were collected at both stations at night, using obliquely towed bongo nets, and near times when I col- lected samples in Barkley Sound. Figs. 6 & 7 shows comparisons of abundances and size-frequency distrib- utions respectively. The abundance data suggest good agreement between the Barkley Sound and offshore samples. Results of a log-linear model analysis showed that location had a significant effect on size-frequency distributions in 1995 only. Therefore I concluded that samples collected in Barkley Sound in the La Perouse study area show that the same population is being sam- pled.
Size composition and abundance
Fig. 4 . Euphausia pacifica. Abundance of adults at each Barkley Sound sampling station X: aberrant samples
tory (Fig. 11) for the progression of a distinct mode from January 1992 to March 1993 (Fig. 9). I accepted the growth trajectory because the accompanying abundance trajectory showed a non-linear reduction over time, which is biologically reasonable. I used the non-linear parameter estimation procedure in SYSTAT and fit length-at-time (L,, where t is days since the
Mean annual abundance estimates are given in Table 2 and larval and adult abundance trends are shown in Fig. 8. Larval abundance increased by 6 times in 1992 and fluctuated after. Abundances in 1993 through 1996 were approximately 3 times that in 1991, the pre-ENS0 year. Adult abundance doubled in 1992 and remained high in 1993 before returning to 1991 levels. Length-frequency histograms are presented in Fig. 9. Larvae (<l0 mm) were present continuously, although in some winter months only as larger ones. Adult length-frequency distributions were multi- modal, with inconsistent separation among distribu- tions. Fig. 10 shows changes in abundance by arbitrary adult size categories. The increases in adult abun- dance in 1992 and 1993 appear to be due to the excep- tionally strong recruitment in 1992 moving through the population. It appears larger adults (>20 mm) were present more consistently in 1991 and 1992, and were virtually absent in later years.
Growth
Because of the protracted spawning seasons in all years, I could only confidently develop a growth trajec-
4000 I I I I \
Larval
Adult
Year
Fig. 5 . Euphausia pacifica. Mean annual larval and adult abundance based on data for all samples within the March- February sampling year ( - - - ) and data for March, June,
August, October and January samples (-)

168 Mar Ecol Prog Ser 173: 163-180, 1998
Fig 6. Euphaus~a pacifica Adult abundance for Barkley Sound (-1 and offshore COPRA (C) sampling stations
mode appeared) data to a von Bertalanffy growth func- tion. The equation was:
I evaluated interannual variations in growth condi- tions using the adjusted mean dry mass (Fig. 12), tvhich is based on an ANCOVA of the total length- total mass regressions. Results of the GT-2 comparison
Total lengrh (mm)
Fig 7 Euphausla paclfica Adult length-trequcnry dlstnbu- t~on.; for R(rrklc~ , Sound and offshore COPR,? ~ ~ i n i p l ~ n g s t~ i - tlons Label5 ~ndicati . \,ear and sdrnpllr~q locat~on I 13 Barkley
Sound C COPKA kf.jt~nn<l
15000 I I
Larval
Year
Fig. 8. Euphausla pacifica Larval and adult abundance
test showed that regression slopes did not differ signif- icantly (p > 0.05). Therefore, I compared the intercepts by using the mean mass adjusted for the grand mean length (17 m m ) . Thc seasonal trend in adjusted mean mass shows a reduction in length-specific mass every winter. Results of a l-way analysis of variance (ANOVA) showed that adjusted mean mass differed between years (p < 0.003). A subsequent comparison of means using Tukey's test (Wilkinson et al. 1996) indi- cated that this was because the adjusted group mean mass in 1996 (7.0 mg) was significantly (p < 0.02) greater than those for 1991 (5.8 mg) and 1992 (6.0 mg) . However, the biological significance of such a differ- ence is questionable.
Reproduction
I investigated interdnnual variations in reproductive rharart i . r ic t ic-c by examining the biological character-
Table 2 Euphaus~a p,icrf~cd \ lean annual abundances (no 111 j fnr larvde and adults
Year Larvae Adults -
19Ql-'42 479 101 ISSL-~-IJ 2723 2n I 1993-94 1205 197 1994-95 537 114 1995-Q6 1303 88 1996-'17 1286 102

sauop
are~l
@W
I POL
r(111el.1ou.1 pue
ql~
o1
6 JO
J pasn
apow
:X
~
swe.16o~
s1q
Am
anbaq o
-qlBuay ,e
~~
jpe
de
rsne
yd
ng
'64
2 v 9
(mu
) q18ual p~
ol
L .... .. .... ....
l ......
... ..
...
....... l,,, I
l.........'.
.... '.................lO
1

170 Mar Ecol Prog Ser 173. 163-180, 1998
Year
Fig. 10 Euphausla pac~f ica . Abundance of adults In arbitrary size cateqories
Age (days)
Fig. 11 Euphausia pacifica Growth and mortality trajectories
istics of the parents, spawning itself, the relationship broods of eggs Therefore, I assumed that the upper between larval and parental abundances, and the size llmit of the data distnbution defined maximum size- of larvae speciflc ovanan mass, in other words, npe ovanan
mass before any broods were released I estimated ovanan mass at specific total mass values along the
Adult reproductive characteristics upper limlt of the d~stnbution to generate the dataset for calculating year-specific maximum ovarian mass -
The reproductive charactenstlcs of the adults varied seasonally but not interannually Sex ratlos, expressed as the proportion of adults which were male, are pre-
20 sented in Flg 13 Results of a l-way ANOVA detected no difference (p = 0 59) in sex ratio between years The grand mean sex ratio over the study period was 0 56 The seasonal and interannual variation in length-at- ~ maturity, deflned as the medlan length of mature - 15
euphausiids, IS presented in Fig 14 In most years c (excluding 1992), there is a progressive increase in
E length-at-maturlty over a year In addltlon, there ap- c peared to be interannual differences I tested the effect " 10
of the apparent rhange in length at matunty by com- f v
panng observed adult abundances wlth those esti- 5 mated using the month-speclfic length-at-matur~ty @&+m &p /&hk A . data for 1991 (Fig 15) 1t appears that vanatlons in - -
5 length-at-matunty were too small to have any effect on adult abundance
Fig 16 shows the year-speciflc ovanan mass - total mass relationships There appears to be no relation-
- -
ship between total mass-specific ovanan mass and O 1991-1992 1993 1 9 9 4 1995 1996 1997
matunty stage In other words, there was no tendency Year
for unfert'isedl ferthsed Or gravid have F,g 12 E ~ u p n d u s ~ a paaf lca Total dry mass adlusted for the low Or high mass-speclflc Ovarian mass Ross et a1 grand mean adult length (17 mm) Error bars are 95% com- (1982) reported that Euphausla pacrfica releases panson 11rmts

Tanasichuk: Population biology and productivity of Euphausia pacifica 171
Year
/-:---: m > 8 - --. I-_. --
M A M J J A S O N D J F Month
Fig. 13. Euphausia pacifica. Sex ratios (prop. male) Fig. 14. Euphausia pacifica. Seasonal variation in length-at- maturity
total mass regressions. Results of an ANCOVA intensity of sampling confounds delineating spawn- showed that regression slopes differed significantly ings after 1993 because, retrospectively, it was deter- (p < 0.0001) between years. Parameter estimates for mined that the interval between sampling events was the year-specific ovarian mass - total mass regressions longer than the entire subadult phase for Euphausia are presented in Table 3. pacjflca. However, there was no apparent change in
spawning pattern between 1991, the pre-ENS0 year, and 1992 and 1993, the warm water years.
Spawning
Seasonal and interannual variation in proportion of males and females with spermatophores are shown in Fig. 17. The overall spawning sea- son, as defined by the period when females bore spermatophores, was March through October in all years. c Results of l-way ANOVAs, using E
0 arcsine-transformed proportions, in- 5 dicated no significant effect of year on the proportion of males (p = 0.46, 3 mean = 0.88) or females (p = 0.92, mean = 0.16) with spermatophores over the spawning season.
Fig. 18 shows the discrete spawn- ing as defined by the back-cal- culated birthdates of larvae. Be- tween 1991 and 1993, there were 2 or 3 protracted spawnings over the March-October period and some Year
very restricted SpawningS in NO- Fig. 15. Euphausia paafica. Abundance of adults using observed length-at-matu- vember and December. The reduced rity (0) and that for the 1991-92 sampling year (m)

172 Mar Ecol Prog Ser 173: 163-180, 1998
Ln total dry mass (rng) Month
Fig. 16. Euphausia pacifica. Scatterplots of ovarian dry mass versus total dry mass. U: unfertilized. F: fertilized. G: gravid Fig. 17 Eu~hausia ~acif ica. Proportion of males (0) and
females (m) with spermatophores
Month
Fig. 18. Euphausia pacifica. Timlng and duration of spawns
Stock-recruit relationshp
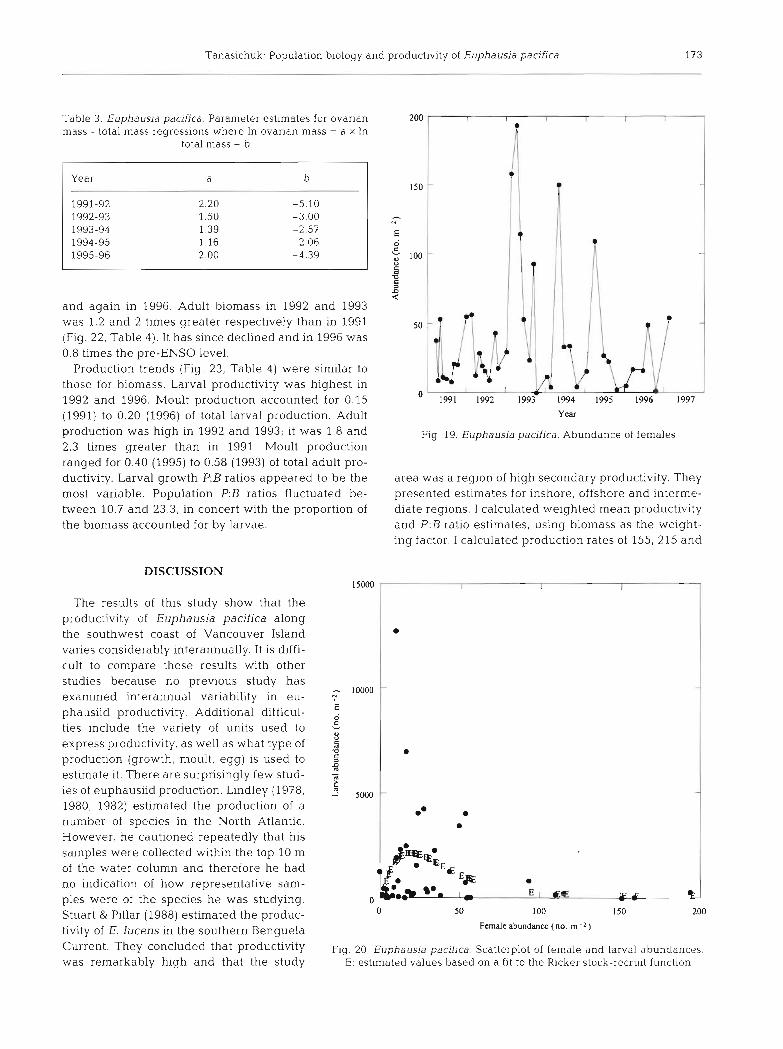
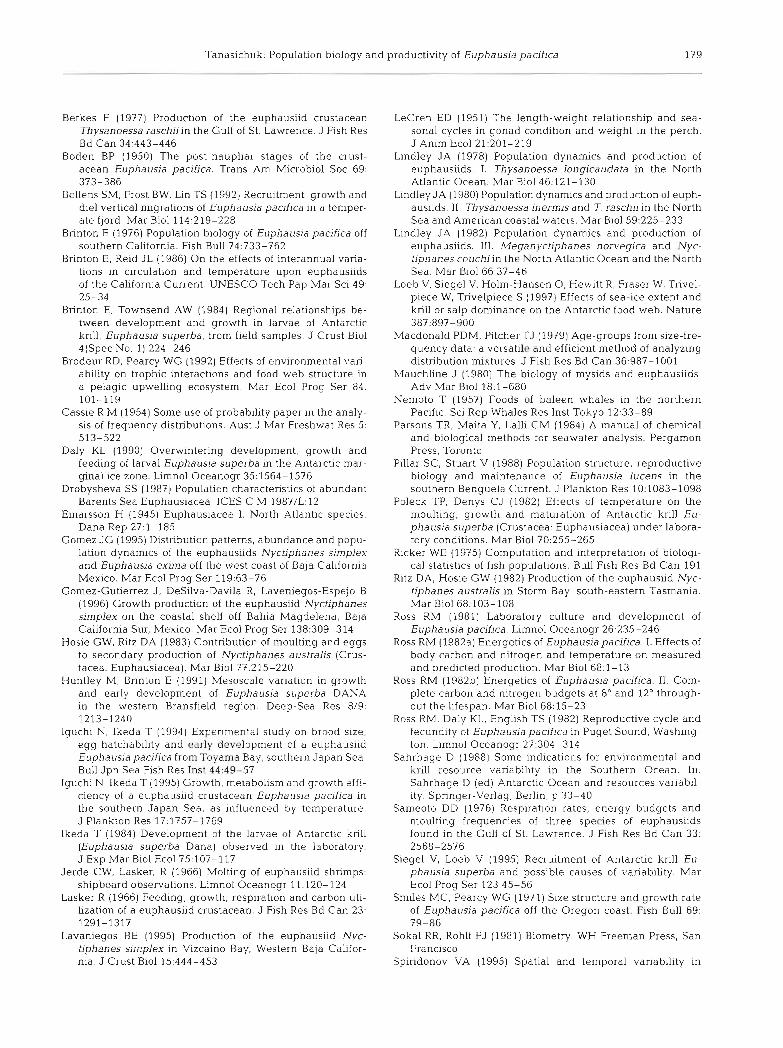
I used the estimates of adult abundance, sex ratio and maturity ogives to estimate the abun- dance of female parents over the study period (Fig. 19). Mean annual female parent abun- dances were 29, 37, 62, 48, 34 and 28 m-' for 1991 through 1996 respectively. I could de- scribe the relationship between parental and larval abundances using the Ricker stock- recruit relationship (Fig. 20). The equation was:
where R and P are recruit (larval) and parental abundances respectively.
Larval size
Mean total length of each larval stage is pre- sented in Fig. 21 There appeared to be no sea- sonality in mean larval size for any stage. Results of l-way ANOVAs showed no signifi- cant difference between years (p > 0.17 at least) for any larval stage.
Biomass and productivity
Larval biomass fluctuated over the study period (Fig. 22). It showed peaks in 1992, 1993
Tanasichuk: Population biology and productivity of Euphausia pacifica 173
Table 3. Euphausia pacifica. Parameter estimates for ovarian mass - total mass regressions where In ovarian mass = a X In
total mass + b
Year
1991-92 1992-93 1993-94 1994-95 1995-96
and again in 1996. Adult biomass in 1992 and 1993 was 1.2 and 2 times greater respectively than in 1991 (Fig. 22, Table 4). It has since declined and in 1996 was 0.8 times the pre-ENS0 level.
Production trends (Fig. 23, Ta'ble 4 ) were similar to those for biomass. Larval productivity was highest in 1992 and 1996. Moult production accounted for 0.15 (1991) to 0.20 (1996) of total larval production. Adult production was high in 1992 and 1993; it was 1.8 and 2.3 times greater than in 1991 Moult production ranged for 0.40 (1995) to 0.58 (1993) of total adult pro- ductivity. Larval growth P:B ratios appeared to be the most variable. Population P:B ratios fluctuated be- tween 10.7 and 23.3, in concert with the proportion of the biomass accounted for by larvae.
Year
Fig 19. Euphausia pacifica. Abundance of females
area was a region of high secondary productivity. They presented estimates for inshore, offshore and interme- diate regions. I calculated weighted mean productivity and P:B ratio estimates, using biomass as the weight- ing factor. I calculated production rates of 155, 215 and
DISCUSSION l5000 T I l
The results of this study show that the productivity of Euphausia pacifica along the southwest coast of Vancouver Island varies considerably interannually. It is diffi- cult to compare these results with other studies because no previous study has examined interannual variability in eu- phausiid productivity. Additional difficul- ties include the variety of units used to express productivity, as well as what type of production (growth, moult, egg) is used to estimate it. There are surprisingly few stud- ies of euphausiid production. Lindley (1978, 1980, 1982) estimated the production of a number of species in the North Atlantic. However, he cautioned repeatedly that his samples were collected within the top 10 m of the water column and therefore he had no indication of how representative sam- ples were of the species he was studying. Stuart & Pillar (1988) estimated the produc- tivity of E. lucens in the southern Benguela Current. They concluded that productivity was remarkably high and that the study
50 100 150
Female abundance (no. m - 2 )
Fig. 20. Euphausia pacifica. Scatterplot of female and larval abundances. E: estimated values based on a fit to the Ricker stock-recruit function

174 Mar Ecol Prog Ser 173: 163-180, 1998
L O 1991 1992 1993 1994 1995 1996 1997
Year
Fig. 21. Euphausia pacdlca. Variations in larval size [mean ? 2 SE)
10 mg dry mass m-3 yr-' for growth, moult and egg production respectively with an overall P:B of 11.5. By using the average tow depth of 100 m, I converted the growth and moulting production estimates for E. pacifica in Barkley Sound to 45-165 and 29-93 mg dry mass m-3 yr-' and estimated a P:B of 16.8 over all years. Ritz & IIosie (1982) and Hosie & Ritz (1983) studied the productivity of Nyctiphanes aus- tralis in Storm Bay, Tasmania. Total production (growth, moult and egg production) was esti- mated as 125 mg dry mass m-3 yr-' with a P:B of 23.1. Most recently, Lavaniegos (1995) examined the total production of N. simplex in Mexican waters. Lavaniegos reported 28 mg dry mass m-3 yr-' for growth, moult and egg production and a P : B of l?. Several productiv- ity studies considered growth only. I found that the growth P:B for E. pacifica ranged between 4.5 and 6.9, over all years, and averaged 5.8. Gomez-Gutierrez et al. (1996) estimated a growth production of 273 mg dry mass m-2 yr-' (P:B?.O) for N. simplexin Baja California, Mex- ico, waters. Berkes (1977) reported that the growth production of Thysanoessa raschii in the Gulf of St. Lawrence was 1.8 mg dry mass m-"r. ' with a P:B of 3.8.
I purposely ignored estimating egg produc- tion. Ross et al. (1982) reported that Euphausia pacifica can produce a large number of broods during the spawning season. However, the re1ationshi.p they provide between brood size and maternal mass indicates that brood size is poorly estimated. In addition, as pointed out by Stuart & Nicol (1986) and Stuart (1992), fecun- dity (annual egg production) also considers the number of broods produced, and the number of broods released by a female in nature is unknown. Ross et al. (1982) have been criti- cised because it is physiologically improbable that egg production at the rate they estimate is sustainable (Pillar & Stuart 1988). On the other hand, Stuart (1992) examined egg production by E. lucens in the laboratory. The conclusion was that egg production by E. lucens, and per- haps by many other euphausiid species, is con- siderably higher than previously thought. Because of this uncertainty surrounding egg production, I chose to be conservative and not to consider it in the productivity estimates I calculated.
Although it is of interest to compare produc- tivity estimates among different populations, i t is the interannual variation in euphausiid pro- d.uctivity which is crucial. The importance of

Tanasichuk: Population biology and productivity of Euphausia pacifica 175
I Larval
Year
Fig. 22. Euphausia pacifica. Larval and adult biomass
euphausiids to energy flow in a vast number of eco- systems has been commented on, yet no previous study has examined the interannual variability in eu- phausiid productivity. The cornpansons made above are in fact questionable because if these other popula- tions go through the same interannual variability I reported for Euphausia pacifjca then, without know- ing if these other populations are in high or low pro- ductivity states, comparisons are essentially meaning- less. The productivity of E. pacifica along the southwest coast of Vancouver Island varied consider- ably over the study period. Larval productivity in- creased by a factor of 8 in 1992, remained high in 1993, fell roughly by a factor of 4 over the next 2 years and in 1996 was comparable to the 1992 and 1993 high years. Adult total production doubled in 1992, was about 3 times the 1991 value in 1993 and de- clined to pre-ENS0 levels in 1996.
1 5 0 - - - - - . - 7- - -
? Larval . i
100 ; J I' ?
Year
Fig. 23. Euphausja paciiica. Larval and adult production. Dot- ted line indicates contribution of moults to total production
As indicated by Stuart & Pillar (1988), I found that the size composition of a euphausiid population can have a considerable effect on its production characteristics. Even though there are some interannual differences in P:B ratios for growth and moulting, most of the varia- tion in population P:B values appears to be a conse- quence of variations in the proportion of the population which is larval. The P:B ratios overall were much higher for larval growth. Therefore, changes in larval abundance (because I assume growth was not influ- enced; see below) essentially drive the overall P:B ratio for the population. Lavaniegos (1995) reported that lar- vae accounted for most of the somatic production for Nyctiphanes simplex, except in the fall; 1-7 mm size classes contributed 93% of the total production. Ross (1982a) reported that weight-specific production in Euphausia pacifica decreased with increasing mass after C3. She concluded that E. pacifica conformed
Table 4 . Euphausia pacjfjca. Mean annual biomass (mg dry mass m " ) , production (mg dry mass m 2 y r ) and P:B ratios. Popula-
Year
- -
1991-92 1992-93 1993-94 1994-95 1995-96 1996-97
tion P:B values were calculated using the sums of biomass and productivity for larvae and adults
Larvae Adults Population Biomass Production P:B Biomass Production P:B P B
Growth Moult Total Growth Moult Growth Moult Total Growth Moult -- -
22 1416 243 1659 65.4 11.2 678 3091 2710 5801 4.6 4.0 10 7 190 10769 2205 12974 56.7 11.6 823 5649 4780 10428 6.9 5.8 23.1 I l l 7894 1609 9503 70.9 14.4 1340 5571 7739 13310 4.2 5.8 15.7 20 1515 238 1751 76.8 12.0 744 4521 3239 7760 6.1 4.4 12.5 39 2442 381 2823 62.8 9.8 677 4390 2970 7360 6.5 4 4 14.2
195 8624 217610800 44.2 11.1 521 3329 2597 5926 6.4 5.0 23 3

176 Mar Ecol Prog Ser 173: 163-180, 1998
with the generalization that there IS greater weight- specific production for smaller individuals as com- pared with larger ones.
I suggest that the enhanced productivity of Euphau- sia pacifica in 1992 and 1993, the warm water years, was not a consequence of changes in water tempera- ture but due to exceptionally high upwelling in 1992. It appears that a very large and successful cohort was produced in July-August. All I report here is simply a strong cohort moving through the population. The results I presented support Brinton's (1976) observa- tion of good recruitments of E. pacifica along the southern California coast coinciding with significant upwelling events. The relationship between favour- able upwelling and recruitment success may be ex- plained by Ikeda (1984). He reported that larval E. superba have a critical period during which they must be able to feed adequately. Recruitment success could therefore depend on the overlap between such a criti- cal period and phytoplankton levels, which in turn would be dependent on upwelling intensity. Daly (1990) reported that young E. superba larvae were very sensitive to food type and availability; lab exper- iments showed that the first feeding larvae (calyptopis I) did not survive delayed food availability (Ikeda 1984, Ross & Quentin 1989, cited in Daly 1990) or when fed small flagellates (Ross et al. 3.988, cited in Daly 1990). She suggested that fluctuatjons in recruit- ment may be due to small changes in growth rate. This would operate through the interrelationship between growth rate and survival, with good food conditions reducing the amount of time larvae would be expected to be exposed to the highest predation rates.
There are few studies (e.g. Brinton 1976) which have monitored abundance over extended periods, and Brinton's work purposely focused on years with mini- mal variations in sea temperature. Drobysheva (1987) described cyclical changes in Barents Sea euphausiids over a long (30 yr) time penod. He concluded that Thysanoessa inermis is influenced by abiotic condi- tions and T. raschii by biotic interrelationships. He suggested that T. raschii abundance increased in rela- tively cold years because of the spatial separation of predators (cod and capelin). Brinton & Reid (1986) reported marked changes in euphausiid abundances and species compositions in the southern California- Baja California coastal region. They suggested that these were a consequence of anomalous warming which resulted in more favourable conditions for the more southerly species (e.g. Nyctiphanes simplex). Euphausia pacifica biomass was a factor of 10 lower and N. simplex biomass was 5 times greater They reported no change in the biological characteristics of the euphausiids, just changes in abundance. The
results of Brodeur & Pearcy (1992) suggest that this effect extended to Washington at least. Sahrhage (1988) reported the same observation for E. superba. It appears that the situation along the southwest coast of Vancouver Island mirrors that described by Brinton & Reid. I found no changes in the growth and reproduc- tive characteristics of E. pacifica during the study period. The interannual differences in production appear to be generated by a strong recruitment in the summer of 1992, a period of strong upwelling.
The apparent importance of environmental effects (upwelhng) to recruitment success of Euphausia paci- fica seems contradictory to the existence of a stock- recruit relationship. However, the Ricker relationship indicated that there is a negative relationship between parental and larval abundances at relatively high parental abundances. This hints at the possibility of cannibalism at higher parental abundances. In addi- tion, Fig. 20 shows that the exceptionally high larval abundance was produced at a relatively low parental abundance. The significant proportionality constant (304), the environmental effect parameter of the Ricker equation, supports the intervening effect of upwelling. Siegel & Loeb (1995) examined recruitment variability in E. superba. They concluded that recruitment suc- cess may ultimately be a consequence of environmen- tal factors (ice cover) rather than krill population char- acteristics. Brinton (1976) suggested, that production of food associated with the upwelling period was impor- tant for recruitment success of E. pacifica off southern California; he implied no relationship between spawner and recruit abundances. Siegel & Loeb (1995) reported no relationship between a krill recruitment index and the previous year's stock density or index. Loeb et al. (1997) found that interannual fluctuations in krill abundance result largely from variations in year- class success.
As for many other studies which examined the popu- lation biology of euphausiids at low- to mid-latitudes, I found it d.ifficult to develop growth trajectories which are biologically realistic. Consequently, I could not examine interannual growth variations because I could not confidently construct annual growth trajectories. There are 3 major problems. First, there is the difficulty in segregating out multimodal distributions. As dis- cussed below, there is no procedure which does this objectively for euphausilds, alth.ough MULTIFAN (see below) shows good promise. The second difficulty is to develop biologically realistic growth trajectories. Only Brinton (1976) has attempted to examine growth and mortality simultaneously so that there would be some confidence that the time series of modes selected to describe growth are biologically realistic because they also generate a biologically reasonable mortality tra- jectory. Lindley (1982) points out how errors in assign-

Tanasichuk: Population biology and productivity of Euphausia pacifica l??
ing modes to 'cohorts' can occur. Finally, one must con- sider the effect of size-selective predation. Young et al. (1993) described the trophic relationship between krill Nyctiphanes australis and mackerel Trachurus declivis off eastern Tasmania. They reported a strong negative selection for smaller size classes and a strong positive selection of larger krill throughout the study period. Bollens et al. (1992) discussed the implications of size- selective predation on estimating euphausiid growth. They noted that growth estimates are based on surviv- ing euphausiids. There has been a subtle change in E. pacifica size composition along the southwest coast of Vancouver Island which could affect determining growth functions. As shown in Fig. 10, there have been virtually no large E. pacifica (>24 mm) since 1992. In 1992, there was a large increase in the biomass of Pacific hake A'lerluccius productus, the dominant planktivore. Accompanying the increase in hake was the appearance of jack Trachurus symmetricus and Pacific Scomber japonicus mackerel which have remained. This change in planktivorous fish abun- dance occurred when the maximum size of E. pacifica decreased. The suggestion here is that size-selective predation is influencing E. pacifica size composition and ultimately the growth trajectories derived from the size data.
Variations in length-specific mass suggested that there were no changes in growth. A common statistic used in fisheries science is the condition factor (LeCren 1951) which 'describes the state of well-being' of an animal. I suggest that the lack of interannual variabil- ity in the length-specific mass, a substitute for the con- dition factor, indicates that growth conditions were comparable for Euphausia pacifica over years. How- ever, although my examination of condition shows no differences in mass-at-length, it provides no informa- tion on growth rate. Poleck & Denys (1982) reported an increased growth rate with increasing temperature for E. superba held in the laboratory. They caution that this higher growth rate with increased temperature would only occur with adequate phytoplankton abun- dances.
It appears that temperature had no specific effect on Euphausia pacifica reproductive characteristics. Sex ratio fluctuated randomly within years and showed no interannual variations. The high proportion of males bearing spermatophores in this study suggests that spermatophore production is rapid and essentially con- tinuous. Mauchline (1980) pointed out that spermato- phore attachment may not necessarily result in fertil- ization; he speculated that spermatophore attachment may be necessary for final oocyte maturation as well. In addition, females moult about every 5 d and conse- quently shed spermatophores along with the exuvia. (Stuart 119921 suggests this is why E. lucens males
have 2 ripe spermatophores throughout the year.) These points argue in favour of a higher proportion of males. However, the consistent high proportion of males with spermatophores, and the observed equal sex ratio, suggests that spermatophore production pro- vided by an equal number of males is adequate. Mauchline (1980) summarized work on euphausiid sex ratios. He concluded that the male to female ratio in the majority of species throughout most of the year is probably in the range of unity to 0.7:l.O. He also points out that because females generally attain a larger size, the sex ratio favours females in the larger size cate- gories. The increase in length-at-maturity appears to reflect the growth of recruit spawners. The temporal trend in size-at-maturity agrees with observations made for E, pacifica in Puget Sound, Washington, by Ross et al. (1982). Their results suggest that females did not mature until the second year of life. Astthorsson (1990) reported that Thysanoessa raschi recruits began developing secondary sexual characteristics in late winter and the reduction of length-at-maturity then in E. pacifica may reflect this as well. In contrast, Pillar & Stuart (1988) and Gomez (1995) reported a reduction in length-at-maturity over the summer for E. lucens and Nyctiphanes siniplex respectively, which suggests an attainment of sexual maturation at a much earlier age. I observed, as did others (e.g. Einarsson 1945, Nemoto 1957), a regression of secondary sexual char- acteristics in larger euphausiids; however, their rela- tive abundance was apparently too low to affect the maturity ogive. The results I present show that there has been no interannual difference in size-at-maturity. I found no test which would allow me to compare length-at-maturity effectively. Therefore, I plotted parental abundance using the sampling-specific matu- rity ogive, as well as that for 1991-92. There is virtually no difference in the abundance estimates, suggesting no change in maturity ogives.
The plots of ovarian mass versus total mass support batch spawning in Euphausia pacifica. It appears that ovarian mass has no effect on maturity state. In other words, females with ovarian masses less than the total mass-specific maximum can be fertilized or gravid. This suggests a release of eggs, a maturation of a sub- sequent batch, followed by refertilization and other spawning, which then reflects Stuart & Nicol's (1986) suggestion for E. hanseni, E. lucens and Nyctiphanes capensis. Hosie & Ritz (1983) and Gomez (1995) observed eggs at various stages of maturity in N. aus- tralis and N. simplex respectively.
There also appears to have been no interannual vari- ation in larval size. Le Roux (1976, cited in Mauchline 1980) demonstrated marked annual variation in the body size of 3 calyptopes of Meganyctiphanes norvegica and Nyctiphanes couchi in the Gulf of

178 Mar Ecol Prog Ser 173: 163-180, 1998
Mariban, France. Huntley & Brinton (1991) reported location differences in the size of Euphausia superba larvae. They attributed the enhanced rates of develop- ment and growth in Gerlache Strait to relatively high chlorophyll concentrations. Brinton & Townsend (1984) reported similar results in that larval body sizes were small at low chlorophyll concentrations and large at high concentrations. They suggested that there was likely a stronger relatlonshlp between larval size and chlorophyll concentrations than for adults because adults can move into favourable water. Einarsson (1945) suggested that latitudinal variations in larval size would be due to growth and development being affected differently by temperature in such a way that larvae grew more rapidly than they moved through developmental stages.
Another important conclusion of this study is that spawnings, by Euphausia pacifica along Vancouver Island at least, are discrete events. (The approach I used was similar to that developed by Spiridonov [l9951 for E. superba. However, his objective was to determine the start, end and intensity of annual spawning whereas my goal was to determine if dis- crete spawnings could be defined.) This means that at least the E. pacifica population along the southwest coast of Vancouver Island has a cohort (age) structure. This has a considerable number of implications. Most important is that mid-latitude euphausiid populations may consist of a number of cohorts of different ages. Therefore, the number of cohorts within a length- frequency distribution can be known and biologically realistic growth and mortality trajectories are esti- mable. All previous studies determined the number of modes subjectively, whether they used probability paper (Cassie 1954) or the procedure developed by Macdonald & Pitcher (1979). It is unclear how biologi- cally realistic they are because no one has related this back to a number of spawnings in a given year and hence the number of cohorts which should exist. After identifying ranges of birthdates which are statistically different from each other, I put considerable effort into developing a procedure which objectively assigns modes to cohorts. The most promising approach was to use MULTIFAN in a way similar to that described by Baelde (1994) for deep-water royal red prawns Hali- poroides sibogae. MULTIFAN will define specific dis- tributions in a multi-modal length frequency distribu- tion as cohorts (age classes) by assuming von Bertalanffy growth, which is normally assumed for eu- phausiids, while simultaneously determining the mean and variance of each distribution. The current diffi- culty to overcome is to modify MULTIFAN so that it can consider that more than 2 cohorts are produced in a year. This work is continuing. The goal is to develop cohort-specific growth and mortality trajectories. I
would use these to estimate productivity by acknowl- edging the cohort structure of southwest coast Vancou- ver Island euphausiid populations, and then compare the production estimates with those presented here, which are done conventionally and ignore euphausiid cohort structure. The ultimate goal is to determine if the way euphausiid productivity is estimated now, which appears not to be particularly biologically realis- tic, is biased by ignonng euphausiid age structure. This has considerable implications for understanding euphausiid biology as well as trophic studies and ecosystem models which consider euphausiids.
Because of problems with segregating modes and assigning modes to cohorts over time in a biologically realistic way, I am suspicious of the 'age' assigned to euphausiids by earlier workers. It may still be the case, as Mauchline stated in 1980 for Euphausia superba, that in most euphausiid species, growth rates and longevity are actually still unknown. Therefore, I have avoided comparing growth rates and have not esti- mated age-at-maturity.
In summary, the results of this study show that the production of Euphausia pacifica along the southwest coast of Vancouver Island varies considerably between years. It appears that it was the strong upwelling in 1992 and the consequential production of an excep- tionally strong recruitment, and its movement through the population, that was responsible for the large pro- ductivity changes. Some avenues of study in fisheries oceanography include developing ecosystems models. In light of these results, the variation in euphausiid productivity must be considered and quantified before meaningful models of marine ecosystems can be developed.
Acknowledgements Flrst J thank Parks Canada for funding most of the work I thank Bob Redhead, Dan Ware. Melinda Whitaker, Carol Cooper, the staff at the Bamf~eld Manne Sta- tion, and Ulf Baamstedt and the Department of Fishenes and Manne B~ology at the Universit\ of R ~ r q ~ n for then support and help I also thank those who took the time to revlew my work and for t h e ~ r valuable comments Finally, I dedicate this paper to the memory of John Boom Boomer was the Research Co-ordinator of the Bamf~eld Marine Station when he was lost at sea on Fc bruary 25, 1996 John became a cher- shed fnend over the tlme we collected my euphausud sam- ples together I and many others m s s hlm very much Using h s phrasing, John Boom was a fine man'
LITERATURE CITED
Astthorsson A (1990) Ecology of the euphausiids nysanoessa raschn, T i n e r m s and Meganyctiphanes norveglca In the Isafjord-deep, northwest Iceland. Mar Blol 10?:147-157
Baelde P (1994) Growth, mortahty and yield-per-recruit of deep-water royal red prawns (Haliporoides s~bogae ) off eastern Australia, using the length-based MULTIFAN method. Mar Biol 118.617-625
Tanasichuk: Population biology an ~d productivity of Euphausia pacifica 179
Berkes F (1977) Production of the euphausiid crustacean Thysanoessa raschiiin the Gulf of St. Lawrence. J Fish Res Bd Can 34:443-446
Boden BP (1950) The post-naupliar stages of the crust- acean Euphausia pacifica. Trans Am Microbial Soc 69: 373-386
Bollens SM, Frost BW, Lin TS (1992) Recruitment, growth and die1 vertical migrations of Euphausia pacifica in a temper- ate fjord. Mar Biol 114:219-228
Brinton E (1976) Population biology of Euphausia pacifjca off southern California. Fish Bull 74:733-762
Brinton E, Reid JL (1986) On the effects of interannual varia- tions in circulation and temperature upon euphausiids of the California Current. UNESCO Tech Pap Mar SCI 49. 25-34
Brinton E, Townsend AW (1984) Regional relationships be- tween development and growth in larvae of Antarctic krill, Euphausia superba, from field samples. J Crust Biol 4(Spec No. 1):224-246
Brodeur RD, Pearcy WG (1992) Effects of environmental vaii- ability on trophic interactions and food web structure in a pelagjc upwelling ecosystem. Mar Ecol Prog Ser 84: 101-119
Cassie R M (1954) Some use of probability paper in the analy- sis of frequency distributions. Aust J Mar Freshwat Res 5- 513-522
Daly KL (1990) Overwintering development, growth and feeding of larval Euphausia superba in the Antarctic mar- ginal ice zone. Limnol Oceanogr 35:1564-1576
Drobysheva SS (1987) Population characteristics of abundant Barents Sea Euphausiacea. ICES C M 1987/L:12
Einarsson H (1945) Euphausiacea I. North Atlantic species. Dana Rep 27:l-185
Gomez JG (1995) Distribution patterns, abundance and popu- lation dynamics of the euphausiids Nyctiphanes simplex and Euphausia exima off rhe west coast of Baja California Mexico. Mar Ecol Prog Ser 119:63-76
Comez-Gutierrez J , DeSilva-Davila R, Laveniegos-Espejo B (1996) Growth production of the euphausiid Nyctiphanes simplex on the coastal shelf off Bahia Magdelena, Bala California Sur, Mexico. Mar Ecol Prog Ser 138:309-314
Hosie GW, Ritz DA (1983) Contribution of moulting and eggs to secondary production of Nyctiphanes australis (Crus- tacea: Euphausiacea). Mar Biol77:215-220
Huntley M, Brinton E (1991) Mesoscale variation in growth and early development of Euphausia superba DANA in the western Bransfield region. Deep-Sea Res 8/9. 1213-1240
Iguchi N, Ikeda T (1994) Experimental study on brood size, egg hatchabil~ty and early development of a euphausiid Euphausia paclhca from Toyama Bay, southern Japan Sea. Bull Jpn Sea Fish Res Inst 44:49-57
Iguchi N, Ikeda T (1995) Growth, metabolism and growth effi- ciency of a euphausiid crustacean Euphausla pacifica in the southern Japan Sea, as influenced by temperature. J Plankton Res 17.1757- 1769
Ikeda T (1984) Development of the larvae of Antarctic knll (Euphausia superba Dana) observed in the laboratory. J Exp Mar Biol Ecol75:107-117
Jerde CW, Lasker. R (1966) Molting of euphausiid shrimps: shipboard observations. Limnol Oceanogr 11: 120- 124
Lasker R (1966) Feeding, growth, respiration and carbon uti- lization of a euphausiid crustacean. J Fish Res Bd Can 23: 1291-1317
Lavaniegos BE (1995) Production of the euphausiid Nyc- tiphanes simplex in Vizcaino Bay, Western Baja Califor- nia. J Crust Biol 15:444-453
LeCren ED (1951) The length-weight relationship and sea- sonal cycles in gonad condition and weight in the perch. J Anim Ecol21:201-219
Lindley JA (1978) Population dynamics and production of euphausiids. I. Thysanoessa longicdudata in the North Atlantic Ocean. Mar Biol46:121-130
Lindley JA (1980) Population dynamics and production of euph- ausiids. 11. Thysanoessa inermis and 7 raschii in the North Sea and American coastal waters. Mar Biol59:225-233
Lindley JA (1982) Population dynamics and production of euphausiids. 111. Meganyctiphanes norvegica and Nyc- tiphanes couchi in the North Atlantic Ocean and the North Sea. Mar Biol 66:37-46
Loeb V, Siegel V, Holm-Hansen 0, Hewitt R, Fraser W, Trivel- piece W, Trivelpiece S (1997) Effects of sea-ice extent and krill or salp dominance on the Antarctic food web. Nature 387:897-900
Macdonald PDM, Pitcher TJ (1979) Age-groups from size-fre- quency data: a versatile and efficient method of analyzing distnbution mixtures. J Fish Res Bd Can 36:987-1001
Mauchline J (1980) The biology of mysids and euphausiids. Adv Mar Biol 18:l-680
Nemoto T (1957) Foods of baleen whales in the northern Pacific. Sci Rep Whales Res Inst Tokyo 12.33-89
Parsons TR, Maita Y . Lalli CM (1984) A manual of chemical and biological methods for seawater analysis. Pergamon Press, Toronto
Pillar SC. Stuart V (1988) Population structure, reproductive biology and maintenance of Euphausia lucens in the southern Benguela Current. J Plankton Res 10:1083-1098
Poleck TP, Denys CJ (1982) Effects of temperature on the moulting, growth and maturation of Antarctic krill Eu- phausia superba (Crustacea: Euphausiacea) under labora- tory conditions. Mar Biol70:255-265
Ricker WE (1975) Computation and interpretation of biologi- cal statistics of fish populations. Bull Fish Res Bd Can 191
Ritz DA. Hosie GW (1982) Production of the euphausiid Nyc- tiphanes australis in Storm Bay, south-eastern Tasmania. Mar Biol 68:103-108
Ross RM (1981) Laboratory culture and development of Euphausia pacifica. Limnol Oceanogr 26:235-246
Ross RM (1982a) Energetics of Euphausiapacifica. I. Effects of body carbon and nitrogen and temperature on measured and predicted production. Mar Biol68:l-13
Ross RM (1982b) Energetics of Euphausia pacifica. 11. Com- plete carbon and nitrogen budgets at 8' and 12" through- out the lifespan. Mar Biol 68:15-23
Ross RIM, Daly KL, English TS (1982) Reproductive cycle and fecundity of Euphausia pacifica in Puget Sound, Washing- ton. Limnol Oceanogr 27:304-314
Sahrhage D (1988) Some indications for environmental and krill resource variability in the Southern Ocean. In: Sahrhage D (ed) Antarctic Ocean and resources variabil- ity. Springer-Verlag, Berlin. p 33-40
Sameoto DD (1976) Respiration rates, energy budgets and moulting frequencies of three species of euphausiids found in the Gulf of St. Lawrence. J Fish Res Bd Can 33: 2568-2576
Siegel V. Loeb V (1995) Recruitment of Antarctic krill Eu- phausia superba and possible causes of variability. Mar Ecol Prog Ser 123:45-56
Smiles MC, Pearcy WG (1971) S ~ z e structure and growth rate of Euphausia pacifica off the Oregon coast. Fish Bull 69. 79-86
Sokal RR, Rohlf FJ (1981) Biometry. WH Freeman Press, San Francisco
Spiridonov VA (1995) Spatial and temporal variability in

180 Mar Ecol Prog Ser 173: 163-180, 1998
reproductive timing of Antarctic knll (Euphaus~a superba DANA) Polar Blol 15 161-174
Stuart V (1992) Fecund~ty of Euphausia lucens- evidence for multiple broods J Exp Mar Biol Ecol 160 221-228
Stuart V, Nicol S (1986) The reproductive potenhal of three euphausiid species from the southern Benguela reglon J Exp h4ar Biol Ecol 103 267-274
Stuart V, Pillar SC (1988) Growth and production of Euphau- sia lucens In the southern Benguela Current J Plankton Res 10 1099-1112
Summers PL (1993) Llfe hlstory growth and agemg of Thysano- essa sprnlfera MSc t h e m Umvers~ty of V~ctona Victona BC
SYSTAT (1994) SYSTAT for Wlndoxvs statistics Vers~on 5 edn SYSTAT, Inc, Evanston, IL
E d ~ t o n a l responslbdity: Otto Klnne (Editor), Oldendorf/Luhe, Germany
Tanasichuk RW, Ware DM, Shaw W, McFarlane GA (1991) Vanation in the d ~ e t , daily ration and feedlng penodlcity of Paclf~c hake (Merlucclus productus) and splny dogflsh (Squalus acanthlas) off the lower west coast of Vancouver Island Can J F ~ s h Aquat SCI 48 2118-2128
Thomson RE, Ware DM (1996) A current veloc~ty lndex of ocean vanahllity J Geophys Res C6 14297-14310
Wllklnson L, Blank G , Gruber C (1996) Desktop data analys~s with SYSTAT Prentice Hall, Upper Saddle Rlver, NJ
Young JW, Jordan AR, B o b b ~ C , Johannes RE, Haskard K Pullen C; (1993) Seasonal and interannual vanablhty In knll (Nyctlphanes australis) stocks and thelr relationship to the flshery for lack mackerel (Trachurus dechv~s ) off eastern Tasmanla Australia Mar Biol 116.9-18
Submitted: January 17, 1997; Accepted: April 15, 1998 Proofs received from author(s): October 9, 1998