Pace Oil and Gas Investor Presentation
28
An Intermediate-Sized Real Growth Company Oil Growth Drives Cash Flow Investor Update | 2011 Year End | March 2012 “BUILDING A TOP TIER ENERGY COMPANY, BUILDING IN GROWTH, BUILDING UP VALUE.”
-
Upload
company-spotlight -
Category
Investor Relations
-
view
897 -
download
1
description
Transcript of Pace Oil and Gas Investor Presentation
An Intermediate-Sized
Real Growth Company Oil Growth Drives Cash Flow
Inv
esto
r U
pd
ate
| 2
011 Y
ear
En
d
| M
arc
h 2
012
“BUILDING A TOP TIER ENERGY COMPANY,
BUILDING IN GROWTH, BUILDING UP VALUE.”
2 PACE OIL & GAS | Q4 & YE UPDATE | MARCH 2012
Forward Looking Statements
Forward-Looking Statements: This presentation contains certain forward-looking statements and forward-looking
information (collectively referred to herein as "forward-looking statements") within the meaning of applicable Canadian
securities laws. All statements other than statements of present or historical fact are forward-looking statements. In some
cases, forward-looking statements can be identified by terminology such as "may", "will", "should", "believes", "expects",
"intends", "projects", "plans", "anticipates", “positions”, “potential”, “objective”, “continuous”, “ongoing”, "estimates" or
"contains" or similar words or the negative thereof. In particular, this presentation contains forward-looking statements
relating to: the estimated production of Pace Oil & Gas Ltd. (“Pace”), the estimated reserves of Pace Oil & Gas Ltd., the
estimated pro-forma funds from operation of Pace Oil & Gas Ltd., the expected credit facility available to Pace Oil & Gas
Ltd., the anticipated number of wells and completions to be carried out, the anticipated replacement production from our
new completions, the expected reserve additions, future plans and expenditures of Pace Oil & Gas Ltd., the forecasted
commodity prices.
These statements represent management's expectations or beliefs concerning, among other things, future capital
expenditures and future operating results and various components thereof or the economic performance of Pace and
include, without limitation, statements with respect to the future financial position, business strategy, budgets, projected
costs and plans, objectives of or involving Pace or any of its respective affiliates; access to credit facilities; capital taxes;
income taxes; commodity prices; administration costs; commodity price risk management activities; expectation of future
production rates and components of cash flow and earnings. Actual events or results may differ materially. The
projections, estimates and beliefs contained in such forward-looking statements are based on management's estimates,
opinions and assumptions at the time the statements were made including assumptions relating to the production
performance of Pace’s oil and gas assets, the cost and competition for services throughout the oil and gas industry in
2012 and beyond and the continuation of the current regulatory and tax regime in Canada, and necessarily involve known
and unknown risks and uncertainties which may cause actual performance and financial results in future periods to differ
materially from any projections of future performance or results expressed or implied by such forward-looking statements.
Accordingly, readers are cautioned that events or circumstances could cause results to differ materially from those
predicted. Pace does not undertake to update any forward-looking information contained in this presentation whether as
to new information, future events or otherwise except as required by securities rules and regulations. Barrels of Oil
Equivalency: Barrels of oil equivalent (BOE's) may be misleading, particularly if used in isolation. In accordance with NI
51-101, a BOE conversion ratio for natural gas of 6 Mcf:1 bbl has been used, which is based on an energy equivalency
conversion method primarily applicable at the burner tip and does not represent a value equivalency at the wellhead.
PACE OIL & GAS | Q4 & YE UPDATE | MARCH 2012 3
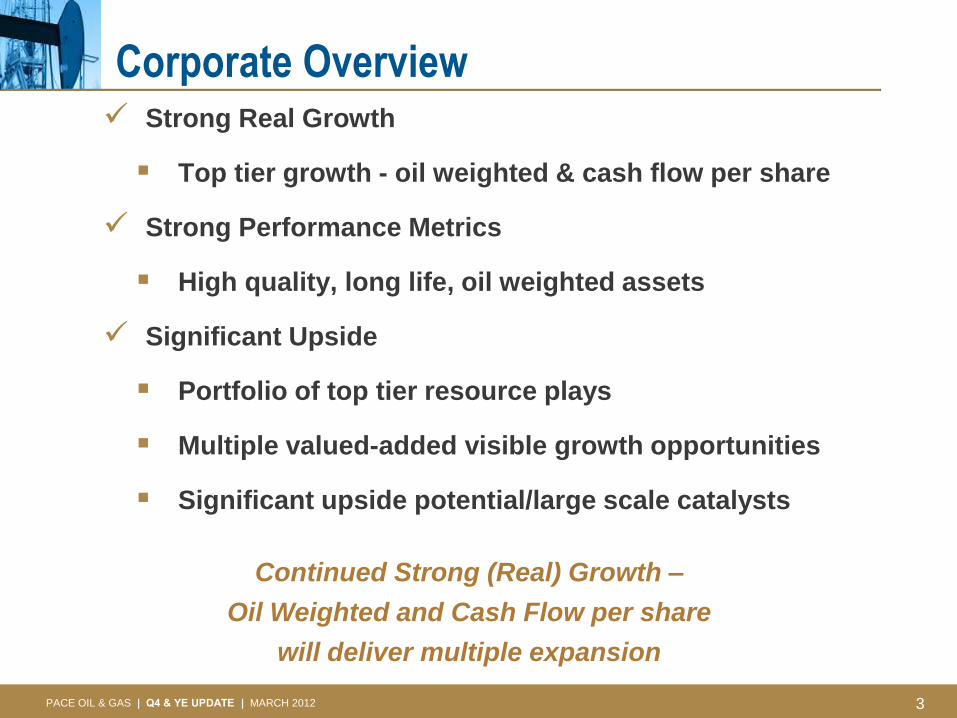
Corporate Overview Strong Real Growth
Top tier growth - oil weighted & cash flow per share
Strong Performance Metrics
High quality, long life, oil weighted assets
Significant Upside
Portfolio of top tier resource plays
Multiple valued-added visible growth opportunities
Significant upside potential/large scale catalysts
Continued Strong (Real) Growth –
Oil Weighted and Cash Flow per share
will deliver multiple expansion

PACE OIL & GAS | Q4 & YE UPDATE | MARCH 2012 4
Corporate Highlights
Current – December 31, 2011
Basic Shares Outstanding (mm) 47.2
FD Shares Outstanding (mm) 51.0
Bank Debt (mm) $151
Net Debt (mm) $186
Credit Facility (mm) (1) $275
Proved Reserves (mmboe) (2) 44.5
2P Reserves (mmboe) (2) ~50% Oil 69.6
2012 Outlook (3)
Est. Production (boe/d) 14,500 - 15,250
Oil & NGLs (bbls/d) 7,200 - 7,500
CapEx 2012 (mm) $90 - 100
Production Mix 50% - 52% Oil 1. Banking syndicate - CIBC, NBF, BMO, BNS, HSBC, ATB – renewed December 2011
2. Reserves December 31, 2011 evaluated by McDaniels & Associates Consultants Ltd.
3. $95/bbl WTI, $3.00/mcf AECO
PACE OIL & GAS | Q4 & YE UPDATE | MARCH 2012 5
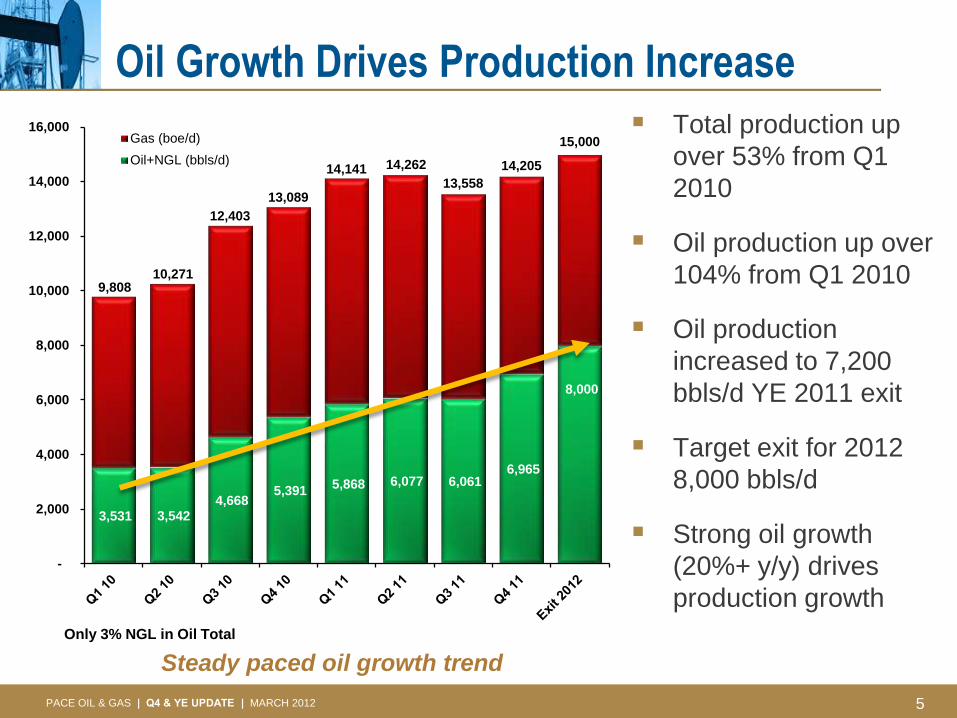
3,531 3,542 4,668
5,391 5,868 6,077 6,061
6,965
8,000
9,808 10,271
12,403
13,089
14,141 14,262
13,558
14,205
15,000
-
2,000
4,000
6,000
8,000
10,000
12,000
14,000
16,000Gas (boe/d)
Oil+NGL (bbls/d)
Oil Growth Drives Production Increase
Total production up
over 53% from Q1
2010
Oil production up over
104% from Q1 2010
Oil production
increased to 7,200
bbls/d YE 2011 exit
Target exit for 2012
8,000 bbls/d
Strong oil growth
(20%+ y/y) drives
production growth
Only 3% NGL in Oil Total
Steady paced oil growth trend
PACE OIL & GAS | Q4 & YE UPDATE | MARCH 2012 6
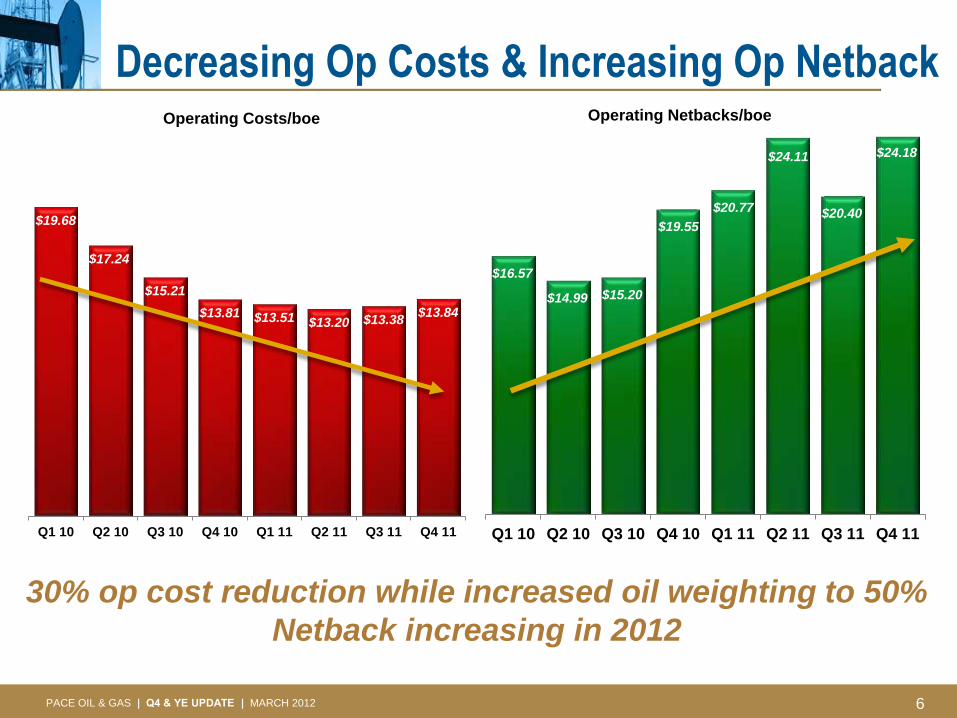
Decreasing Op Costs & Increasing Op Netback
30% op cost reduction while increased oil weighting to 50%
Netback increasing in 2012
$19.68
$17.24
$15.21
$13.81 $13.51 $13.20 $13.38 $13.84
Q1 10 Q2 10 Q3 10 Q4 10 Q1 11 Q2 11 Q3 11 Q4 11
Operating Costs/boe
$16.57
$14.99 $15.20
$19.55
$20.77
$24.11
$20.40
$24.18
Q1 10 Q2 10 Q3 10 Q4 10 Q1 11 Q2 11 Q3 11 Q4 11
Operating Netbacks/boe

PACE OIL & GAS | Q4 & YE UPDATE | MARCH 2012 7
Pace Delivered Top Finding Costs
2011 2010
$/boe Proved Proved Plus
Probable Proved
Proved Plus
Probable
E&D Capital $ 16.19 $ 15.81 $ 13.10 $ 12.91
Change in future capital (0.02) 1.23 (1.10) 4.29
F&D Costs $ 16.17 $ 17.04 $ 12.00 $ 17.20
A&D Capital $ 23.26 $ 7.36 $ 15.25 $ 10.05
A&D FDCs - - 4.79 4.87
A&D Costs $ 23.26 $ 7.36 $ 20.03 $ 14.93
Total Capital $ 16.11 $ 16.09 $ 14.65 $ 10.63
Change in future capital (0.02) 1.27 3.16 4.75
FD&A Costs $ 16.09 $ 17.36 $ 17.81 $ 15.39
% Reserve Adds by Product
Oil 75% 53% 62% 52%
NGLs 4% 7% 1% 1%
Natural Gas 21% 40% 37% 47%
100% 100% 100% 100%
Pace replaced 268% of oil & NGLs proven production – Over 2.1x recycle
ratio on weighted average netback by product
PACE OIL & GAS | Q4 & YE UPDATE | MARCH 2012 8
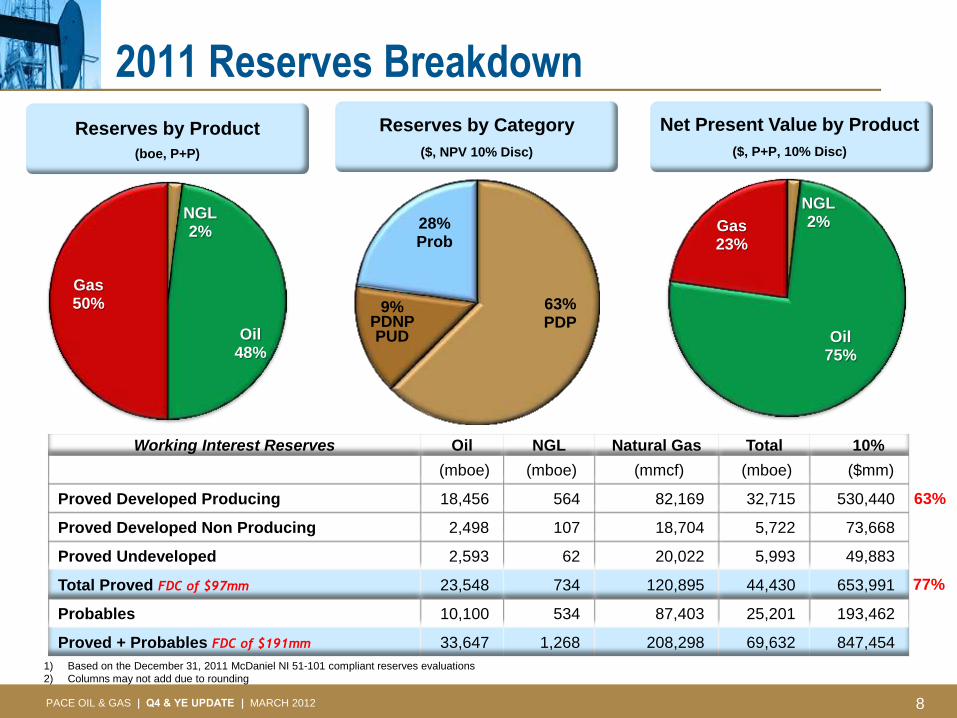
2011 Reserves Breakdown
Reserves by Product
(boe, P+P)
Reserves by Category
($, NPV 10% Disc)
Net Present Value by Product
($, P+P, 10% Disc)
NGL 2%
Oil 48%
Gas 50%
NGL 2%
Oil 75%
Gas 23%
63% PDP
9% PDNP PUD
28% Prob
Working Interest Reserves Oil NGL Natural Gas Total 10%
(mboe) (mboe) (mmcf) (mboe) ($mm)
Proved Developed Producing 18,456 564 82,169 32,715 530,440
Proved Developed Non Producing 2,498 107 18,704 5,722 73,668
Proved Undeveloped 2,593 62 20,022 5,993 49,883
Total Proved FDC of $97mm 23,548 734 120,895 44,430 653,991
Probables 10,100 534 87,403 25,201 193,462
Proved + Probables FDC of $191mm 33,647 1,268 208,298 69,632 847,454
63%
77%
1) Based on the December 31, 2011 McDaniel NI 51-101 compliant reserves evaluations
2) Columns may not add due to rounding

PACE OIL & GAS | Q4 & YE UPDATE | MARCH 2012 9
Proved PV10 $13.85 / share
Probable PV10 4.10 / share
2P PV10 $17.95 / share
Pace Underlying Value
Each common share owns
1.48 boe of reserves
(0.71 bbl of oil)
2011 Net Asset Value - ($mm) PDP Total P
Oil P+P
BT 10% reserve value (1) 530 534 $ 847
Less: net debt (186.1) (186.1) (186.1)
Add: undeveloped land value (354,000 acres @ $250/acre) (2) 88.5 88.5 88.5
Add: seismic and other assets 2.9 2.9 2.9
Net asset value $ 752.7
Shares outstanding (mm basic) 47.2 47.2 47.2
10 NAV/Share $9.22 $9.30 $ 15.95
(1) McDaniels & Associates Forecast Price & Costs (12/31/2011)
(2) Internal value estimate
NGL 2%
Oil 75%
Gas 23%
PACE OIL & GAS | Q4 & YE UPDATE | MARCH 2012 10
0%
10%
20%
30%
40%
50%
60%
70%
80%
90%
% Liquids
0
10
20
30
40
50
60Operating Netback
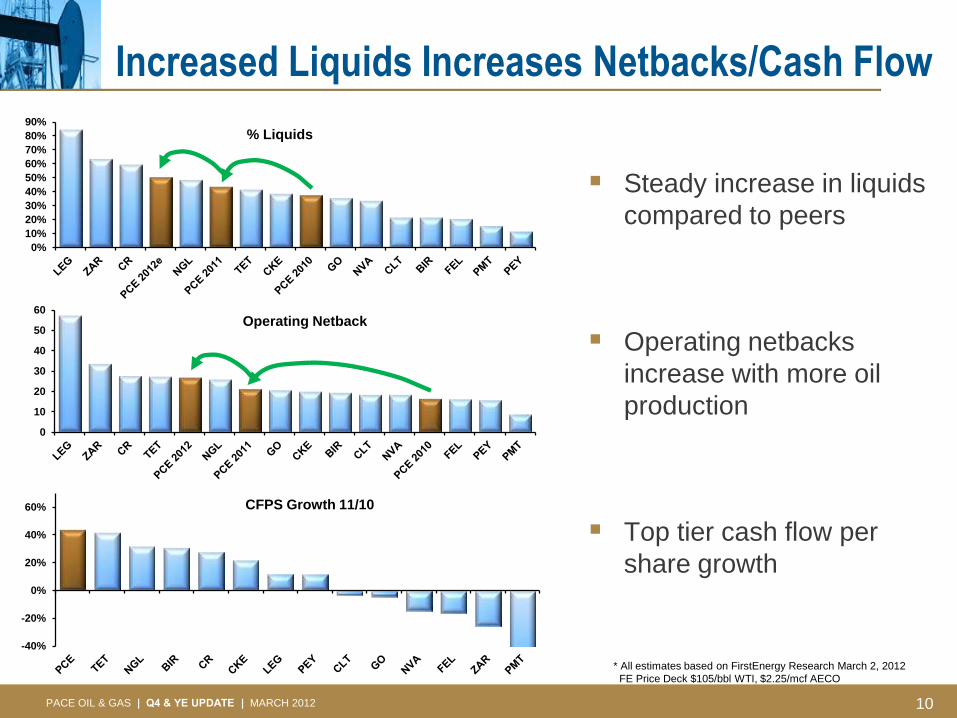
Increased Liquids Increases Netbacks/Cash Flow
Steady increase in liquids
compared to peers
Operating netbacks
increase with more oil
production
Top tier cash flow per
share growth
* All estimates based on FirstEnergy Research March 2, 2012
FE Price Deck $105/bbl WTI, $2.25/mcf AECO
-40%
-20%
0%
20%
40%
60% CFPS Growth 11/10
PACE OIL & GAS | Q4 & YE UPDATE | MARCH 2012 11
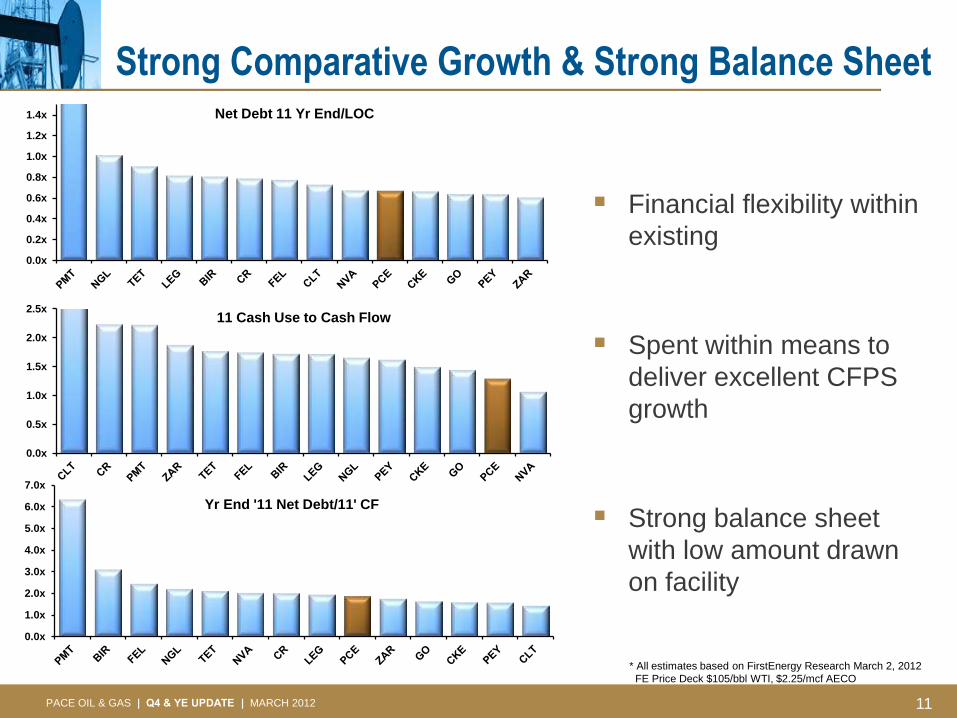
Strong Comparative Growth & Strong Balance Sheet
Financial flexibility within
existing
Spent within means to
deliver excellent CFPS
growth
Strong balance sheet
with low amount drawn
on facility
* All estimates based on FirstEnergy Research March 2, 2012
FE Price Deck $105/bbl WTI, $2.25/mcf AECO
0.0x
0.5x
1.0x
1.5x
2.0x
2.5x11 Cash Use to Cash Flow
0.0x
0.2x
0.4x
0.6x
0.8x
1.0x
1.2x
1.4x Net Debt 11 Yr End/LOC
0.0x
1.0x
2.0x
3.0x
4.0x
5.0x
6.0x
7.0x
Yr End '11 Net Debt/11' CF

PACE OIL & GAS | Q4 & YE UPDATE | MARCH 2012 12
Strong Results & Exceptional Value
Pace trades at low
multiple compared to
peer group
At peer group average,
Pace shares equate to
$12 – $15
Solid oil (real) growth will
drive multiple expansion
* All estimates based on FirstEnergy Research March 2, 2012
Pace closing price on March 2, 2012 - $5.67
-
20,000
40,000
60,000
80,000
100,000
120,000
140,000EV/2012 boe/d
0.0x
2.0x
4.0x
6.0x
8.0x
10.0x
12.0x
14.0xEV/2012 DACF
0.0x
2.0x
4.0x
6.0x
8.0x
10.0x
12.0x
14.0xPrice/2012 CF

PACE OIL & GAS | Q4 & YE UPDATE | MARCH 2012 13
Significant Upside & Visible Long Term Growth Areas
Key Attributes
Play Type Project
Capital
MM$
Gross
Operated
Wells
Net Wells
Southern
Alberta
Glauconite
Lithic
Pekisko
Waterflood
$35 – 40 24 18
Dixonville Montney C
Waterflood
$15 – 20 3 3
Red Earth Slave Point $15 – 20 2 2
Northwest
Alberta
Pekisko $10 4 4
Total Oil $75 - 90 33 27
Deep Basin $5 - -
Land,
Seismic, G&A
other
$15 – 25
Grand Total $90 - 100 33 27
High Working Interest
Operational Control
CapEx to match Cash Flow
2012 CapEx directed towards oil program
PACE OIL & GAS | Q4 & YE UPDATE | MARCH 2012 14
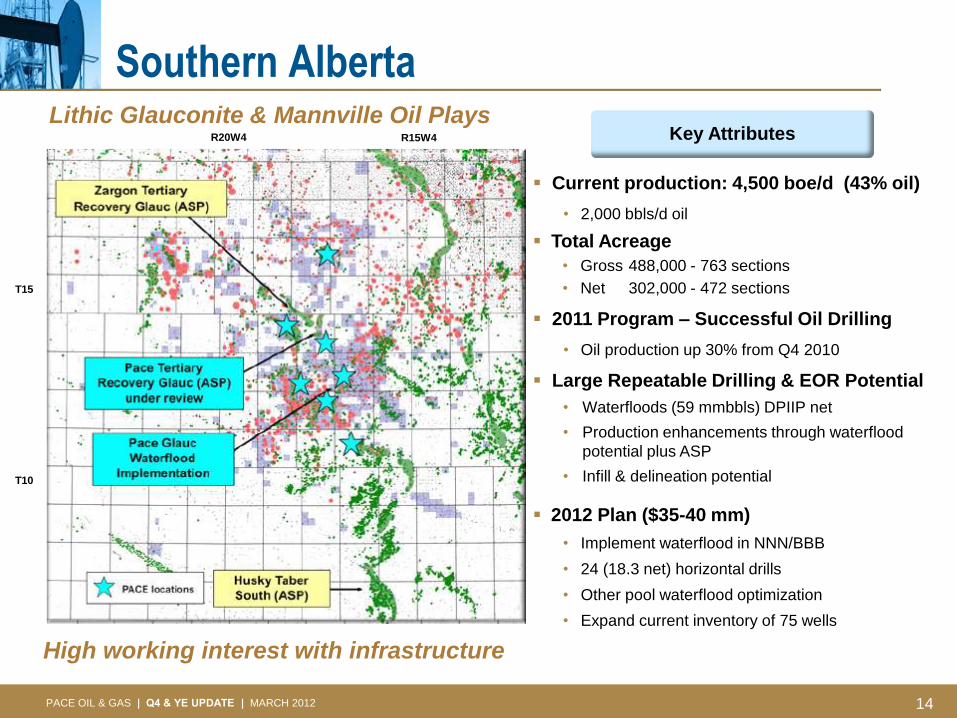
Southern Alberta
Current production: 4,500 boe/d (43% oil)
• 2,000 bbls/d oil
Total Acreage
• Gross 488,000 - 763 sections
• Net 302,000 - 472 sections
2011 Program – Successful Oil Drilling
• Oil production up 30% from Q4 2010
Large Repeatable Drilling & EOR Potential
• Waterfloods (59 mmbbls) DPIIP net
• Production enhancements through waterflood
potential plus ASP
• Infill & delineation potential
2012 Plan ($35-40 mm)
• Implement waterflood in NNN/BBB
• 24 (18.3 net) horizontal drills
• Other pool waterflood optimization
• Expand current inventory of 75 wells
Key Attributes Lithic Glauconite & Mannville Oil Plays
High working interest with infrastructure
T10
T15
R20W4 R15W4

PACE OIL & GAS | Q4 & YE UPDATE | MARCH 2012 15
Southern Alberta - Economics
Play Type Curve
D,C, Equip $1.9 mm
Production, boe/d (IP 30 day) 130
Reserves (mboe) 125
NPV 10%($mm/well) $2.0
Profit to Investment 1.05
Rate of Return 56%
Reserve Cost ($/boe) $15.25
Netback (1st year) ($/boe) $54.40
$97/bbl WTI, $3.50/mcf AECO
0
100
200
300
400
500
0 12 24
BO
E/D
Months
Type Curve
R19W4 R17W4
T14
T12
Successful 2011 drilling program drives oil growth
2012 Plan ($30 mm+/-)
• 24 (18.3 net) horizontal drills
• Expand current inventory of 75 wells

PACE OIL & GAS | Q4 & YE UPDATE | MARCH 2012 16
NNN & BBB Production Forecast
Implement waterflood in NNN/BBB
• 400 bbl/d production adds forecasted
• 52% IRR, 1.5 mmbbls PDP additions
Infill horizontals possible once pressures
restored
Other pool waterflood optimization
Additional ASP potential
-1000
0
1000
2000
3000
4000
5000
0
200
400
600
800
1000Retlaw Unit WF Forecast
Cal Day Oil
Water Inj, bwpd
R17W4 R18W4
T13
T12
2012 Plan ($5 mm net capital)
PACE OIL & GAS | Q4 & YE UPDATE | MARCH 2012 17
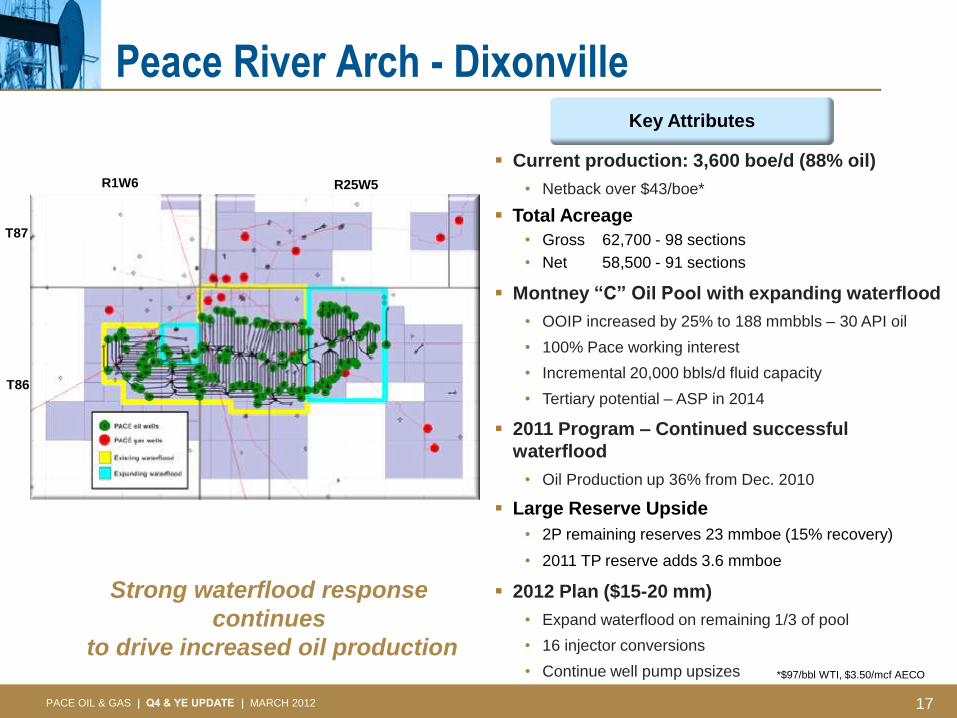
Peace River Arch - Dixonville Key Attributes
Current production: 3,600 boe/d (88% oil)
• Netback over $43/boe*
Total Acreage
• Gross 62,700 - 98 sections
• Net 58,500 - 91 sections
Montney “C” Oil Pool with expanding waterflood
• OOIP increased by 25% to 188 mmbbls – 30 API oil
• 100% Pace working interest
• Incremental 20,000 bbls/d fluid capacity
• Tertiary potential – ASP in 2014
2011 Program – Continued successful
waterflood
• Oil Production up 36% from Dec. 2010
Large Reserve Upside
• 2P remaining reserves 23 mmboe (15% recovery)
• 2011 TP reserve adds 3.6 mmboe
2012 Plan ($15-20 mm)
• Expand waterflood on remaining 1/3 of pool
• 16 injector conversions
• Continue well pump upsizes
Strong waterflood response
continues
to drive increased oil production *$97/bbl WTI, $3.50/mcf AECO
R1W6 R25W5
T87
T86

PACE OIL & GAS | Q4 & YE UPDATE | MARCH 2012 18
Dixonville: Montney C Reservoir Simulation
Waterflood response exceeds base case (booked reserves) and current model
3,200 bbls/d
Prod, 5.7 Prod, 5.7 Prod, 5.7
1P, 16.2 1P, 16.2 1P, 16.2
2P, 7.0 2P, 7.0 2P, 7.0
Upside, 9.4 Upside, 9.4
Tertiary, 28.2
15%
20%
35%
-
0.05
0.10
0.15
0.20
0.25
0.30
0.35
0.40
0
10
20
30
40
50
60
70
Base Case WaterfloodOptimization
EUR (SP)
ULT
IMA
TE R
ECO
VER
Y O
F O
OIP
(%
)
REM
AIN
ING
REC
OV
ERA
BLE
OIL
(M
MB
BL)
DIXONVILLE: MONTNEY C
Prod 1P 2P Upside Total OOIP Rec.

PACE OIL & GAS | Q4 & YE UPDATE | MARCH 2012 19
Peace River Arch - Red Earth Area
Southern Alberta
Current Production: 590 bbls/d (oil)
Total Acreage
• Gross 72,800 - 114 sections
• Net 51,800 – 81 sections
Top Quality light oil property
• Netback > $60/boe*
Slave Point Resource Play
• High industry activity
• Gross 42,800 (32,200 net) acres
2012 Plan ($15-20 mm)
• Drill 2 Hz wells & test 4 wells
• Create Slave Point program for Q4 2012
• Current inventory of 50 wells & growing
Key Attributes
*$97/bbl WTI, $3.50/mcf AECO
T88
R7W5
T86
R9W5
PACE OIL & GAS | Q4 & YE UPDATE | MARCH 2012 20
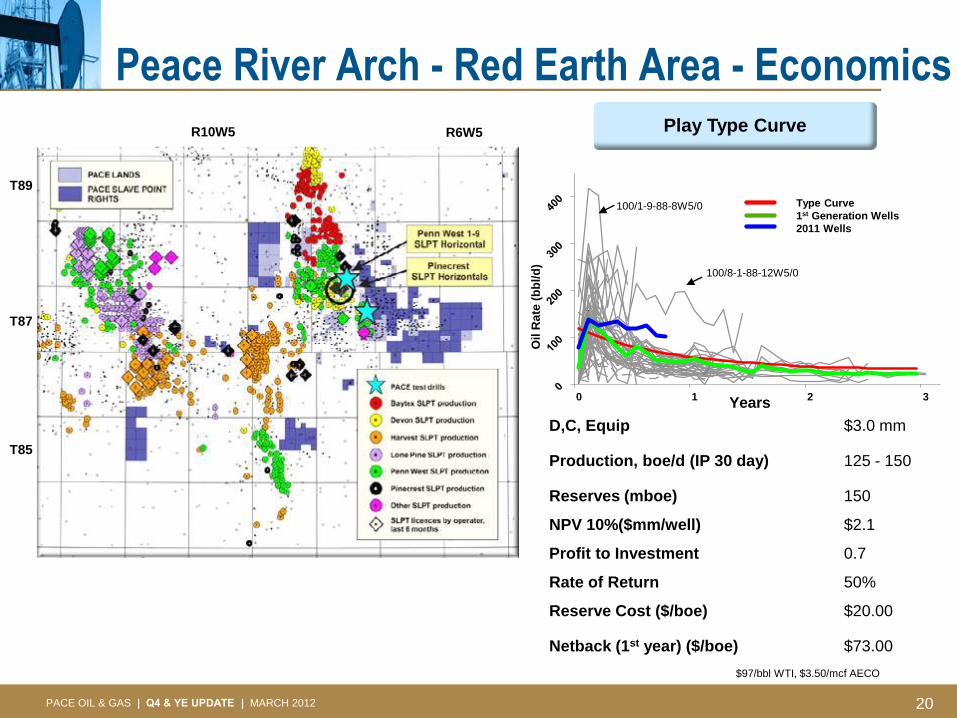
Peace River Arch - Red Earth Area - Economics
0 1 2 3
Oil
Ra
te (
bb
l/d
)
Years
100/1-9-88-8W5/0
100/8-1-88-12W5/0
Southern Alberta
Play Type Curve
D,C, Equip $3.0 mm
Production, boe/d (IP 30 day) 125 - 150
Reserves (mboe) 150
NPV 10%($mm/well) $2.1
Profit to Investment 0.7
Rate of Return 50%
Reserve Cost ($/boe) $20.00
Netback (1st year) ($/boe) $73.00
$97/bbl WTI, $3.50/mcf AECO
Type Curve
1st Generation Wells
2011 Wells
R10W5 R6W5
T85
T87
T89
PACE OIL & GAS | Q4 & YE UPDATE | MARCH 2012 21
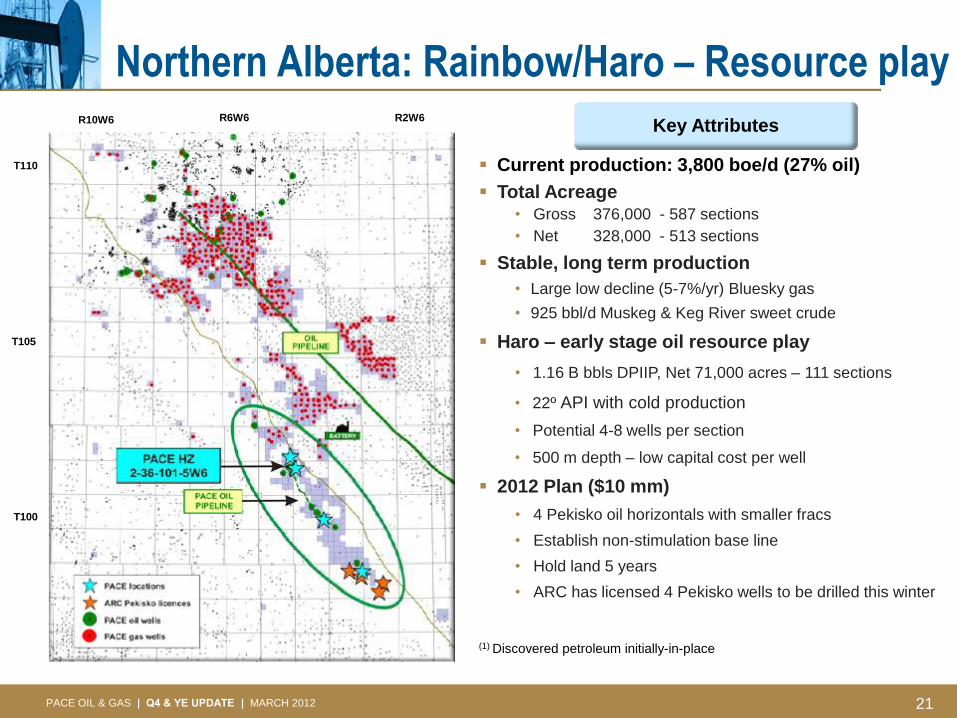
Northern Alberta: Rainbow/Haro – Resource play
Key Attributes
Current production: 3,800 boe/d (27% oil)
Total Acreage • Gross 376,000 - 587 sections
• Net 328,000 - 513 sections
Stable, long term production
• Large low decline (5-7%/yr) Bluesky gas
• 925 bbl/d Muskeg & Keg River sweet crude
Haro – early stage oil resource play
• 1.16 B bbls DPIIP, Net 71,000 acres – 111 sections
• 22º API with cold production
• Potential 4-8 wells per section
• 500 m depth – low capital cost per well
2012 Plan ($10 mm)
• 4 Pekisko oil horizontals with smaller fracs
• Establish non-stimulation base line
• Hold land 5 years
• ARC has licensed 4 Pekisko wells to be drilled this winter
(1) Discovered petroleum initially-in-place
R10W6 R6W6 R2W6
T110
T105
T100
PACE OIL & GAS | Q4 & YE UPDATE | MARCH 2012 22
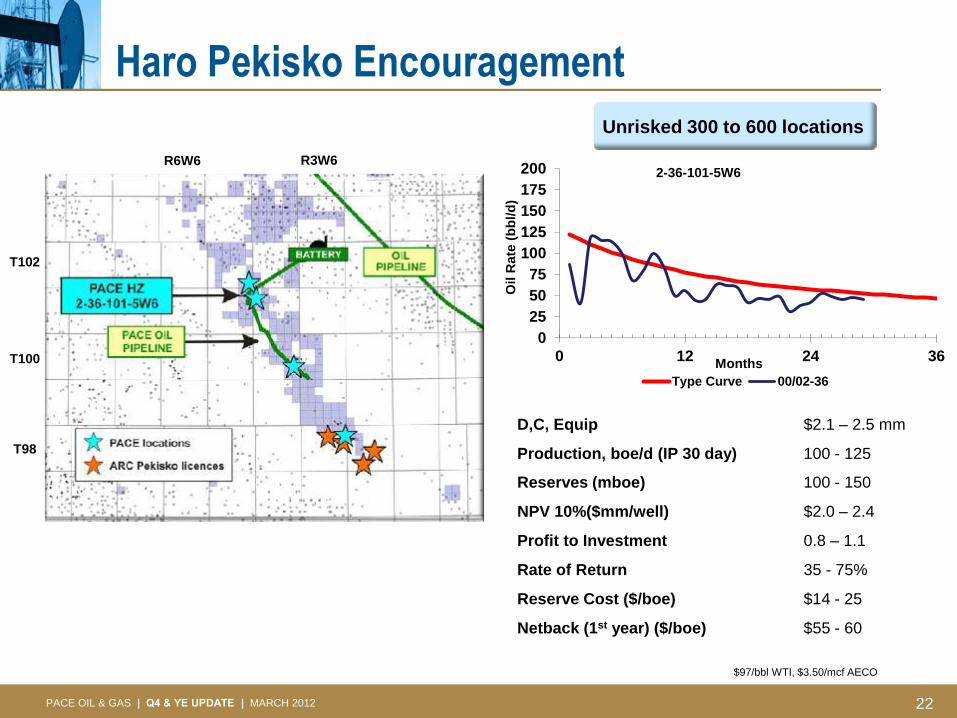
Haro Pekisko Encouragement
Unrisked 300 to 600 locations
0
25
50
75
100
125
150
175
200
0 12 24 36
Oil R
ate
(b
bl/d
)
Months
Type Curve 00/02-36
D,C, Equip $2.1 – 2.5 mm
Production, boe/d (IP 30 day) 100 - 125
Reserves (mboe) 100 - 150
NPV 10%($mm/well) $2.0 – 2.4
Profit to Investment 0.8 – 1.1
Rate of Return 35 - 75%
Reserve Cost ($/boe) $14 - 25
Netback (1st year) ($/boe) $55 - 60
2-36-101-5W6
$97/bbl WTI, $3.50/mcf AECO
R3W6 R6W6
T100
T98
T102
PACE OIL & GAS | Q4 & YE UPDATE | MARCH 2012 23
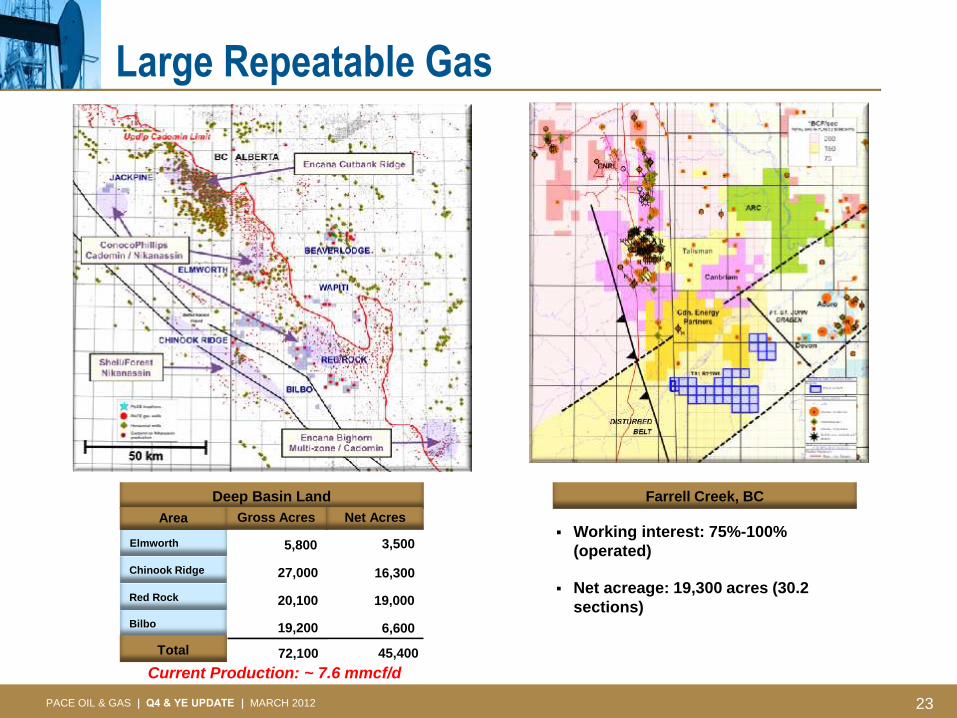
Large Repeatable Gas
Current Production: ~ 7.6 mmcf/d
16,300 Chinook Ridge
Deep Basin Land
Elmworth 3,500
Red Rock 19,000
Bilbo 6,600
5,800
27,000
20,100
19,200
Gross Acres Net Acres Area
Total 72,100 45,400
Working interest: 75%-100%
(operated)
Net acreage: 19,300 acres (30.2
sections)
Farrell Creek, BC
PACE OIL & GAS | Q4 & YE UPDATE | MARCH 2012 24
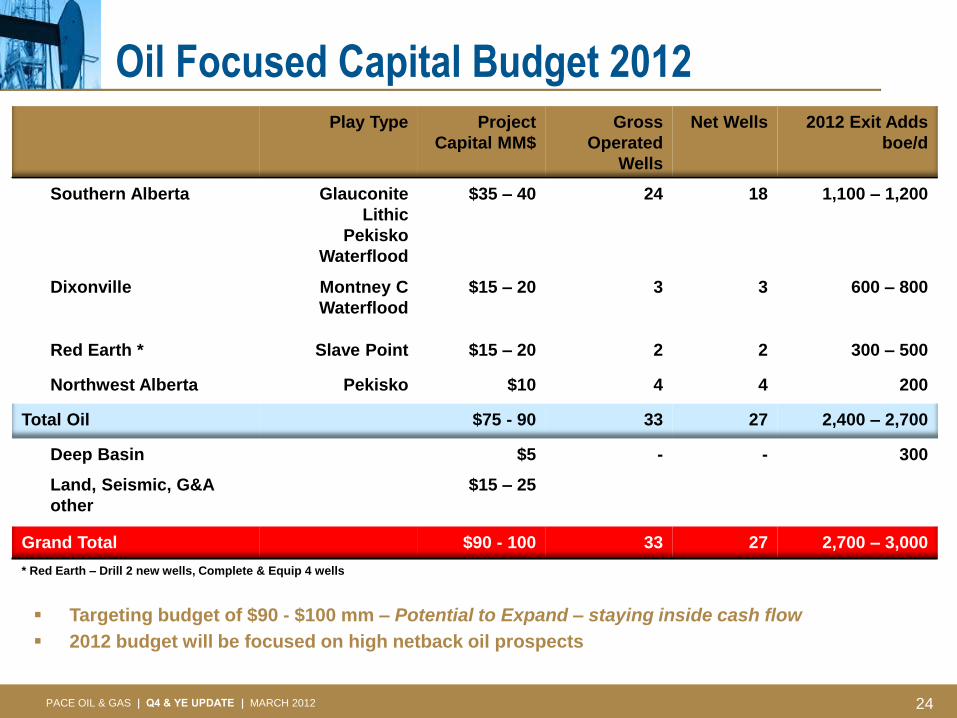
Oil Focused Capital Budget 2012 Play Type Project
Capital MM$
Gross
Operated
Wells
Net Wells 2012 Exit Adds
boe/d
Southern Alberta Glauconite
Lithic
Pekisko
Waterflood
$35 – 40 24 18 1,100 – 1,200
Dixonville Montney C
Waterflood
$15 – 20 3 3 600 – 800
Red Earth * Slave Point $15 – 20 2 2 300 – 500
Northwest Alberta Pekisko $10 4 4 200
Total Oil $75 - 90 33 27 2,400 – 2,700
Deep Basin $5 - - 300
Land, Seismic, G&A
other
$15 – 25
Grand Total $90 - 100 33 27 2,700 – 3,000
* Red Earth – Drill 2 new wells, Complete & Equip 4 wells
Targeting budget of $90 - $100 mm – Potential to Expand – staying inside cash flow
2012 budget will be focused on high netback oil prospects
PACE OIL & GAS | Q4 & YE UPDATE | MARCH 2012 25
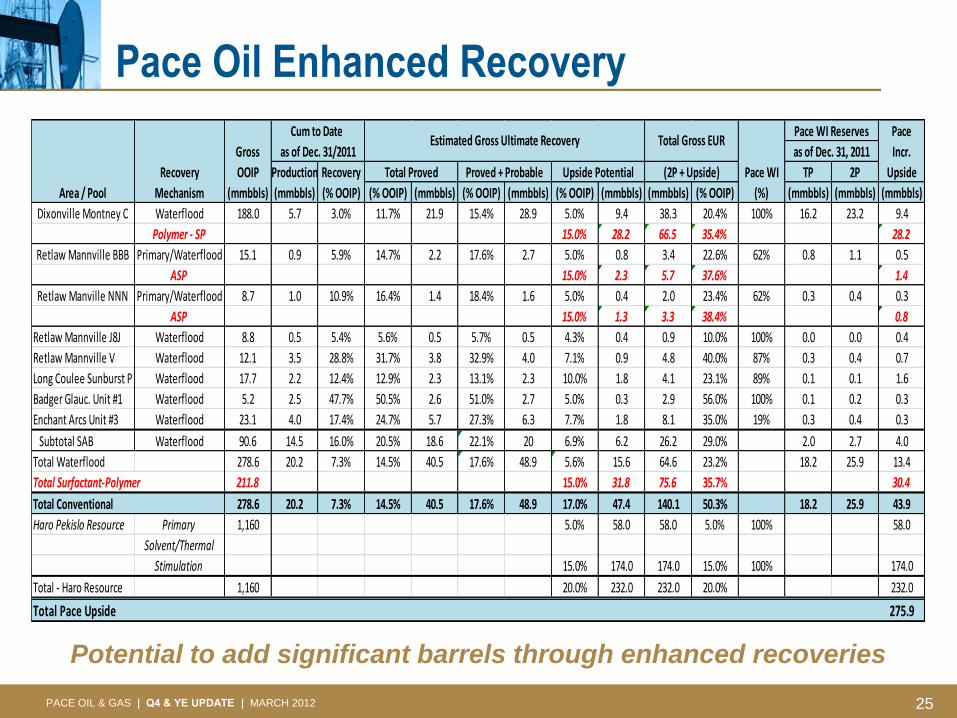
Pace Oil Enhanced Recovery
Potential to add significant barrels through enhanced recoveries
Pace
Gross Incr.
Recovery OOIP Production Recovery Pace WI TP 2P Upside
Area / Pool Mechanism (mmbbls) (mmbbls) (% OOIP) (% OOIP) (mmbbls) (% OOIP) (mmbbls) (% OOIP) (mmbbls) (mmbbls) (% OOIP) (%) (mmbbls) (mmbbls) (mmbbls)
Dixonville Montney C Waterflood 188.0 5.7 3.0% 11.7% 21.9 15.4% 28.9 5.0% 9.4 38.3 20.4% 100% 16.2 23.2 9.4
Polymer - SP 15.0% 28.2 66.5 35.4% 28.2
Retlaw Mannville BBB Primary/Waterflood 15.1 0.9 5.9% 14.7% 2.2 17.6% 2.7 5.0% 0.8 3.4 22.6% 62% 0.8 1.1 0.5
ASP 15.0% 2.3 5.7 37.6% 1.4
Retlaw Manville NNN Primary/Waterflood 8.7 1.0 10.9% 16.4% 1.4 18.4% 1.6 5.0% 0.4 2.0 23.4% 62% 0.3 0.4 0.3
ASP 15.0% 1.3 3.3 38.4% 0.8
Retlaw Mannville J8J Waterflood 8.8 0.5 5.4% 5.6% 0.5 5.7% 0.5 4.3% 0.4 0.9 10.0% 100% 0.0 0.0 0.4
Retlaw Mannville V Waterflood 12.1 3.5 28.8% 31.7% 3.8 32.9% 4.0 7.1% 0.9 4.8 40.0% 87% 0.3 0.4 0.7
Long Coulee Sunburst P Waterflood 17.7 2.2 12.4% 12.9% 2.3 13.1% 2.3 10.0% 1.8 4.1 23.1% 89% 0.1 0.1 1.6
Badger Glauc. Unit #1 Waterflood 5.2 2.5 47.7% 50.5% 2.6 51.0% 2.7 5.0% 0.3 2.9 56.0% 100% 0.1 0.2 0.3
Enchant Arcs Unit #3 Waterflood 23.1 4.0 17.4% 24.7% 5.7 27.3% 6.3 7.7% 1.8 8.1 35.0% 19% 0.3 0.4 0.3
Subtotal SAB Waterflood 90.6 14.5 16.0% 20.5% 18.6 22.1% 20 6.9% 6.2 26.2 29.0% 2.0 2.7 4.0
Total Waterflood 278.6 20.2 7.3% 14.5% 40.5 17.6% 48.9 5.6% 15.6 64.6 23.2% 18.2 25.9 13.4
Total Surfactant-Polymer 211.8 15.0% 31.8 75.6 35.7% 30.4
Total Conventional 278.6 20.2 7.3% 14.5% 40.5 17.6% 48.9 17.0% 47.4 140.1 50.3% 18.2 25.9 43.9
Haro Pekislo Resource Primary 1,160 5.0% 58.0 58.0 5.0% 100% 58.0
Solvent/Thermal
Stimulation 15.0% 174.0 174.0 15.0% 100% 174.0
Total - Haro Resource 1,160 20.0% 232.0 232.0 20.0% 232.0
Total Pace Upside 275.9
Pace WI Reserves
as of Dec. 31, 2011
Cum to Date
as of Dec. 31/2011
Upside PotentialTotal Proved (2P + Upside)
Estimated Gross Ultimate Recovery Total Gross EUR
Proved + Probable

PACE OIL & GAS | Q4 & YE UPDATE | MARCH 2012 26
Key Investment Highlights
Strong Real Growth
• Production up, oil weighting up and growing
• Cash flow up and top tier per share growth Excellent results and continued oil focused growth
Solid Value
• Solid reserves, low decline, low risk Low cost reserves and very attractive trading multiple
Significant Upside
• Identified portfolio of visible long term, low risk,
oil growth opportunities
Oil weighted upside with large scale gas resource optionality
Oil Weighted Growth, Excellent Value,
Proven Team, Proven Results
27 PACE OIL & GAS | Q4 & YE UPDATE | MARCH 2012
Pace Corporate Information Management
Fred Woods President & CEO
Judy Stripling Executive Vice President & CFO
Todd Brown Vice President & COO
Volker Braun Vice President, Exploration
Chad Kalmakoff Vice President, Finance
Colin Merrick Vice President, HR, IR & Administration
Darrell Osinchuk Vice President, Exploitation
Martin Saizew Vice President, Engineering
George Swerdan Vice President, Production & Operations
Andrew Weldon Vice President, Business Development
Directors
Fred Woods Tom Simons
Tom Buchanan Jeff Smith
Peter Harrison Jay Squiers
Mike Shaikh David Tuer
Banking Syndicate
CIBC
National Bank
Bank of Montreal
Bank of Nova Scotia
Alberta Treasury Branches
HSBC Bank of Canada
Auditors
PriceWaterhouse Coopers LLP
Legal Counsel
Heenan Blaikie LLP
Evaluation Engineers
McDaniels & Associates Consultants Ltd.
Registrar & Transfer Agent
Computershare Trust Company of Canada
TSX Listing Symbol OTC Pinks Symbol
PCE PACEF
Address
Livingston Place, West Tower
Suite 1700, 250 – 2nd Avenue SW
Calgary, Alberta, Canada T2P 0C1
Ph: 403-303-8500
Investor Relations Email: [email protected]
Website: www.paceoil.ca
For Information Contact
Fred Woods President & CEO
Judy Stripling Executive VP & CFO
Chad Kalmakoff VP, Finance
Main: 403-303-8500
Investor Relations Email: [email protected]
Website: www.paceoil.ca
TSX: PCE OTC: PACEF