P3 Project Risk Assessment · • Performance risk ... Efficient P3 risk management may reduce...
69
P3 Project Risk Assessment P3-VALUE Webinar March 7, 2015
Transcript of P3 Project Risk Assessment · • Performance risk ... Efficient P3 risk management may reduce...

P3 Project Risk Assessment
P3-VALUE WebinarMarch 7, 2015

2
Patrick DeCorla-SouzaP3 Program Manager
Office of Innovative Program Delivery
Instructors
Marcel HamVice President
IMG Rebel

3
P3-VALUE 2.0 Webinars P3: Public Private Partnership P3-VALUE 2.0: Analytical tool to help practitioners
understand processes used to quantitatively evaluate P3 options
This is one of a series of webinars on P3-VALUE• P3 Evaluation Overview (January 25, 2016)
• Value for Money Analysis (February 8, 2016)• Value for Money Exercise (Feb. 16, 2016)
• Project Delivery Benefit-Cost Analysis (Feb. 22)• Project Delivery BCA Exercise (Feb. 29, 2016)
• Risk Valuation (today)• Financial Viability Assessment

4
Webinar OutlinePart 1 Categorizing RiskPart 2 Risk Management ProcessPart 3 Pure Risk AssessmentPart 4 Lifecycle Performance and Revenue
Uncertainty Risk AssessmentPart 5 Risk AllocationPart 6 Using P3-VALUE 2.0 for Risk AssessmentSummary

5
Webinar ObjectivesAfter taking this course you should be able to: Categorize P3 risks List the steps in the risk management process Explain the methods for quantifying and monetizing
various type of risks Describe the risk allocation process Use P3-VALUE 2.0 to perform risk assessment

Part 1
Categorizing P3 Risks
7
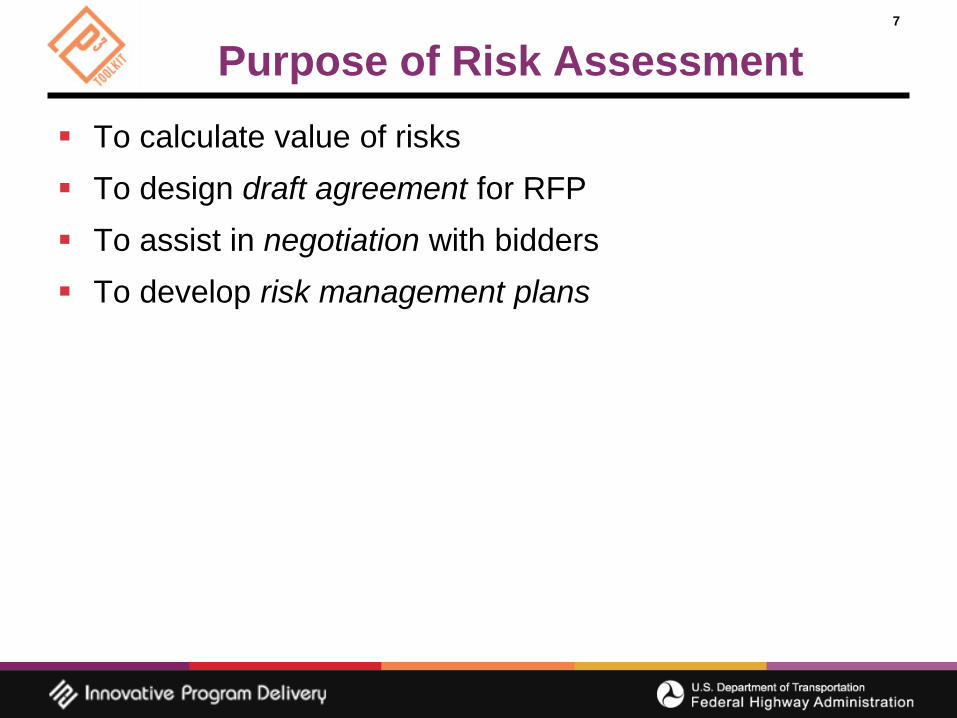
Purpose of Risk Assessment To calculate value of risks To design draft agreement for RFP To assist in negotiation with bidders To develop risk management plans

8
Financial Impacts of Project Risks
CostsIncrease in expenses• Construction• O&M• Major maintenance
RevenuesLoss in revenues• Delay: foregone
toll/AP revenues• Traffic: Lower
than expected revenues
DelaysEffects of delays• Additional costs• Cost escalation• Lost revenues• NPV effect

9
Categories of Risk
Risks
Exogenous Risks
Project Risks
Systematic Risks Lifecycle Performance Risk Non-Systematic Risks
Pure Risks Regular Uncertainties Base Variability
Process Risks
Endogenous Risks Decision Uncertainties

10
P3-VALUE 2.0 Project Risk Categories Base Variability
Example: Uncertainty in volume of asphalt Pure Risks
Example: Accident at construction site, causing cost overrun and/or delays
Lifecycle Performance Risks & Revenue UncertaintyExample: Conflicts between DB and O&M contractors, supervening events exceeding liability caps, inflation, T&R risk (for toll concessions)

11
Valuing Base Variability Typically a percentage of costs (+ or - variation) May differ by project phase Reflects the uncertainty in cost estimates – will reduce
as the design level becomes more detailed P3-VALUE 2.0 uses a factor (percentage of base cost) to
estimate cost impact Example:
• Base variability: 20% of construction cost• Construction cost: $200M• Value of base variability: 20% X $200M = $40M

12
Who Bears Project Risks in a P3?Includes both systematic and some non-systematic risks
Special Purpose
Vehicle (SPV)
Design-Build consortium Operator
Lenders(Bond Holders/
Banks)
Equity Providers
Maintenance contractor
Public Agency
• Inflation risk• Interest rate risk• Performance risk• Integration risk• Toll revenue risk
• Construction risk• Operations risk
Sub
cont
ract
ors

13
Risk though Project CompletionS
hare
of P
roje
ct C
ost
Planning ConstructionPreliminary Design Final Design
Con
tinge
ncie
s

14
Risk over Project LifeR
isk
Ope
ratio
n
Dev
elop
men
t
Con
stru
ctio
n
Tran
sitio
n
Greenfield
Time

15
Audience FeedbackTrue or False All project risks are pushed down to subcontractors of
the concessionaire.

16
Submit a question using the chat box
Questions?

Part 2
Risk Management Process

18
Risk Management Process Overview
1. Identification
2. Assessment & Analysis
3. Risk Response Planning
4. Allocation
5. Monitoring & Control

19
1. Risk IdentificationRisks: Threats Opportunities
Risk Workshops Who?
• Facilitator• Subject matter experts
What tools are used?• Risk checklist• Risk register
1. Identification
2. Assessment & Analysis
3. Risk Response Planning
4. Allocation
5. Monitoring & Control

20
2. Risk Assessment Probability Potential consequences
• Cost• Schedule• Scope/Quality• Revenue
Value
1. Identification
2. Assessment & Analysis
3. Risk Response Planning
4. Allocation
5. Monitoring & Control

21
3. Risk Response PlanningRisk Response Strategies Avoid Mitigate Transfer/Share Accept
1. Identification
2. Assessment & Analysis
3. Risk Response Planning
4. Allocation
5. Monitoring & Control

22
4. Risk Allocation Transfer or retain Share
1. Identification
2. Assessment & Analysis
3. Risk Response Planning
4. Allocation
5. Monitoring & Control

23
5. Risk Monitoring & Control Performance metrics
to monitor risk Understand P3 risk
management provisions
Avoid taking back transferred risks
Validate previous risk identification, risk assessment, and risk response planning
1. Identification
2. Assessment & Analysis
3. Risk Response Planning
4. Allocation
5. Monitoring & Control

24
Audience FeedbackTrue or False The probability and potential consequences of a specific
risk must be quantified in order to estimate its cost impact

25
Submit a question using the chat box
Questions?

Part 3
Pure Risk Assessment

27
Pure Risk Assessment Process

28
Qualitative Assessment Probability of risk occurrence
• Very low• Low• Medium• High• Very high
Scale of impact if risk occurs• Very low• Low• Medium• High• Very high

29
Qualitative Assessment MatrixExample

30
Quantitative Assessment Probability of risk occurrence
• % probability (0% - 100%)
Scale of impact if risk occurs• Dollar amount or number of days of delay

31
Valuing Pure Risks (Formula-Based) Risk Value = Probability X Impact (distribution) Example for uniform probabilistic impact distribution:
• Probability of occurrence: 10%• Minimum impact: $2M• Maximum impact: $4M• Value = 10% x ½ x ($2M + $4M) = $0.3M

32
Valuing Pure Risks (Formula-Based) Risk Value = Probability X Impact (distribution) Example for triangular impact distribution:
• Probability of occurrence: 10%• Minimum impact: $2M• Maximum impact: $4M• Most likely impact = $3.5• Value = 10% x ($2M + 3.5 + $4M)/3 = $0.32M

33
Aggregate of Pure Risks Central limit theorem can be used if pure risks are
independent:• Distribution of the sum of a sufficiently large number of
independent random variables is approximately normal
To apply central limit theory, variance and mean value of each individual risk must be calculated and added

34
Central Limit Theorem AppliedExample using uniform risk distributions (P3-VALUE 2.0)
Mean value: $5,750k, standard deviation of $606k Using Excel NORMINV function, P70 risk value: $6,068k
RiskItem
ProbabilityA
Most likelyImpact B
Most likely valueC = A x B
Minimumvalue D
Maximum
value EShape
Risk 1 20% $10,000k $2,000k -20% +50% Uniform
Risk 2 25% $4,000k $1,000k -20% +50% Uniform
Risk 3 50% $4,000k $2,000k -20% +50% Uniform
RiskItem
Minimum valueF = C – D%
Maximum value G = C + E%
Mean value*H = ½ x (F + G)
Variance*I = (G – F)2 / 12
Risk 1 $1,600k $3,000k $2,300k $163,333k
Risk 2 $800k $1,500k $1,150k $40,833k
Risk 3 $1,600k $3,000k $2,300k $163,333k
Total $4,000k $7,500k $5,750k $376,500k
35
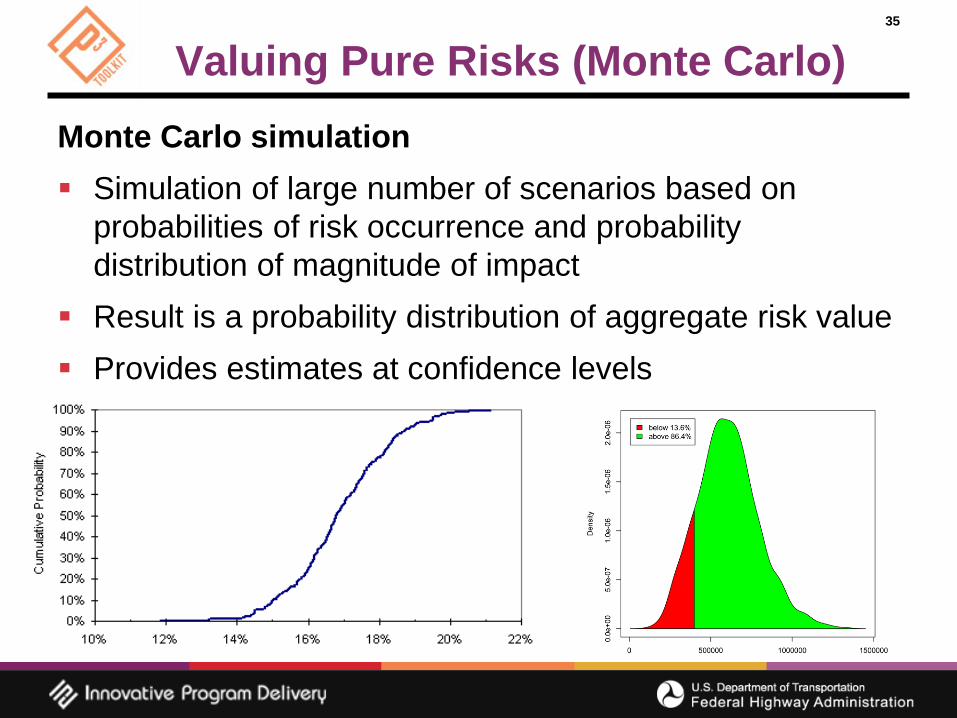
Valuing Pure Risks (Monte Carlo)Monte Carlo simulation Simulation of large number of scenarios based on
probabilities of risk occurrence and probability distribution of magnitude of impact
Result is a probability distribution of aggregate risk value Provides estimates at confidence levels

36
Audience FeedbackTrue or False The aggregate impact of pure risks on costs may be
estimated either by using a formula-based method or by using Monte Carlo simulation.

37
Submit a question using the chat box
Questions?

Part 4
Assessment of Lifecycle Performance Risk and Revenue
Uncertainty Adjustment
39
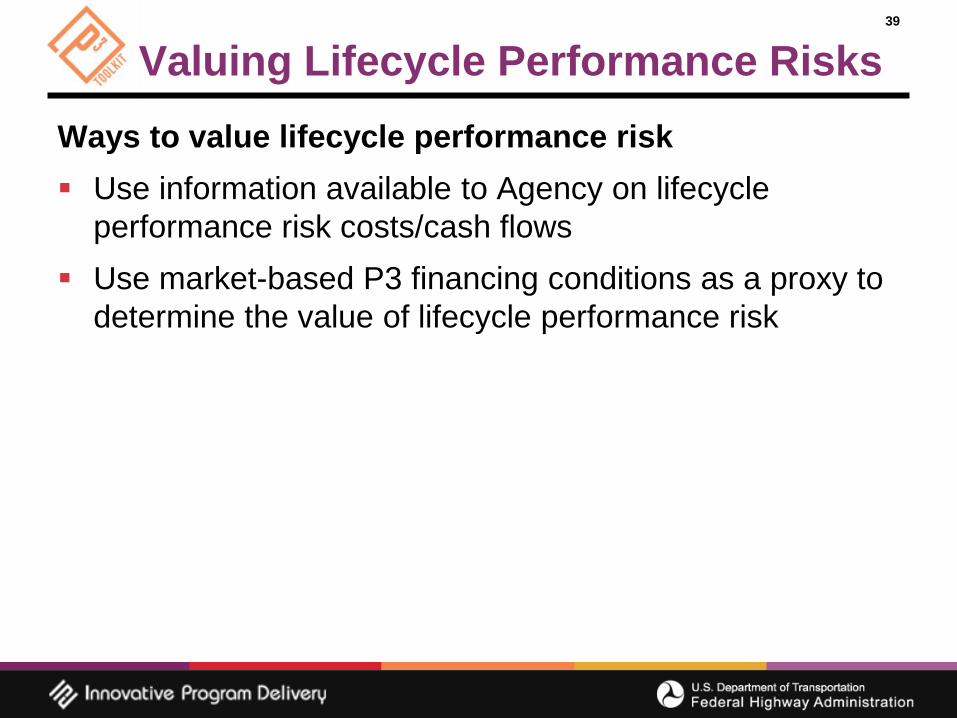
Valuing Lifecycle Performance RisksWays to value lifecycle performance risk Use information available to Agency on lifecycle
performance risk costs/cash flows Use market-based P3 financing conditions as a proxy to
determine the value of lifecycle performance risk

40
Valuing Lifecycle Performance RisksMarket-based valuation: Calculate NPV of cost cash flows*, excluding financing:
A. Using a market-based weighted average cost of capital (WACC) that excludes revenue risk (Availability Payment WACC)
B. Using project risk-free discount rate
Calculate difference in NPVs (Δ = A – B )
*Use PSC cash flows for PSC lifecycle performance risk, and P3 cash flows for P3 lifecycle performance risk (used only in PDBCA and risk outputs)

41
Lifecycle Performance Risk Valuation
time
A = NPV @ market-based WACCAvailabiltiy Payment
B = NPV @ project risk-free discount rate
Δ = A – B = NPV of lifecycle performance riskB =
NP
V @
risk
free
dis
coun
t rat
e
A =
NP
V @
WA
CC Costs (capex, O&M,
major maintenance, etc.)
Calculated lifecycle performancerisk premium (annuity with NPV = Δ)

42
Valuing Revenue UncertaintyWays to value revenue uncertainty Apply percentage haircut to P50 traffic/revenues Use market-based P3 financing conditions as a proxy to
determine the value of revenue uncertainty

43
Valuing Revenue UncertaintyMarket-based valuation: Calculate NPV of revenue and cost cash flows,
excluding financing:C. Using a market-based weighted average cost of capital (WACC) that includes revenue riskD. Using project risk-free discount rate
Calculate difference in NPVs (Δ = C – D), which equals the lifecycle performance risk and revenue uncertainty adjustment combined
NPV of revenue risk is the difference between this Δ and the lifecycle performance risk calculated previously

44
Revenue Uncertainty Adjustment
time
C = NPV @ market-based WACCToll Concession
D = NPV @ project risk-free discount rate
Δ = C – D = NPV of lifecycle performance risk & revenue uncertainty adjustment
D =
NP
V @
pro
ject
risk
-free
dis
coun
t rat
e
C =
NP
V @
WA
CC
Toll
Con
cess
ion
Costs (capex, O&M, major maintenance, etc.)
Toll revenues

45
Accounting for Risk in P3-VALUE 2.0
Risk TypeVfMPSC
VfMP3
PDBCAPSC
PDBCAP3
Base variability ✔ ✔ ✔ ✔Pure risk ✔ ✔ ✔ ✔Lifecycle performance risk ✔ ✔ ✔Revenue risk ✔

46
Risk Analysis ChallengesEstimating risk
impacts and probabilities
Accounting for correlation among
risks
Accounting for unidentified risks
Avoiding double-counting of risks
Aggregating low probability/low
consequence risks
Accounting for procurement
phase risks that are unique to P3s
Bias of evaluators

47
Test Your KnowledgeTrue or False The WACC for a toll concession includes a risk premium
that accounts for revenue risk as well as for lifecycle performance risks

48
Submit a question using the chat box
Questions?

Part 5
Risk Allocation

50
Risk Transfer by Delivery Type
Procurement TypeDesign
RiskConstruction
RiskFinancial
RiskO&MRisk
T&RRisk
Design-Build (DB) ✔ ✔
Design-Build-Finance (DBF) ✔ ✔ ✔
Design-Build-Finance-Operate-Maintain(DBFOM) with Availability Payment
✔ ✔ ✔ ✔
Design-Build-Finance-Operate-Maintain(DBFOM) with Toll Concession
✔ ✔ ✔ ✔ ✔

51
Typical DBFOM Risk AllocationRisk Design-Bid-Build Availability Payment
DBFOMToll Concession
DBFOMDesign errors Public Contractor ContractorChange in scope Public Public PublicDelay in permits Public Shared SharedDelay in right-of-way acquisition Public Public PublicConstruction cost overruns Contractor Contractor ContractorConstruction risks Contractor Contractor ContractorArcheological findings Public Public PublicDelay in relocation of cables & pipes Public Contractor ContractorUnknown ground conditions Public Contractor ContractorHazardous materials Public Shared SharedSecurity Public Contractor ContractorMajor maintenance cost overruns Public Contractor ContractorSnow & ice removal cost overruns Public Contractor ContractorRegular maintenance Public Contractor ContractorTraffic information systems Public Public PublicIncident management Public Contractor ContractorToll revenue risk Public Public ContractorFinancing risks Public Contractor ContractorForce majeure Public Shared Shared

52
Risk Allocation Steps
• Which party is best able to control the likelihood of the risk occurring?
Step 1: Likelihood
• Which party is best able to control the impact of the risk?
Step 2: Impact
• Which party is best able to absorb the risk at lowest cost if the likelihood and impact cannot be controlled?
Step 3: Lowest Cost

53
Transferred Risks Transferred risks include risks pushed down to
subcontractors Efficient P3 risk management may reduce overall risk
valuation and contingencies
Coordination and long-termperformance
Cost of construction
Cost of operations
P3 risk cost reductions

54
Example Tunnel Project
Risk CategoryRisk Allocation
Public Private SharedPolitical ✔Financial ✔Traffic and Revenue ✔Right of Way ✔Planning and Permitting ✔Utilities ✔Procurement ✔Construction ✔Operations and Maintenance ✔Hand-Back ✔Force Majeure ✔Change in Law ✔Geotechnical ✔

55
Test Your KnowledgeTrue or False The public agency’s goal in risk allocation should be to
transfer all risks to the private partner in a P3.

56
Submit a question using the chat box
Questions?

Part 6
Using P3-VALUE 2.0 for Risk Assessment

58
FHWA’s P3-VALUE 2.0

59
Training Modules
Value for Money
Analysis
Project Delivery
Benefit-Cost Analysis
Risk Assessment
Financial Viability
Assessment

60
Training Navigator User Interface
Training Module selection
Input sheet selection
Output sheet selection

61
Demonstration of Risk Module
Please stand by as we open the Excel file

62
Submit a question using the chat box
Questions?

Webinar Summary

64
Webinar RecapPart 1 Categorizing RiskPart 2 Risk Management ProcessPart 3 Pure Risk AssessmentPart 4 Lifecycle Performance and Revenue
Uncertainty Risk AssessmentPart 5 Risk AllocationPart 6 Using P3-VALUE 2.0 for Risk Assessment

6565
Tool and References
P3-VALUE 2.0 Excel Spreadsheet
User Guide
Risk Assessment Primer &
Guidebooks

66
Upcoming P3-VALUE Training Exercise review – March 14 at 12:30pm EST March 21 Financial Viability Assessment Exercise instructions may be downloaded from the web
room Technical assistance options:
• E-mail questions to: [email protected]• Or call (202)-366-4076
• Participate in “Exercise Review” webinarTo access the Exercise Review webinar, please use the following link and telephone number: Link: https://connectdot.connectsolutions.com/p3 Telephone: 1-888-363-4749, Passcode: 6139168#

67
ResourcesFHWA’s Office of Innovative Program Delivery Website:http://www.fhwa.dot.gov/ipd/
P3 Website:http://www.fhwa.dot.gov/ipd/p3/

68
Submit a question using the chat box
Questions?

6969
Patrick DeCorla-SouzaP3 Program ManagerOffice of Innovative Program DeliveryFederal Highway Administration(202) [email protected]
Contact Information