P2: Region 5 Hazardous Substance Reduction on the Path To ... · PDF fileModule 4: Identify...
49
Module 4: Identify and Target Facilities to Perform a Hazardous Substance P2 Assessments P2: Region 5 Hazardous Substance Reduction on the Path To Greener Chemistry
Transcript of P2: Region 5 Hazardous Substance Reduction on the Path To ... · PDF fileModule 4: Identify...

Module 4: Identify and Target Facilities
to Perform a Hazardous Substance
P2 Assessments
P2: Region 5 Hazardous Substance Reduction on the Path To Greener Chemistry

MnTap Approaches to Targeting Chemicals of Concern and Industrial Sectors

Traditional Targeting Methods
P2 Opportunity Identification
• TRI analysis
• Staff expert input
• Outreach development
• Technical assistance program

Successful MnTAP Targeting Campaigns
• Minnesota Environmental Initiative’s (MEI’s)
Autobody Refinishers Training and Technology
Demonstration
• Hospitals for a Healthy Environment
• Grant Supported Assistance to Metal Casters

Targeting Method Limitations
• TRI data
– Large quantity releases
– Listed chemicals
– May not capture small generators
• Staff knowledge
– Less detailed industry knowledge
– Covering more sectors

A New Approach
• More Holistic and Systematic
– Federal Release Data
• TRI
• Wastewater permits
– State Release Data
• Hazardous Waste
• Air Toxics
– State Reuse Data
• Beneficial reuse

Test Methodology
• Compile data sets
• Analyze quantities and trends
• Compare across datasets
• Add industry context

NAICS Description 2008 2009 2010Percent
Increase
3241 Petroleum and Coal Products Manufacturing 917,175 799,026 56,810,579 6,094
3399 Other Miscellaneous Manufacturing 226,461 151,618 5,208,880 2,200
3353 Electrical Equipment Manufacturing 117,330 34,276 2,237,545 1,807
3313 Alumina and Aluminum Production and Processing 551,485 281,556 1,934,321 250
3334 Air Handling and Conditioning Equipment 58,602 53,874 197,695 237
3326 Spring and Wire Product Manufacturing 180 110,910 159,277 88,387
3252 Synthetic Resin and Rubber Fibers 29,837 28,021 63,663 113
4861 Pipeline Transportation of Crude Oil 6,900 8,800 21,685 214
4412 Other Motor Vehicle Dealers 6,650 15,380 19,100 187
6215 Medical and Diagnostic Laboratories 6,158 3,922 18,847 206
9281 National Security and International Affairs 7,372 27,267 16,459 123
3273 Cement and Concrete Product Manufacturing 2,880 2,760 11,350 294
4234 Professional/Commercial Equipment/Supplies Wholesalers 4,730 10,052 9,825 107
Hazardous Waste
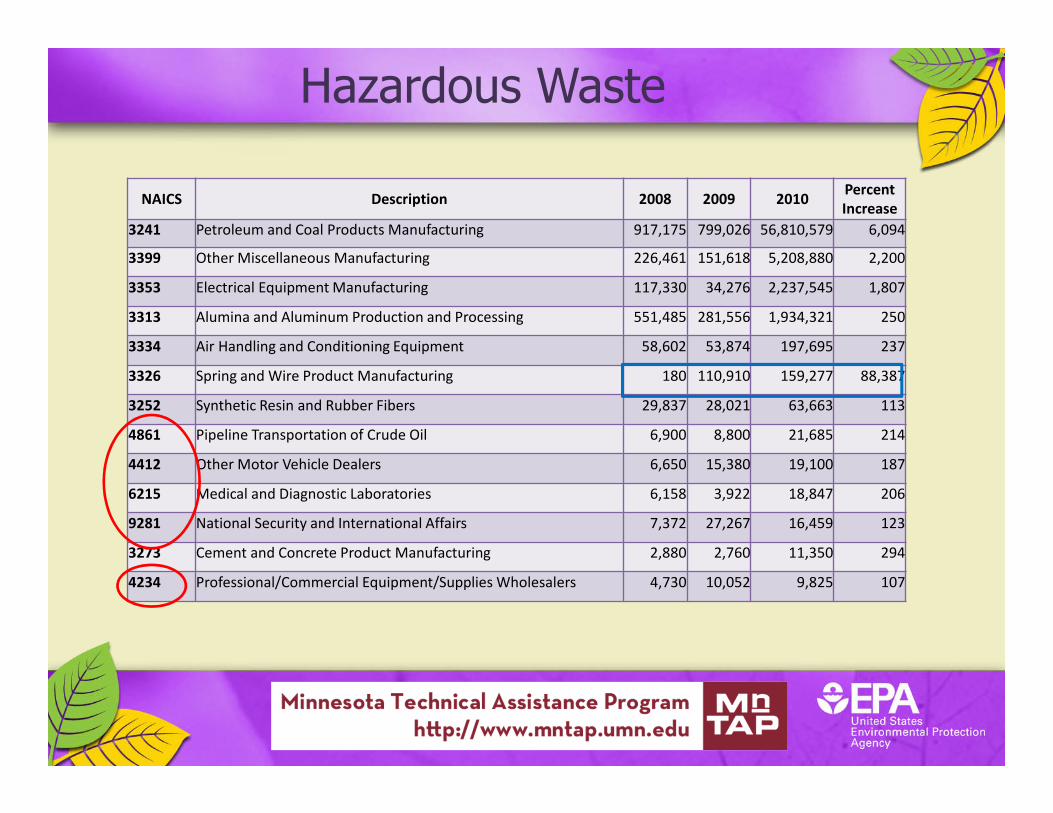

Hazardous Waste
NAICS Description 2008 2009 2010Percent
Increase
3241 Petroleum and Coal Products Manufacturing 917,175 799,026 56,810,579 6,094
3399 Other Miscellaneous Manufacturing 226,461 151,618 5,208,880 2,200
3353 Electrical Equipment Manufacturing 117,330 34,276 2,237,545 1,807
3313 Alumina and Aluminum Production and Processing 551,485 281,556 1,934,321 250
3334 Air Handling and Conditioning Equipment 58,602 53,874 197,695 237
3252 Synthetic Resin and Rubber Fibers 29,837 28,021 63,663 113
3273 Cement and Concrete Product Manufacturing 2,880 2,760 11,350 294
List of high waste generating sectors

TRI: Air Releases
NAICS Quantity, Description 2008 2009 2010 Chemical Process
3112 12 Oilseed Milling 2,110,509 1,752,402 1,864,846 Hexane Oilseed extraction
2211 18 Electric Utilities 1087,363 1,086,456 1,266,112 Ammonia, Acids Combustion
3324 6 Storage Tank Manufacturing 668,110 844,569 877,808 n-Butyl Alcohol, glycol ethers Painting
3221 7 Pulp/Paper Mills 799,901 742,997 765,552 Methanol, Acids Pulping
3116 9 Animal Processing 821,646 484,208 815,724 Ammonia Processing
3113 4 Sugar Manufacturing 760,993 620,709 575,008 Ammonia Processing
3251 23 Basic Chemicals 729,530 895,062 305,085 Hexane, Ammonia, Acetaldehyde Mixing
3241 9 Petroleum Products 585,379 603,205 611,423 Methanol, Xylene, Ammonia Processing
3222 3 Converted Paper 264,848 195,256 252,936 Toluene, Methanol Pulping
3261 22 Plastics 286,357 205,747 173,767 1-Chloro-1,1-Difluoroethane, Styrene Refrigeration?
3366 8 Boats 393,659 83,701 136,364 Styrene Polymerization
3361 3 Motor Vehicles 236,405 190,714 173,254 n-Butyl Alcohol, Xylene Painting
3371 5 Furniture 213,846 152,795 178,606 Xylene, Toluene Painting
3391 5 Medical Equipment 141,486 127,502 117,245 Xylene, Toluene, Cyclohexane Cleaning
3328 25 Metal Coating 158,290 104,049 91,477 Methylene chloride, Chloroform, Xylene Cleaning
3212 4 Wood Products 206,801 88,215 42,277 Methanol, Formaldehyde Painting
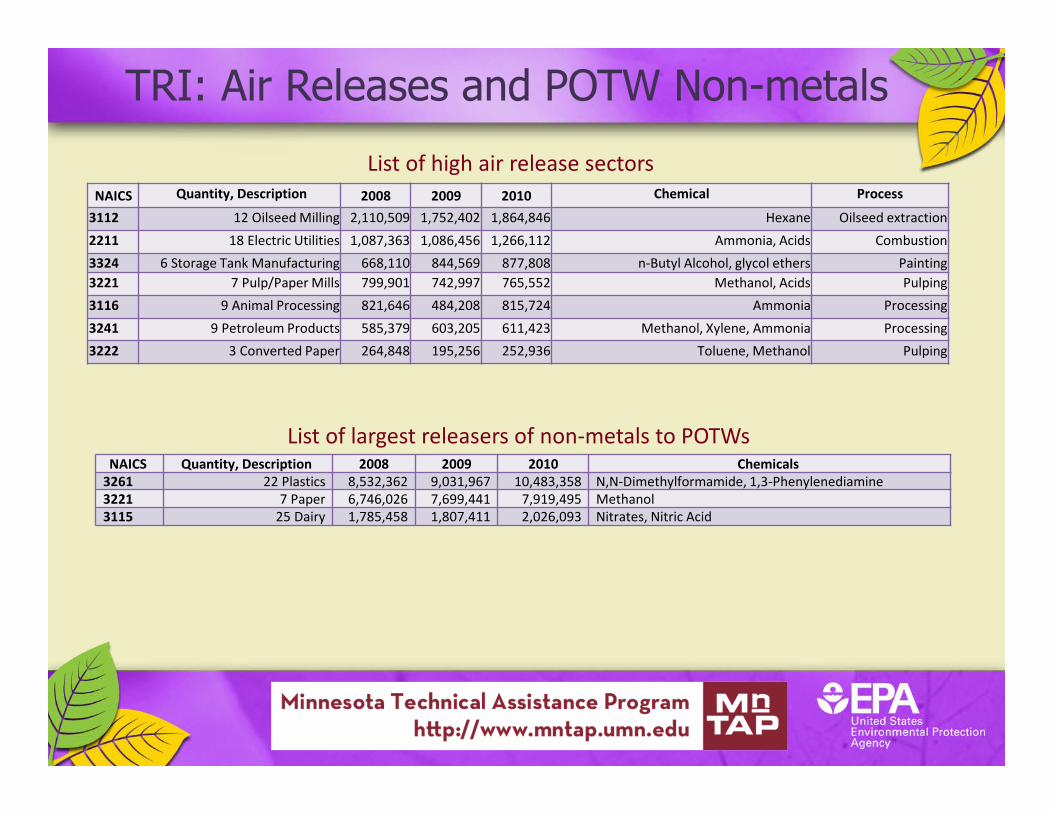
TRI: Air Releases and POTW Non-metals
NAICS Quantity, Description 2008 2009 2010 Chemical Process
3112 12 Oilseed Milling 2,110,509 1,752,402 1,864,846 Hexane Oilseed extraction
2211 18 Electric Utilities 1,087,363 1,086,456 1,266,112 Ammonia, Acids Combustion
3324 6 Storage Tank Manufacturing 668,110 844,569 877,808 n-Butyl Alcohol, glycol ethers Painting
3221 7 Pulp/Paper Mills 799,901 742,997 765,552 Methanol, Acids Pulping
3116 9 Animal Processing 821,646 484,208 815,724 Ammonia Processing
3241 9 Petroleum Products 585,379 603,205 611,423 Methanol, Xylene, Ammonia Processing
3222 3 Converted Paper 264,848 195,256 252,936 Toluene, Methanol Pulping
List of high air release sectors
NAICS Quantity, Description 2008 2009 2010 Chemicals
3261 22 Plastics 8,532,362 9,031,967 10,483,358 N,N-Dimethylformamide, 1,3-Phenylenediamine
3221 7 Paper 6,746,026 7,699,441 7,919,495 Methanol
3115 25 Dairy 1,785,458 1,807,411 2,026,093 Nitrates, Nitric Acid
List of largest releasers of non-metals to POTWs
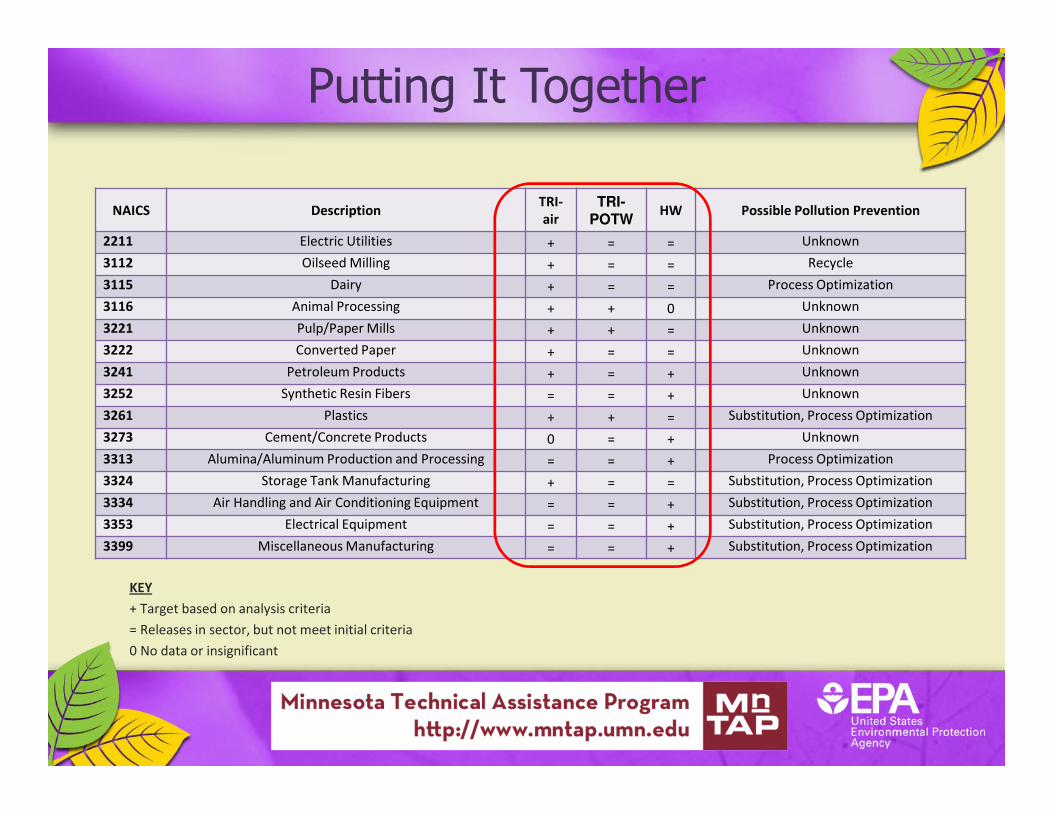
Putting It Together
KEY
+ Target based on analysis criteria
= Releases in sector, but not meet initial criteria
0 No data or insignificant
NAICS DescriptionTRI-
air
TRI-POTW
HW Possible Pollution Prevention
2211 Electric Utilities + = = Unknown
3112 Oilseed Milling + = = Recycle
3115 Dairy + = = Process Optimization
3116 Animal Processing + + 0 Unknown
3221 Pulp/Paper Mills + + = Unknown
3222 Converted Paper + = = Unknown
3241 Petroleum Products + = + Unknown
3252 Synthetic Resin Fibers = = + Unknown
3261 Plastics + + = Substitution, Process Optimization
3273 Cement/Concrete Products 0 = + Unknown
3313 Alumina/Aluminum Production and Processing = = + Process Optimization
3324 Storage Tank Manufacturing + = = Substitution, Process Optimization
3334 Air Handling and Air Conditioning Equipment = = + Substitution, Process Optimization
3353 Electrical Equipment = = + Substitution, Process Optimization
3399 Miscellaneous Manufacturing = = + Substitution, Process Optimization
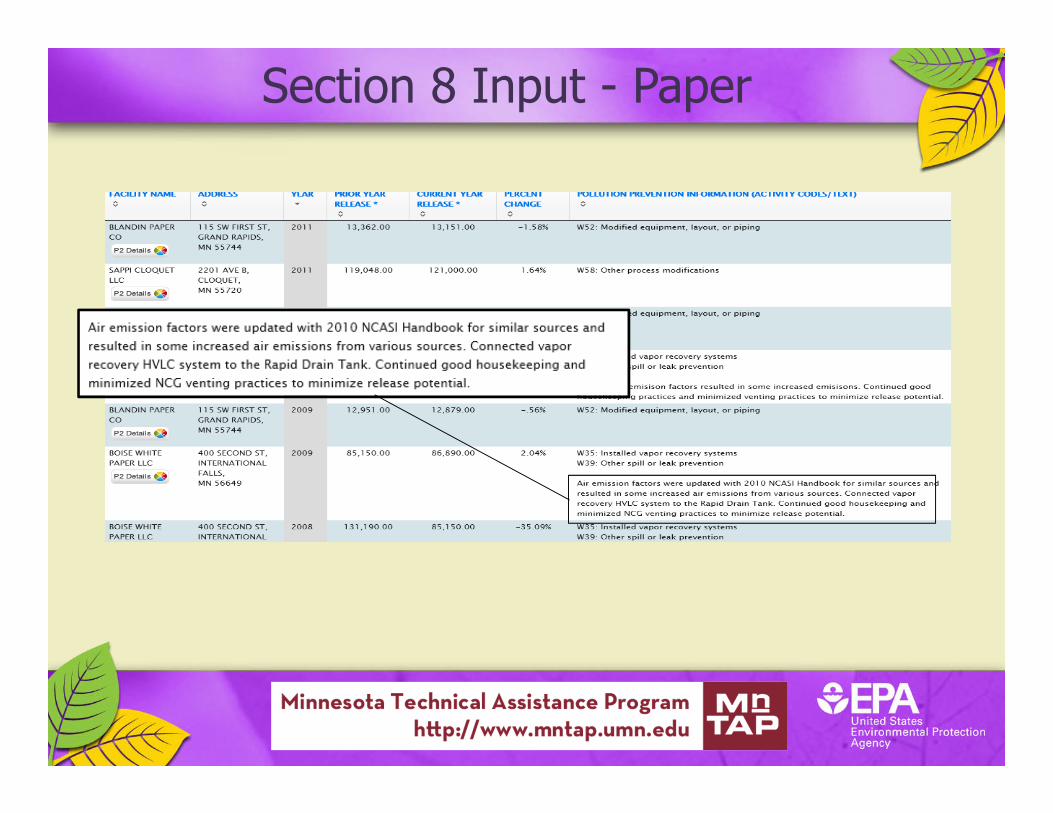
Section 8 Input - Paper
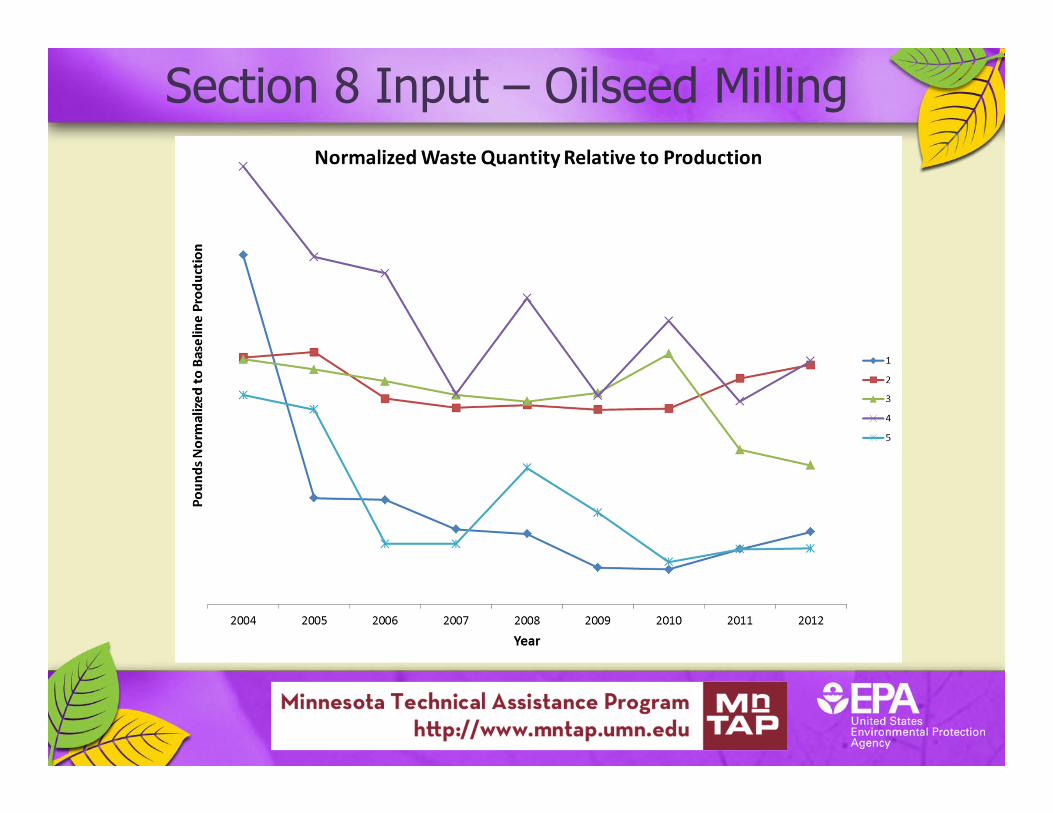
Section 8 Input – Oilseed Milling
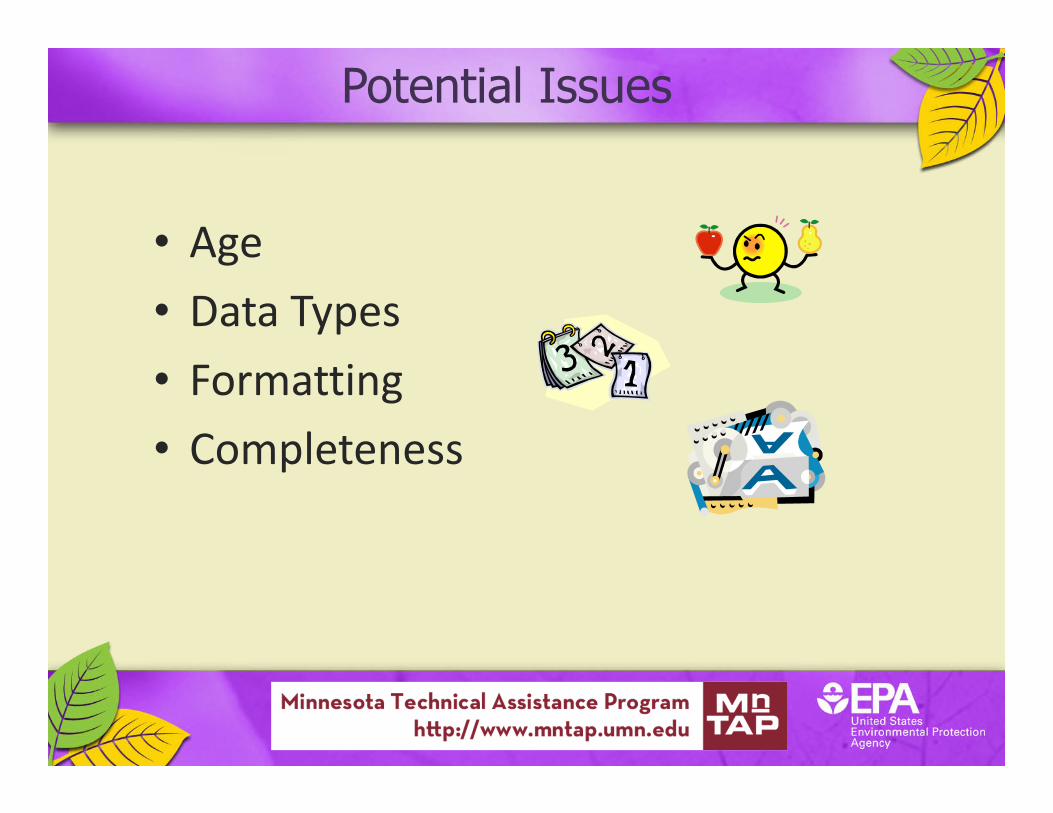
Potential Issues
• Age
• Data Types
• Formatting
• Completeness

Opportunities
More Outreach to all Sectors
– P2 message clearer
– Work with state on training
Link TA to Section 8
– Motivate provider and client to be more transparent
Using the Toxics Release Inventory (TRI) Pollution Prevention (P2) Data Tool

Overview of TRI and TRI’s P2 data
What is the Toxics Release Inventory (TRI)?
• TRI compiles data submitted by industry on the releases and management of toxic chemicals from certain facilities
• TRI collects information on:
Releases Waste
transfersRecycling Pollution
prevention

Who Reports to TRI?
• Facility must be in a TRI-covered industry sector or category, including:
• Facility must have the equivalent of at least 10 full-time employees
• Facility must manufacture, process or use more than a threshold amount of a TRI toxic chemical per year
Coal/Oil electricity generation
Certain Mining Facilities
Hazardous Waste
Management
Federal FacilitiesManufacturing
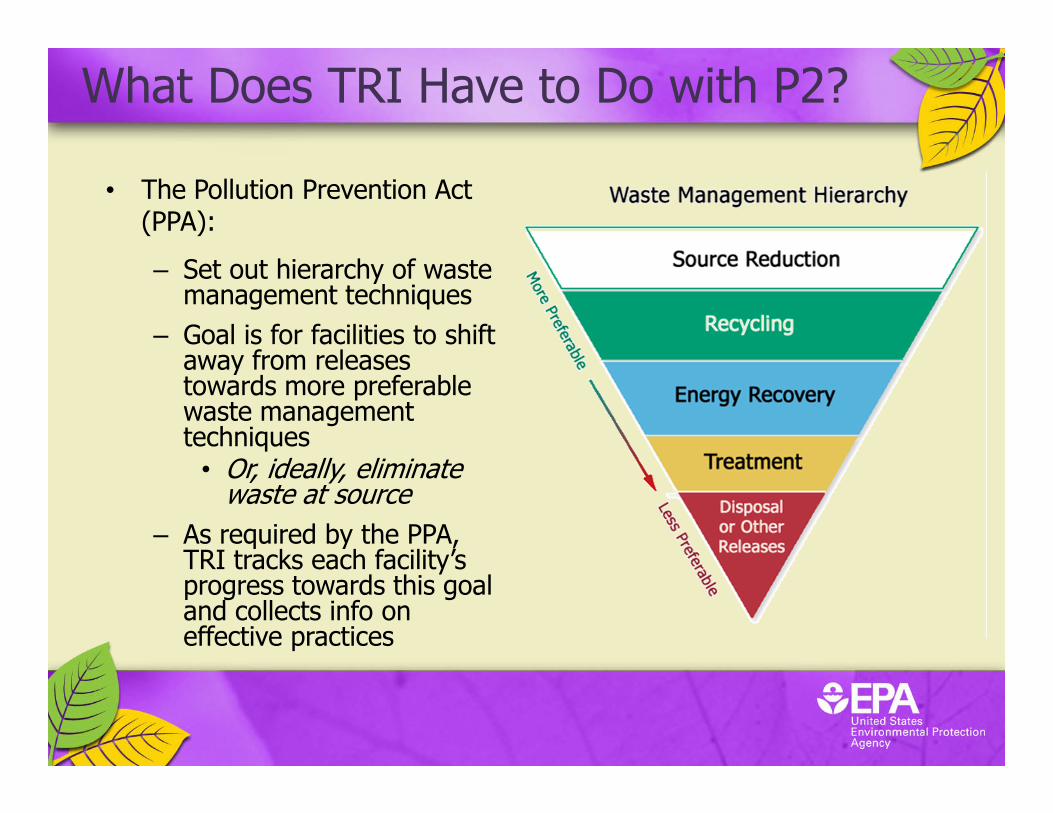
What Does TRI Have to Do with P2?
• The Pollution Prevention Act (PPA):
– Set out hierarchy of waste management techniques
– Goal is for facilities to shift away from releases towards more preferable waste management techniques
• Or, ideally, eliminate waste at source
– As required by the PPA, TRI tracks each facility’s progress towards this goal and collects info on effective practices

Breakdown of TRI Chemical Quantities
Source: 2011 TRI National Analysis Dataset
Recycled
Energy y
Recovery
Treated
AirWater
Land
Off-siteReleased
Total Production-Related Waste Managed (lbs)
Total Waste: 22.8 million lbs Total Releases: 4.1 million lbs

What P2 Data Does TRI Collect?
• Waste Management Quantities– Prior Year, Current Year, and Future Years (projections)
• Production Ratio– Ratio of current year production or activity to previous year
– Puts changes in releases into context of production
• Source Reduction Activities– Codes corresponding to specific types of activities (required if
any P2 activities were newly implemented during the reporting year)
• Optional Pollution Prevention Information– Additional detail about P2, recycling, or pollution control (free-
text)
0
20
40
60
80
100
120
140
160
0
20,000
40,000
60,000
80,000
100,000
120,000
140,000
2004 2005 2006 2007 2008 2009 2010 2011 2012* 2013*
Pro
du
ctio
n In
de
x (2
00
1=
10
0)
Pro
du
ctio
n-r
ela
ted
wa
ste
ma
na
ge
d (
lbs)
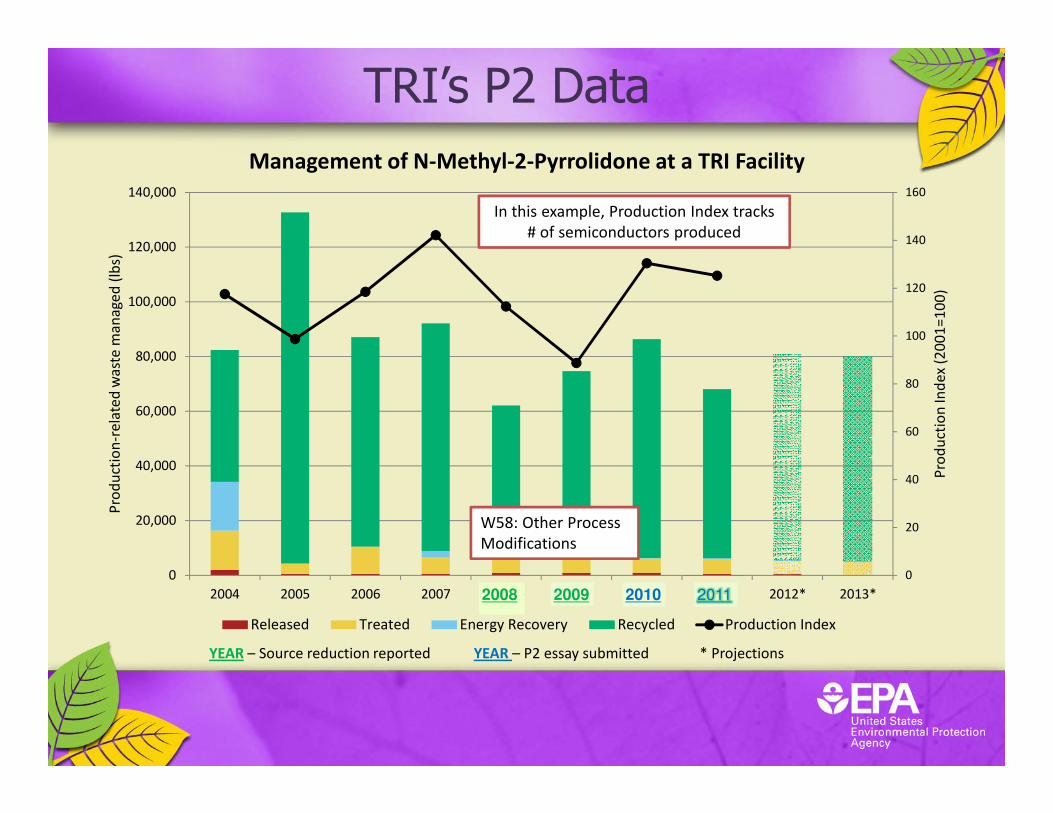
Management of N-Methyl-2-Pyrrolidone at a TRI Facility
Released Treated Energy Recovery Recycled Production Index
YEAR – Source reduction reported YEAR – P2 essay submitted * Projections
20092008
W58: Other Process
Modifications
2010 2011
In this example, Production Index tracks
# of semiconductors produced
TRI’s P2 Data

0
20
40
60
80
100
120
140
160
0
20,000
40,000
60,000
80,000
100,000
120,000
140,000
2004 2005 2006 2007 2008 2009 2010 2011 2012* 2013*
Pro
du
ctio
n In
de
x (2
00
1=
10
0)
Pro
du
ctio
n-r
ela
ted
wa
ste
ma
na
ge
d (
lbs)
Management of N-Methyl-2-Pyrrolidone at a TRI Facility
Released Treated Energy Recovery Recycled Production Index
YEAR – Source reduction reported YEAR – P2 essay submitted * Projections
20092008 2010
W58 [Other Process
Modifications]: A process change
made to certain wafer technologies in
2011 resulted in a NMP and
polyimide use reduction. W51
[Instituted re-circulation within a
process]: [This practice was] utilized
at the tool chemical recycle on
certain semiconductor manufacturing
equipment.
2011
TRI’s P2 Data

Source Reduction Activity Category and
Code ReportedPollution Prevention Text Submitted
Raw Material Modifications
W42: Substituted raw materials
We have reduced our air emissions by substituting #6 fuel
oil with B50; a product that is 50% vegetable oil.
Cleaning and Degreasing
W60: Changed to mechanical stripping /
cleaning devices (from solvents or other
materials)
Grit blasting has been used in place of some of our acid
stripping operations. Our customer satisfaction with this
process will determine if it will be used as a permanent
change. Otherwise our acid use will increase with expected
increase in production requirements.
Inventory Control
W21: Instituted procedures to ensure that
materials do not stay in inventory beyond shelf-
life
We found customers for paint at the end of its shelf life that
did not require high performance standards of paint within
its shelf life. This reduced the amount in the waste stream.
Process Modifications
W51: Instituted re-circulation within a process
We increased the amount of trichloroethyelene solvent we
distilled by allowing an additional cycle of use and
distillation before disposing of the solvent. Production
team implemented the process.
Examples of TRI P2 Text

New Source Reduction & P2 Text in 2011
Forms with Source
Reduction Activity
Codes (§8.10)
5,787 forms
Forms with
Optional
Additional P2
Details (§8.11)
4,302 forms
Forms with
Both
2,534 forms
What P2 Questions Can TRI Address?
• Have toxic chemical releases at a particular industrial facility gone up or down over time?
• Were changes in releases driven by changes in production? Or did P2 practices play a role?
• What P2 practices have other facilities in my sector implemented? How much progress have they made?
• What P2 practices have been most effective overall? And which companies implemented them?
• What role has green chemistry/engineering played?
Why Is TRI Well-Suited to This Purpose?
Unique combination of:
• Standardized, quantitative environmental metrics; and
• Qualitative information on the organizations and activities that have demonstrated environmental improvements.
Breadth and depth of the data collected.
• Detailed, multi-media release and waste management information.
• Data collected annually, stretching back decades.
Explicit focus on public data access and awareness.
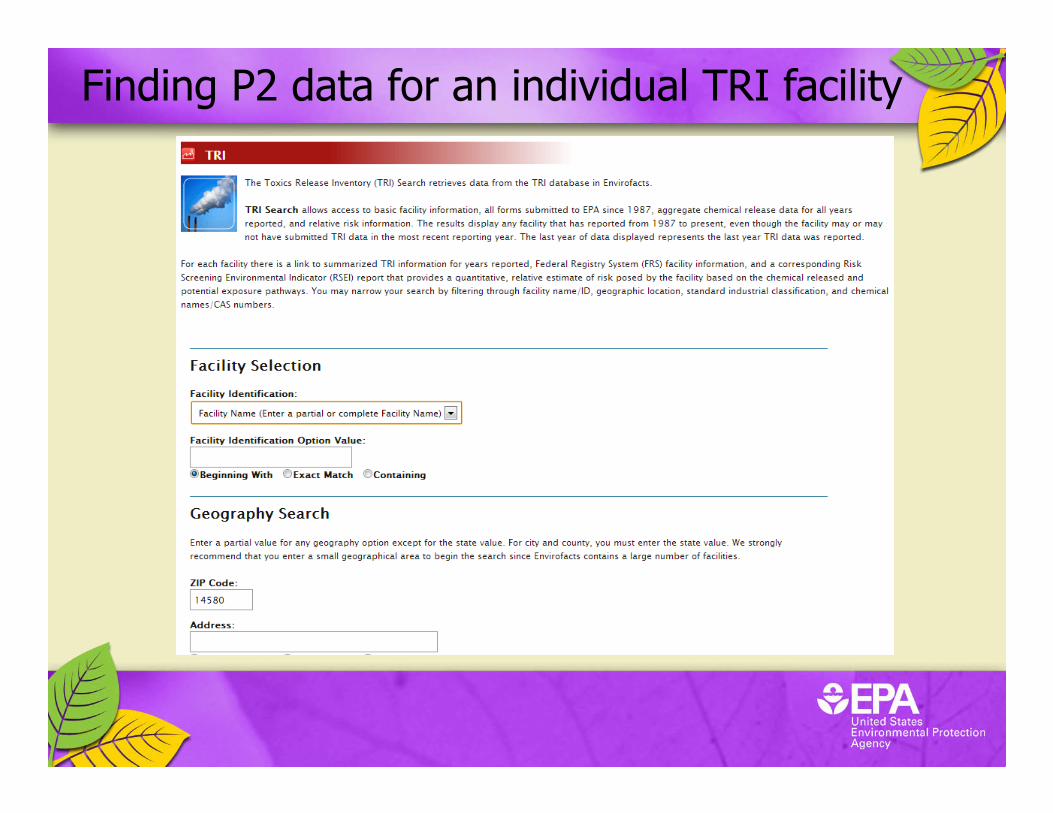
Finding P2 data for an individual TRI facility

Example Facility Search Results
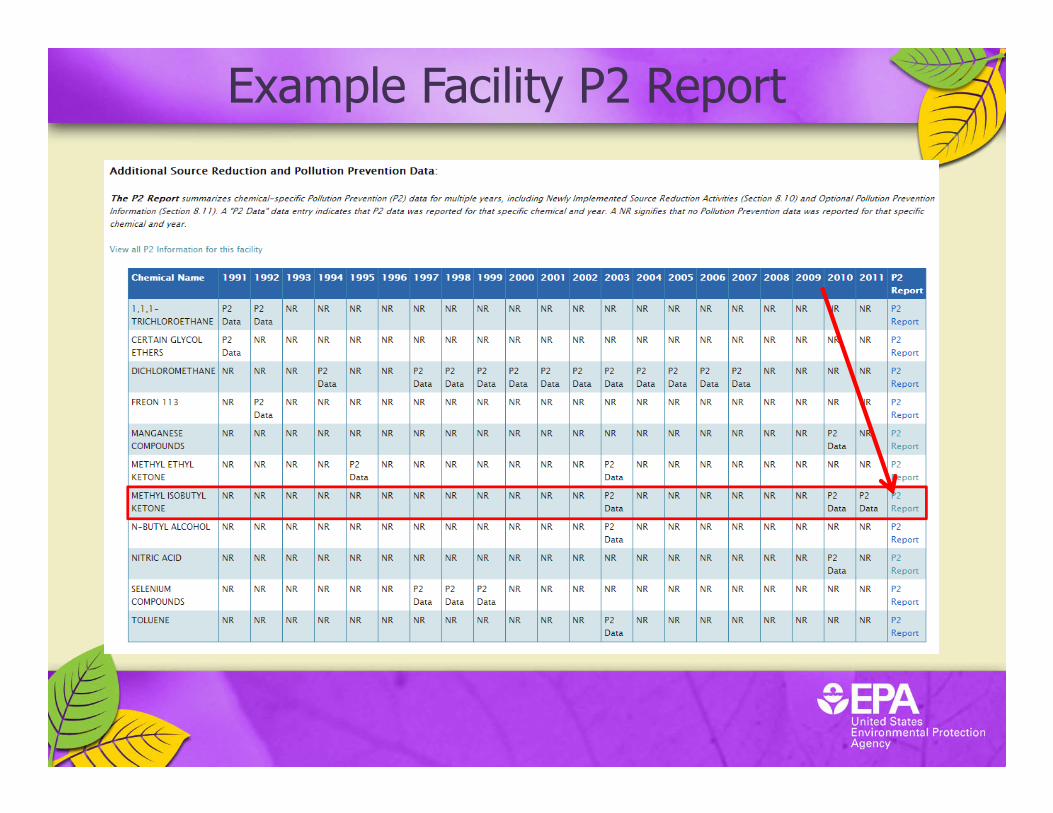
Example Facility P2 Report

Example Detailed P2 Report

Finding P2 Info for a Given Year
Using TRI to identify technical assistance targets
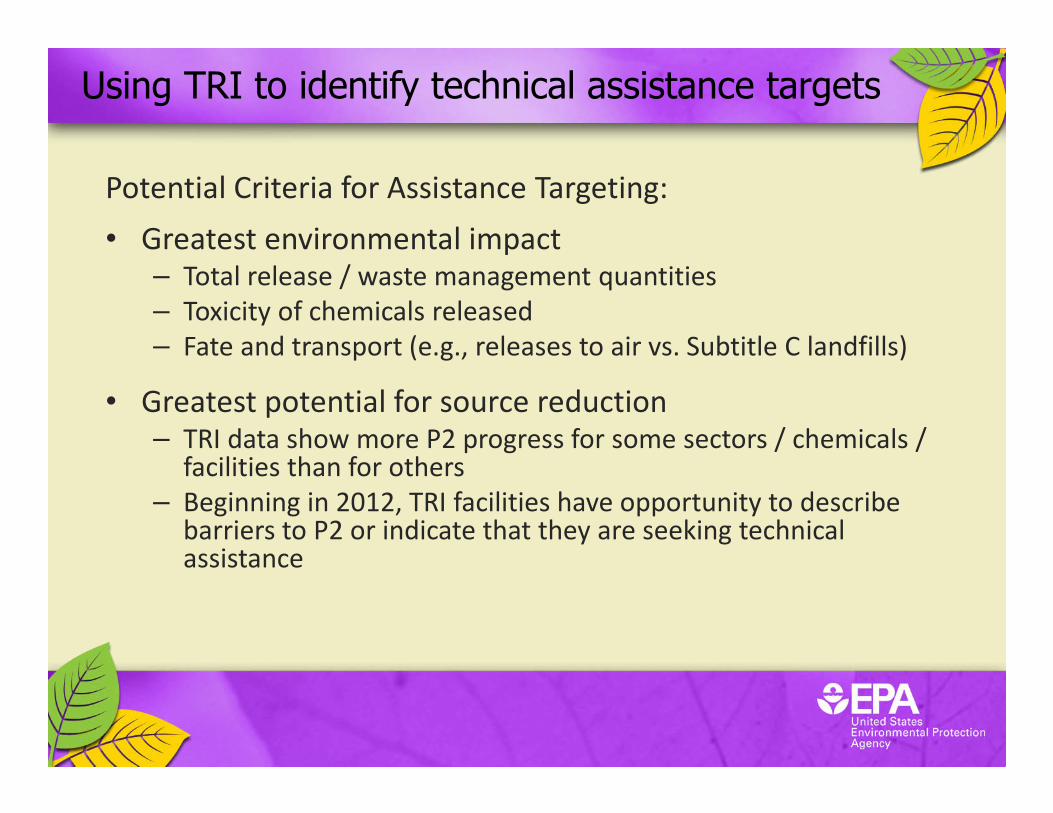
Potential Criteria for Assistance Targeting:
• Greatest environmental impact– Total release / waste management quantities
– Toxicity of chemicals released
– Fate and transport (e.g., releases to air vs. Subtitle C landfills)
• Greatest potential for source reduction– TRI data show more P2 progress for some sectors / chemicals /
facilities than for others
– Beginning in 2012, TRI facilities have opportunity to describe barriers to P2 or indicate that they are seeking technical assistance

New Source Reduction Rates by Sector
0.0%
4.0%
8.0%
12.0%
16.0%
20.0%
% o
f F
orm
Rs
wit
h P
2 A
ctiv
itie
sShare of Form Rs with New P2 Activities*, 2011
*Refers to Form Rs with newly-implemented source reduction activities in 2011, limited to sectors with at least 100 Form Rs
Chemical and Sector-Specific Trends
0
200
400
600
800
1000
1200
1400
0
2
4
6
8
10
12
2001 2002 2003 2004 2005 2006 2007 2008 2009 2010 2011
Nu
mb
er o
f Facilitie
s Re
po
rting
Lea
d
Mil
lio
ns
of
Po
un
ds
Ma
na
ge
d
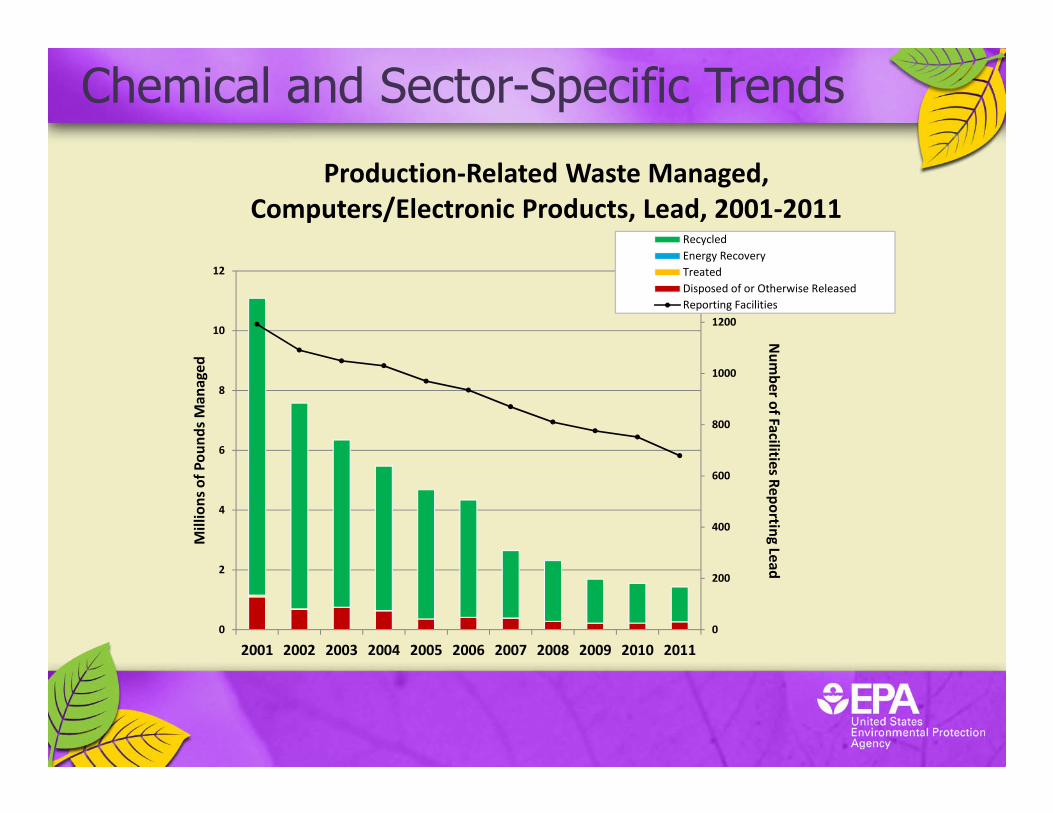
Production-Related Waste Managed,
Computers/Electronic Products, Lead, 2001-2011Recycled
Energy Recovery
Treated
Disposed of or Otherwise Released
Reporting Facilities
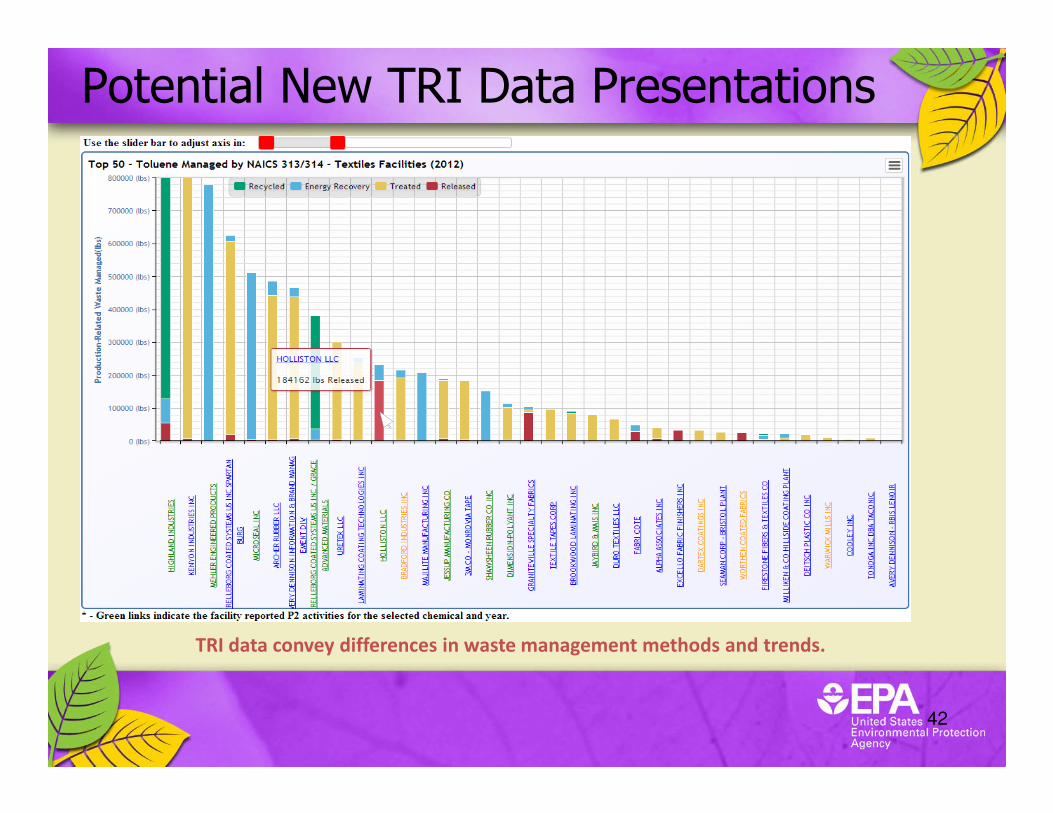
TRI data convey differences in waste management methods and trends.
42
Potential New TRI Data Presentations
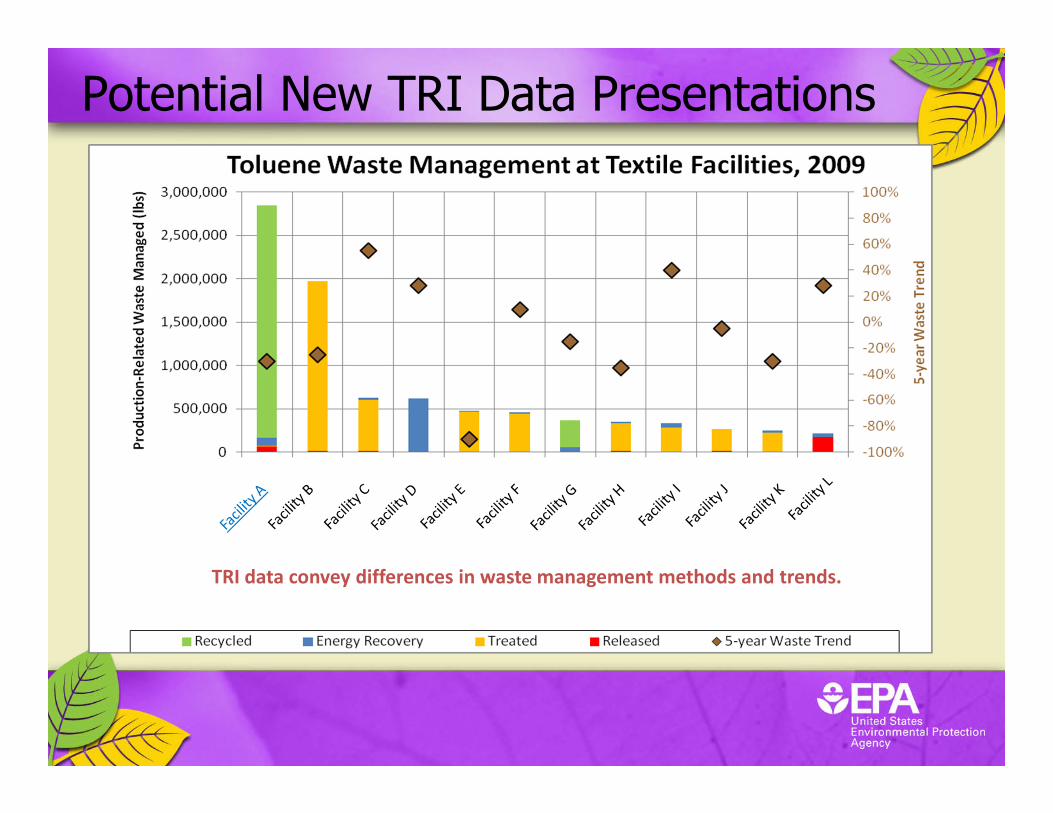
TRI data convey differences in waste management methods and trends.
Potential New TRI Data Presentations

Using TRI to identify effective P2 practices
www.epa.gov/tri/p2
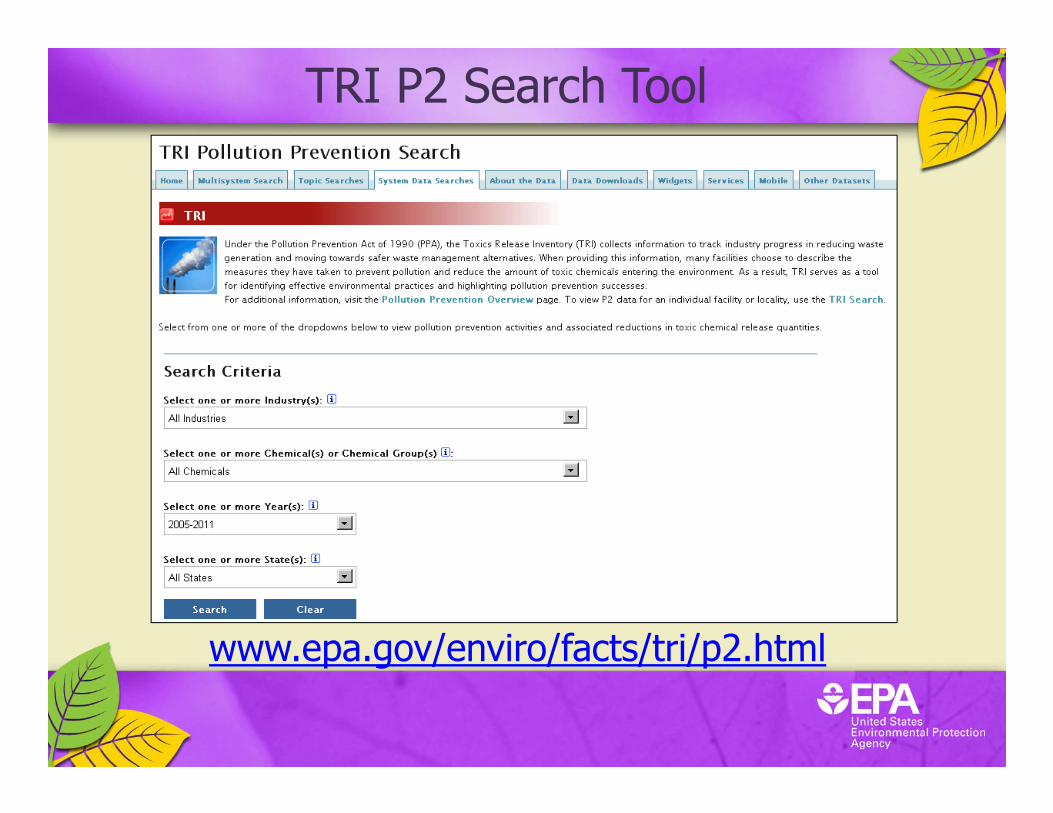
TRI P2 Search Tool
www.epa.gov/enviro/facts/tri/p2.html

Example Industry-Chemical Search
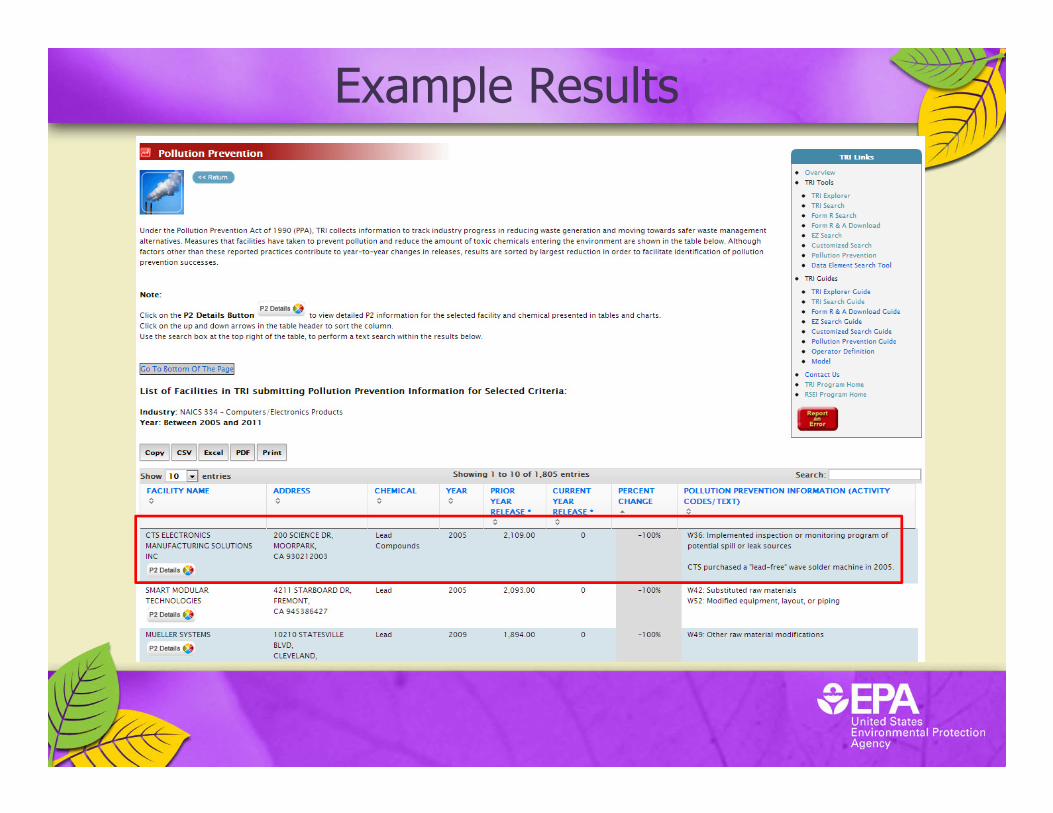
Example Results

Filtering Results Using Search Box
48
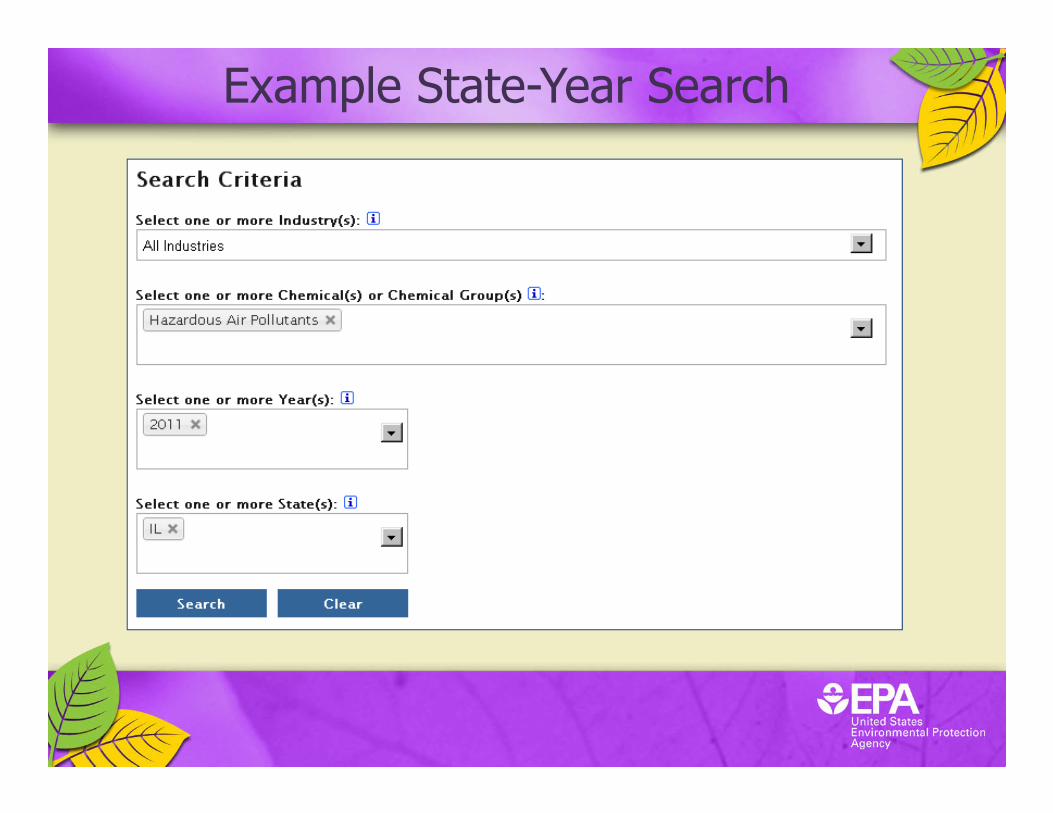
Example State-Year Search
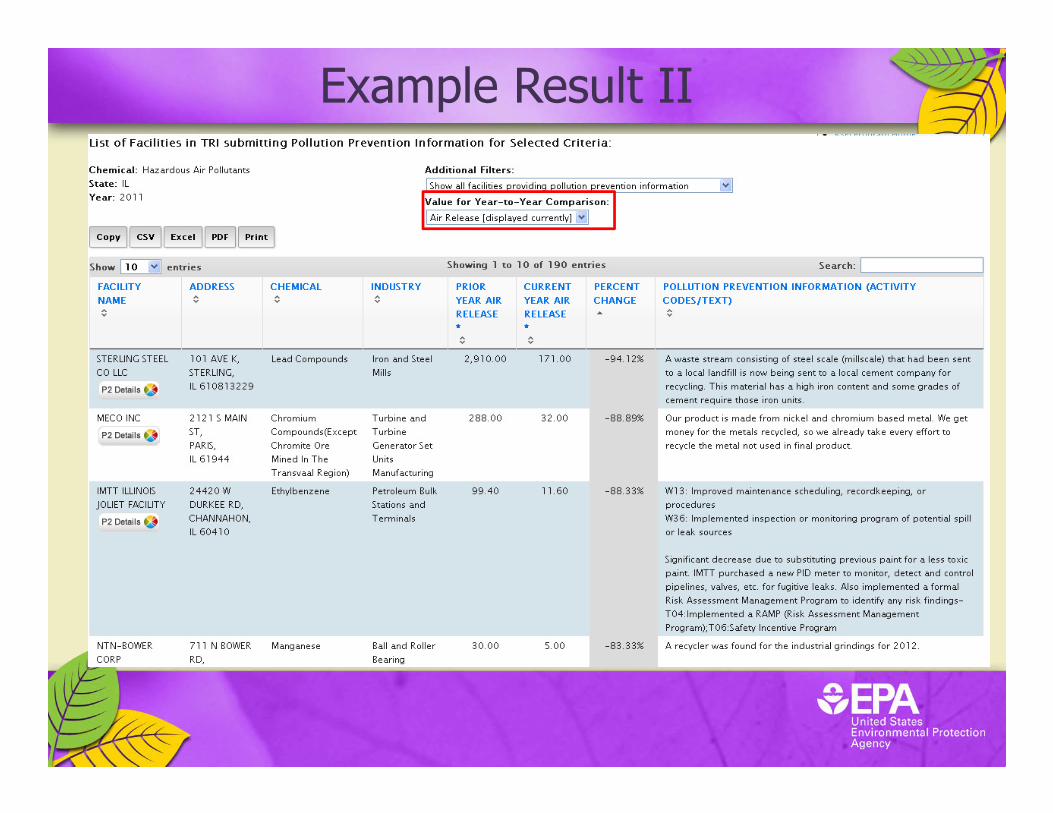
Example Result II

Example P2 Details Report

Data Resource What You Can Use it For
• Read about overall trends in P2 and waste management
• Download P2 stats and lists of P2 activities for 2011
• Find P2 activities for particular industries, chemicals, or states
• Gauge which practices may have been most effective
• Identify TRI facilities in your area of interest
• View P2 and waste management trends for particular facilities
• Design sophisticated queries involving P2 and other TRI data
• Find downward trends in releases and see which companies and P2
activities contributed
• Find P2 information for TRI facilities in your neighborhood using
your mobile device
Summary: Accessing TRI P2 Data

Pollution Prevention Reporting Tipsheet
http://www2.epa.gov/sites/production/files/documents/tri_p2_tipsheet.pdf