P V EERING L P roE A C5 ELP SIaEN'JS - NASA
184
(_h.J A-kP- lOd o-V c.L-O) h"i 5- o Eh6IN EERING t_62-1L152 P_z_roE_A_C5 ;,,k_C_. _LLUME 6: SC_EN3I_IC ELPgSIaEN'JS _inai i(eFo[t (NASA) 16o dC Avtt/_'lt" AOl CSC/ 22B OI_claa H1/ld OeOO7 .. I *_.(,%"
Transcript of P V EERING L P roE A C5 ELP SIaEN'JS - NASA

(_h.J A-kP- lOd o-V c.L-O) h"i 5- o Eh6IN EERING t_62-1L152P_z_roE_A_C5 ;,,k_C_. _LLUME 6: SC_EN3I_IC
ELPgSIaEN'JS _inai i(eFo[t (NASA) 16o
dC Avtt/_'lt" AOl CSC/ 22B OI_claaH1/ld OeOO7 ..
I*_.(,%"

NASAReferencePublication1080
1981
ATS-6 Final EngineeringPerformance Report
Volume VI- Scientific Experiments
Robert O. Wales, EditorGoddard Space Flight CenterGreenbelt, Maryland
National Aeronaubc sand Space Aclm,mstratLor
Scientific and TechnicalInformation Branch
1982008279-002

II LIL.j____2t ..I..... u ........... I jtll 1 I _- "' [_
I ,
i"
An Engineering Evaluation t
in
Six Volumes :
IZ ,!i :
Volume I: Program and System Summaries; Mechanical and Thermal Details !'(Part A: Program Summary _ "Part B: Mechanical Subsystems ! .Part C: Thermal Control and Contamination Monitor ; :
Volume II: Orbit and Attitude ControlsPart A: Attitude Control
Part B: Pointing Experiments _ ?
Part C: Spacecraft Propulsion _
Part D: Propulsion Experiment I ;_t
Volume III: Telecommunications and Power
Part A" Communications SubsystemPart B: Electrical Power SubsystemPart C: Telemetry and Command Subsystem
Part D: Data Relay E._periments
Volume IV: Television ExperimentsPart A: The Department of Health, Education and Welfare Sponsored ExperimentsPart B: Satellite Instructional Television Experiment (India)Part C: Independent Television Experiments
VolumeV: Propagation ExperimentsPart A: Experiments at 1550 MHz to 1650 MHzPart B: Experiments at 4 GHz to 6 GHzPart C: Experiments Above 10 GHz
Volume VI: Scientific Experiments :o
This document makes use of international metric units according to the
Syst_me International d'Unit_s (SI). In certain cases, utility requires the _,retention of other systems of units in addition to the SI units. The conven-
tional units stated in parentheses following the computed SI equivalents are
the basis of the measurements and calculations reported, i_
For sale by the National Technical Information Service
Springfield, Virginia 2216 IPrtce
1982008279-003

VOLUME VICONTENTS
Page
FOREWORD.............................................................. xv
INTRODUCTION .......................................................... xxi
CHAPTER 1 - VERY HIGH RESOLUTION RADIOMETER ........................ 3
INTRODUCTION ...................................................... 3
DESIGN DESCRIPTION................................................. 3
ORBIT OPERATIONS AND PERFORMANCE ............................... 6
IN-ORBIT ANOMALIES ................................................. 9
CONCLUSIONS AND RECOMMENDATIONS................................ 10
CHAPTER 2 - RADIO BEACON EXPERIMENT ................................. 1i
INTRODUCTION ...................................................... 1l
Experiment Objectives .............................................. I lParticipants ....................................................... I l
Experiment Scheduling .............................................. 13
SYSTEM DESCRIPTION ................................................ 13
General Description ................................................. 13Physical Description ................................................ 13Electrical Description ............................................... 15
Antenna Description ................................................ 20
MEASUREMENT CONSIDERATIONS ..................................... 23
Historical Background ............................................... 23Overall Considerations ............................................... 32
iii
m
1982008279-004

VOLUME Vl
CONTENTS (continued)
Page
Faraday Rotation .................................................. 33
Group Delay and Carrier Phase ........................................ 34
EXPERIMENT SUMMARIES ............................................. 36
Electron Content Studies ............................................ 36Storm Effects ..................................................... 42
Ionospheric Storms ............................................. 43
Plasmaspheric Storms ........................................... 43
Large and Medium Scale Irregularities .................................. 44
Traveling Ionospheric Disturbances ................................. 44Sudden Increases in Total Content ................................. 45
Small Scale Irregularities ............................................. 45
Micropulsations ................................................ 45
Fresnel Focusing by Small Intense Irregularities ....................... 45
Scintillation ....................................................... 46
BEACON IN-ORBIT PERFORMANCE ...................................... 48
Output Power ..................................................... 48Modulation Phase .................................................. 49
Antenna Performance ............................................... 50
Interference to Other Experiments ..................................... 52
APPLICATION OF RESULTS ............................................ 55
CONCLUSIONS AND RECOMMENDATIONS ................................ 57
REFERENCES ........................................................ 58
CHAPTER 3 - INTRODUCTION TO ENVIRONMENTALMEASUREMENTS EXPERIMENTS ............................................ 61
INTRODUCTION ...................................................... 61
iv
1982008279-005

VOLUME VI
CONTENTS (continued)
Page
EMETELEMETRY ..................................................... 67
Telemetry Format .................................................. 67
Handling of Digital Data ............................................. 70Handling of Bilevel (Discrete Digital Data) ............................... 70Handling of Analog Data ............................................. 71
Performance Parameters ......................................... 71
CHAPTER 4 - EME EXPERIMENTS ........................................... 73
INTRODUCTION ...................................................... 73
UCLA MAGNETOMETER EXPERIMENT, UNIVERSITY OF CALIFORNIA,
LOS ANGELES, DR. P. J. COLEMAN ...................................... 73
Purpose .......................................................... 73
Physical Description ................................................ 74
Description of Operation ............................................. 74
Basic Magnetometer ............................................ 74Digital Offset Field Generators .................................... 76Power Supply ................................................. 77In-Flight Calibrate .............................................. 77
UNH EXPERIMENT, UNIVERSITY OF NEW HAMPSHIRE, DR. R. ARNOLDY ..... 78
Purpose .......................................................... 78
Physical Description ............................................... 78Description of Operation ............................................ 78
Sweep Section ................................................. 78Pitch Angle Section ............................................. 79
U. OF MINN. EXPERIMENT, UNIVERSITY OF MINNESOTA,DR. J. R. WINCKLER................................................... 81
Purpose .......................................................... 8 IPhysical Description ................................................ 81Description of Operation ............................................. 8 i
¥
1982008279-006

VOLUME VI
CONTENTS (continued)
Page
SOLAR CELL RADIATION DAMAGE EXPERIMENT, HUGHES AIRCRAFTCOMPANY, W. C. DUNKERLY . ......................................... 83
Purpose .......................................................... 83Physical Description ................................................ 83Description of Operation ............................................. 87
NASA/GSFC/NOAA EXPERIMENT, DR. A. KONRADI AND DR. T. FRITZ ....... 89
Purpose .......................................................... _
Physical Description ............................................... 89Description of Operation ............................................. 89
MDAC EXPERIMENT, MCDONNELL DOUGLAS CORPORATION, A. J. MASLEY.. 91
Purpose .......................................................... 91Physical Description ................................................ 92
Description of Operation ............................................. 92
UCSD EXPERIMENT, UNIVERSITY OF CALIFORNIA, SAN DIEGO,DR. C. McILWAIN ..................................................... 94
Purpose .......................................................... 94Physical Description ................................................ 94Theory of Operation ................................................ 94
Detectors ..................................................... 94Electronics ................................................... 95
ASC EXPERIMENT, AEROSPACE CORPORATION. DR. G. A. PAULIKAS ........ 98
Purpose .......................................................... 98
Physical Description ................................................ 98Theory of Operation ................................................ 99
CHAPTER 5 -- EME SUPPORT HARDWARE .................................... 101
INTRODUCTION .................................................... i 0 i
vt
J
1982008279-007

VOLUME VI
CONTENTS (continued)
Page
ENCODER .......................................................... 101
Function ......................................................... !01
Encoder System ................................................... 101
Encoder Timing ................................................ l01Format Switching .............................................. 102Programming Signals ............................................ 102Real-Time Clock ............................................... 102
Digital Accumulation/Compression ................................. 103Discrete Data.................................................. 103
Analog Data .................................................. !04Parity Check .................................................. 104Telemetry Output .............................................. 105
Interface Circuits ................................................... 105
COMMAND INTERFACE CONTROL ...................................... 107
Function ........................................................ 107
Command Interface Control Operation .................................. 107
Inputs from the Spacecraft ....................................... !07
Inputs from the EME Encoder .................................... 108Power Distribution ............................................. 108Mode Control Logic ............................................ I l i
Command Verification .............................................. I l !
POWERSUPPLY ...................................................... I 11
Function ......................................................... ! i I
Power Supply Operation ............................................. ! 13
SYSTEM GROUNDING ................................................. ! 13
System Ground .................................................... 113Support Equipment Grounds ......................................... ! ! 5Experiment Grounds ................................................ i ! 5
vii
1982008279-008

VOLUME Vl
CONTENTS (continued)
Page
Chassis Ground .................................................... 116
' Telemetry Return .................................................. 116
ACTIVE THERMAL CONTROL SYSTEM ................................... I 16 '_
Purpose .......................................................... 116 t
Physical Description ................................................ 116
Description of Operation ............................................. 117
SOLAR ASPECT SENSOR ............................................... 118
Purpose .......................................................... 118Physical Description ................................................ 118Description of Operation ............................................. 118
CHAPTER 6 -- SYNOPSIS OF ANOMALIES AND FAILURES OF EME ............... 123
SOLAR COSMIC RAY EXPERIMENT (MCDONNELL-DOUGLASAIRCRAFT CORPORATION) ............................................ 123
LOW ENERGY PROTON-ELECTRON EXPERIMENT
(UNIVERSITY OF NEW HAMPSHIRE) ..................................... 123
LOW ENERGY PROTON EXPERIMENT (NATIONAL AERONAUTICS ANDSPACE ADMINISTRATION/GODDARD SPACE FLIGHT CENTER/NATIONALOCEANIC AND ATMOSPHERIC ADMINISTRATION) ......................... 123
ELECTRON-PROTO,, ,PECTROMETER (UNIVERSITY OF MINNESOTA) ........ 124
AURORAL PARTICLES EXPERIMENT (UNIVERSITY OF CALIFORNIAAT SAN DIEGO) ...................................................... 124
FLUXGATE MAGNETOMETER (UNIVERSITY OF CALIFORNIA ATLOS ANGELES) ....................................................... ! 25
SOLAR CELL RADIATION DAMAGE EXPERIMENT
(HUGHES AIRCRAFT COMPANY) ........................................ 125
ENERGEIlC PARTICLE SPECTROMETER EXPERIMENT
(AEROSPACE CORPORATION) .......................................... 126
viii
w_
1982008279-009
VOLUME Vl
CONTENTS (continued)
,. Page
CHAPTER 7 - INITIAL RESULTS FROM THE ENVIRONMENTAL
MEASUREMENTS EXPERIMENTS ............................................ i 27
INTRODUCTION ...................................................... 127
INCLINATION OF THE MAGNETIC FIELD AT ATS-6 ........................ 127
Magnetic Effects of Substorm-Associated Field-Aligned Currents .............. i 28
PARTICLE MEASUREMENTS ASSOCIATED WITHFIELD-ALIGNED CURRENTS ........................................... ! 29
The Unexpected Existence of a WarmPlasma in the Region of thePlasmaspheric Bulge ............................................... 129
Correlated Periodic Variations of Particles and the Magnetic Field ............. 129Waveand Particle Observations of Pc i Oscillations ........................ ! 29
Particle and Field Measurements of Standing ULF Waves .................... 130Ring Current Proton ULF Waves....................................... 130Energetic Electron Waves at Synchronous Orbit .......................... !30Large-Scale Trapping Boundary Waves .................................. 13 iModulation of Energetic Electrons in Association with the Sector Boun,laries
of the Interplanetary Magnetic Field ................................... 13 I
THE EXISTENCE OF DOMINANT FLUXES OF ENERGETIC HEAVY IONS ....... 132
TYPICAL PARTICLE SPECTRA .......................................... 132
SPACECRAFT CHARGING EFFECTS ..................................... 132
SUMMARY .......................................................... 133
EME BIBLIOGRAPtlY .................................................. 133
CHAPTER 8 - U.S./U.S.SR. MAGNETOMETER EXPERIMENT ..................... 137
PURPOSE ............................................................ 137
BACKGROUND ....................................................... 137
OVERALL SYSTEM DESCRlirFION ....................................... 137
ixf
1982008279-010

VOLUME Vl
CONTENTS (continued)7
= ',_e
SYSTEM HARDWARE .............................................. _q
Spacecraft Configuration ............................................. =
Madrid Hybrid Terminal ............................................ 142
DATA REDUCTION .................................................... !42
EXPERIMENT BACKGROUND ........................................... 143
CONCLUSIONS ....................................................... 148
REFERENCES ........................................................ 149
APPENDIX -ACRONYMS AND ABBREVIATIONS ............................... 15 l
LIST OF ILLUSTRATIONS
b_gure Page
Frontispiece-Environmental Measurements Experiment ............................ xxii
I-I VHRR Instrument Showing Optical Arrangement .......................... 4
I-2 VHRR Electronics Block Diagram...................................... 7
i-3 Example of a Visible Frame .......................................... 8
i-4 t-xample of ah IR Frame ............................................. 9
2-I Layout Showing Location of Radio Beacon Antennas ...................... 14
" Radio Beacon Experiment Functional Block Diagram. 14_D • • • . . . • , • ° . • • • . . • • • . , ,
2-3 Communications Module- Transverse Beam (East Face) ..................... ! 7
2-4 Separation Adapter Assembly Showing RBE Sheaths ....................... 18
2-5 Frequency Deviation _s. Temperature Curve .............................. 20
1982008279-011

t
VOLUME Vl
CONTENTS (continued) •
Figure Page
2-6 Radio Beacon Detailed Block Diagram ................................. 21
2-7 Ar_tenna Arrangement ............................................... 24
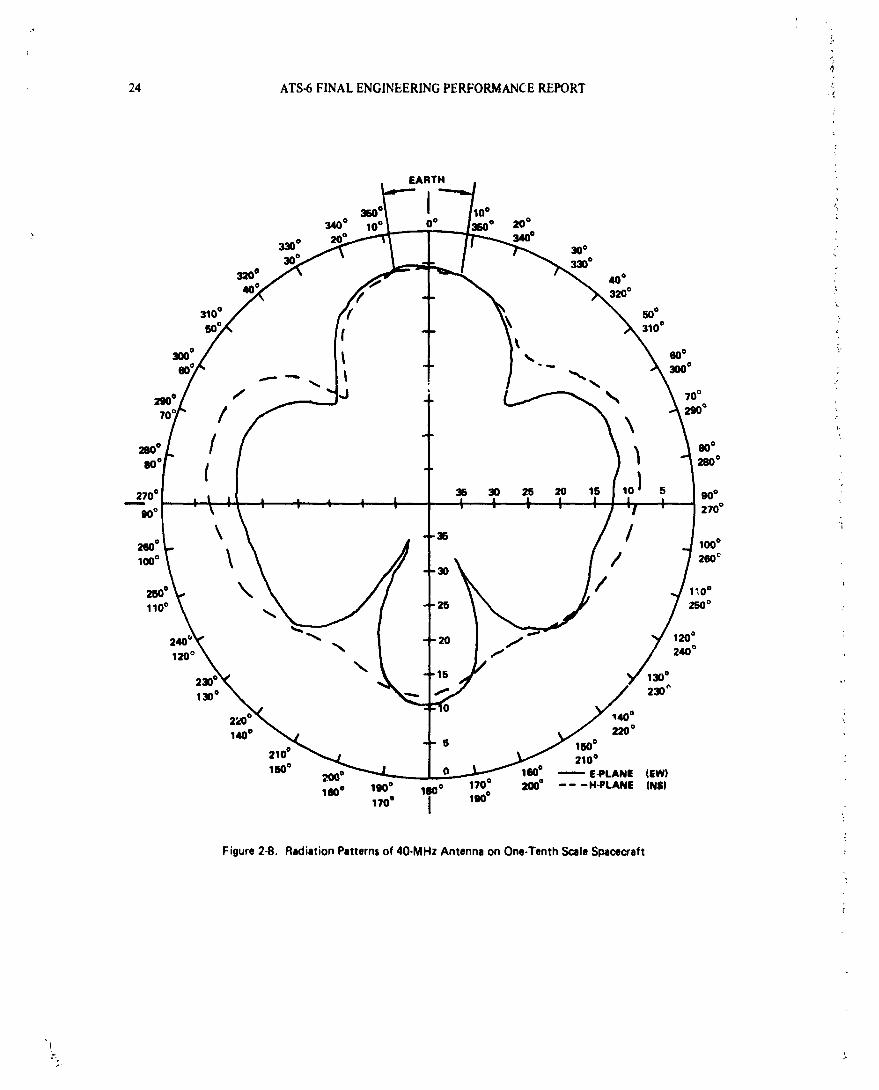
2-8 Radiation Patterns of 40-MHz Antenna on One-Tenth Scale Spacecraft ......... 25
2-9 E-Plane (E-W) Patterns of 140-MHz Antenna ............................. 26
2-10 H-Plane (N-S) Patterns of 140-MHz Antenna .............................. 27
2-1 I E-Plane (E-W) Pattern of 360-MHz Antenna .............................. 28
2-12 H-Plane (N-S) Patterns of 360-MHz Antenna .............................. 29
2-13 ATS-6 Ra.tio Beacon Receiver Locations ................................ 37
2-14 [.ocation of Receiving Equipment for the ATS-6 Rela,ed Observations ......... 38
2-15 Determination of F from Plots of Reference 23, Boulder .................... 40
2-1(_ Variation in A¢_4o with Antenna Pointing (ATS-8 at 35 Degrees) ............. 51
2-17 CxC Downlink Mode Spectra Near 3590 MHz with 61S0-MHz UplinkCarrier-Rosman, July 16, 1974 ....................................... 53
2-18 SxC Downlink Mode Spectra Near 3950 kHz- Rosman, July 16, 1974 .......... 54
2-19 VItF Monopulse X C-Band Mode Spectra Near 3950 MHz _Rosman, December 17, 1974 ......................................... 56
t
3-1 ATS-b/EME Coordinate System ....................................... 62
3-2 ATS-6/EME Interface Block Diagram ................................... 84
3-3 [:ME Data Flow Interconnections ...................................... 65
3-4 EME Telemetry Format-EME Main Frame .............................. 68
3-5 ATS-6 EME Telemetry Format -Hughes Solar Cell Experiment ............... 69
trd
1982008279-0"12

!I v
i.
i
VOLUME V!
CONTENTS (continued) i
Figure Page
4-I UCLA BlockDiagram............................................... 75
4-2 BasicMagnetometerBlockDiagram.................................... 76
4-3 Offset Field Generator Block Diagram .................................. 77 I
4-4 Double Electrostatic Analyzer ......................................... 79
4-5 UNH Experiment Block Diagram ...................................... 80
4-6 University of Minnesota Block Diagram ................................. 82
4-7 Solar Cell Terminology Chart ......................................... 84
4-8 Flight Panel Cell Location and Configuration Identification .................. 85
4-9 Solar Cell Experiment Bleck Diagram (One Signal Processor) ................. 88
4-10 NASA/GSFC/NOAA Experiment Block Dia_am .......................... 90
4-11 MDAC Expe,q,nent Block Diagram ..................................... 93
4-12 Orientation of UCSD Experiment Detector ............................... 95
4-13 UCSD Experiment Block Diagram...................................... 96
4-14 Deflection Voltage Control ........................................... 97
4-15 ASC Experiment Block Diagram ....................................... 100
5- I Encoder Logarithmic Compressor ...................................... 104
5-2 Analog/Digital Conversion Process .................................... I05
5-3 Manchester !1Code ................................................. 106
5-4 Typical Encoder Interface Circuits ..................................... 106
5-5 Input Timing Charactemtics ......................................... 107
akl
1982008279-013

VOLUME VI
CONTENTS (continued)
Figure Page
_ 5-6 Power Control Logic ................................................ 109
5-7 CIC Power Distribution .............................................. 110
5-8 Mode Control Logic ............................................... 112
5-9 EME Power Supply Blocl, Diagram ..................................... 114
5-10 ATS-6/EME Ground System .......................................... 115
5-11 Solar Aspect Sensor Fields of View ..................................... 119
5-12 Solar Aspect Sensor Operational Diagram ................................ 120
8-1 U.S./U.S.S.R. MageConfiguration ...................................... 138
8-2 Data Collection Piatform ............................................. 140
8-3 ATS-6 Telemetry Format-EME Main Frame ............................. 141
8-4 DCP Data Format .................................................. 143
8-5 Hybrid Terminal Configured for the Mage................................ 144
8-6 Mage Data Flow ................................................... 145
LIST OF "[ABLES
Table Page
2-1 Examples of AI'S-6 Cooperation Between Organizations on anInternational Basis.................................................. 12
2-2 Summary of Electrical Characteristics, Prelaunch .......................... 16
2-3 Master Oscillator Performance Characteristics ............................. 19
2-4 Comparison of Preflight and In-Orbit Radiated Power ...................... 49
xiii
1982008279-014

VOLUME Vl _
CONTENTS (continued) _.
Table Page _
3-1 EME Flight Equipment .............................................. 63\
3-2 Experiment System Description ....................................... 66 ,
/
3-3 Support Equipment System Description ................................. 66 .;
4-1 Solar Cell Flight Experiment Configurations .............................. 86L
1982008279-015

ORIGINAL PAGE IS
OF POOR QUALITY
FOREWORD
ATS-6 has been referred to as Arthur C. Clarke's "Star," because Mr. Clarke originated the idea for
synchronous communications satellites in an article that he wrote in 1945. In 1975, Mr. Clarke wasactively engaged in monitoring the Indian Satellite Instructional Television Experiment on ATS-6
and giving feedback to the Indian Space Research Organization. We, therefore, felt that it would be
appropriate for him to contribute the foreword for this report.
An excerpt from his response to our request and selected paragraphs from his contribution, "School-
master Satellite," follow.
FROM THE DESK OF THE CHANCELLOR I'
__ UNIVERSITY OF MORATUWA, SRI LANKA I.l
i
_.#te&8., ¢¢,'&#)_.d.qte&, qt_._.q_ nteL ,_c_: _ 25, @r_-_d _e_,_q=,
(_zn_d _._d _d _ ea_5_ Tel: 94255 "Leslie's House" ,
Arthur C. Clarke Cable: Under_ 25, Barnes Place, ]B.Sc., _.R.A.S., F.B.I .S. Colombo Colombo 7.Fcllo_ of Ki,_g's College, London,
I"
24th September 1980 -
The extracts that follow are from an essay that was written in 1971, almost five years before
the SITE program became fully operational, and originally appeared in the Daily Telegraph Colour
Magazine for 17 December 1971. It was later read into the Congressional _ecord (27 January 1972)by Representative William Anderson, first commander of the nuclear submarine Nautilus, and nowforms Chapter 12 of The View From Serendip (Random House, i977: Ballantine, 1978).
To me, it brings back vivid recollections of my meetings with Dr. Sarabhai, the chief instigator ,of the program. I would like to dedicate it to his memory - and to that of another good friend, also Iclosely associated with the project - Dr. Wernher yon Braun.
Arthur C. Clarke
Chancellor Vikram Sarabhai Professor, Physical Research
University of Moratuwa Laboratory, AhmedabadSri Lanka India
XV
1982008279-016

b
3
I :SCHOOLMASTERSATELLITE
"For thousands of years, men have sought theft future in the starry sky. Now this old super-
stition has at last come true, for our destinies do indeed depend upon celestial bodies-those thatwe have created ourselves...
"In 1974 there will be a new Star of India; though it will not be visible to the naked eye, itsinfluence will be greater than that of any zodiacal signs. It will be the satellite ATS-F (ApplicationsTechnology Satellite F), the latest in a very successful series launched by America's National Aero-
nautics and Space Administration. For one year, under an agreement signed on September 18, 1969,ATS-F will be loaned to the Indian Government by the United States, and will be "parked" 22,000
relies above the Equator, immediately to the south of the sub-continent. At this altitude it will com-plete one orbit every 24 hours and will therefore remain poised over the same spot on the turningEarth; in effect, therefore, India will have a TV tower 22,000 miles high, from which programmes
can be received with almost equal strength over the entire country.., i
"ATS-F, now being built by the Fairchild-Hiller Corporation, represents the next step in the ' "evolution of communications satellites. Its signals will be powerful enough to be picked up, not
merely by multi-million dollar Earth stations, but by simple receivers, costing two or three hundred
dollars, which all but the poorest communities can afford. This level of cost would open up the
entire developing world to every type of electronic communication-not only TV; the emerging isocieties of Africa, Asia and South Americ_ could thus by-pass much of today's ground-based tech- .:
nology, and leap straight in to the space age. Many of them have already done something similar in
the field of transportation, going from ox-cart to aeroplane with only a passing nod to roads and
railways. !
"It can be difficult for those from nations which have taken a century and a half to slog from Isemaphore to satellite to appreciate that a few hundred pounds in orbit can now replace the conti-
nent-wide networks of microwave towers, coaxial cables and ground transmitters that have been con- Istructed during the last generation. And it is perhaps even more difficult, to those who think of
television exclusively in terms of old Hollywood movies, giveaway contests and soap commercials to isee any sense in spreading these boons to places which do not yet enjoy them. Almost any other use
of the money, it might be argued, would be more beneficial... I2i
"Those who actually live in the East, and know its problems, are in the best position to appre- Iciate what cheap and high-quality communications could do to improve standards of living and
reduce social inequalities. Illiteracy, ignorance and superstitution are not merely the results ofpoverty-they are part of its cause, forming a self-perpetuating system which has lasted for centuries,
and wl ich cannot be changed without fundamental adva:tces in education. India is now beginning a
Satellite hlstructional Television Experiment (SITE) as a bold attempt to harness the technology of
space for this task; if it succeeds, the implications for all developing nations will be enormous.
"Near Ahmedabad is the big 50-foot diameter parabolic dish of the Experimental SatelliteCommunication Ground Station through which the programmes will be beamed up to the hoveringsatellite. Also in this area is AMUL, the largest dairy co-operative in the world, to which more than
a quarter of a million farmers belong. After we had finished filming at the big dish, our camera teamdrove out to the AMUL headquarters, and we accompanied the Chief Veterinary Officer on hisrounds.
xvi
1982008279-017

iI
SCHOOLMASTERSATELLITE "
"At out first stop, we ran into a moving little drama that we could never have contrived delib-
erately, and which summed up half the problems of India in a single episode, A buffalo call" was ',dying, watched over by a tearful old lady who now saw most of her worldly wealth about to dis-
appear, if sb,, had called the vet a few days before-there was a telephone in tile village for this very
purpose--he could easily have saved the calf. But she had tried charms and magic first; they are notalways ineffective, but antibiotics are rather more reliable...
"! will not quickly forget the haggard, tear-streaked face of that old lady ill Gujerat: yet her'!
example could be multiplied a million times. The loss of real wealth throughout India because of
ignorance or superstition must be staggering, if it saved only a few calves per year, or increased pro- _,
ductivity only a few per cent, the TV set in the village square would quickly pay for itself. The very
capable men who run AMUL realise this; they are so impressed by the possibilities of TV education _'
tha: they plan to build their own station to broadcast to their quarter of a million farmers. They ,:have tile money, and they cannot wait tbr the satellite-though it will reach an audience two thou- "sand times larger, for over 500 million people wiil lie within range of ATS-["... _
"And those who arc tmimpressed by mere dollars should also consider the Imman aspect asdemonstrated by the great East Pakistan cyclone of 1971. That was tracked by tile weather s_tcl-lites--but tile warning network that might have saved several hundred thousand lives did not exist.Such tragedies will be impossible in a world of efficient space communications. -_
"Yet it is the quality, not the quantity, of life that really matters. Men need information,
news, mental stimulus, entertainment. For the first time in 5,000 years, a technology now existswhich can halt and perhaps even reserve the flow iYom the country to the city. The social imphca-
tions of this are profound; already, the Canadian Go'vernment has discovered that it has to launch a
satellite so that it can develop the Arctic. Men accustomed to the amenities of civili_tiou simply
will not live in places where they camlot phone their families, or watch their favourite TV show.
The conuuunications satellite call put an end to cultural deprivation caused by geography. It isstrange to think that, ill the long run, the cure for Calcutta (not to mention L.ondon, Ncw York,
TokyoL may lie 22,000 miles out iv, space.., i
"'The SITt! project will run lot i year, and will broadcast to about _ 000 rV set,,,in carelu'.ivselected areas. This figure may not seem impressive when one considers the si/c of India, but it re-quires only one receiver to a vRlage to start a social, economic and etluc:Hionai revohHitm, if the
experiment is as great a success as Dr. Sarabhai and his colleagues hope (and deserves/, then the next,st,ep would be for India to haw. a full-time communications satellite of her own. This is, in any case,e,',sential for tile country's internal '.'adio, telegraph, telephone and tele_ sen'ices...
"Kipling, who wrote a story about "wireless" alld a poem to the deep-sea cables, would havebeen delighted by tile electronic dawn tllat is about to break _dl_ontile sub-continent. (;andhl, Oll
the otller hand, would prol, ably have been less enthusiastic: for much of the hldta that he knew will
not survive tile changes thP_tarc now coming.t.t
t
t!
xvil
"1982008279-0"18

SCHOOLMASTER SATELLITE
"One of the most magical moments of Satyajit Ray's exquisite Pather Panchali is when the
little boy Apu hears for the first time the Aeolean music of the telegraph wires on the windy plain.
Soon those singing wires will have gone forever; but a new generation of Apus will be watching,
.-- wide-eyed, when the science of a later age draws down pictures from the sky-and opens up for all
the children of India a window on the world."I
A. C. Clarke
xviii
.¢&
1982008279-019

' ACKNOWLEDGMENTS
Many scientists, engineers, and technicians, too numerous to mention by name, have contributed to
these volumes. Engineers at Fairchild Space and Electro,des Company and Westinghouse Defense
and Electronic Systems Center compo_d the chapters from material supplied by subsystems
designers of the various systems and experiments, and have worked closely witll the editors to com-
plete this report. They have the editor's gratitude.
In parlicular, thanks go to Mr. Ralph tlall at Fairchild Space and !!lectronics ('ompz, ny and Mr.
James Meenen of Weslinghouse I)elk'n,_ and Electroz,,c Systems Center for their patient coopera-
tion. thorough review, and constructive ¢oillnlelltS alld suggestions.
"1982008279-020

PRECEDING PAGE BLANK NOT FILMED
,'. INTRODUCTION
ATS-6 was the final satellite in a series of six of the Applications Technology Satellite Program ofthe National Aeronautics and Space Administration. It was designed and built by Fairchild Space
and Electronics Company, Germantown, Maryland, under NASA Contract NAS5-21100 from i!
NASA Goddard Space Flight Center.iI
At the time of its launch, it was the largest and most powerful communications satellite to go intoorbit.
The mission of ATS-6 was to demonstrate and evaluate the application of new technologies forfuture satellite systems. This it accomplished by demonstrating the first direct-broadcast television
from geosynchronous orbit; by demonstrating many new communications technologies; by relayingdata from, and tracking, low-orbiting satellites; by relaying communications and positions of ships
and aircraft; and by supporting a variety of other experiments involving communications, meteor-ology, particle and radiation measurements, a:_dspacecraft technology.
The purpose of this report is to document the lessons learned from the 5-year ATS-6 mission that
might be applicable to spacecraft programs of the future. To satisfy this purpose, the six volumes ofthis report provide an engineering evaluation of the design, operation, and performance of the sys-tem and subsystems of ATS-6 and the effect of their design parameters on the various scientific andtechnological experiments conducted.
The overall evaluation covers the following:
• A summary of the ATS-6 mission objectives, operations, and results
• A summary description of the spacecraft system and subsystem requirements, the designsevolved to meet these requirements, and special analyses and ground testing performed tovalidate these designs and to confirm the flight integrity of the spacecraft
• A comparative evaluation of the 5-year performance and operations in orbit relative tothose specified and demonstrated during ground tests prio r to launch
• A summary of anomalies that occurred in the hardware, probable causes, and recommenda-tions for future spacecraft systems
• A summary evaluation of the various technological and scientific experiments conducted
• A summary of conclusions and recommendations at the spacecraft system and subsystemslevels that address considerations that might be relevant to future spacecraft programs orsimilar experiments.
x.v,lt
1982008279-021

198200827.q-r}pp

ATS-6 ,-
Final Engineering Performance Report
Volume VI
1982008279-023

pRECEDING PAGF-.BLANK NOT FILMED
CHAFFER 1
VERY HIGH RESOLUTION RADIOMETER
INTRODUCTION
The ATS-6 Very High Resolution Radiometer (VHRR) was the first suchinstrument to be installedon a three-axis stabilized geosynchronous satellite for meteorological purposes. The stable platformprovided by ATS-6 made it possible to take many sequential pictures of the same meteorologicalevent with much better resolution than was provided by previous radiometers. The forerunners ofthe VHRR were mounted on spin-stabilized satellites and looked at the Earth once every spin or20 degrees out of 360 degrees. ATS-6 could be pointed so that the radiometer could view theEarth continuously.
The primary objectives of this experiment were to determine wind velocities from the motion ofcloud formations, to study the life cycles of severe local storms, tropical and extratropical cyclones,
and to investigate improved methods of determining the temperatures of the land and sea surfacesand of cloud tops.
DESIGN DESCRIPTION
The VHRR instrumentconsistedof two separatepackages.The optical packagecontainedthe sen-sotsandtheir associatedleases,filters,mirrors,calibrationsources,andtemperaturecontrol devices.The electronicspackagecontained the circuitry for supplyingpower, processingthe data stream,and controlling andmonitoring the functionsof the optical package.
The optical package,which wasthermally isolated from the spacecraftstructure,wasapproximately64 X 38 X 31 centimeters(cm) and weighed43.5 kilograms(kg). It wasinstalledin the northwestcorner of the spacecraft Earth-viewing module with tile optical port on the Earth-viewing face andthe radiant cooler on the north face. The electronics package was mounted on the spacecraftstructure and used the structure as a heat sink.
Figure I-1 is a sketch of the VHRR ins'rument showing the optictl arrangement.
The telescope and sensors were stationary with respect to the spacecrafL and scanning of the 20-
degree by 20-degree field-of-view was accomplished by tilting the scan mirror in two axes. Thefast-scan axis scanned alternately east and west and the dow-scan axis scanned from south to north.The instantaneous field-of-view of each of the two visible sensors was 0.15 milliradians that covered
approximately a 5.$-kilometer (kin) square on the Earth. The infrared (IR) sensor had an instan-taneous field-of-view of 0.30 milliradians or an I I-kin square on the Earth.
1982008279-024

4, ATS.6 FINAL ENGINEERINGPERFORMANCEKEPORT
(*x|
t
NORTH(-Y)
TI[IdUlCOPll
IARTH.VI|IM_
IARTM I',X] f f ' " _*_ POnT
RN MIIIEIEOR PAIn'
,-.; -i\. t -- ....t
' IMIRROR llLOWIICANAXI Welt
I-X)
Figure1-1. VHRR InitrumontShowirqI Omi_l Arrangement(Sheet1)
f
1982008279-025

VERY HIGH RESOLUTIONILJtDIOMETER 5
LIOHTPIPE
, \
TO EARTH _"(+Z)
SCANMIRROR
/ \
|-X)
Figure 1 1. VHRR Instrument Showing Optical Arrangement (Sheet 2)
A reflective chopper wheel,which rotated at 3000 revolutions per minute (rpm) was located in thelight path between the telescope and the visible sensors so that when a tooth of the wheel was inthe path. the image would be reflected 90 degrees to the IR sensor, and when a tooth was not inthe path. the image would pass between the teeth to the two identical visible sensors.
Calibration of the optical packa_ was accomplished using a reference black body. a hot patch.deep space, and sunlight.
The refereace black body wu positioned so that when the image o¢ the Earth was reflected off thefront of a chopper wheel tooth to the IR sensor, the visible sensors saw the reference black body
1982008279-026

6 ATS-6FINALENGINEERINGPERFORMANCEREPORT
by reflection off the back of the tooth. When the visible sensors saw the image between two teeth,the IR sensors saw the reference black body between the same teeth.
The hot patch was used for calibration of the IR sen,._r by slewing the scan mirror to look at thehot patch at the end ot each complete picture sequence.
Deep space was viewed at the start and end of each scan off the edge of the Earth. Thts was usedfor the cold calibration point for both the visible and IR sensors.
A fiber-optics light pipe and mirror were incorporated in the instrument to view the Sun througha filter and the visible calibration port on the Earth-viewing side of the instrument at an appro-priate time of the day. The mirror could be commanded to a position between the telescope andthe chopper wheel so _P,at the Sun would be reflected into the sensors instead of the normal Earthimage. The instrument failed prior to performing the visible calibration in orbit. '_
A radiant cooler passively r, aintained the IR detector at 115 K. Automatic protection was providedagainst inadvertent overheating from the Sun by a shutter that would close over the inner portio,"of the cooler if the temperature of the IR detector reached 210 K. Decontamination of the coolerwas provided by closing the Sun shutter and turning on two heaters in the cooler cone.
The electronics package contained amplifiers fog each of the three sensors, analog-to-digital con-verters, a line-sync generator, analos and digital multiplexers, and a calibration-voltage generatorto check linearity and calibration accuracy of the three amplifiers. Figure i-2 is a block diagram ofthe electronics package.
The VHRR system was designed with a primary (digital) mode and a backup (analog) mode to pro-vide redundancy in the electronics.
In the primary mode, the VHRR housekeeping telemetry was merged with the image data andrelayed to the ground station via the communications subsystem C-band transmitter. In the backupmode. telemetry was available o.'.y by the normal very high frequency (vht') telemetry from thetelemetry and command subsystem.
The linearity and gain of the electronics was checkeo _,_ in_rtion of s precise six-step cafibrationvoltage waveform into the amplifiers at the end of each line ,_fdata.
ORBIT OPERATIONS AND PERFORMANCE
ATS-6 was Launched with the VHRR chopper motor running and the radiant cooler-cone doorclosed. After achieving synchroaous orbit, the cooler-cone heater', were commanded on for twoweeks to outgas any contaminants that might have gotten into the radiant cooler.
When the heaters were turrod off and the cone door opened, the patch temperature dropped to! 15 K and maintained the IR detector at that temperature as long as the Sun elevation anlle tothe cooler remained below the design specification of 23.5 degrees.
1982008279-027

i
VERYHIGHRESOLUTIONRADIOMETER ? ,_
1982008279-028

I'
8 ATS-6 FINAL ENGINEERING PERFORMANCE REPORT {;
During the end-of-life tests, the IR patch temperature was checked; however, the cooler-cone door
was closed and, therefore, not operating. The patch temperature was 174 K. iit
The boresight alignment of the instrument was 1.5 degrees to the northeast of the design goal. This _.
,_." misahgnment was easily corrected by changing the pointing of ATS-6 during VHRR operations. ]|:
,, Figure 1-3 is an example of a visible frame and Figure 1-4 shows an IR flame obtained in orbit, ti
I
1L
!
Figure1-3. Exampleof aVisibleFrame
t.iRIGINAI r,Ar.r
BLACK AND WHITE i-":,OIC_G,APN
%: L*
1982008279-029

VERYHIGHRESOLUTIONRADIOMETER 9
Figure 1-4. Example of an IR Frame
IN-ORBIT ANOMALIES
Shortly after launch, the spacecraft telemetry showed a slight unexplained increase in VHRRtotal current drain. There did not appear to be any associated degradation in performance.
The chopper motor ran continuously from before launch until its failure 2t/2 months after launch
except for a few brief periods when it was turned off. After the instrument failed, the telemetryshowed that the current drawn by the VHRR was within ten percent of the known stall current of
the chopper motor. "Pests of similar units on the ground did not produce any conclusive results as
to why or how the failure occurred.
ORIGINAL PAGE
BLACK AND WHITE PHOTOGRAPH'
-- I
1982008279-030

10 ATS-6FINALENGINFERINGPERFORMANCEREPORT
Unreliable scan starts and scan servo ringing were observed throughout the life of the instrument.
These occurrences complicated the data reduction process, but were satisfactorily overcome.
CONCLUSIONS AND RECOMMENL':_.TIONS
Analysis of the VHRR data showed that estimating wind velocities from the movement of clouds isfeasible.
r-
The VHRR instnunent failed in mid-August, prior to the 1974 hurricane season, resulting in a com-plete lack of severe storm data.
Analysis of cloud and Earth surface temperature was not performed.
The muitimission ATS-6 was not an ideal vehicle for a meteorological instrument like the VHRR.Many of the experiments on ATS-6 required the spacecraft to be aimed at points on the Earth that
were incompatible with the VHRR, and many used so much power that they could not be per-
formed simultaneously with the VHRR. These incompatibilities required advanced scheduling ofATS-6 usage, whereas, the VHRR experimenter would have preferred to have priority during
significant meteorological events.
1982008279-031

t
CHAPTER 2 t,
RADIO BEACON EXPERIMENT
INTRODUCTION
Experiment Objective=
The Radio Beacon Experiment (RBE) provided a multifrequency spacecraft-to-sroundlink forinvestigating the mechanisnzs of radio propagation through tile Earth's plasmasphere and ionosphere.Three coherently related modulated carriers were used simultaneously operating near the frequencies
of 40 megahertz (MIIzL 140 MHz, and 3bO Mttz. This technique enabled unambiguous measure-ment of phase and Faraday rotation of polarization of the received signalq for lhe determination ofthe columnar electron content, its density distribution a!ot_g the propagation path. and its gee- !graphic and temporal variations. The geosynchronous orbit of the beacon, for the first time, per-
mitted measurements with high-time resolution for fixed geographic-geomag, netic propagation pathconfiguration.
The specific areas of investigation included the behavior of the plasmasphen: during and following
plasmaspheric storms, g_lar flare effects, large and small scale structures, including traveling disturb-
antes, micropulsations, diffraction effects of small intense ionospheric lenses, and further study ofradio scintillation.
Participants
l:l 1070, K. Davies of the Space F_nvironment Laboratory (SFL) of the National Oceanic and
Atmospheric Administration's Environmental Research Laboratory, Boulder, Colorado, was ap-
pointed Pri,cipal Ineestigator with the responsibility for coordination between experimenters and
the National Aeronautics and Space Administration. R. N. Grubb of SI-L, who wrote the specifi-cation for the beacon: A. deRosa of Stanford University, United States; G. H. llartmann of the
Max-Planck Institute liter Aeronomie, Lindau/llarz, West (,;enuany; and R. (3. Rastogi of the
Physical Research Laboratory, Ahmedabad, India, wen: later appointed coinvestigators.
The extent of the international cooperation :_,mongthe radio-beacon conununity is demonstrated by
the number of cooperative ventures during the life of ATS..O. Table 2-1 presents some examples or"these venttttes.
Long bet'on: the launch of ATS-6. a forum was provided by the Cospar Satellite Beacon Group
(under Panel I B) chain:d by R. Leitinger of the Universitaet (;rat, Graz, Austria. A series of sym-posia were held: Lindau, W, Germany, 1_70; Graz, Austria. 1972;Moscow, U.S.S.R., Iq74; Boston,
1982008279-032

(
12 ATS-6FINALENGINEERINGPERFORMANCEREPORT
Tabl: 2-1
Examples of ATS-6 Cooperation Between Organizationscn an International Basis
Phase l - 94°W Longitude
Organizations Stations Investigators
NOAA + MPIA Boulder (F, G, A)*, Fort Morgan (F), Elbert (F) Davies, Hartmann _,+ Graz Bozeman (F, G, A), _allas (F, G, A) Leifinger
GDR Acad. Sci. + Havana (F) Felske :Cuba Acad.Sci. Luzo _,
IZMIRAN Havana (F) Sinel'nikov i_Cuba Acad.Sci. Jiminez
Phase2 - 35°E Longitude
NOAA + PRL Oot.lcamund (F, G, A) Davies, Rastogi
Univ. II1.+ Warsaw (F, G, A) Yeh, WernikPolish Acad. Sci.
Wales + AFGL Aberystwyth (F, G), Boston (F, G) Kersley,Kiobuchar
PRL + AFGL Ahmedabad (F, G, A) Rostogi,Klobuchar
MPAE + Graz Lindau {F, G, A), Graz (F, G, A) Hartmann.
Leitinger
Israel + Haifa (F) Soicher,Ft. Monmouth Keroub
Phase 3 - 140°W LongittMe
Alcorn St. Univ. + Lorman, Miss. (F, G) Paul,
Graz Leitinger
Lancaster + Fairbanks, Aka. (F, G) Hargreaves, ;Geophys. Inst. Hunsucker '_
*G - group delay, F = Faraday rotation, A = amplitude
1982008279-033

RADIOBEACONEXPERIMENT 13
Massachusetts, United States, 1976; and Florence, Italy, 1978. A great deal of information on theATS-6 Radio Beacon Experiment and other beacons is available from the proceedings of thesesymposia.
This report relies heavily on the information contained in technical papers provided by K. Davies,the Principal Investigator, concerning the various investigations made with the beacon.
Experiment Scheduling i!
The Radio Beacon Experiment was designed to operate continuously throughout the life of ATS-6. i'
Prime power limitations during the equinox periods and beacon interference to other experimentsprevented meeting this goal. In this regard, operation of the radio beacop was relegated to a loworder of priority with relation to the other onboard experiments. -.
SYSTEM DESCRIPTION i;
GeneralDescription !,
The radio beacon package consisted of a low-power, three-frequency transmitter, and an array ofhalf V-beam antennas. The transmitter was mounted in the communications module of the Earth-
viewing module (EVM) and the antennas were mounted on the east and west face as shown in
Figure 2- I.
A block diagram of the transmitter is shown in Figure 2-2. The three carriers near 40, 140, and
360 MHz and the modulation frequencies were derived from a pair of redundant 20-MHz oscillators
and synthesizers. After multiplication and filtering to generate the common frequencies, the carrierswere double-sidebanded, partially suppressed, carrier-modulated and then ami:lified to the required
power level by wideband power amplifiers.
The requirement to maintain the 40-MHz carrier output power constant at 0.1 decibel (dB) neces-sitated a feedback loop for level control. Because of the presence of the amplitude envelope on thecarrier, a synchronous detector with a zero.order, phase-controlled loop was used to sample tile out-put carrier power independently of the sidebands.
The antenna design was constraln_d between the two XY faces of the EVM (prime-focus feed andEarth-viewing face) and the fields-of-view of the Sun sensors. A summary of the performance is pre-sented in Table 2 2.
PhysicalDescription
The RBE electronics packages were mounted within the communications module. Their relativelylow power dissipation (23 watts) enabled them to be mounted on the east side of the transversebeam (Figure 2-3).
),
o
ik
1982008279-034

14 ATS-6 FINAL ENGINEERING PERFORMANCE REPORT
DISH-Z
I COMMUNICATION3 I +Y�YSUBSYSTEMSOUTH"_._ --- * _ SOUTH
// / _ I / _ I _/ _-_ \ 4ouHz4o..z //,, / _ I / _ I .,I" ___..z" \1.73
1°'73Y/ Z "_ _ 11[_nl X/ 14oUHZ _ I
/ 2Am +Z +_1.TEm EARTH EARTH
{3SUNSEN$ORS
Figure 2-1. Layout Showing Loc6tion of Radio Beacon Antennas
40.MH-POWlR
100-kH| X2 • LEVELPOWER MOOULATOI CONTROL
A DIVIDER
1982008279-035

t
i
RADIOBEACON EXPERIMENT 15 ,-
Table 2-2
Summary of Electrical Characteristics, Prelaunch
Parameter Value
Target Actua'. (25°)
Effective lsotrepic Radiated Power: '_
40-MHz Carrier 500 mW 758 mW
lOO-kHzsidebands (on 40 MHz) 250 mW 239 mW :I-MHzsideband_ (on 40 MHz) 250 mW 478 mW
140-MHzCarrier 1600 mW 1698 mW
I-MHzsidebands (on 40 MHz) 400 mW 426 mW
360-MHzCarrier 2000 mW 3090 mW 0
I-MHzsidebands (on 360 MHz) 250 mW 360 mWlO0-kHzsidebands(on 360 MHz) 250 mW 295 mW
MeasuredAntenna Gains:
At 40 MHz and sideband 3.2 dB :At 140 MH: and s/deband 3.7 dBAt 360 MHzand sideband 4.1 dB
Transmitter CarrierOutputs at Antenna Input:
40 MHz 363 mW140 MHz 724 mW360 MHz 1202 mW
1 MHz Modulation (on 40- and 140-MHzCarriers)PhaseStability +21o
1(30kHz Modulation (on 40- and 360-MHzCarriers)Phase Stability +2°
100 kHz Modulation Relative to 1 MHz- 10 (on 40-MHzCarrier)I_,,,aseStability *2°
Frequency Stability vs. Temperature ±2 parts in 107
Oscillator Aging(Preaged)/2 YearMLukm ±2 parts in IOT
Prime Power Requirements 23 watts max. ;
Qualification Temperature Range .11°C to +53°C '
Package Size (Excluding Antenna) 3458 cu cm(35.6 cm X 13 cm × 9.4 cm)
1982008279-036

16 ATS-6 FINAL ENGINEERINGPEPFORMANCEREPORT
1982008279-037

7t
RADIO BEACONEXPERIMENT 17
The RBE antenna system consisted of three separate antennas for the three basic frequencies. These
were mounted on the -X (west) side and the +X (east) side of the EVM (Figure 2-1). During launch,
the antenna elemenLs were retained within the fairing dynamic envelope by loosely-fitting, teflon-
lined sheaths, as shown in Figure 2-4. The elements slid out of these during separation from the
Titan III transtage and sprang into their in-orbit co.figuration.
Electrical Description
The major transmitter design goal was that of obtaining a high order of phase stability to enable
measurement of group delay to the required precision. No means of verifying the in-orbit perfor-
mance was provided; hence, great care was taken to ensure long term stability and to minimize short
term environmental effects. The performance of the 20-MHz oscillator and synthesizer assemblies
wu crucial in obtaining the desired overall electrical performance of the beacon.
The master oscillator employed was a highly-stable, temperature compensated crystal oscillator
followed by a buffer ampfifier to reduce the effects of load variations on the oscillator. By employ-
ing a large capacitance-to-inductance ratio and closely controlling the mechanical layout, the effect
of stray capacitance variations on frequency was minimized. A series operated third-overtone crystal,
preaged foi stability, was used to enable widerange temperature compensation. Compensation was
ADAPTER NOUIIING IIHEATH8 FORRIlE
BASE FITTING
TUIIING/ADAIrrER LEGII
Figure 2.4. Sel_rltion AdapterAuemblv ShowingRBESh_lthl
,P
1982008279-038

18 ATS-6FINALENGINEERINGPERFORMANCEREPORT
achieved by a thermistor-diode-capacitor network that sensed the temperature and retuned the oscil-lator circuit to offset the frequency shift. The short term frequency stability was obtained by usinga 2N918 transistor biased for minimum noise.
t
The buffer amplifier used a 2N2369 transistor in a common base configuration operating at a point
for minimum noise figure and maximum power gain. The output power was 0.2 milliwatt (mW)delivered to a 50-ohm load. Th¢ performance specifications of the oscillator are summarized in
Table 2-3. Typical frequency stability with temperature for the flight unit is shown in Figure 2-5.
A detailed block diagram of the radio beacon transmitter is shown in Figure 2-6. Synthesis of the
various frequencies began with the 20-MHz signal from each of the redundant master oscillators,after buffer-amplification, by means of a hybrid divider. One portion of the divider output was
used to drive the multiplication stages and amplifiers that generated the three radio frequency
carriers. The other portion was fed to dividers and filters that generated the I-MHz and lO0-kilo-hertz (kHz) modulation signals. The dupl!cated outputs of the redundant chains were respectively
fed to hybrid power combiners. This arrangement enabled a changeover between the two synthe-sizers to be performed by simply switching the direct current (d.c.) power from one to '.he other.
The 20-MHz signal from the power combiner was fed to a hybrid that split the signal into two
paths. One path was applied to an X7 multiplier and amplifier to drive the 140-MHz modulator andpower amplifier. The other path fed another hybrid divider that again divided the 20-MHz signal
Table 2-3
Master Oscillator Performance Characteristics
Parameter Specifications
Frequency vs. temperature (qualification test) Freq = ±1 part in 106 for a
temperature r_,nge of- i I°C to53°C.
Frequency vs. temperature (acceptance test) Freq ---+2 parts in 107 Ior atemperature range of 5°C to38°C.
Frequency accuracy at 19°C + I part in 107
Power output 0.2 mW delivered to a 50-Fl load.
Short term stability measured at 20 MHz I part in 1040 for 0.25-see
average time.
Power consumption at 25°C 200 roW, maximum
Supply voltage variation effect on frequency Less than 3 parts in 107 measured
at 25°C (v ±10 percent) at 25°C.Size 6.17 × 4.14 × 2.03 or 51.9 cu ¢m
Weight 7 i grams
1982008279-039

• It .
RADIO BEACON EXPERIMENT 19
l_ I " I I '" I I I ' I
I
i11 : 104 AJSlGNED FREQUENCY
i O-- I I 1 °
T I
I OPERATING I[ .,w- TEMPE RATUR! --m I
v. , i IEXPECTED)" i
; ! "CCEPT*NCETEST I
_ -40 , _.----. TEIMPE RATUR E uMITS---,_ --I I 2c.) I I I
I II
40 IIr_ _UALIFICATION TEMPERATURE LMAITI -- -- 3
II
,so- II *EXPECTED TEMPERATURE RANGE FOR ATS FIG
SATELLITE--4
l l I I I 1 I-20 -10 0 10 20 30 40 SO EO
TEMPERATURE - DEGREES CELSIUS
Figure2-5. FrequencyDeviationvs.TemperatureCurve
into two paths. One path drove an X2 multiplier, bandpass filter, ap.d amplifier for deriving the
40-MHz signal', the other i: ' _1fed cascaded X6 and X2 multiplier stages and an amplifier that drove
the modulator and power amplifier for the 360-MHz carrier. A diode-ring double balanced modula-
tor with appropriate bias to control the partially suppressed carrier was used in each chain.
Each of the three power amplifiers consisted of two stages. The rust stage was a common-emitter
driver operating in a Class A mode. The second stage employed a push-pull Class B configuration.
This approach was used to minimize amplitude modulation distortion while conserving supply ,.
power.
To maintain the 40-MHz carrier output power level constant to within ±0, l dB, it was ncces_ury to
use a high-_in, automatic-level control loop. This loop operated in the following manner: A I 5-dB
miniature directional coupler was used to provi_: a sample signal. This signal drove two double-
balanced mixers used as phase detectors. A sample of the unmodulated carrier was used as a refer-
ence to provide adc output from one detector proportional to the carrier amplitude. To ensure that
1982008279-040

20 ATS-6 FINAL ENGINEERINGPERFORMANCEREPORT
TO IH|ET |PiGUR| 24
_0 I I +:i P t..m,m mE
j m,mmq _
• -0 I i �l�i
'14_'1 kH''' i lii_ Ii
Figure2.6. RadioBeKon DetailedBlockDia41ram(Sh_t 1)
1982008279-041

RADIO BEACONEXPERIMENT 21
_" FROM I_] _TLM A_TENNA 1
SHEET 1 I I 140 MHz _!
'_ FIGUR_ 2-6 1 MHz _- . I
_, 1 OUTPUT ._, HYBRID
_NTENNA 2
A_|TENNA 3
L__.] _0M., --12 - _ _.L OUTPUT _ HYBRID
..J
tM.,) ANTENNA 4100kHz'
40 MHz _ 7 ANTENNA §3 POWER VOLT VAR OUTPUT
DIVIDEH ATTEN
DIVIDER
PHASE DIVIDERSHIFTER HYBRID
_J
DETECTOR ! "_
MONITOR
TLM
ANTENNA 6
Figure 2-6. Radio Beacon Detailed Block Diagram(3heet 2)
I
1982008279-042

22 ATS-6FINALENGINEERINGPERFORMANCEREPORT
!
this reference signal was in phase with the output carrier sample, a second detector, driven in quad-rature, was used in a zero-order, phase-correction loop. The dc output of the carrier detector wascom}_ed with a dc reference and the amplified difference was applied to a voltage-controlleramplifier in the transmitter chain.
?
The radio beacon was provided with its own de/de converter that was intended to permit its opera-tion during eclipse periods that severely restricted spacecraft power consumption. The separate con-verter was also intended to minimize potentially adverse interaction with other communicationsequipment aboard.
AntennaDescription
The design and location of the radio beacon antennas was constrained by the physical restrictions
imposed by the other experiments. Protrusions into the bottom plane of the Earth-viewing module(EVM) would degrade the interferometer performance. Protrusions into the top plane of the EVMwould cause interaction with the prime-focus feed. Thus, the only locations left were the sides ofthe EVM that were covered with sensors and thermal louvers.
Various types of antennas were investigated. Included were a variety of V-beam antennas, yagis,
simple dipoles, and rhombic antennas. After the investigation, it became obvious that the V-beam
antenna had distinct advantages because of its simplicity and its broadband characteristics.
The biggest difficulty, at the two higher frequencies, was avoiding significant illumination of the
parabolic reflector. The reflections caused cancellations or enhancement to appear in the resulting
pattern making it difficult to obtain the desired uniform coverage of the Earth. The antenna con-
figurations finally selected are those shown in Figure 2-1 and detailed in Figure 2-7.
The antenna selected for 40 MHz consisted of two k/4 elements located on the east and west faces
of the EVM. These were fed in phase by a 180-degree hybrid transformer. The result was a broad-
side array pattern with four lobes, one of which was directed toward the Earth. The pattern, ob-
tained by range tests on a one-tenth scale model (Figure 2-8), showed nearly uniform Earth illumi-nation (less than ! dB variation) with an average gain of 3.2 dBi (gain, relative to an isotropic an-
tenna). The model was considered more reliable than full scale range tests that were plagued by the
presence of ground reflections and the resulting disturbances to the pattern and gain measurements.
The antenna designs selected for 140 and 360 MHz were basically similar to each other. The
140-MHz array was located on the east side of the EVM and the 360-MHz array on the west face.
These consisted of two terminated V beams placed as an end-fire array. The gains obtained were 3.7and 4.1 dBi respectively. The polar diagrams obtained in tests of these antennas are shown in
Figures 2-9 through 2-12.
1982008279-043

RADIO BEACON EXPERIMENT 23 I,
1
i,
CABLE ANTENNA ELEMENT DESIGN " _THERMAL BLANKET
DISH ,_-Z
��¼�h�EART.1,i:'_
FEEDTHRU(_TAINLESS STEEL)
ELEMENT(INCONNEL)
ELEMENT JINCONNEL x 750
FIBERGLASSSLEEVE
4 1 RESISTORASSEMBLY 1:1
WIRE-WOUNDRESISTOR X
Figure 2.7. Antenna Arrangement
1982008279-044
i
_,, r,
24 ATS-6 FINAL ENGINEERING PERFORMAN£E REPORT :
EARTH1
360c 10°340° 10° 0° 360° 20 °
• 330° 30° ,-330° .
3200 400 ,40 320°
'+
310° 500 ?310° +
k +300° _ _ 60°
29oo / J _ 70°/ 290°70c
=o+ / _ .o280 °
t ) '270° 36 30 25 20 t5 5 90°
90° 270°
\ .30 /260° 100°
1ooo \ / 2.+
110° _ 250°
24(3 _ J 120°120° "% f 240°
130° 230*'
I0 140o220 °
140° 5
210° 210°
160° 2000 100° -- E-PLANE (EW)180o 190° 180° 170° 200° --- -H#LANE (MS)
170° I 190°
Figure 2-8. Radiation Patterns of 40-MHz Antenna on One-Tenth Scale Spacecraft
.'L
1982008279-045

RADIO BEACON EXPERIMENT 25
EARTH
3604 I i0o", 340° 10° 360° 20°
330° 30°330°
320o 40°320°
310° '_ 50°
I \ 3°°°/ .
290° / 70°70 2++10°
) /
2SO° / _" _ I10°'_ 2BOo
IW° I
270° I 36 30 25 15 10 5 90om
90° | 2700 +.
260° l % I 100° +
\2150° _-- ,% ._" 110°110° _-- _ - 26 250°
- 20 120°
120° 240°
• 16 13(.,•
130o 230° •
- 10 140o
140° 6 160° 2200 •2100 210°
160° 200• 60° -- FULL SCALEll0Q 1110° 180o 170° 200° ---- - TE_4THSCALE
170° I 190°
Figure 2-9. E.Plane (E-W) Patternsof 140-MHz Antenna
1982008279-046

................ T
26 ATS-6 FINAL ENGINEERING PERFORMANCE REPORT .,
1EARTH _'
_o' I ioo 1!'. 340o 10° 0° 360° 20°
330° 30o330°
329o _' 40o
f310° /" 60°
/ 310°
300° / e0°300°
I
..o ( I 70o7oc {I I 2*°°
,, ) .oo !\ /
"_ 35 30 25 16 10 6 90o270°270°
go° ,%) 100°
;"SO° _. / ;mO°100° /
_...- 110°
110° 26 260°
120°'20 ;140o
120°
-16 130°230°
130°
140°220°
140° 6
210° 210°
160° 2000 I10° _ FULL Ik?.ALE1000 190° 1800 170° 290° --- - TENTH liCALE
170° I lEO°
Figure 2-10. H-Plana (N-S) Patterns of 140-MHz Antenna
1982008279-047

RADIO BEACON EXPERIMENT 27
EARTH
' 360 c I0 °
340 ° 10° 0° _tO°
330° :30°330°
3200 / 4,0o
40 t "_ 320_
310o _ o0o310°
3000 o0o300+'
70°290 ° 2110°
jr +,
_SO_ 80o/,i 210°
1:30 16 10 6 O0o•2.._.?0° 270°
IC°
200° _ 100°Io0° ")
/ + 110°
110° 20 260°
120o- 20 2400
120°-16 130+"
230°130°
140°220°
140° 6
210° 210°lEO+" 60° ------- FULL SCALE
200°11100 11100" 1100" 170° 5PO0° --- - TENTH SCALE
170o I 11100
Figure 2-11. E.Plene (E-W) Pattern of 360-MHz Antenna
++,
1982008279-048

• • . • ++.............
28 ATS-6 FINAL ENGINEERING PERFORMANCE REPORT
EARTH !
'+ _,40 o 10 ° 0 ° 360 '+ 20 °
330 ° 30 °
220 ° F "* _ 400
+' +k,_k 320 °
310° / / 310 °
mo" I _l e°°t i\ ,,oo.
_ 80o
80o
35 6 gOo270 ° 270 °
-- C-35 100 °
2tl0 o _ 2110°100 ° • "_ J i
110° t
215 2150° !110°
I120 °
•20 2410°
120 °-16 1300
230 °
130° 10 140 °
220 °
1400 6
210 ° 210 °-- FULL SCALE
160° 290 ° 170 ° 200 ° --- - TENTH SCALE1110• 1110° 180 ° 11100
1700 I
Figure 2-12. H.Plane (N-S) Patterns of 360-MHz Antenna
1982008279-049

!RADIOBEACONEXPERIMENT 29
,L
MEASUREMENT CONSIDERATIONS
HistoricalBackground
In the design of the Radio Beacon Experiment is found a logical extension of measurement tech- '
niques that were developed during the evolution of knowledge of the upper atmosphere. The his-torical account of this development is a fascina.dng example of the way in which the efforts ofmany individuals in diverse fields coalesced to form the present body of knowledge that even todayis by no means complete.
Balfour Stewart (Reference 1) in i882, in connection with the dynamic theory of the variationof the Earth's magnetic field, postulated the existence of an "electrified" layer in the upper atmos-phere as being the seat of electric currents causing magnetic compass variations. Kennelly (Refer-ence 2) and Heaviside (Reference 3) in 1902 independently suggested that the strength of Marconi'sDecember 1901, transatlantic signals indicated that these must have been reflected from such a •
region above the Earth because their amplitude was far greater than could be explained on a dif- __fraction basis. During the period 1912 to 1914, DeForest (Reference 4) and Fuller (Reference 5)of the Federal Telegraph Co. made the first rough height estimates on the 3900-kilometer (kin)San Francisco, California-Honolulu, Hawaii, path in the 3,000 to 12,000 meter wavelength range.The technique used by them depended upon wave interference of the received ground and postula-te0 reflected waves. The height of the reflecting layer was deduced by varying the transmitted fre-quency and noting the variation in the received signal strength.
During the period 1920 to 1923, the amateur radio fraternity discovered the skip phenomenon. Aspate of intense interest and activity arose and many of the more serious amateurs kept recordsthat proved to be invaluable to the scientific community. Notably, Hulbert and Taylor (Reference 6)undertook the ta_k of delineating the worldwide properties of the reflecting layer in the 16 to 40meter range, its diurnal and seasonal changes, and its latitude dependencies. They included estimatesof electronic density versus height based upon wavelength and transmission distances achieved. Butup to the early 1920's, no way of experimentally verifying the existence of an ionized upper atmos-
ph_,_ had been conceived. Breit and Tuve (Reference 7) of the Carnegie Institute changed all thatwhen in December 1924, they first demonstrated vertical incident reflections at a 70-meter wave-length using pulse techniques.
Meanwhile, Appleton and Barnett (Reference 8) of the United Kingdom seemed to have reinventedDeForest's method of frequency change and conducted experiments at a 400-meter wavelength thatalso included measurements of the angle of arrival. So, by 1925, three measurement procedures hadbeen independently developed-skip-distance, frequency-variation, and pulse-sounding. The work inthe United Kingdom at 400 meters indicated a reflecting height of 90 to 120 km while that atCarnegie at 70 meters indicated a height of 200 to 240 kin. This seeming conflict led to the notionproposed by Appleton in 1926 that these were two distinct layers which he suggested be called theE-layer and F-layer, respectively• Later, the term "ionosphere" was fir_' employed by Watson-Watt(Reference 9) in 1929 and, perhaps, independently by Piendle (Reference 9)of Germany in 1931.These embryonic beginnings in understanding the nature of the ionosphere were aided immensely
by laboratory research on the electrical properties of ionized gases at subatmospheric pressures andwork done on the role of the physics of neutral gases in the upper atmosphere.
1982008279-050
l
30 ATS-6FINALENGINEERINGPERFORMANCEREPORT t
lChapman (Reference 10) in 1931 presented a mathematical formulation of the layer structure in 'f.
which he included the effect of the Earth's magnetic field. Lassen (Reference 11) in Germany also 1undertook similar work and, although he did not take into account the magnetic field effects, the
formulation developed by him was identical to Chapman's at vertical incidence.
Following the pioneering work of Breit and Tuve (loc. cit.), swept-frequency pulse sounders weredeveloped. The measurements perfomaed by these not only led to a better understanding of thephysics of the ionosphere, but also provided a firm basis for high-frequency communications circuit
design and worldwide forecasting services, l i1
Prior to 1935, significant ionization above the 400-km height was not even suspect. Eckersley's !_
work (Reference 12) on whistlers in the l-kHz to 10-kHz frequency range, first reported out in I_1925, under the pun-like title "A Note on Musical Atmospheric Disturbances," led to his important
(Reference 13) in 1935 on the mechanism of whistler production, in it he advanced the tpaper
theory that whistlers resulted from radiation from lightning discharges in the atmosphere traveling!
long distances (a few Earth radii) along the lines of flux of the Earth's magnetic field. It was very
much later that Smith et al. tReference 14) in 1960 showed that whistler propagation is only pos- Isible guided by tuoes of magnetic flux that included enhanced ionization. Experiments by Storey i
!
(Reference 15) in 1953 ess, ' .,y resulted in the discovery of the plasmasphere. _,|
Tile existence of a magnetosphere was unsuspected prior to 1960. Up to that time, the region stir- _t
rounding the Earth had been considered to be a static region occasionally disturbed by corpuscular j-matter ejected from the Sun. The Sn',ith et. ai. (Ioc. cit.) 1060 study of whistlers made a major con-
tribution to the understanding of the magnetosphere and led to the "knee whistler" discovery ofthe plasmapausc by Carpenter IRefercnce 16) in 1963. The Lunik !i 1960, Mariner il 1962, and
EXl:lorer Xll 19tG _.hser_a,ions of the plasma in this region resulted in discarding the static concept
entirely as it became e,'ident dlat the region was bathed in the solar corona in continuous expansion.
•nefore space vehicles became :wailable. the three regions of major uncertainty that existed in the
knowledge of electronic concentrations deduced from ground-based ionospheric sounders were:
• The opside of the F-layer.
• in the I10- to 200-kin region, between the upper E- and lower F-layer, it was unknown
whether a substantial valley existed in the ionization profile, particularly at night.
• The D-region below 90 kin.
After 1950. four new techniques evolved that circumvented some of these limitations of the sound-ers. They were'
• Wave-interaction Icross-modulation) experiments
• Partial-reflection sounding
1982008279-051

J Is '
%
t
RADIOBEACONEXPERIMENT 31J
• Incoherent scatter techniques
• Moon-reflection experiments.
The wave-interaction experiments and partial-reflection sounding probed the region between the60-km upper limit capability of meteorological sounding rockets and 90 km. The wave-interactiontechnique was born of the accidental discovery of the "Luxemburg Effect" in 1933. Partial-reflectionsounding uses frequencies near the electron gyrofrequency and either measures the differentialabsorption of the ordinary and extraordinary wave components or the phase difference between
these reflected signals arising from the differing group velocity of the two propagation ,,modes. I_
The incoherent zcatter techniques, still very much in use today, stemmed from tile discovery ofionospheric turbulence in the early 1950's. The method employed provides data on electron den-sities and electron and ion temperatures throughout the E- and F4ayers and into the magnetosphere.
It is also possible thereby to obtain information on ion composition, neutral temperature, neutralabundances, neutral winds and waves, and electric fields. 1 he discovery of ionospheric turbulence
also was the basis for a whole new breed of communication systems. ['t
It
Moon-reflection experiments above I00 MHz commenced in 1946 and Murray and Hargreaves
(Reference 171 in 1954 at Jodrell Bank, England, discovered a slow fading component produced byf
the rotation of the plane of polarization in the ionosphere. Means were developed later of resolving {the ambiguity in the total number of rotations by observing the. difference in rotation on a pair of 1•closely spaced frequencies. Other methods available included the simultaneous measurements at a
frequency sufficiently high for the rotation to be less than lr/2 and measurement of the peak dec- itron density of the F-layer with an ioposonde. The Moon-reflection experiments provided the Iearliest reliable information on the upper portion of the F-layer prior to the advent of satellites, i
1
The measurements for the first time showed that the F-layer electron density profile differed from i
that of an isothermal Chapman layer. Later on, F a layer topside ionograms were obtained by the iAlouette and ISIS satellites using pulse techniques, j
The Moon-echo method of studying the ionosphere has been largely supplanted by the use of orbit-mg .satellite beacons usually employing a telemetry transmitter. Up until the launch of ATS-b, the
effort had been concentrated mainly on studying the total electron content and small scale irre-gularities sin, _ these properties have an important practical impact on the propagation time andamplitude/phase scintillation characteristics of satellite radio signals traversing the ionosphere. These
low-orbiting beacons, using linearly polarized antennas, provided information on the horizontal jionospheric electron distribution derived l'rom Faraday rotation measurements. The resulting data
was not altogether satisfacto_ because of the rapidly changing ray path/geomagnetic field leon, "try,horizontal density gradients, the ground-based tracking requirement, and the difficulty in resolvingambiguities in the number of rotations.
The advantage of a synchronous satellite beacon, such as on ATS-6, was that the relatively fixed raypath/geomagnetic field geometry enabled measurements to be performed with fine-time reso',utionsat fixed geo_aphicai and geomagnetic cont_urations. The early, single-frequeno' beacons sufferedthe usual difficulty in determming the number of rotations and the rotation in the absence of an
i
1982008279-052

32 ATS-6FINALENGINEERINGPERFORMANCEREFORT ;
ionosphere. The ATS-6 radio beacon was specifically designed to resol', • this problem and, further-
more, to enable measurement of the plasmaspheric content and its spac=al and temporal structure.
particularly under disturbed conditions.
OverallConsiderations
The Radio Beacon Experiment was designed to enable measurement of the total, NT, and tile Fara-
day (ionospheric), NF .... ',,,,nnar electron contents along the ray path between the satellite andground, and their temporal variations and spaciai distribution. Special measo,ement techniques were
employed to mitigate the historical problem of resolving cycle ambiguities in measured Faraday
rotation and modulation/carrier phase. Estimation of plasmaspheric content, Np, which is the differ-ence between the total and Faraday contents, posed special problems under certain circumstances
and required access to other auxiliary interpretive information that included data from polar orbit-ing navigation satellites and F2 layer topside and bottomside ionograms and geometric field model-ing. The experiment was also designed to enable measurement of ground-received carrier amplitudevariations, particularly at 40 MHz.
It will be shown in the following paragraphs that measurement of the Faraday rotation of polariza-tion of the down-coming wave provided an estimate of the electron content of the ionosphere outto a height to which the influence of the Earth's magnetic field became negligible. Similarly, meas-urement of the received modulation phase and carrier phase determined the total columnar content
to a high order of accuracy.
Faraday Rotation
The Faraday rotation, _r' of the plane of polarization of the down-coming wave is given by theexpression:
s4.84 X I0 "s r
_"_f - |a " J fLN ds, in half revolutions (2-I )0 ._
where.
f is the beacon frequency in Hz.
fL is the electron gyrot'requen_.3tcorresponding to the _.ompc,nent Bt of the geomagnetic fieldin teslas along the ray path and is equal to 2.80 X 10_° Bt Hz.
N is the electron content contained in a square meter cross section along the ray path.
S is the spacecraft-to-ground path.
The integration is taken over the path between the ground and the satellite. Equation 2-1 is validfor the very high frequencies employed by the beacon but ignores refraction. Refraction causes theactual path length to be 1.7 percent longer at 40 MHz than that at 360 MHz.
1982008279-053

RADIOBEACONEXPERIMEI_ 33
B,, and hence fL' is height dependent, so in practice fL is replaced by an average value that is takenoutside the integral and N is thus determined from measuring fit" This approach is possible becausefL becomes nearly zero at very high altitudes. N is then a measure of N r , the Faraday content, outto a slant range, St, wh_:h at midlatitudes corresponds to a height, hf, of about 2000 kin.
Measurement of fl r at 140 MHz yields the estimated content with moG_.st _ccurac',; cycle ambig-uity can be resolved by keeping track of the number of half revolutions. Keeping track becomesimpossible, though, if the beacon is shut down for any appreciable time. Much greater accuracy can
be obtained by measuring f_r at 40 MHz, but the res_)lution of cycle ambiguity using the abovemethod is usually impractical because of the large number of half rotations. Resolution can beachieved in this instance by measuring the differential Faraday rotation, AII, between closelyspaced frequencies f and f + &f and unambiguously determine the rotation from
f
_2t = &f_ 2Af (2-2)
ATS-6 used the 40-MHz carrier and the 1-MHz upper sideband at 41 MHz for this purpose.
Measure_lents at 140 MHz are useful at midlatitudes but can lead to large measurement errors atlow latitudes wl'_erethe ray path becomes nearly perpendicular to the geomagnetic field. In thissituation the resulting Faraday rotation lowers to a few tens of degrees az 140 MHz and betteraccuracy can be obtained by direct measurement of the rotation at 40 MHz.
Other problems can arise that reduce the accuracy of measurements at low latitudes. The diurnalexcursion in latitude of the satellite due to its orbital inclination has an important effect both on
orientation of the electric field as a function of the satellite aspect angle, and on the orientation ofthe electric field with respect to the geomagnetic field. Furthermore, quite apart from measurementaccuracy considerations, the measured electron content tends to be lowe_"than the actual contentowing to the tight coupling between the ordinary and extraordinary waves. This is importantbecause it leads to a gross overestimate (as much as 50 percent) of the plasmaspheric content as
calculated from the expression Np = NT - Nv where NT is known accurately from phase measure-ments.
Accurate calibration is important, both of the beacon and the ground-based equipment. The initial
orientation of the plane of polarization is not necessarily determined by the physical orientation ofthe linear transmitting antenna elements because of possible radiation from the antenna feed linesand reradiation from other satellite structures. With ATS-6, polarization measurements were con-ducted on the ground prior to launch and the orientation was expected to remain stable, in oneinstance, the polarization orientation at 140 MHz was confirmed by making lunar radar measure-ments when ATS-6 and the Moon were nearly aligned.
Accuracy of the ground-based polarimeters was the onus of the various experimenters. S_nce Fara-day rotation is the consequence of the phase difference of the left-hand circularly polarized ordi-nary wave and the right-hand circularly polarized extraordinary wave, the usual technique is to
employ cross dipoles to separate the two components by introducing a 90-degree phase advance or
iL
1982008279-054

34 ATS_ FINALENGINEERINGPERFORMANCEREPORT =
90-degree retardation. Measurement errors arise from incomplete separation of th: two componentsdue to imbalances in the antenna elements and their feed system, and due to ground reflect;_ns,
especially at low _tellite elevations.
Group DelayandCarrierPhase
One way of determining the total electron content, NT, is by measuring the differential group delay(modulation or phase dispersion) of two closely-spaced frequencies separated by a frequency dif- _:
ference Af. By taking the measurements at No sets of frequencies spaced by the same difference&f hertz (Hz), the effect of Doppler shift due to the line-of-sight motion of the satellite is removed.
if ft and fi are the arithmetic averages in Hz of the two frequency sets, the phase difference, A_ a ,between the two ordinary waves can be shown t, be
7
=,[,_= _ = • NTdS, in cycles (2-3)2c (f, (f, +
where k = 80.61, a constant
c = 2.998 X 101 meters per second (m/s), the propagation velocity in vacuum
]'L = an average value of the loagitudinal electron gyro frequency in Hz
from which the total electron content NT = Nds m"l can be determined•
The appearance of f, in the equation is a consequence of the phase refractive index of the iono-sphere and is on the order of ! MHz. The minimum frequency f, employed by the beacon was 40MHz, so the error introduced by this term is small. Ionospheric refraction increa_s the actual pathlength at 40 MHz, necessitating a correction tactor of 3.4 percent.
Modulation frequencies Af of ! MHz at 140 MHz and 360 MHz, and 100 kHz at 40 MHz are suf-ficiently low to resolve cycle ambiguity whereas a I-MHz modulation frequency at 40 MHz can pro-vide high sensitivity useful for determining the magnitude of small changes.
An alternate scheme that provides a higher order sensitivity is to reduce two widely spaced carrier
frequencies to a reference frequency, fR, and compare the phase difference. Letting AOc be the
phase difference at f_, then
.1-{ ]_ ,. f_ - = _ NT , in cyck'_ (2-4)
f, J 2C fl {fl + _L) ft (f, + PL)
1982008279-055

f_
RADIOBEACONEXPERIMENT 35I
,3
In comparing equations (2-3) and (2-4), an approximate expression for A¢c is obtained !
fR ,_A_c = -- (2-5)
Af
I
thus, it can be seen that relatively large fR permits a larger s"_sitivity than the modulation phase i-method. The cycle ambiguity resolution problem, however, increases with increasing fR" ATS-6 ,.
used an fR of 10 MHz, so that the sensitivity was increased tenfold in this instance. _'
One goal of the experiment was the measurement of the difference of the total and Faraday con- '!
tents. The latter, during daylight hours, accounted for around n0 percent of the total. Hence, if a I"10 percent accuracy in the difference is desired, the absolute measurements should be to the order !of one percent accuracy. This imposes a minimum overall measurement accuracy in group delay of
-+50nanoseconds (ns), which is -+0.5 cycle or -+ld degrees at 1 MHz, and a similar requirement on
the relative phase stability of the two modulating frequencies at 40 MHz to resolve cycle identifica- 1
tion. The beacon transmitter performance met these goals (Table 2-2). F
The modulation phase delays of the beacon were carefully measured prior to launch and were iverified in flight from time to time by comparing the total content data from the different channels. i.A generator was constructed and used to provide a standard modulation phase for use in standard- !
izing the beacon transmitter test equipment and in calibrating the ground equipment of the various i_
experimenters. !t
EXPERIMENT SUMMARIES !
In the following paragraphs, several of the many experiments conducted by numerous investigators
have been summarized to illustrate the utility of the ATS-6 Radio Beacon. The particular experi-ments selected cover studies of electron content, the effects of storms, large and small irregularities,
and scintillation. In many instances, auxiliary data have bee, introduced to enable interpretation of
results. These auxiliary oata were derived from ground-based ionograms, top-side sounding by
medium-altitude orbiting satellites, incoherent scatter techniques, horizontal content from polarorbiting satellites, geomagnetic indices, and geomagnetic field modeling.
Maps showing the location of the beacon receiving sites in the United States and worldwide forATS-6 related observations are shown in Figure 2-13 and Figure 2-14.
ElectronContentStudies
The National Oceanic and Atmospheric Administration Environmental Research Laboratories,Max-Planck Institute, and Universitaet Graz conducted beacon measurements from a station near
1982008279-056

36 ATS-6 FINAL ENGINEERINGPERFORMANCEREPORT
e_- :
•._ _.- .__.'._._ e.__ -'_ _i _
" ,_i" ' .! _
7
_Ni' .;
t_tl
% % o,_ -<, % % %_ ,i
,2
1982008279-057

RADIOBEACONEXPERIMENT 37
1_ 100° ee° eo" 6o°
80`=_ _"
, __ --.... _ .o,,..., .
FT. MONMOUTH
FT. MORGAN ANVILLE =/'BOULOERI • URBANAe ID _ .
• ELBERT eOAKLAND T 30_
.,_ . LASVEGA$ / ,
,,? -- ,_ \t2o° 11o_ _oo" Ira* no° 7o°
Figure 2-14. Location of Receiving Equipment for theATS-6 Related Observations
;!
Bouid_:r,Colorado(40. IJ°N latitude, 105.24°W longitude)duringthe p_'riodJuly 1974 to May 20,197.';,when ATS-6waspositionedabove04°W longitude Similarmeasurementswart"madelateral'tcrATS-6 wasmoved to 35°E longitudefrom Abcrystwyth, Wales;from the Europeancontinent;fromIndia; and from a few other locationsthroughout the world. At Boulder, atlxiliary interpretivedatawere obtained from iono_'amstaken at White Sands,New Mexico: from Aloucttc satclfitctopsidesoundings;from horizontal content measurementsfrom the Navy's polar orbiting sat_'lliteNNSS;
and from geomagneticfield models.Measurementsof total content, NT , werederivedfrom measure-mentsof group delay (modulation phase),A_)=R40,of the ordinary wave of the l-Miiz modulationon the 140-MHz carrier relative to that on the 360-MHz carrier, and from carrier phasemeasun.,.
meritsat 360 MHz and 40 MHz reducedto a IO-MHz rel'crence,A$_o. Estimatcsof Faradaycont_:nt,N_., were derived from the measurementof Faraday rotation at 140 MHz, Q=4o' Various methodspreviouslydescribedwere usedto resolveambiguity in modulation phaseand F.',radayrotation, itwas shown that th_ combination of group delay and Faraday measurementsof the ATS-6 RadioBeacon providedthe most reliable estimateof the _olumnarcontent of the plasmasphcre.The dataobtained enabledestablishingmodels of the electron density-h_:isht prot'ile, which althoughnotperfect, wereusedby severalother investigatorsin later work.
1982008279-058

38 ATS-6FINALENGINEERINGPERFORMANCEREPORT
Before going into .some of the results of the study, several parameters, in addition to those already
d_scribed, require definition. Recall that the plasmaspheric content, Np, can be estimated from the
difference between the accurately determined total content, NT, from modulation phase measure-ments and the estimated Faraday content, NF, derived from Faraday rotation measurements.
Equation (2-1) for _.f is repeated:
4.84 X 10"s/.sf_t
f¢ JO fL Nds, in half revolutions
where fL varies with the distance along the ray path due to the increasing angle, 0, between the raypath and the geomagnetic field direction and the inverse cube variation of the value, Bo, of thatfield with height. To deduce the Faraday content,
4
l
Ni= = fL Nds,
from a measurement of _2f, a value, F, must be assumed that represents the average fL over the slant
range, St, from the receiver to some profile height, h t, generally assumed to be 2000 kin, beyond
which the contribution of fL becomes negligible. The term fL is brought outside the integral of i !equation (2-1) and so I_ is defined by the expression
t,
SF
r • Nr =[ fL Nds (2-6)"0
The term 1_ is on the order of 1 MHz for ground stations at midlatitude viewing an equatorial bea-
con at geosynchronous altitude. It is useful to speak in terms of the height, heft, at which fL = l_" J
This height is somewhat greater than the height hm F2 at which the profile density peak b'm occurs. !Although h tt on the Boulder to ATS-6 (94°W longitude) path exhibits a diurnal variation between :_:-300 km and 400 kin, an average value of 380 km was adopted for these studies. This value lies ibetween the value of 420 km recommended earlier by Titheridge (Reference 18) derived from a ! '
generalized worldwide model based upon a wide variety of theoretical density profiles and ray !geometries, and 350 km used by Poletti-Liuzzi et al. (Reference 19) for the specific Danville, illlinois-to-ATS-6 (94°W longitude) path. , .
The error is reasonably small in the estimate of N 1. from the measurement of I2t assuming a fixed i •value of F. A change of 100 km in hert produces a variation in !r of about 3.5 percent for theBoulder-to-ATS-6 (94°W longitude) path. (Note, however, by contrast, that there is little variation
in F at ionospheric heights over the Aberystwyth-to-ATS-6 [35 °] path.)
A value of 1_ = 1.15 MHz was used at Boulder corresponding to hen = 380 km to determine theionost, heric content, N v, out to a height h t = 2000 km from measurements of f_t" This combina- ,'
tion of the values of I_ and ht was adopted from the minimum dispersion point of the crossoversof J'
1982008279-059

RADIOBEACONEXPERIMENT 39 :
the plots shown in Figure 2-15 for Boulder. These are plots of the ratio:
. s(h)
fL Nds/J. Nsecidh (2-7) •- U
where i is the angle between the ray path and zenith direction, and are representative of the low
sunspot numbers typical of the measurement period and reflect the diurnal and seasonal variations
in the density profile.
A similar factor, F, is defined over the entire path from the receiver to the satellite, thusly:
Sf L Ntis0
F = (2-8)Nr
Since fL becomes negligible at very high altitudes, mainly because of its dependence on Bo whosevalue varies as the inver_ cuhe of height, then for all practical purposes _:
S S F
f fL Nds-_f fL Nds = I_NF.0 0
So from equations (2-6) and (2-8_ the relationship
FNx = I_Nr (2-9)
is established. Thus, the slant plasmaspheric content, Na , between the satellite beacon and the inter-section of the ray path with the profile at 2000-km height, can be determined from ._
F :Np = Nr - (2-10) ,,
From equation (2-9), F = ir (N v/N r). The ratio, (N v/N r), can be obtained by simultaneous meas-_ urement at the ground-based beacon receiver of phase and Faraday rotation• The modulation
• phase gives an accurate measurement of Nr , so using some assumed value of i_, the plasmaspheric
content, Np, is calculated from equation (2-10).
Other shape factors useful in modeling are _'heslant total slab thickness, rTS, and the slant Faraday
slab thickness, rvs, given respectively by
rTS = NT/N m and (2-11)
' NTFS = NF/ m (2-12)
N is the F2 layer peak electron density determined from ground-based ionosound measurements.
1982008279-060

40 ATS_ FINALENGINEERINGPERFORMANCEREPORT
iiI Iq
I!i I ' ' ''I i i i- ....,ill BOULDER, COLORADO
SN I11 ATS-6
2.0 _ EN,-,-'_ | _ Oily _It; SO- summeO,v
, _ WN ED - Equinox -WD - WJmor
-- so .... N_t -_ SIN - Summer Night
j - ED _ EN - Equinox _\ WN -- Winter
wo \\ o,..,.,,. (1,7e) _1.s \ -\o % ,
- ",, - •'_'N.II o
0 _
ILL1.0--
I I l 1 1 II[ I I I2oo 600 1ooo iooo
Altitude (kin)
Figure 2-15. Determination of F- from Plots of Reference 20; Boulder
Turning now to the experiments at Boulder, the radio beacon receiver was set up for measuring themodulation phase, A_41 , at 140 MHz and 360 MI-lz using the carriers and I-MHz modulationupper sidebands, and the Faraday rotation, [2t4o, at 140 MHz. The 140-MHz frequency was usedrather than the 40-MHz to eliminate the need for refraction correction, to more easily keep track oftotal number cycles, and because there is less signal strength variation due to ionospheric absorption
and scintillation. Using the expression for 12t from equation (2-1) and the expression for AOR from
equation (2-3) and inserting them into equation (2-8), the factor F in terms of me* Jred fZ,4 o andAOR14_ turns out to be
F = I:r(NF/NT) = Rr (fl,4o/A¢la41) (2-13)
The constant Rr has a value that is frequency dependent as the subscript implies, but is relativelyinsensitive to F. This is be:ause Rt varies directly as F_, and fir inversely as ]_. Examination ofequation (2-3) shows that as the frequency of observation increases, the effect of l_ = ]rL becomesprogressively less important to Aea. At 140 MHz and midlatitudes, where i_ "" 1 MHz, Rl4o = 0.83.
Even at equatorial latitudes, where F = 0.1 MHz, R_4o does not change much, being equal to 0.84.
The slab thickness data depended upon the deter-nination of Nm, the peak electron density of theF2 layer, based on ground-based ionosonde data. The ionospheric heights of interest intersected by
r-
1982008279-061

RADIOBEACONEXPERIMENT 41
the ray path lay neither directly over either the Boulder or the White Sands ionosonde stations. :
Hourly Nm data from these latter stations indicated frequent horizontal gradients of such magnit'Jdeas to inaccurately infer what the values might be along the ray path. Rather, monthly mean values
of Nm were calculated for both Boulder and the geographical location of the subionospheric pointof intersection of the ray path with the 450-kin height and the ratios were applied to the smoothedBoulder ionosonde data (Reference 20).
The Radio Beacon Experiment data obtained at Boulder and at other locations in the United States,
the United Kingdom, continental Europe, and India showed a number of diurnal and seasonal
features in the variation of the electron content. Among these were the steady small decline of Npand Nr during the summer from a midafternoon peak to a predawn minimum as contrasted to thewinter behavior in which the decline occurred until shortly after sunset and thereafter remained zquite constant. The winter daytime/nighttime ratio was greater in Europe and even more pronoun-ced at low _atitudes (Indian measurements) until dawn.
Np was seen to maximize at night during the winter through the vernal equinox in the United States.This contrasted to European measurements conducted after ATS-6 had been drifted to 35°E which
showed Np maximizing during the day. Np was also higher in Europe than in the United States with .,a marked winter to summer change. These features have been confirmed by several other workers inboth Europe and the United States. Some of these behavioral details had been heretofore unknown
and these, together with observations conducted at a number of diverse geographic locations, led tonew theories concerning the interchange of plasma between the local ionosphere and plasmasphere, :
and the interchange between magnetically conjugate regions.
J
• The secondary maximum in NF, occurring during the latter part of the night, had been previously .:known to exist during the winter months. RBE data for Boulder, Bozeman, MontaLa, and Dallas,
Texas showed the predawn maximum to occur year round. This phenomenon was confirmed byobservations at Lir,dau, Germany (Reference 21). Prior to the ATS-6 RBE studies, the night maxima
in NF was thought to be brought about by a depletion of the Np content. This hypothesis was sub-sequently disproved with the advent of the RBE observations. For example, at Boulder, Bozeman,
and Dallas, a particularly large enhancement of 30 percent in NF occurred during the early hours ofDecember 2, 1974, following an isolated magnt, tic substorm, but little change was observed in Npwhich at the time was 40 percent to 50 percent of the total content. These nighttime maxima arespacially confined as shown in the contour maps of vertical content constructed from the Radio
Beacon Experiment (RBE) and the polar orbiting NNSS satellite observations at Lindau, Germany
and Graz, Austria, that are separated by an ionospheric distance of 542 kin. With receivers set up atTable Mountain, Fort Morgan, and Elbert, Colorado, it was also discovered that there is a general
east-west movement of the nighttime maximum at a speed of about 70 meters per second (m/s).
This and other wavelike phenomena called traveling ionospheric disturbances are discussed laterunder a heading entitled "Large and Medium Scale Irregularities."
Studies were conducted in India at low magnetic latitudes using the RBE when ATS-6 was posi-tioned above 350E longitude that showed the influence of the equational electrojet on the Appletonanomaly. This anomaly is characterized by a pronounced latitudinal dependence of the F2 layer
1982008279-062
42 ATS-6FINALENGINEERINGPERFORMANCEREPORT
penetration frequency at hF that maximizes at +!5 degrees magnetic latitudes. During the after-
noon on a normal electrojet day, the r s and F-factor measurements showed a pronounced electrondensity peak in the F2 layer profile during the afternoon at the latitude of the anomaly maximum,
whereas near the magnetic equator just before dawn, a thick F-layer existed with a very little peak• in evidence.
Storm Effects
One big advantage of satellite radio beacons is that they can be used to measure N T and N F contin-
uously even during storm induced conditions. Abnormal distortion of the ionosphere profile,
enhanced D-region absorption, and moderate amplitude and phase scintillations did not affect the
RBE measurement of NT. These phenomena are often met under disturbed conditions and limitthe utility of conventional ionosonde measurements.
Ionospheric Storms
The temporal response of the ionosphere to geomagnetic stomls has been known for some time.
While storms behave in a highly individualistic manner, they do follow a general pattern at mid-
latitudes. This general pattern shows that following a sudden storm commencement (SSC), there is
a fairly uniform distribution of an enhanced value of Nr over the day sector that persists pastsunset. The onset of the enhancement rotates with the Earth and cuts off between 21 to 24 hours
local time to a depressed value of N F that persists for the next few days. Generally, only enhance-
ment in NF is observed near the equator. The enhancements appear to originate in the polar orauroral regions and propagate toward the equator as turbulence-convective cells giving rise to large
latitudinal gradients in N v. Steep longitudinal gradients exist at midlatitudes at a median value(Dr + 2.5) hours local time where Dst is the storm time since SSC (Reference 22).
The temporal variation in NF content was verified with RBE measurements made during periodsof storm activity, Jul._ 3 to 6, September 14 to 19, and October 10 and 20, 1974. A marked in-
crease in slab thickness was seen immediately following SSC. Analysis of Boulder RBE Nr data,August 15 to November 30, 1974, showed a 27-day solar rotational repetition wherein the night-
time Nr value varied over a range about 2 to 1. The corresponding variation was found to be less
pronounced in N_ owing to the fact that trends in Nr and the F-factor tended to cancel. Correla-
tion relationships were shown to exist between the midnight value of Nr and the values of the
magnetic index Kp occurring a day or two earlier.
Plasmasl',hericStorms
The advent of the ATS-6 Radio Beacon Experiment (and the beacon on the Japanese geosynch-
ronous satellite ETS-II) for the first time enabled measurement of Np and an opportu.-2ty to observeits storm related behavior.
Ob_rvations at several locations showed a marked depletion of Np following enhancements of thegeomagnetic indices Kp, Ap, and Dst. The July through November period revea'e_ _ 2" .day periodic
component in which a small increase in the daily average Ap accompanlL:d a deplztion in the daily
1982008279-063

t_ J _ .--4 ...... _ ............
r
RADIOBEACONEXPERIMENT 43
average of Np followed by many days of recovery. Np sometimes decreased before Ap increased.Over the July 1974 to February 19"/5 period, there was a gradual long term increase in the value of
Np as storms decreased in severity.
Reports by several workers of sudden enhancements in Np occurring at storm onset, were ultim-, ately interpreted as being upper F-region enhancements (in the hm to 3000-kin region) rather than
significant increases in Np. The initial conclusions regarding Np enhancements came about because
the derived values of Nv , and hence Np, from the measured total content were based on an assumedconstant ionospheric shape factor. This assumption proved to be invalid because it did not take into ,_
account the rapid distortions occurring in the ionospheric profile during storm onset.
During the N recovery phase following a storm, tile maximum depression usually occurred on thepthird day following onset. During the following days, the content was seen to increase with super-
imposed diurnal filling and emptying, the daytime filling exceeding the nighttime emptying until
after about a week, the Np magnitudes and their diurnal variations become comparable with themonthly average values. These latter observations were based on RBE data at Aberystwyth.
LargeandMediumScaleIrregularities
Contour maps of equivalent vertical ionospheric (Faraday) content were constructed from simul-taneous RBE observations at Boulder, Bozeman, and Dallas aided by latitudinal gradient data
derived from polar orbiting NNSS satellite observations at Boulder and Las Vegas, New Mexico.Similar maps were also constructed in India from muitistation ATS-6/RBE observations (Reference
23).
Various features such as troughs, ridges, peaks, holes, etc., were evident in these maps. The advan-tage of such a map was that the day-to-day changes more truly reflected changes in solar-terrestrial
conditions than content data fl 3m a single receiving station that were heavily weighted towardisolated local conditions. The accuracy of these contour maps was the greatest near the ATS-6/RBE
receiver ray paths and the overall accuracy was considered to be about ± i0 percent.
Traveling Ionospheric Disturbances
The use of geographicallydispersedground receivers for the simultaneousobservationof Faradayrotation of gcostationary beacon signalswas a highly effective technique for studying travelingionospheric disturbances. A number of workers used the ATS-6 Radio Beacon Experiment for thispurpose. Both nonperiodic (isolated) and periodic disturbances were observed. The more common
of these were wavelike disturbances resulting from the passage of atmospheric gravity waves.
in one experiment, three radio beacon receivers were set up at the apices of an equilateral triangle, _
approximately 125 km on a Ado, located at Table Mountain, Fort Morgan, and Elbert, Colorado.
Two moving nighttime maxima, which were observed during the later part of 1974, showed speedsin the order of 70 meters per second (m/s) traveling in a southwesterly or westerly direction (Refer-ences 24, 25).
1982008279-064

44 ATS-6FINALENGINEERINGPERFORMANCEREPORT
/
Reference 25 discusses velocity distribution plots of 25 isolated irregularities based on data from asimilar triad of ground receivers located in India at Delhi, Kurukshetra, and Pilani. These medium-scale disturbances occurred as often at night as during the day. The speeds rangedover 30 to 500 m/s
with the most frequently observed values being 140 m/s during the day (compared to the U.S. valueof 160 m/s) and 110 m/s during the night. The directions of travel, however, were quite different.
The observations in India also produced data on the size and horizontal shape of the irregularities,irregularity content, and the speed, direction and periodicity of periodic disturbances. Gravity-wave
fluctuations in Faraday content were observed with periods ranging from 10 minutes to 200 minuteswith only rare occurrences with periods of near 15 minutes in agreement with theory.
Sudden Increasesin Total Content
Suddenincreasesin total electron and/or Faraday content (SITEC) are causedby extreme ultra-violet radiation from solar flares. Only the largereventsaredetectedby the radio beacontechniquesince the ionization enhancements are relatively small and are superimposed on the diurnal variation.
Observations at high frequency are subject to excessive absorption that limit the utility of suchmeasurements. The SITEC's, which have been reported using the RBE, have averaged around 5 per-cent of the background content.
SITEC°s are highly individualistic. Theories have been advanced that relate the enhancement mech-anisms and sequence of events to the categories of solar flare ionizing radiations, and an altitude-time-enhancement model, for example, was constructed for the sustained type of SITEC (Refer-ence 26).
Some work was done using the Radio Beacon Experiment to estimate the height at which the
SITEC ionization occurs. The method depended upon calculating an average _t from measuredfractional changes in A# and fir" Then, the height was determined from ft (h) curves to estimatethe height at which the additional ionization occurred. The most sensitive parameters needed to be
used such as _2,=o, 0,,;='_or 0Co . Careful regression analysis was required because of measurementnonlinearities. The results, however, agreed with those obtained through more conventional tech-niques.
SmallScaleIrregularities
Micropul_tions
A long train of smaUamplitude quasi-sinusoidaioscillationsin total content were first noticed atthe Bozeman receiver. They reflected Pc4 type geomagnetic pulsations having a period of 30 seconds
to 50 seconds and occurred for several hours at midday on geomagnetically quiet days. These micro-
pulsations in NT were on the order of 0.01 percent to 0.1 percent of the background and could onlybe detected using the most sensitive carrier phase measurements (0co ).
Quasi-periodic fluctuations were reported from Lindau during times of scintillation. These fluctua-
tions had periods ranging from I to 60 seconds and the maximum occurrence took place in Decem-bet 1975.
1982008279-065

m
RADIOBEACONEXPERIMENT 45
Fresnel Focusing by Small Intense Irregularities
Small intense irregularities in electron content occur in the ionosphere and produc '_a beacon-signal
fading pattern characterized by a central minimum flanked on one or both sides by modulated-amplitude fluctuations that increase in frequency away from the minimum. A usually large event
• of this sort, recorded at Boulder on 40 MHz, 140 MHz and 360 MHz, was studied in detail (Refer-ence 27).
In this study, it was postulated that the irregularity was due to a cylindrical lens of circular crosssection with a Gaussian electron density distribution. The geometry is pictured in Reference 27 andit can be seen that there is overlapping of the interference between rays from various parts of such
an irregularity. There is a critical phase shift, as observed on the ground, above which interference
takes place. This phase shift is proportional to the wave frequency and the square of the cylinderdiameter, and inversely proportional to the distance to the irregularity, in calculating the fadingpattern, the usual precautions m_:st be taken with respect to ray treatment versus diffraction
theory.
Parameters for the lens model were found that closely produced the observed fading pattern. The
approximation was excellent at 360 MHz, fair at 140 MHz, and poor at 40 MHz. The latter was
explained as a failure Jf the transparent phase screen model assumed due to the central core of the
lens being overden_ (plasma frequency calculated to be 43 MHz and therefore opaque [ reflecting] ).(See Reference 27.)
The modeling indicated that the ionospheric lens was certainly of high intensity and elongated
(spherical lens models failed). The actual cross-section could have been in the form of a sheet ratherthan circular. The diameter was on the order ol 100 meters (m) and the velocity was about 50 m/s
based on the assumption of a iO0-km height rather than an F-layer height, as determined with excel-lent agreement at 140 MHz and 360 MHz from the amplitude peak separation in the fading patterns.
The enhancement in the 40-MHz signal near 0015 universal time (UT) suggested focusing by a
marked depression in the electronic content. Such a depression can be modeled by changing the
sign of the phase function in the modeling equation.
Ionospheric irregularities frequently occur in closely spaced trains and the resulting defraction
patterns have been calculated for a few cases. This work stresses the importance of conducting multi-frequency measurements to avoid erroneous conclusions based on single frequency observations asto the nature of the irregularities.
Faraday rotation and modulation phase measurements do not reflect the electron contents for waves
passing through irregularities producing prominent diffraction patterns because of wave interferencebetween the diffra,'ted components.
Scintillation
Random irregularities in th_ relative dielectric permittivity in the ionosphere cause fluctuations ofsignal amplitude, phase, rotation of polarization, and angle of arrival of a radio wave propagating
1982008279-066

! -
46 ATS_5FINALENGINEERINGPERFORMANCEREPORT
through it. These fluctuations are known as scintillations. Historically, scintillation theories havebeen based on various approximations using mainly weak scintillation theory to interpret scintil-lation data. It is a physical fact that the random vadation in the relative dielectric permittivity isinversely proportional to the frequency. So, when observations are made with a multifrequencybeacon, such as the RBE, during periods in which weak signal fluctuations are seen at the highestfrequencies, the lower frequencies will suffer much greater scintillation which may be so severe thatweak scintillation theory does not apply.
Efforts to develop a unified scintillation theory had begun just before the _,_:,leof ATS-6 launch andthe RBE multifrequency data was valuable in the further development of that theory.
In the way of background, consider an elongated ellipsoid bounding the first Fresnel zone with themajor axis coincident with the ray path, and with the loci situated at the beacon transmitter and
the ground receiver. The size of the first Fresnel zone at the height of the irregularity can be shownto be O,s)_ = (cs/f')_ where s is the slant range of the irregularity from the receiver.
Irregularities drifting across the ray path produce temporal fluctuations in the parameters of thereceived signal under most conditions. Fluctuations are obse:ved to be the greatest for driftingirregularities approximately the size of the first Fresnel zone.
One measure of the severity of scintillation is the $4 scintillation index defined as the ratio of thesquare root of the variance of the received power to the mean power. Multifrequency observationsenable the determination of how $4 varies with carrier frequency in the form of f-n where n isdefined for two carrier frequencies by
log ($4 s/$4 b )n =
log (fb / f )
Analysis of the frequency spectrum of the scintillations yields a power law irregularity spectrum ofthe form _-p where K is the spacial frequency and p is the power index. The terms n and p are relatedby the expression n = (p + 2)/4. A value of p lying between 3.5 and 5 is typical of ionosphericscintillations and predicts an n of 1.4 to 1.7. For the weak scintillation case, both p and n are inde-pendent of the carrier frequency.
Other authors had shown the way in which the scintillation amplitude and phase spectra should be
dependent upon a parameter, CA , related to the variance of the refractive index of the medium;
to the power index, p ; to fc' the "corner frequency" defined later; and to the irregularity mean driftvelocity v. These relationships had been formulated as follows:
(-2 forf <f
Amplitude spectraf.
C2 " l-p, for t_ > f,m p
#/qlllllatwt.tm._ ....
1982008279-067

RADIOBEACONEXPERIMENT 47 *
Phase spectra C_ (fx/J,) I-p for all fx where fK is the scintillation frequency, and fc _- v/2R Hz inwhich R is the first Fresnel zone radius at ttte mean height, h, of the irregularities.
The comer frequency, fc, is the point of inflection seen in scintillation spectra. The time that irregu-larities fill the first Fresnel zone is R/_, so that fx > vR are due to irregularities n,Jving through the
• zone and fx < _R are due to thos_ completely contained within the zone. The term fc separates the "
two types. Scintillation frequencies less 'ban fc are due to propagation through a homogeneousmedium of a refractive index other than unity. Those greater than f_ represent scattering. The ratioof mean velocity to height is inferred. The scintillation spectra of the three RBE carriers normalized :'
to scintillation frequency (Reference 28) clearly indicated the f, inflection.
Nine records at Boulder were analyzed in which the scintillation was weak ; i.e., $4 (360) = 0.064and yielded an n (140/40) of 1.5 to 1.7. Data on all three RBE frequencies showed an _: _ 1.6,and hence inferred a p e_ 4.4 suggesting that weak scintillation theory is valid for a low $4 index. ,
On the other hand, data for high scintillation indices showed a marked decrease in n and p, and ann and p dependence upon carrier frequency indicating multiple scattering.
Scintillation studies on the RBE signals were conducted at many locations. In India. daytime scin-tillations appeared to be correlated with the occurrence of sporadic F. and nighttime with spread F.At Delhi, nighttime scintillations were greatest during the summer months and minimum at theequinoxes. These peaked at midnight at Delhi and at 2200 _t O_,lacamund further to the south.The onset of strong scintillations was associated with enhanced polarizatio,'_ rotation indicatinglarge-scale F-region irregularities. Low values of n (0.5 to 0.8), were seen regularly at Delhi, Thumba(equatorial), and Ootacamund. At the later station, scir,tillation amplitude at 360 MHz sometimesex:eeded that at 140 MHz and 40 MHz. Also, in India, nighttime scintillations were seen to com-mence earlier at the low frequencies but last longer at the high frequencies. At Trivandrum, thescintillations at the higher beacon frequencies always occurred more often than spread F (Reference29).
The RBE and other satellite beacons were used to ooserve the effect of storms on scintillations.
During the storm that occurred January 10 to I 1, 1976, _vere scintillations were observed on the ..RBE signals in India at all but the most northerly stations. Workers at Keflavik, iceland, establisheda relationship between scintillation index and magnetic and sunspot indices, but no such definitecorrelation could be established at Lannion, France.
BEACON IN-ORBIT PERFORMANCE
The fact that the radio beacon transmitter performed well and maintained its calibration through- i
out the 5-year life of ATS-6 is much to the credit of those involved in putting it together. Con-tinuous beacon operation was planned, but it turned out that this was not always possible because
of beacon transmitter interference with other spacecraft experiments and because of prime-powerbudget limitations during the equinox periods. The monthly percentage on-time ranged from 63percent to 99 percent for the first year in orbit. The impact on data gathering significantly exceededactual beacon downtime because dl_a was lost in reestablishing ground receiver lock, and often _twas impossible to maintain the cycle count records that were necessary for resolution of measure-ment ambiguities.
1982008279-068
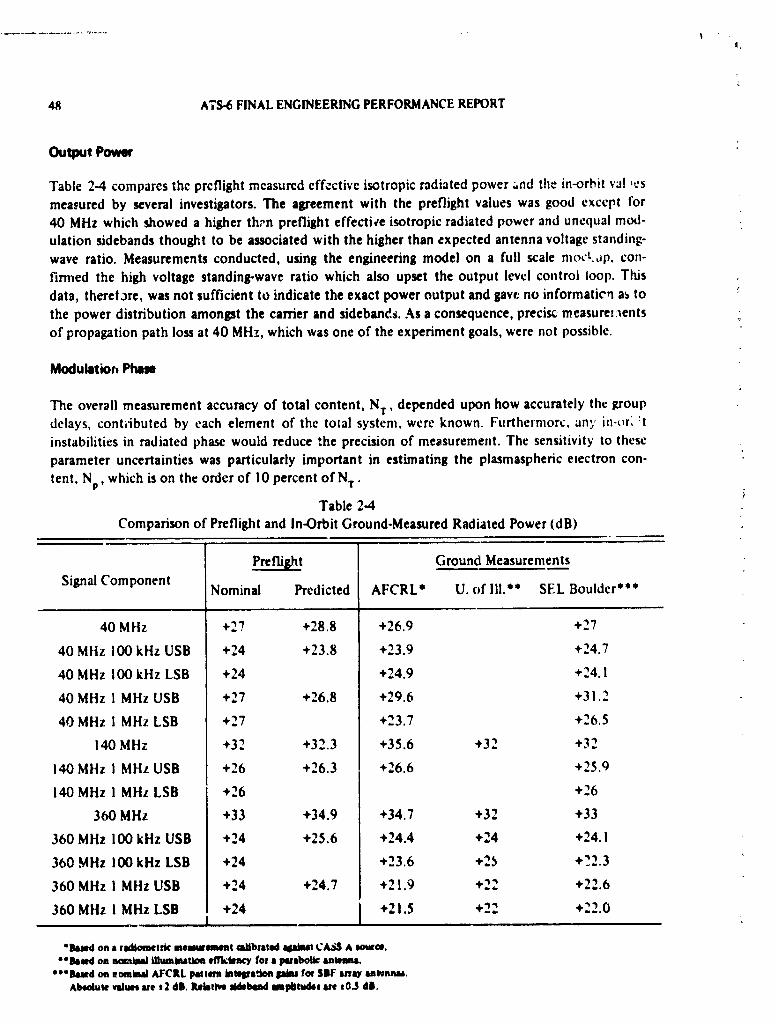
" I
48 ATS-6FINALENGINEERINGPERFORMANCEREPORT
Output Power
Table 2-4 compares thc prcflight mcasurcd effective isotropic radiated power -.ad tile in-orbit val ,esmeasured by several investigators. The agreement with the preflight values was good except for40 MHz which showed a higher th_'n preflight effectiee isotropic radiated power and unequal mod-ulation sidebands thought to be associated with the higher than expected antenna voltage standing-wave ratio. Measurements conducted, using the engineering model on a full scale mock,q_, con-
firmed the high voltage standing-wave ratio which also upset the output level control loop. Thisdata, theret_re, was not sufficient to indicate the exact power output and gavr no informatic_ a_ to
the power distribution amongst the carrier and sideban¢_. As a consequence, precisc measurez._ents ..of propagation path iou at 40 MHz, which was one of the experiment goals, were not possible.
Modulatio_ Phase
The overall measurement accuracy of total content, NT , depended upon how accurately the groupdelays, conhibuted by each element of the total system, were known. Furthermore, any in-_)r;:tinstabilities in radiated phase would reduce the precision of measurement. The sensitivity to theseparameter uncertainties was particularly important in estimating the plasmaspheric etectron con-
tent, Np, which is on the order of 10 percent ofN T .
Table 2-4
Comparison of Preflight and In-Orbit Ground-Measured Radiated Power (dB)
Preflight Ground MeasurementsSignal Component
Nominal Predicted AFCRL* U. of !11.** SEL Boulder***
40 MHz "_'T+,, +28.8 +26.9 +27
40 Mltz 100 kHz USB +24 +23.8 +23.9 +24.7
40 MHz 100 kHz LSB +24 +24.9 +24.1
40 MHz 1 MHz USB +27 +26.8 +29.6 +31.2
40 MHz 1 MHz LSB +27 +23.7 +26.5
140 MHz +32 +32.3 +35.6 +32 +32
140 MHz I MHz USB +26 +26.3 +26.6 +25.9
140 MHz I MHz LSB +26 +26
360 MHz +33 +34.9 +34.7 +32 +33
360 MHz IO0 kHz USB +24 +25.6 +24.4 +24 +24. !
360 MHz I00 kHz LSB +24 +23.6 +2_ +?2.3 +
360 MHz i Mttz USB +24 +24.7 +21.9 +22 +22.6
360 MHz 1 MHz LSB +24 +21.5 +.,.'_" +...0_
"flaredon a rad_anetri¢ meMw_t gaUbtsted aOlmt CAgS A _m.
• "BaaedonnomimdIUumimtioe_ for• pwabollganUmna.eeoJht_dollmoatiludAFCRLp_tmnintqze'.kmIJabuforSIIFtnt_ wwnmu,
Abeoiutevaluesue t2 dll. RebtjveddebendamplJtuclll8ret0.5dJ,
1982008279-069

x v : l!
RADIO BEACON EXPERIMENT 49
2Table 2-5 presents the group delay contributions at 40.1 MHz, 41 MHz, and 141 MHz of the various
elements of the system including the Boulder receiver antennas, and compares these contribationsto the group delay expected for typical electron contents. The table shows that the ratio of the sys- ,_
tel.l group delay contribution to the overall delay encountered at 141 MHz was nearly ten timesthat at 41 MHz.
z
R A¢_1 and A0iR41were made from which values ofIn-orbit simultaneous measurem-nts of A¢4o.1,
Nr were computed. Assuming that equipment channel group delay perturbations were of an equallyprobable magnitude, a value Or of 141 MHz transmitted phase was calculated that would bring the141-MHz N r computation into agreement with that at 41 MHz. The prelaunch value of 0r was-63 degrees. _,
After launch, the calibration was checked by comparing NT calculated from 40. I-MHz and 41-MHz :_data to that from 141 MHz. During the period October 1974 to May 1975, 13 of 16 data points ..
showed 0T to lie between -65 degrees and -69 degrees. The remaining 3 data points unexplainablyR
lay well out of this range at about -74 degrees. One degree in A0tR4, or A04o.1 corresponded to about .,4 X 1014 e/m 2 and in A0_I, one tenth that amount. One goal .)f the experiment was to measure _,
A0_ 1 to within +0.05 cycle of ±18 which translated to an uncertainty of about 4 percent in themeasurement of plasmaspheric content (average 2 × 10¹⁶ e/m 2 ). The phase stability of the beacon '_
transmitters, as reflected in the first-year in-orbit value of 0T , exceeded this goal by a large margin.
Antenna Performance _'_
Gai_ changes as a function of satellite attitude were reasonably small at 40 MHz and 140 MHz andreflected the preflight antenna pattern shapes. At 360 MHz, rather large variations in received signal
strength of the :artier and sidebands were observed with small pointing angle changes due to the
presence of unwanted reflections from the 10-meter satellite reflector. The in-orbit performancereflected the fact that the preflight effort to reduce the 360-MHz beacon antennz backlobe illumi-
nation of the reflector was not altogether successful.
Table 2-5
Differential Group Delay Magnitudes
TypicalTypical Minimum Plasmaspheric Transmitter
Total Content Content Group Delay Receiving2 X 1017 e/m 2 (10% Total) (Inc. Ant.) Antennas
(ns) (ns) (ns) (ns) _
!40 1 MHz 1350 135 175 9
40 100kHz 1650 165 222 46
40 1 MHz 16000 160 203 46
1982008279-070

5
50 ATS-6 FINAL ENGINEERINGPERFORMANCEREPORT
Variationsalso occurred in 361-MHzgroupdelay with pointing angle and thus causeda variation of
A_IR41modulation phase. Figu:e 2-16 shows the change in A_f4] during satellite maneuvers ofAugust 20, 1975. One possible cause for this behavior was inadequate antenna bandwidth. Thesatellite was frequently maneuveredwhile it was stationed at 35°E; asa consequence, it was neces- :'sary to correct the modulation phase for satellite attitudes from calibrations, obtained during quietionospheric conditions, in reducing the Ootacamund data. "
, The polarization of the transmitted signals was measured prior to launch and it would have takenrather large mechanical distortions of the antenna system to alter their polarization characteristics.Consequently, a great deal of confidence existed that the in-orbit polarization characteristics wereunchanged from those during preflight. The polarization rotation at 140 MHz was compared to thatobtained using a lunar radarwhen the satellite and the Moon were nearly aligned and the radiated |:polarization was found to closely agree with the prelaunch c_;ibration. The values of Faradaycontent, Nv, determined from 40-MHz and 140-MHzmeasurements were in good agreement. Cycle i_
ambiguity in this case was resolved by measurement of the differential rotation at 40 MHz and t,41 MHz.
5 .... I ' I _ I ' I i I t I i /_,..j'- i -180 , :
/4 --
,_.....---__-'-J'_ _,...GROUPDELAY -- -90
q
i _ ° _AMPLITUDE _", _ 0
: _,.',,d t
ot ' im='_#- ° I
._ . -90
',_.:.
I , I , I , I , I I I i I I _soIooo 11oo 13oo 14oo 16oo leoo
!
AUGUST 19 TIME _
RFigure2.16. Veriat,onin D#141 with AntennaPointing(ATS-6at 35 Degrees)
1982008279-071

• ............... ........ ,_., . .
RADIOBEACONEXPERIMENT 51
Interferenceto Other Experiments
Interference during beacon operation was evident in tile ATS-6 transponder downlinks for all FTmodes. The interference spurs appeared to be fifth order products resulting from intermodulationof either the 40-Mitz or 140-MHz beacon carriers and tile 136.23-Mtiz telemetry channel that
entered tile transponder amplifiers intermediate frequency (i.f.) in some undiscovered manner. Tile
l-Milz and 100-kHz beacon modulations appeared oil the spurs. Products with the 137.11-MHz
telemetry channel were occasionally evident and occurred at a much lower level than the productswith tile 136.23-MHz channel. _
Based on tile nominal frequency assignments, spurs under the condition of no beacon modulation
would have appeared if they existed at 1,3 × 140.056) - (2 X 136.33) = 147.71 MHz and at 1,2 X
136.23) - (3 X 40.016) = 152.41 MHz (tile corresponding products with the 137.11-MHz channel
would have appeared at 145.95 Ml-lzand 154.17 MHz, respectively). The actual frequencies observed _:
were closer to 148.0 MHz and 152.1 MHz, suggesting that the 136,23-MHz telemetry carrier mayhave been low by about 1be kHz. Fcr the ensuing discussion they will be referred to as the 148.0-
MHz and 152.I-MHz spurs and all other observed frequencies at tile Rosman receiver i.f. output .will be referenced to the 150-Mltz spacecraft internlediate frequency.
On July 16, 1974, spe,:truni analyzer photos were taken at the Rosman receiver i.f. output forvarious spacecraft transponder configurations. Most of tile data dealt with tile C-band downlink. :
The spacecraft configurations included the CxC and CxS-SxC FT modes with and without tile bea-
con operating, and with beacon operating with and without applied modulation.
Figure 2-17 (A) shows the C-band downlink with the spacecraft m the Cx(" mode (with unknownuplink transmit power). File beacon is operating on 40 MHz and 360 MHz without modulation. In
the center is the 3qS0-MID downlink signal translated to 150 Mltz. To the right is the 152.l-Mllz
spur. Figure 2-17 (B) shows the situatton with the beacon operating on all three frequencies andwith the l-Mttz modulation turned on. The 148.0-MH7 spur appears at a low level and I-MHz
upper and lower sidebands can be seen associated with each. Figure 2-17 (I)) shows the ,same spec-
trum with reduced uplink power. Figure 2-17 (C) shows the results of applying tile l-Mttz and ,.IO0-kHz beacon modulations. The display has been moved to the left, expanded, and the resolution
increased to show the 100-kilt and l-Mtlz sidebands on tile 152. I-MHz spur.7
Figure 2-18 shows a ._ries of photos of tile downlink C-band sl_ectrum with tile transponder in tileSxC FT mode and with the ground station at various S-band uplink powers. The" tranponder was
also configured in the CxS mode, but it is not clear whether a C-band uplink signal was applied. Tile
first photo, Figure 2-18 (A), with the S-band uplink power at 50 watts and tile beacon operating jwitil I-Mltz modulation, shows tile spectrum to be closely identical to that for tile CxC configura-
tion, Figures 2-17 I.B) anti 2-17 (D). There is also a suggestion of the 154,2-MHz spur associated _,with tile 137.! I-MHz telemetl y channel. :,
For 50 watts of uplink power, tile effective i_tropic radiated power (e.i.r.p.) was about 64 dBW.
Tracking and Data Relay Experiment tests used the Nimbus satellite with an e.i.r.p, of 20 dBW sothat the impact on the tests of RBF operation was very real.
1982008279-072

52 ATS-6FINALENGINEERINGPERFORMANCEREPORT
DOq¥NLINK CARRIER
(A) RBE ON; NO MODULATION; 100 kHz BW; (C) RBE ON ALL CARRIERS 100 KHx & r_1 MHz/DIV 40 MHz & 360 MH:' ONLY 1 MHz MOOULATION; 30 kHz BW
0.5 MHz/OIV
(B) RBE ON ALL CARRIERS WITH 1 MHz (D) SAME AS (B) BUT WiTH REOUCEO UPLINKMODULATION ONLY 100 kHz BW; MHz/DIV POWER (COMPARE WITH FIGURE 2-18 (A))(COMPARE WITH FIGURE 2-18 (A))
Figure2-17. CxCDownlinkModeSpectraNear3590MHzwith6150-MHzUplinkCarrier-Rosman,July16,1974
1982008279-073

RADIO BEACON EXPERIMENT 53
DOWNLINK CARRIER ,_!
(A) 50W 205OMHzUPLINK. RBEWITH 1 MHz (C) IOOW2250 MHz UPLINK; RBEWITH 1 MHzMODULATION; 100 kHz BW: 1 MHz/DIV & 100kHz MODULATION; 10kHz BW;1 MHz/DiV
1
(B) E_W22150MHt UPLINK; RBEWITH 1 MHz (D) fr_ow2260 MHz UPLiNK; RBEWITH 1 MI,,Iz& 100kHz MODULATION; 10kH-' BW; & 100 kilt MODULATION 10kHz BW;1 MHz/DIV1 MHz/OIV
Figure 2-18. SxC Downlink Mode Spectre Near 3950 kHz-Rosman, July 16, 1974
1982008279-074

54 ATS-6FINALENGINEERINGPERFORMANCEREPORT '_"
Figure 2-19 presents a series of spectrum analyzer displays of the Rosman receiver i.f. output during .tests conducted on December 27, 1974, with the transponder configured in the very high frequency(vhl3 monopulse X C-band mode. Figure 2-19 (A) shows the spectrum with the command trans- ;.
mitter operating at 2.2 kilowatt (kW) at 153 MHz and the RBE shutdown. The next pl',._to is of the
spectrum with tile RBE operating and with no uplink carrier. The vhf monopulse X C-band mode _.
appeared to favor the 148. I-MHz. rather than the 152.I-MHz spurs that predominated in the FTmodes. Sidebands in multiples of the I-MHz beacon modulation frequency are very much in evi-
dence. Figure 2-19 (C) shows the spectrum with the 154.2-MHz command carrier up at full power
and with the RBE operating. Finally, Figure 2-19 (D) shows the condition for a 153-MHz uplinkcarrier at a much reduced power of 130 watts with the RBE on.
The desired carrier was only about 3 dB above the maximum spur levels in this case. Fortunately,tests showed that the operation of the RBE did not significantly affect the ability to command the
spacecraft using an uplink power of 2.2 kW reflecting the fact the carrier-to-spur-level ratio was onthe order of 13 dB.
One of the experiments conducted, during the period when ATS-t_ was stationed at 35°E, was thz
U.S./U.S.S.R. Magnetometer Experiment (Mage). In this experiment, data collection platfomls
located in the U.S.S.R. transmitted data to the spacecraft in the 150-MHz range. The transponder
was configured in the vhf monopulse C-band remodulation (Position Location and Aircraft Com-munication Experiment_ inode. Several tests that were run indicated that the operation of the RBE
reduced the already marginal signal-to-noise ratio by about 6 dB. As a consequence, the RBE was
shut down during most of the Mage tests. _
APPLICATION OF RESULTS
The Radio Beacon l'_xperiment proved to be of great value to both tile scientific and engineering
communities. The measurement results made a direct contribution to the further understanding of
the behavior of tile ionosphere and the physical processes that take place within it. The new dataobtained enabled refinement of transionospheric radio link refraction and time-of-flight correction,
and provided an insight into the high-data rate bandwidth limitations and radio-link fade margins
inlposcd by scintillations. The beacon provided integrated data as opposed to earlier in-situ tech-
niques. This fact made possible a perspective of ionospheric behavior that previously had been
diMcult to achieve. The value of coincident data from polar orbiting satellites, radar, and incoher-
ent scatter measurements cannot be overly stressed. Some of the specific outgrowths of the radiobeacon work follows.
Earlier _tcllite beacons had measured only N_., but it is Nr , the total content, that detennines thepropagation time and group delay of signals traveling through the ionosphere. From the RBE _,
experiments, it was determined, for example at Boulder, that near midday, when Nv is the highest,
the monthly mean of N_, is about !0 percent of N_, (15 percent of Nv in Europe), and at night is
about 50 percent of N= ."lhcre is not nlttch diurnal variation of Np during the summer. Thus, a rule i
of thumb was established to estimate N r as a function of local time (LT) entirely from measure-Inents of NI. by u_' of tilt" equation
Nr _I_T) = (0.1 orO.15)Ni. (max) + Nv (LT)
1982008279-075

RADIO BEACON EXPERIMENT 55
153 MHz 154.2 MHz •
4
(A) 153 MHz UPLINK, 2.2 kW; RBEOFF; (C) 154.2MHz COMMAND CARRIER, 2.2 kW;BW100 kHz;2 MHz/DIV RBEON; BW100kHz; 2 MHz/OIV
153 MHx
1 '
(B) NO UPLINK CARRIER; RIlE ON; BW (O| 163 MHz UPLINK, 130 W;RIlE ON; IlW100kHz;2 MHz/DIV 100 kHz;2 MHz/DIV
Figure 2-19. VHF Monopulse x C-Band Mode Spectra, Rosman, December 17, 1974
1982008279-076

56 ATS-6FINALENGINEERINGPERFORMANCEREPORT
Correlation of the diurnal variations of Nr at Fort Monmouth, New Jersey, and Richmond, Florida.
was found to be reasonably high, so it appears, at least at midlatitudes, that NF observations at oneloc,,.tion can be extrapolated to another.
Based on the fact that at midlatitudes, the monthly root mean square (rms) variation of total con-
, tent was measured to be about 20 percent, error corrections were estimated for precise ranging
systems using monthly averages. A numerical model of Nr at low magnetic latitude was developedfor refraction corrections in satellite tracking and navigation at the low latitudes.
A number of workers have attempted to use scintillation data to predict radio link performance.
Data was presented in the form of Nakagami distributions spectral indices, etc. Fade margin recom-mendations were made by one group in India for radio links subject to strong scintillation. They
suggested that the margin ought to be 12 dB at 40 MHz and 140 MHz, and 7 dB at 360 MHz for _'
signals to be received 1O0 percent of the time.
CONCLUSIONS AND RECOMMENDATIONS
In summarizing, the major accomplishments of the Radio Beacon Program were:
1. The beacon provided the first extensive measurements of electron content above 2000 km.It
2. it enabled continuous measurements of the total electron content near the geomagnetic
equator where the older Faraday technique had failed.
3. International cooperative programs m North America, Ettrope, and India provided concur-
rent electron content measurements as functions of geographical location and time.
4. High-time resolution (e.g., i second at Boulder and 0.1 second at Ootacamund) enabled
detailed quantitative studies of transient phenomena such as sudden increases in total con-
tent caused by solar flares, effects of geomagnetic sudden commencements, micropulsa-
tions in total content, and Fresnel diffraction by small intense plasma lenses.
5. It discovered that, in winter, the plasmaspheric content maximizes at night in the United
States, but maximizes near noon in Europe.
6. It discovered that the plasmaspheric content is highly sensitive to geomagnetic disturb-
ances. Following the onset of a storm the plasmaspheric content decreases, reaches a
minimum on the third day and may take 2 to 3 weeks to re,.'wer to the quiescent level.
Technically, the overall performance of the radio beacon was mainly excellent and it maintained
its calibration very ,veil. The notable exceptions were the failure of the 40-MHz automatic levelcontrol loop due to a high antenna voltage standing wave r_tio (VSWR), beacon interference to
other experiments, and the 360-MHz antenna bandwidth and pattern ripples causing variation otthe 360-MHz modulation phase with the satellite pointing angle. The interference factor and the
1982008279-077

RADIOBEACONEXPERIMENT 57 :
satellite prime power limitations during the equinoxes were a serious detriment to the continuoustaking of data: much data was lost, particularly equinocial data. In tile future, the performance inthese areas should be stressed.
' Future beacon programs should adopt a multisatellite approach so that simultaneous data over widegeographical areas are available. In this regard, the decision not to launch ATS-G had a serious i_
impact on the Radio Beacon Experiment. The 20-MHz channel, as originally planned, was sorelymissed by the scientific community and should be incorporated in future radio beacon experiments.
REFERENCES
!. Stewart, Balfour, Enc.vclopedia Britannica, 9th Ed., Voi. 16, p, 181.
2. Kennelley, A. E., Electrical World Engineering, Vol. 39, p. 473. ._f
3. Heaviside, O,, Encyclopedia Britannica, lOth Ed., p, 215.
4. DeForest, Lee, Proc IRE, Vol. 1 (1913).
5. Fuller, L. F., TransAIEE, Vol. 3a. p. 567 (1915).
6. Hulbert, E. O. and A. H. Taylor, Physical Review, Vol. 27, p. 189 (1926).
7. Breit, G. and M. A. Tuve, PhysicalReview, Vol. 28, p. 554 (1926) and M. A. TuveandG Breit;
J GeophysicalRes., Vol. 30, p. 15 (1925).
8. Appleton, E. V. and M. A. F. Barnet, Nature, London Vol. 115, p. 333 (1925). Proc. Royal
Sac., Vol. A109, p, 621 (1925).
9, Dieminger, W., J. Atmos. Terr. Physics, Vol. 36, p. 2085 (1974).
10. Chapman, S.,Proc. Phys. Sac., Vol. 43, p. 26 (1931).
! 1. Lassen, H., Ann. Phys., Vol. 6, p. 415.
12. Eckersley, T. L., Philosophical 3tagazine, Vol. 40, p. 1250 (1925).
13. Eckersley, T. L.,Nature, London, Vol. 135, p. 104 (1935).
14. Smith, R. L., R. A. Helliruelle, and U. W. Yabroff, J. (;eophys. Res., Voi. 65, p. 815 (1960).
15. Storey, L. R. O.,Phti. Trans, Ro)'alSociety, Vol. A246, p. 113 (1953).
16, Carpenter, D. C,, J. Geophrs. Res., Vol. 68, p. 1675, March 1963.
1982008279-078

58 ATS-6_iNALENGINEERINGPERFORMANCEREPORT 
r_
! •
CHAPTER 3
INTRODUCTION TO ENVIRONMENTAL
MEASUREMENTS EXPERIMENTS
INTRODUCTION
The Environmental Measurements Experiments (EME) package was a comprehensive group of eightscientific experiments on ATS-6 that was designed to increase scientific and engineering knowledgeof the spacecraft environment at synchronous altitude. The primary objective was to study the gee-synchronous environment to gain information on electromagnetic-ionospheric interactions.
t
The EME included six particle instruments that were able to determine the nature of particle dis-
tribution for electrons and ions over a range in energy from less than I electron volt (eV) to greaterthan !000 million eV. a range of over eight orders of magnitude in energy.
A seventh experiment, which was used in conjunction with the charged particle measurements, pro-
vided a sensitive, low noise, triaxial fluxgate magnetometer capable of providing measurements ofthe local magnetic field and its variation.
The eighth experiment was a continuation of previous Application Technology _ Jtellite engineering
studies, and provided measurements of the overall life characteristics and performance dr'gradationof solar cells in space.
The I-MF package was located on ATS-6 on a structure at the base of the 9.14-meter parabolic
reflector on the outboard side of the reflector hub. The EME package was rotated 13 degrees aboutthe spacecraft Z-axis to align the package with the normal direction of the lines of the magnetic
field at 35° East Ion_',itude. (See Figure 3-1 .)
The t-ME structure provided a platform upon which the assoctated electronic packages weremounted. To _tisfy the different view angle requirements of the experiments and the rigidity
needed to keep the amplification of vibration to a minimum, a "honeycomb sandwich" shelf design
was ug'd. A substructure was designed to interface complimentary symmetry metal oxide semicon-ductor (COSMOS) devices used in the command interface control (CIC) and encoder units. The
honeycomb shelf was enclosed around the edges by four magnesium hardbacks. These pieces servedas a mounting surface for the louvers, thermal covers, and solar brackets.
The EME outer surface was covered with lightweight multdayer insulation. Openings were providedm the multdayer blanket to enable viewing by the experiments. Thermal insulation between the
EMIl and the spacecraft was accomplished by the use of nine thermal isolators of known heat trans-
fer charactertstics. Electrically grounding the EME to the spacecraft was accomplished by a low"heat loss" ground strap.
S9
1982008279-080

60 ATS-6 FINAL ENGINEERINGPERFORMANCEREPORT
Figure 3-1. ATS-6/EMECoordinltoSystem
A complete list of individual units, their purpose, and source is given in Table 3- i.
Figure 3-2 presents the g-.ME package/spacecraft interface requirements. A block diagram of the
EME system interconnections and data flow is given in Figure 3-3. Tables 3-2 and 3-3 itemize the
data, programming, ground commands, power, and weight of the components in the EME.
A summary of these tables is as follows:
• Weight 73.5 kilograms (162 pounds)
• Power (average) 46 watts
• Data lines !88
• Programming 5 i
• Ground Commands 128
1982008279-081

!
INTRODUCTION TO ENVIRONMENTAL MEASUREMENTS EXPERIMENTS 61
Table 3- I
EME Flight Equipment
ExperimentE.xpertment Characterization Purpose Experimenter
_cDonnell solar Coanic Ray Study solarcosmic rays, entry and A.J. MasleyDouglasCorp. propagation within nmsnetosphere, McDonnell Oo_ghs Corp.
make detailed meuurements of Huntington Betch, Calif.trapped electrons.
Univ. of New Low Energy Make swept and pitched angle me•- Dr. R. L. AmoldyHampshire Proton-Electron surements of low energy electrons
and protons in themagnetosphere.
NASA/GSFC/ Low EnergyProton Study low energy protons. Dr. T. Fritz/Dr. A. KonradiNOAA
Univ.of Elecuon-Proton InvestigatetheoriginoftheVan Dr.J.R.Winckler
Minnesota Spectrometer Allentrapped radiation.
Univ. of Calif. AuroralPanicles Study the distribution of low energy Dr. C. Mcllwainat San Diego electrons and protons.
Univ. of Calif. 148gnetometer Study the magnetic field at wnchro- Dr. P. J. ColemanatLos Angeles nous distances.
HughesAir- so/as Cell Measurelife characteristicsand W.C. DunkerlycraftCo. RadiationDamage performancedegradation ofsolar HughesAircraftCo.
cellsit.space. LosAngeles,Calif.
AerospaceCorp. Omnidirectional Measureomnidirectional fluxes Dr. G. A. PsulikasSpectrometer and spectra of electrons and Aerospace Corp.
protons. Los Angeles,Cali£
Support Equipment Purpose Source
Telemetry Encodef Convert analog and digital experb_ent Westinghouse Electric Corp.output to • pulse code modulationformat. Provide experiment pros_am-rnin8 signalsand real.time clock infor-marion. Provide modulator buffer
outputs fortelemetry.
Power Supply Supply regulated and/or unragalated WestirqlhouseElect_ Cow.voltages to the encoder, commandinterface control, therm_ors, andsolasaspect_mor. Monitortotal
EME power.
Command InterfaceControl Convtrtspacecraftconmm_s to W.tinghouse ElectricCorp.
control experiment power and modes.Provide vem_ation ofpound com.nmndsand mode _atus ID's.
Solar Aspect Sensor Two4xis sohu mqOeidentification Westinghouse FAectrk Corp.u d turn-on control of Hughes Air.craft Co. experiment.
Structure and Substructure Provide cable intercommettons, rtd_. Westinghouse Electrk:Corp.tion _Idln8,spacecrdtinterf_:e,md mtt•bk dymmk andL_emudel_rollufftefttafo¢illEldE components.
1982008279-082

62 ATS-6FINALENGINEERINGPER.:J,2MANCEREPORT
1982008279-083

+
+,
INTRODUCTIONTO ENVIRONMENTALMEASUREMENTSEXPERIMENT 63
1982008279-084

64 ATS-6 FINAL ENGINEERING PERFORMANCE REPORT
Table 3-2
Experiment System Description
Data Wgt. Avg.Experiment Program. Mode Power
Digital Bilevel Analog P.P. Sig. Cmd. (kg) (lb) (watts)
McDonnell Douglas lO 0 0 14 11 1 6.83 15.07 2.27
U. ofNev Hampshire 8 0 0 4 5 9 2.98 6.58 5.12
NASA/GSFC/NOAA 3 0 2. 7 9 9 2.46 5.43 1.0
U. of Minnesota 12 4 0 3 l 0 2.92 6.44 3.83
U of Calif. at San'Diego 5 14 0 15 8 28 4.92 10.85 7.0
U. of Calif. at Los Angeles 0 1 6 3 2 0 3.26 7.18 3.83Electronics
U. of Calif. at Los Angeles 0 0 0 0 0 0 0.44 0.97 0Sensor
Hughes Sig. Proc. Units 0 0 6 0 2 0 2.60 5.73 7.80
Hughes Solar Panel 0 0 0 0 0 0 1.04 2.3 0
Aerospace 12 0 0 4 0 0 1.15 2.53 0.41
Totals 50 19 14 50 38 47 28.60 63.08 31.26
Table 3-3
Support Equipment System Description
Data Wgt. Avg.Component Program. Mode Power
Digital Bflevel Analog P.P. Sig. Cmd. (kg) (lb) (watts)
Encoder - - 2 7 - 12 3.56 7.85 1.2
Clocks and Controls l.O
Power Supply - - - 11 - - 1.79 3.95 3.0
Command Interface - 9* - 1 13 - 3.83 8.44 2.5Control
Solar Aspect Sensor (2) - 14 .... 0.45 1.00 0.2
Structure and Harness 11 29..,4 65 _2
(a)
Totals 23 2 30 13 _2 39.17 86.36 7.9
'90 binarydil_ItsmultiplexedIntotenStoups(wo_ds)of ninebits.
1982008279-085

l' V
INTRODUCTIONTOENVIRONMENTALMEASUREMENTSEXPERIMENTS 65
EME TELEMETRY _,
The following paragraphs give a brief description of the pulse code modulation (PCM) telem-etry format and the methods employed by the encoder-programmer to encode experiment and
housekeeping data. Details of the telemetry format and commands for each experiment are
further described in the paragraphs dealing with the final results of each experiment. A com-
prehensive understanding of the overall EME telemetry system can help to better analyze the _data and final results of each experiment.
The eight scientific experiments delivered both analog and digital outputs to the encoder, and
required digital control signals from the encoder-programmer to initiate mode changes in the
experiments. The commutation of experimental data that generated the required PCM format
was performed in the encoder. Little or no subcommutation was required by the individual
experiments. ,,
Telemetry Format
The PCM telemetry main and Hughes format frames consisted of 200 words per second, each
word consisting of nine bits. The resultant bit rate was 1,800 bits per second and each word timewas 5 milliseconds. The first three words (27 bits) of each frame were used for frame synchroni-zation and employed the following code:
Word 1 Word 2 Word 3
111 110 I01 101 001 011 110 000 000
MSB LSB MSB LSB MSB LSB
In the telemetry bit stream, the most sigalificant bit (MSB) of a word appeared first in time.
The encoder switched between the main and Hughes format. The Hughes format consisted pri-
marily of data from the Hughes Aircraft Corporation (HAC) solar cell experiment, while the
main format contained data for the other seven experiments Switching to the Hughes formatwas accomplished through the c:,mmand interface control unit in conjunction with a solar
aspect sensor that detected Sun incidence to within +-2 degrees of normal to the Hughes solar
panel. The command interface control turned on the solar cell experiment and sent a signal to
the encoder which then switched formats to read out primarily solar cell experiment data for
a period of 2 to 3 minutes. At the end of this period, the encoder reverted to the normal for-
mat mode and sent a signal to the command interface control that, in turn, removed power
from the solar cell experiment and locked out the automatic feature for a period of 2 to 3hours. The solar cell experiment and format was also obtained by ground command with lock-
out and lockon times being the same as for the automatic mode. The formats are shown inFigures 3-4 and 3-5.
1982008279-086

66 ATS-6 FINAL ENGINEERING PERFORMANCEREPORT
_.,,+o
1982008279-087

1982008279-088

68 ATS-6FINALENGINEERINGPERFORMANCEREPORT __:
More than 90 percent of each forwa t was devoted to experiment data and housekeeping parameters. I'The remaining information was composed of synchronization, mode, parity, and real-time clock !!
data that for ease of ground handling were placed in the first eight words of each quarter frame. _"
Handlingof Digital Data i
Digital data were buffered into the encoder through accumulators. Experiments with digital-data !
interfaces had one or more of their own accumulators. The encoder employed 16-bit accumulators i '.
that, in all cases except one. were log compressed to either 10 bits or 9 bits. For the lone exception, I :
no compression took place. For purposes of illustration, the log-compression system (for 16B/9B) _operates as follows:
For the 16 bits, the compressor accumulated the number of shifts required to reach, but not include, '*the first "1." The number of shifts required was then represented, in the 9-bit readout word, by the _ '
four MSB's of the nine (2 a - 2s ). This was called the "exponent." The compressor then loaded the Iinext five bits following, but not including the first "1," into the five least significant bits (LSB) 1
r.
(2 4 - 20) of the 9-bit word. For 10-bit compression, six bits were taken and the last, or LSB, was ' _"loaded into another word for readout.
Example
MSB LSB :.
\0 0 0 0 0/1,,.0 1 1 0 0/0 1 1 0 0 Ace. Contentk /
5 Sl_ifts , --/ _rhis bit shifted to another word for l0 bit compressionto fast "1' /
/Exponent= 5 /
0 1 0 1 0 1 1 0 0 9-bit telemetry word
MSB LSB
2s 2s 24 20 .,
Following compression, data were shifted serially throagh a master gate into the split-phase output
circuitry. All digital-data signals to the encoder were positive with a maximum-pulse pair occur-rence of 1 megahertz (MHz). These signals were a nominai 0 volt in the quiescent state and a nom-inal +10 volts when a signal was present.
Handlingof Bilevel (Dbcreta Digital Data)
The bilevel data were handled in a similar manner as the digital data, except the accumulators or log
compressors were not required. Experiment data were presented to nine bit registers in the encoderfrom which they were shifted serially through the master gate into the split-phase output circuitry.
Voltage levels remained the same for digital data.!.
1982008279-089

INTRODUCTIONTOENVIRONMENTALMEASUREMENTSEXPERIMENTS 69
Handling of Analog Data
The analogdata received by the encodervaried betweena level of 0 volt and +5.12 volts. Theseanalog data were processed through one or two levels of multiplexing. One level of multiplexing /
, was used where the accuracy of a data line was to be 9 bits :tl bit. After multiplexing, the datawere insertfd into the binary-digital format by either of two double-ramp integrator analog-to-
digital converters. The converter output was parallel loaded into a 9-bit shift register from whichit was gated serially to the sprit-phase output circuitry.
Analog-data signals were clamped to prevent damage to the encoder multiplexers and, as designed,
could not become more negative than -0.7 volt or more positive than +7.5 volts.
PerformanceParameters
Performance parameters were treated as analog signals (0 to 5.12 volts). Two performance param-eters were sampled per frame and a complete peak-to-peak cycle took 64 frames and was repetitive.
The encoder sampled 80 different performance parameters. Of these, 50 interface lines were used
for experiments and 25 for EME package housekeeping. Three temperature monitors and the
digital/analog (D/A) drift control moni'or for each clock were internal to the encoder.
Performance parameter distribution was as follows: •
Experiments EME Package
Univ. of Calif. at Los Angeles 3 Structure temperature 1l
Goddard Space Flight Center 7 Encoder temperature 3
Univ. of Minnesota 3 Power supply temperature 2.,
Univ. of Calif. at San Diego 15 Clock ATC 2
McDonnell-Douglas 14 Command interface control _:
Corporation temperature 1
Univ. of New Hampshire 4 Voltages 8
Aerospace Corporation 4 Current 1
Digital/analog drift control(clocks) ..
1982008279-090

i
PRECEDING PAGE BLANK NOT FILMED !
CHAPTER 4
EME EXPERIMENTS '"i-fl
INTRODUCTION
A detailed description of the EME experiments is covered in the following paragraphs, i
Abbreviations as they apply to the experiments are given below:
UCSD, SD University of California, San DiegoAuroral Particles Experiment
NASA NASA/GSFC/NOAA Low Energy Proton Experiment
MDAC McDonnell Douglas Solar Cosmic Ray Experiment
UNH University of New Hampshire Low Energy Proton-
Elec*-on Experiment
U. Minn. University of Minnesota Electron-Proton
Spectrometer Experimeat
UCLA Un!versity of California at Los Angeles-M_gnetometer Experiment
ASC Aerospace Corporation OmnidirectionalSpectrometer Experiment
Hughes, HAC, Hughes Aircraft Company Solar Cell RadiationSolar Cell Damage Experiment
UCLA MAGNETOMETER EXPERIMENT, UNIVERSITY OF CALIFORNIA, LOS ANGELES,DR. P. J. COLEMAN
Purpou
The purpose of the UCLA experiment was to study the properties and dynamics of the magnetos-
phere, magnetospheric tail. magnetopause, and magnetosheath of the Earth at synchronous altitudes.
A secondary objective was to continuously monitor the strength of the Earth's magnetic field atsynchronous altitudes. The dynamic range of the instrument was t_ 12 gamma ('r), with a resolution
of 1/16"I¢.
71
1982008279-091

72 ATS-6FINALENGINEERINGPERFORMANCEREPORT
Physical Description _
The system was physically divided into two parts, an electronics package and a sensor package. Theelectronics package was mounted in the EME structure, while the sensor was mounted on a space-craft boom. The sensor and electronics were connected by a cable.
Description of Operation
Figure 4-1 is the block diagram of the ATS-6 UCLA experiment. The magnetometer consisted offour subsystems: the basic magnetometer, digital offset field generators, in-flight calibration, and _the power supply.
BasicMagnetometer
Figure 4-2 is a block diagram of a basic-nullingtype monoaxial secondharmonic fluxgate magne-tometer. Three suchsubsystemswerecombined to form the triaxial experimentfor ATS-6. The sen-sor consistedof two coresof magneticallypermeable material, with primary windingsconnectedseriesopposingand secondarywindingsconnectedseriesaiding.In the absenceof anexternal field,the coreswere driven symmetrically into saturation in alternate directionsby a current in theprimary windings.An ambient field alongthe corescausedthe coresto remainin saturationlongerin one direction than in the other. A second-harmonicvoltage,which was proportional to theimpressedfield alongthe core,was induced in the secondarywindings.
This second-harmonicvoltagewasamplifiedand then rectifiedto obtaina d.c. voltage.A part of thedemodulatedoutput wasapplied backto the probe through the feedbackwindingin sucha way asto oppose the field to be measured.A low-passfilter function was inherent in the demodulatormechanization,and it reducedthe loop gainto lessthan one at the frequencywhere the phaseshiftwas 180 degrees. :,
The amount of feedback necessary to null the field to be measured gave an indication of the field'sstrength. By changing resistors in the feedback circuit, the sensitivity of the probe could be altered.
By using a high-looo gain, very stable operation and excellent linear sensitivity were obtained.
A synchronous demodulator was used to detect the direction of the field. The second-harmonicoutput of the sensor changed by 180 degrees when the field was reversed. The synchronous detectorwas sensitive to this change of phase. This detector had the further advantage of being insensitive tofundamental and odd harmonic components in the signal which had not been completely eliminatedby the band-pass f'dters in the second harmonic amplifiers.
The basic magnetometer had a bandwidth that was much wider than could be handled by the ATS-6telemetry; therefore, a four-pole, low-pass f'dter was inserted between the basic magnetometer out-put and the telemetry input.
The range of the basic magnetometer was ± 16 1'.
1982008279-092

EME EXPERIMENTS ?3
1982008279-093

74 ATS-6 FINAL ENGINEERINGPERFORMANCEREPORT .
COIL L__ J FeEOUENCV[-- J' Iomv.i---7 .,v,°.
1 "MAGNETIC BA$1CFIELD • MAGNETOMETER
INPUT _L_ SECOND I ! SYNCHRONOUa 1 OUTPUT
(_)--__o. .A..ONIC1 .J omcTo.1--I oc I _ --f-'_Ac _'1 A,,o _'1 ,_,U,,ER_ ;,.L,,,.,,I i .,.T. I , , , --
• { FEEDBACKNETWORK_ ....
Figure4-2. BasicMagnetometerBlockDiagram
)Digita/ Offset Field Generators
The purpose of the offset field generators was to extend the dynamic range of the experiment with-
out sacrificing the resolving capability of the basic magnetometer. This was accomplished by apply-
ing localized offset fields, thus placing the basic magnetometer within its linear dynamic range. The
localized fields were generated by supplying stable currents in discrete steps to an auxiliary coil
wound around the magnetometer sensor.
The block diagram shown in Figure 4-3 is a basic magnetometer with offset field generator. The level
detector indicated an off-scale condition of the basic magnetometer. When this occl,rs, counts were
either added to or subtracted from the up-down counter. Each binary in the up-down counter drove
a switch of a ladder-adder type digital-to-analog converter (R/2 resistor network). The output of the
ladder-adder was a linear function of the state of the up-down counter. This output was applied to
the coil driver circuit through a trimming (selectable) resistor R t. The amplifier was biased at I/2 V,the reference voltage, by the resistor divider network connected to the noninverting input. With the
offs,.'t w!nding connected in the feedback of the operational amp'._fier, the current, !, through the
winding was equal to V/(R + RT ), no matter how the coil resistance mightchange. V was the out-
l' :t voltage of the ladder-adder, R -vas the characteristic resistance of the ladder, and !_T was thetrim,.ttng resistor. Since the operational amplifier was biased at midscale, the current reversed direc-
tion as V passed through I/2 V a . When the output of the basic magnetometer activat,.d either leveldetector, the offset field gene,rator applied an incremental offset field to :he sensor so that the basic
magnetometer output was returned to center scale.
In the magnetometer design, the digital offset generator was divided into two sections, medium off-
set and coarse offset: however, only the medium offset was lequired for ATS-6. Each had a separate
i
1982008279-094

EME EXPER;MENTS 75
j 6 °-"• • • V COIL _
.+VR R2R _
t,,WtLtI I E.*RLE I I! L.,EL ! II[ DETECTOR J I I
ALIASlNG
FILTERTELEMETRY
OUTIqJTSENSOR
Figure4-3. Offset Field GeneratorBlock Diagram
coil on the sensor and separate O/A converter and coil driver. The up-down counter was a contin-
uous 13-bit co, ntcL The medium offset range was +496 to -5 !2 "),in !6 '7 steps.
Power Supply
: he input LC line filter's purpose was to condition the +28 V input power for use by the inverter,
limit inductive spiking on the input power lines, and limit noise reflected back on the input lines
by the power supply. The +28 V input inverter produced two sets of square wave outputs. One set
produced a 32-V peak-to-peak square wave with a center tap and the other set produced an 18-V
peak-to-peak square wave with a center tap. The ac-to-dc full wave rectifier produced unregulated
+15 V, -15 V, and +8 Vdc. Three voltage regulators operated trom these voltages and produced
regulated +12 V, -12 V. and +5 Vdc. The output of these regulators powered the experiment. #ll
modules were internally protected against Gvervoltage, undervoltage, and reversed polarity.
The +28 Vdc input power return lines were isolated from signal and chassis.
In.Flight Calibrate
This subsystem produced four calibrate fields to the three axes simultaneously, it consisted of a
voltage ,source, analog switcnes, a driver, and a digital counter.
The calibrate clock signal was a continuous 2-second square wave from the EME ¢ncoder, A gate
! blocked the clock signal from reaching the binary counter until a cal;,brate initiate sign,J set the con-trol flip-flop. When the counter was not counting, it sat in the 11 I state After a calibrate initiate
pulse, the next clock pulse caused the counter to switch to the 000 state, thus beginning the calib:ate
P
1982008279-095

!
76 ATS-6 FINAL ENGINEERING PERFORMANCE REPORT
sequence. The counter counted through an 01 ! state, the last step in the cahbrate sequence. When it
switched to 100, the calibrate s_quenc¢ v s completed. The counter continued counting until it
, reached 111. The counter stayed in the 111 state until the next calibrate initiate pulse.
ONH EXPERIMENT, UNIVERSITY OF NEW HAMPSHIRE, DR. R. ARNOLDY
Purpose
The objective of the UNH experiment was the detection and measurement of low energy electrons
and protons in the 0 to 22-keV range.
,, PhysicalDescription
The experiment electronics and sensors were completely contained in one ,Jnit. The package wassubdivided into three compartments, each with a separate cover. The compartments were the pitchangle, sweep, and logic sections. The pitch angle section contained two detector assemblies; onelooking at 45 degrees between south and radially outward, and the other at 15 degrees radially out-ward from north (165 degrees from south).
The sweep section also contained two detector assembiies; one looki,g radially outward (90 degrees)and the other looking south (0 degree). The viewing half angles for all detectors was a maximum of
8 degrees.
Each of the four detector asscmb!ies consisted of two Bendix Channeltron electron multipliers
(CEM) located behind a set of curved (90-degree) electrost_atic deflection electrodes. This config-uration, termed double electrostatic analyzer (DESA), is shown schematically in Figure 4-4. By con-trolling the voltage across the electrodes of the DESA and the CEM, it was possible to select thecharge and energy of the particles to be detected. The i:,ner channel was biased for protons and the
outer channel for elechons. Monitoring :he count frem the CEM ,gave the relative concentration of
particles with a particular energy in the Lv:.ldof view of the DESA.
Des_iption of Operation
A block diagram of the experiment is showri in Figure 4-5. Electrically, the pitch angle and sweep
section were somewhat identical and each could be operated independently of the other, sinceseparate on/off power commands were provided for each section, in normal operation, the currentconsumed by the sweep section averaged 93 mA and 90 mA for the pitch unit. This gave an average
power for both units operating in the normal mode of _pproxima:ely 5. i2 watts.
Sweep Section
In normal operation, tlze voltage across the electrodes of the O- and 90-degre_ DESA's was cyc)edfrom +2400 volts to 0 volt in a decreasing parabolic sweep once per second. All experiment data,except performance parameters, were digital and were handled by eight different accumulaton.
fhese were designated as "fast" accumulators and were read out eight times per telemetry frame, :'
1982008279-096

EM£EXI)ERIME.'CTS 77
CHAJ_NE L E LECTROI_
MULTIPLIEIMI (2 PER DEliA)
(eLM)
Figure44. DoubleElectrostaticAnalyzer
thus providing high resolution spectral data. Th_ other two accumulators, INT A and INT B assoc-
iated with the sweep section, were designated as sk,,,_ accumulat')rs and were read out once pertelemetry frame thus providing "n integrated type of data.
Througik ground corn na,ld, it was pog._ible to connecg each of the CEM outputs to any of the foL_raccumulators.
As the total number of palticles detected by the CEM's increa_d, the output pulse amplitudetended to decrease. Te off_et these decreases an additiona: ground command, term_.d thresholdlevel i, was available and, in the "I" state, caused the sensitivity of all the sweep section CEM pre-amplifiers to increase. In the normal operating mode, this command was in the low or "0" state.
Pitch Angle Section
The DESA's in this _ection of the experiment were oriented at 45 and 165 degrees to dett:.rmine the
pitch angle distribution of the particles. Th," potentials across these DESA electrodes were steppedthrough _:ight decreasing voltage le,'¢ls, each occurring one per second. The output of the pitch
angle CEM preamplifiers were routed to the four ent:oder accumulator. Each of these accumulators
wer_ read out once per seco._d.
The pitch angle CEM's opecated in the same manner as the sweep ,,-;'-...,,_,ti_erefore, one additionalcommand, termed thyroid level _, _'as assigned *o this section, it operated in the same manner as
TL-I to incre_ise the sensitivity of the preamplifiers when ne0:essarydue to a high counting rate bythe detectcrs.
_,o
1982008279-097

1982008279-098

EMEEXPERIMENTS 79
This experiment did not use any radioactive sources for testing purposes, either internal or external, "
and there was no in-flight calibration sequence. However, one of the programming signals suppliedby the EME encoder, termed background data enable, caused a reverse bias of approximately 10volts to be placed on the sweep DESA electrode for 9 seconds every 93.9 minutes. This providedan analysis of the experiment operation in a "background" mode with no particles having beencounted.
U. OF MINN. EXPERIMENT, UNIVERSITY OF MINNESOTA, DR. J. R. WINCKLER
Purpose
The purpose of the University of Minnesota experiment was to investigate the origin of Van Allen
trapped radiation. This was accomplished by suitable measurements of the intensity and time varia-tions of protons and electron radiation in the vicinity of the synchronous orbit, and by a detailedanalysis of these variations and their relationship to polar and magnetic storms and other perturba-tions of the magnetosphere. The experiment measured the directional flux of protons and electrons,
so that the pitch angle distribution of both particle types could be determined. Protons were detec-ted in three energy bends: 20 to 50 keV, 50 to 150 keV, and 150 to 500 keV. Electrons were alsodetected in three energy bands: 20 to 40 keV, 100 to 200 keV, and I to 1.5 MeV.
PhysicalDescription
Two identical sets of detector assemblies were used. One set was fixed looking eastward, and the
other set scanned 180 degrees from north to south through west. Each assembly contained foursolid-state detectors; one for protons, and three for electrons. A radioactive source and a radiationbarrier were mounted on the experiment to intercept the scanning detector at two positions, pro-viding an in-flight calibration source and a background reference. The experiment body was paintedblack. The detector assemblies were painted white.
Dmcription of Operation
Figure 4-6 is the block diagram of the University of Minnesota experiment. Particles incident withina cone of 5 degrees +1 degree half angle around the viewing direction entered each of the detectorassemblies. A magnetic deflection system separated the proton and electron channels and preventedlow energy electrons from impinging on the proton detectors. A magnetic field deflected the elec-trons to one of the three detectors, depending on the energy of the particle. The high energyelectrons passed through the proton detector, which was located just in front of the high energyelectron detector. Pulse amplitude and coincidence pulse methods were used to classify the par-ticles. The pulses were amplified and fed to window discriminators. The discriminator output fromboth detector assemblies were fed through separate drivers to 12 digital encoder inputs. The encoderaccumulated the lowest level proton and electron channel from each detector for 125 msec, pro-riding eight readouts per second. The remaining eight channels were accumulated for I second andwere read out once per second.
1982008279-099

1982008279-100

EMEEXPERIMENTS 81 ;-
The scanning detector moved from north to south through west. Movement was controlled by aprogramming signal from the encoder (the signal was a 555-vsec pulse occurring every 8 seconds). _
The detector moved to 13 positions in 15 degree steps, reversing at the ends. A step occurred every8 seconds near the start of frames 0, 8, 15, 24, 32, 40, 48, and 56. Four bits of bilevel data derived !
from a shaft encoder were buffered to the encoder and are read out once per frame to provide infor- _"
marion on the sensor look angle.e
Three thermistors were used to indicate temperatures of the detectors and electronics. Each therm- ,,
istor voltage was transmitted to the encoder on a performance parameter line and was telemetered ,_once every 64 seconds.
Two positions for the scanning detector did not view the space environment. For one of these, thedetector faced a radioactive source composed of Promethium (Pro-147) and $trontum (Sr-90),which was used for in-flight calibration. For the other position, the detector faced a radiation shield _
that provided the capability of determining the background noise of the system.
SOLAR CELL RADIATION DAMAGE EXPERIMENT, HUGHES AIRCRAFT COMPANY,
W. C. DUNKERLY .\
Purpou
The scientific objective of this experiment was to isolate and identify solar cell degradation resulting
from the radiation environment in the geosynchronous orbit.
PhysicalDescription
The experiment consisted of a small solar panel, measuring 25.4 cm X 42.2 cm in the Z-Y plane,
and two identical signal processor units. The solar panel, mounted on the west face of the EME
package, was divided into two substrate sections, one rigid and one flexible. The rigid substrate was0.635-cm aluminum honeycomb covered with 0.0254-cm aluminum face sheets. The face sheet was
coated with an insulating paint to electrically isolate the cells from the aluminum. The cells on therigid substrate were individually mounted to the substrate with RTV silicone rubber adhesive, and
received radiation from the front side only.
A 6.858 X 20.955-cm hole was cut out of the rigid substrate to allow the mounting of the flexiblesubstrate. This flexible portion of the panel was a composite laminate of 0.00254-cm thick fiber-
glass cloth and 0.00254-cm thick Kapton banding with an epoxy adhesive. The cells were bondedto the flexible substrate, using an RTV silicon rubber. _'
When mounted, the flexible portion of the panel extended beyond the EME package to the south i(+Y) to allow these cells to experience particulate radiation from both the front and the back.
I
The complete solar panel was composed of 80 experimental cells and one dummy cell. The cellswere divided into 13 configurations of 5 identical cells on the rigidportion of the panel, and 3 con-
figurations of 5 identical cells on the flexible panel (plus the dummy cell for symmetry). All cell i
1982008279-101

_. T,Jll
82 ATS-6FINALENGINEERINGPERFORMANCEREPORT ,!
types used on the flexible panel were duplicated on the rigid panel to obtain comparative data onradiation from both sides, versus radiation from one side only.
Twenty cells in a group were individually wired to one of four panei connectors, each of which wasconnected to one of the two signal processor anits. Separate lead wires were used for cell voltage
and cell current. The ground return for each cell was connected to a common ground.
, The solar cells used in this experiment were all 2 X 2 cm silicon types, manufactured by }teliotek.
A typical cell, showing terminology used, is illustrated in Figure 4-7. Cell location configurationsand characteristics are shown in Figure 4-8 and Table 4-1. The majority of the selected cells were
boron doped N/P, 10-ohm-cm, 12 mil thick, and had solder coated titanium-silver contacts.
Configurations 1 through 4 had varied coverglass thickness. Configuration 5 used a plain 3-mil
7940 quartz coverslide without either the ultraviolet filter or antireflective coating. Configurations
6 and 7 ,,vere integral coated solar cells using 7940 and 7070 quartz, respectively. Configurations 8
and 9 had cells with a base remtivity of 2 ohm-cm and different cell thicknesses of 12 and 8 mils.Configuration 10 examined the characteristics of a titanium dioxide antireflective coating compared
to the standard silicon monoxide coating. Configuration 12 cells were "grouted." Cell adhesive,
or a similar material, was applied to the bus area and around the s!ide to assure protection of the
solar cell and bus bar area from low energy r,rotons. This configuration can be compared to config-uration 3, which was protected using the "zero gap" dimensional coverslide-cell design, but without
a special coating on the soldered bus bar areas. .:
The signal processor units were mounted, one on top of the other, on the underside of the EME
deck near the mounting points of the panel. The signal processor units were painted black except forthe contact surface between the two units and between the bottom unit (SPU-2) and the EME deck.
BUS BAR
B' G AP_._. ,
T
BAR GAP: BUS BAR GAP
COLLECTION GRID6
SOLAR CELL
COVERSLIDE
Figure4-7. SolarCellTerminologyChart
1982008279-102

EME EXPERIMENTS 83 '_
?
1982008279-103

i
84 ATS-6FINALENGINEER/NGPERFORMANCEREPORT
Table 4-1
Solar Cell Flight Experiment Configurations
Cell Coverslide
Resistivity Thickness Thickness
Configuration (ohm-cm) (mils) (mils) Remarks Location
1 10 12 3 Rigid
2 10 12 6 Rigid
3 10 12 12 Rigid
4 10 12 30 Rigid
5 10 12 3 Plain 7940 Rigid [|
quartz cover-
glass no filter, ior coatings
6 l 0 12 3 7940 Integral Rigid
7 l 0 12 3 7070 Integral Rigid
8 2 12 6 Rigid
9 2 8 6 Rigid
l 0 2 8 6 Titanium Rigiddioxide cell
antireflectiv¢
coating
11 10 8 6 Rigid
12 10 12 12 "Grouted" Rigidcell
13 l 0 12 12 15 mil bar gap Rigid
14 l0 8 6 Flex-
ible
15 2 8 6 Flex-
ible
16 2 12 6 Flex-ible
1982008279-104

i't,
EMEEXPERIMENTS 85 .:
Dmcription of Operation
The solar cell radiation damage experiments measured the voltage-current characteristics of each of :.
80 solar cells. The measurements were made using two identical signal processor units, each of
which analyzed 40 solar cells. A block diagram of one of the two signal processors is shown inFigure 4-9. The following description concerns operation of one unit only, since they were bothidentical and functioned in the same manner.
Internally, experiment operation was divided into minor frames, cells, and major frames. A minorframe was 30 msec in length and 16 minor frames (480 msec) were required to obtain completeinformation about one cell. Four cells were analyzed in one major frame (1.92 seconds), and 10 {
major frames completed the cycle for 40 cells.
To measure cell characteristics, one of the 40 ceils was connected to the load resistors by the cell-select and load-select relays. The load-timing circuit controlled which load-select relay was to be
energized. This circuit was incremented once each minor frame by a signal supplied by the EME
encoder. The cell-timing circuit controlled which of the four cells analyzed during a major framewas currently to be analyzed. It was incremented once each 16 minor frames. The major-franletiming circuit controlled which of the 10 major frames required for the 40 cells was the current one.
The initial state of this counter could be any one of the 16 possible states of four flip-flops. How- "-ever, if the initial state was any one of the 6 abnormal states, the logic was such that the counter
would shift to one of the 10 allowed states at the beginning of the next major frame. No provisionwas made tot resetting the major-frame tinling circuit when power was initially applied to the unit:therefore, the count could begin at any one of the 10 allowed states.
Cell current was determined from the voltage developed across an accurately known load resistor.
This information was then sent through the cell-current multiplexer to the cell-current-sense ampli-tier and buffer, where it was conditioned for a 0 to +5.12 volt analog output to the encoder. :
The output of the cell-voltage nmltiplexer was sent to a buffer amplifier while the voltage commonor cell return was sent to a second buffer amplifier. The buffer outputs were then used to make a ":differential measurement of the cell voltage. As for the current readings, the cell voltage was then
conditioned for the 0 to +5. ! 2 volt analog output to the encoder.
in addition to cell analysis, the signal processor provided precision calibration voltages for both the"current" and "voltage" channels, and temperature information from thermistors on the solar paneland near the load resistors.
::Calibration voltages were obtained by dividing down a -10.24 volt reference supply into fourvoltages that were supplied to both the cell current and cell voltage multiplexers. At the output ofthe divider network, these voltages were a_ follows:
CAL-I 500 mV
CAL-2 200 mV
CAL-3 400 mVCAL-4 600 mV
1982008279-105

86 ATS-6 FINAL ENGINEERINGPERFORMANCEREPORT •
1982008279-106

EMEEXPERIMENTS 87
Seven thermistors were used in this experiment. Two of these were internal (1 per SvU) r,_d theother five were located oo file solar panel. RT1, RT3, and RT5 were on the rigid portion of the
panel while RT2 and RT4 were on the flexible panel.
This experiment was normally operated once per day for a period of approximately three minutes.
Experiment turn-on was initiated when the EME solar aspect sensor detected a Sun incidence of2 degrees of normal to the solar panel. At that time, +28 volts was supplied to the signal processors
and the encoder switched to a special telemetry format allotted to the solar cell experiment. After aperiod of 2 to 3 minutes, the encoder initiated a signal that returned telemetry to the regular formatand removed power from the experiment.
During the first 12 major frames of a cell, the voltage and current information was obtained. Fromthe four remaining minor frames of each cell, various other housekeeping and calibration informa-tion was obtained.
NASAJGSFC/NOAA EXPERIMENT, DR. A. KONRADI AND DR. T. FRITZ
Purpose
The purpose of the NASA/GSFC/NOAA experiment was to study low energy protons, side penetra-ting and Bremsstrahlung producing electrons, alpha particles, and various ion energy particles at
synchronous altitudes. The experiment was designed to detect the following energy ranges:
Proton 20 keV to 2.1 MeV in 19 stepsAlpha 0.6 to 4 MeV in 4 stepsLight Ion 2.1 to 12.2 MeV in 6 steps
Medium Ion 9.5 to 22.7 MeV in 6 steps
Heavy Ion _20 MeV
Detection of particle energies was accomplished by four solid-state telescopes, three of which
looked outward along the Z-Z axis and the other looked south.
PhysicalDescription
The experiment package consisted of an electronics portion, and a radiating fin extending perpen-dicular from the mounting base. The four telescope detectors were mounted on the fin and t'acasedin a thermal blanket that maintained them at a suitably cold operating temperatare near 0°C.
Descriptionof Operation
Figure 4-10 is the block diagram of the NASA/GSFC/NOAA experiment. The experiment containedfour solid-state detectors. Particles that entered the detectors freed a quantity of charge propor-tional to the energy lost by the incident particle. This charge was amplified to a voltage pulse whoseamplitude was proportional to the quantity of charge, and hence, could be used to determine theincident particle type and energy. The detectors were sampled in the experiment periodically, withthe timing of samples controlled by prograr_mlingsignalg and ground commands.
1982008279-107

+
1982008279-108

EMEEXPERIMENTS 89
Pulses from telescopes A, B, C, and H were then gated through sampling gates and amplified, pulse-height analysis techniques, which employed six levels of discrimination, further distinguished energylevels. Commutation of all discriminator outputs placed this data on three digital lines to the EMEencoder.
The experiment, through ground commands, was capable of operating in one of two modes, normalor high-time resolution (HTR). In the normal mode, the three digital data outputs were the levels ofdiscrimination (as previously discussed) for the four telescopes and four frames of HTR data. Anexperiment cycle of data was 64 frames (seconds) long. The high-time resolution mode consisted of52 frames of HTR dat_ and 12 frames of normal mode data. Durin._ the HTR mode, the digital out-puts constantly contained some select discriminator data rather than a cycle of commutated out-puts.
In addition to the above mode control, the experiment was further capable of controlling telescope
gains and providing telescope anticoincidence modes through the use of ground cor_mands. Analog -_data fed to the encoder provided differential telescope ratemeter outputs, alpha particle and heavyion data, and housekeeping.
An in-flight calibration mode occurred in the experiment once ever), 24 hours at approximately0600 Greenwich mean time (GMT), and lasted for 64 seconds. A programming signal from theencoder determined the exact calibration timing. A sawtooth voltage, which varied from 0 to+3.0 V with a varying period of about 12 seconds, modulated the power converter operationalfrequency (20 kHz). This signal was introduced into the detector amplifie'_. The ramp vo!tage wasmonitored by one of the channels normally used for analog data. By comparing the counting rateof each output to the power converter frequency, a value of the transmission efficiency of a portionof the ramp voltage for a particular detector channel could be determined. By monitoring the 50percent transmission voltage (energy of each channel), any shift in the amplifier gain or discrimina-
tion level could be measured. By calculating the voltage difference between 12-percent and 88-
percent transmission voltages (energies), the detector system noise could also be measured. Theoperation of the coincidence logic was evaluated by enabling the coincidence override (anticoin-cidence) for one 12-second period. On alternate calibration periods (every other day) the calibra-tion signal was delayed half a second. This provided a different set of data points to allow a moredetailed analysis.
MDAC EXPERIMENT, MCOONNELL DOUGLAS CORPORATION, A. J. MASLEY
Purpom
The purpose of the MDAC experiment was to measure the differential energy spectrum of solarprotons and alpha particles, and of trapped electrons. The data were used to study problems relatingto temporal and spatial variations in these intensities. Protons were measured in 12 ranges between0.2 MeV and 230 MeV, alphas were measured in 10 ranges between 2 MeV and 250 MeV, and elec-trons were measured in four ranges between 50 keV and 1 MeV. In addition, measurements of pro-tons greater than 230 MeV and electrons greater than I MeV were made. The detectors lookednorthward and eastward.
.... I
1982008279-109

90 ATS-6FINALENGINEERINGPERFORMANCEREPORT
Physical Description
The experiment consisted of two identical detector assemblies that were orthogonally oriented on'._;c package. Each assembly consisted of a two-detecto,' magnetic, electron spectrometer, and a_hree-detector, proton-alpha particle telescope. The detectors were solid state, either double-diffused silicon (detectors l, 2, 4, 6, 7, and 9) or lithium-drifted silicon (detectors 3, 5, 8, and I0).Detectors i through 5 were located in the north-looking detecto, assembly.
Dm_iptton of Operation
Figure 4-1 i is the block diagram of the MDAC exreriment. Particles entering the detectors freed aquantity of charge that was linearly proportional to the energy that the particle lost in the detec-tors. Charge-sensitive amplifiers conTerted this chargt' to voltage pulses that could be related to theincident particle energy. The voltage pulses were fed to an array of amplitude threshold circuits.The outputs of the threshold circuits were f_d through 'hreto gates" and, for the proton and alphachannels, in some cases through a seven-channel, pulse-iteight analyzer to complete the analym ofthe particle type and energy range. Using this technique, protons, alphas, and electrons in variousenergy intervals were discriminated. Each orthogonal set of detectors had its own discriminators
and veto gates; the pulse-height analyzer was common. The electron information was buffered toeight separate digital-data lines to the encoder. The proton-alpha information (48 channels) wasmultiplexed along with "data flags,'*and buffered to another digital-data line to the es,coder.
The experiment had a data period of 25 s_::onds (frames) during which all proton/alpha scientificdata was sampled once and electron data sampled !00 times. _,:t experiment mode consisted of oneEME frame during which two P/a channels were sampled and each electron channel was sampledfour times. Experiment modes were determined by the states of the programming signals EM Ithrough EM 5. The 5-bit counter m the EME encoder advanced by one on the positive going edgeof EM 6 which occurred 1.97 msec after the start of word 163. Since this 5-bit c£,unter was not in
sync with the binary encoder frame counter, a data flag (EM 10)was sent to the encoder from theexperiment to identify mode zero. During experiment mode zero, the P/o channels (wor_s 64 and .164) contained no experiment scientific data, and instead read out all logic "l's." An additional
da_a signal (EM I!) was sent to the encoder to flag the experiment in-flight calibration (IFC).EM I I o,'¢t, rred immediately after the last readout (W-164) of the P/c_accumulator for the firstexperiment mode 24, following the experiment receiving the IFC signal (EM 8) from the encoder.The encoder then changed the data flag of all "ones" in W104 to all "zeros" and read this out inthe upcoming experiment mode zero. IFC lasted for 25 frames beginning with mode zero. Readoutof _11"ones" in W64 of mode zero remained the same. All experiment accumulators, includi.gP/a for modes 1-24, operated normally and recorded scientific data during IFC. IFC data wuregistered in a separate encoder accumulator provided for this purpose.
The experiment in-flight calibration mode proviaed a check on the electronics, The in-flight cali-brator generated a 1,024..step staircase waveform where eech step was a precisely known voltagethat was modulated into 10 amplifier-compatible pulses. The segmented staircase waveform was
presented to each amplifier sequentially, so that each staircase checked a particular pulse-height
1982008279-110

EM_ EXPEI_34ENTS 91 _
1982008279-111

92 ATS-6FINALENGINEERINGPERFORMANCEREPORT _
.i
discriminator. The pulse-height discriminator threshold was established by counting the number ofoutput puhes from that discriminator. The in-flight calibrator also provided a check of operation
for the amplifiers, analog commutator, driver amplifier, pulse-height analyzer, readout circuitry,and system readout timing. The 25-second IFC mode was entered once a day at approximately _,0600 GMT as a result of programming from the encoder. A ground command could be used to enteror disable the IFC mode at any time.
UCSD EXPERIMENT, UNIVERSITY OF CALIFORNIA, SAN DIEGO, DR. C. M©ILWAIN
Purpose '
The purpose of the UCSD experiment was to observe trapped particles and their interrelations inthe following regions:
s Trapped r,,dmtion belts toward the equator
• N-S auroral zones
• Daytime magnetopause and interplanetary space !
• Nighttime tail plasma sheets
Observed in these regions was the energy spectrum of ions above 50 eV, density versus magneticfield depression, and fluxes of auroral particles and their a:,sociations with electrons above 50 keV,and ions above 50 eV.
PhysicalDcmcriptlon
The physical configuration of the UCSD experiment was a main chassis with one fixed protondetector and two side-mounted, rotating electron-proton detectors. The rotating detectors werecylindrically shaped with a 17.1-cm diameter and a !0.2-cm height. The two rotating detectors wereattached to the sidea of the experiment by a 5.1-cm shaft. The experiment's detector orientation
is illustrated in Ftgure 4-12. The main chassis was painted black and the rotating detectors werepainted white. The EMEthermal blanket covered both the main chassis _nd the rotating detectors. '
Theory of Opwation
Figure 4-13 is the block diagram of the UCSD experiment.
OetlJctors
The experiment had three detectors, two rotating and one fixed. Each rotating detector had twot.3,1indrical, curved-plate electrostatic analyzers, one for electrons and one for protons. The fixeddetector had one proton detector,
w t
1982008279-112

EMEEXPERIMENTS 93 _,
?
OUT PROM ,_
EARTH ROTATING
A OmCTOMa • w
'2
t--. I ! I"- | I
DETECT__ N _
|
Figure 4-12. Orientation of UCSD Experiment Detectors
The geometric factor for the proton analyzer was 5 X 10 .4 E cm: - ster-eV and for the electron
analyzer was !.5 X 10.4 E cm 2 - ster-eV. The orientation of the detectors is shown in Figure 4-12.The moveable detectors rotated about their axes in both the clockwise and counter-clockwise direc-
tions tbr a total of 225 degrees in approximately 0.35-degree steps. Spacecraft commands control-led the positions of these detectors by letting them move to predetermined locations or by lettingthem sweep continuously t'ron_one extreme to the other.
The plate voltage of the analyzers was variable and could be changed to detect discrete energy
ranges. The voltage could be made to step continously from low values to high values, or to dwellon any voltage depending on ground command status.
Electronics
The operation of the electronics is divided into four parts for discussion purposes only. This wasnot actually the physical configuration of the electronics.
Detector Position Electronics-The rotating detectors were positioned by four phase-stepper motors.The motors, which moved in 15-C,,greesteps and were geared down 43:i, moved the detectors inapproximately 0.35-degree steps. The direction of movement was determined by the relative phaseof the motor's four field windings. The amplitude and width of the motor input pulse was changedby ground command so as to adjust the input energy to overcome inertial and frictional forces.
The position of the detectors was set by a binary position counter and tw3 resolvers, one on eachdetector. The position counter counted motor pulses and was read out as bilevel data. The resolvers
were read out as analog data performance parameters.
1982008279-113

94 ATS'6 FINAL ENGINEERINGPERFORMANCEREPORT\
ii
?.
1982008279-114

EMEEXPERIMENTS 95
The clockwise-counterclockwise rotation of the detectors was controlled by a lamp-phototransistorthat changed the phase of the motor pulse when the detector had reached the end cf its travel inone direction.
The initial position ol the detectors after turn-on wa_ not always known nor were tl:.ey necessarilyin the correct position wi_ respect to each other. The experiment had a synchronization system bywhich one detector stopped and waited until the other detector caught up; then both detectorsmoved synchronously. The status of synchronization was read out as bilevel data. I
PoworSupply-Therewerethreesectionsthatcomprisedtheexperiment'spowersupply. Alow- I!I
voltage section supplied the logic voltages and analog circuit voltages. There were two high-voltagesections, one for the spiraltron supply voltages and the other for the deflection plates. The spiral-tron voltages were fixed voltage pairs, a positive pair for the electron spiraltron, and a negative pairfor the proton spiraltrons.
The deflection-plate voltages were programmable by ground command. The plate voltages for the iE-W, N-S, and fixed detectors were controlled by a single ramp generator. The output of the genera-tor is shown in Figure 4-14. The deflection voltage was directly proportional to this signal voltage.The ramp, which looked like a continuous function, was actually composed of 64 discrete steps. ,:When this deflection-control voltage was stepping continuously it was said to be scanning. When thesignal stopped on any one step, it was said to be dwelling.
CHANNEL WHICH IITARTII
THE COUNTER (CYCLE) NO. OF CHANNEl.8 rrEPPED BETWEEN(All -.-*-Ale) EACH DWELL (A20.-..PA2.2)
c=../// / ./// //i IICAN LENGTH I0 1eSllCI DWELL LENGTH (A17-'-'-_A1g)i
i 1 DWELL CYCLE [I
NO. OF DWELLII IN A CYCLE - (A23_/UIB) "
Figure 4-14. Deflection Voltage Control Commands
1982008279-115

96 ATS-6FINALENGINEERINGPERFORMANCEREPORT
The length of the dwell time, number of steps between dwells, and the number of dwells i, a cyclewere controlled by ground command. Controlling the deflection-control voltage in this mannerenabled the experiment to look for discrete energy ranges of particles, and to dwell on any energy
range for given lengths of time.
Data and Dam Gating-The output of each spiraltron was sent to a charge sensitive preamplifier.
The output was then discriminated and shaped for the accumulator gating circuits. These circuitsdeterminer which spiraltron output would go to which encoder accumulator. The gating and timingwere controlled by ground command.
Intercalibration O/c/e-This cycle was used to correlate data from two detectors looking in the same
direction, in this way, a relative calibration of the experiment's detectors were made. This cyclewas enabled or inhibited by ground command. The cycle occurred regularly when enabled.
ASC EXPERIMENT, AEROSPACE CORPORATION, DR. G. A. PAULIKAS
Purpose
The purpose of the Aerospace experiment was to measure the omnidirectional fluxes and spectra
of electrons and protons. The proton spectrum was divided into eight energy ranges: >2 MeV,>3 MeV, >8 MeV, >!2 MeV, 12 to 22 MeV, 20 to 40 MeV, 30 to 60 MeV, and 40 to 100 MeV.
The electron spectrum covered four energy ranges: >150 keV, >700 keV, >1.4 MeV, and >3 MeV.
PhysicalDescription
The ASC experiment consisted of three shielded and one unshielded solid-state detectors, togetherwith associated amplifiers, discriminators, dc/dc converter, and interface circuitry.
The unshieldcd detector was of the transanission type _ith a sensitive area 50 mm square, 230
micrometers thick, and a collimated acceptance angle of 45 degrees. A secondary detecting element,w,th an area 200 mm square and 100 micrometers thick, was mounted directly behind the first
detecting element to inhibit ambiguous information received from particles that were energeticenough to pass completely through the first detector. A thin (0.00254 cm) nickel foil was mountedi, front of the primary detector to prevent light from reaching the light sensitive detectors. In thatsensor, discriminator circuitry determined the particle energy.
The remaining three detectors were cubes with dimensions of !, 2, and 3 ram. Each detector was
housed under a gold-plated, beryllium bubble. The amount of shielding over each detector, togetherwith tile discriminator circuit, determined the energy a particle must have in order to register. Tiledetectors were mounted on Mallory discs to res!rict the sensitive angle to 2_rsterad_ans. The pack-age was painted black, except for the detectors and the gold-bottom surface.
1982008279-116

0
EMEEXPERIMENTS 97 ':
Th_ y of Operation
Figure 4-15 is the block diagram of the ASC experiment. A particle entering one of the detectorsproduced a pulse of current where the quantity of charge released was dependent on the energy ofthe particle. As shown in the block diagram, pulses from the detectors were _:_lplified and then fedto sets of discr_ninators. The discriminators divided the amplified pulses into four electron andeight proton channels. Each of these discriminator outputs was buffered to a digital-data input ofthe EME encoder. The four electron data lines were commutated by the encoder at the frame rate
(1 sec) and were accumulated sequentially and repetitively, beginning with El in frame 0. The eightproton channels were handled similarly. The encoder commutated PI through P8 at the frame rate.The eight lines were accumulated sequentially and repetitively, beginning with PI in frame 0. _
The experiment discriminator levels were established as follows:
Detector 1-Unshielded
f_i Electrons >150 keVPl Protons >2keVP2 Protons >3 MeVP3 Protons _8 MeV
P8 Alphas >12 Mev
Detector 2- l-ram Cube
E2 Electrons >700 keVP4 Protons 12 to 22 MeV
P5 Alphas 40 to 100 MeV
Detector 3-2-ram Cube
E3 Electrons >1.4 MeVP6 Protons 20 to 40 MeV
Detector 4-3-ram Cube
E4 Electrons >3 MeVP6 Protons 30 to 60 MeV
1982008279-117

98 ATS-6 FINAL ENGINEERING PERFORMANCE REPORT
%-
1982008279-118

CHAPTER 5
EME SUPPORT HARDWARE
INTRODUCTION
The following paragraphs describe the EME encoder-programmer, command-interface control, EME
power supply, system grounding, active thermal control sy_,.m, and the solar aspect sensor thatmade up the EME flight package on ATS-6.
ENCODER
Function
The prime function of the EME pulse code modulation encoder was to receive analog and digitaldata from the various experiments and support equipment, and to present this information in propersequence as serial digital-data pulse outputs in a split phase, Manchester ll + 180 (Bi 0-L) format totwo telemetry transmitter modulators. The encoder provided a real-time clock, switchable formats,and several control signals to the experiments and the command-interface control.
Ergo¢_ System
Encoder Timing
The timing for the EME encodersystemwas basicallyderwedfrom oneof two 900-kilohertz (kHz)temperaturecontrolled crystaloscillatorsphydcally locatedexternal to the encoder.Offset controlfor the clocks were provided by IO-bitanalog/digital (A/D) converters in the encoder that was con-
trolled by ground command. This frequency was further divided downward in the encoder to180 kHz, 18 kHz, 1.8 kHz, and 200 hertz (Hz) to provide various control logic signals within theencoder and to the experiments and the command-interface control (CIC). In addition, the 18-kHzand 200-Hz signals were used for generating the real-time clock input frequency and the format-word rate respectively.
Format generation was accomplished by two shift registe_ A 50-bit register accepted the 200-Hzword rate from the countdown chain. A second ,t-bit shift register counted every 50 words. De-coding both registers resulted in a 200-word frame rate of I second. Each frame was further dividedinto quarter sections of 50 words each. Each word consisted of nine bits.
The frame-rate output was fed into a 6-bit frame counter. The frame counter counted frames from
0 to 63, rolled over, and continued repetitively. Commutation of the system performance parun-eters was controlled by decoding this counter. The output of the frame counter controlled a 4-bitsequence counter that counted groups of 64 frames from 0 to 10, rolled over, and was repetitive.
99
1982008279-119

100 ATS-6FINALENGINEERINGPERFORMANCEREPORT -
The frame counter was read out in the EME formats as the six least significant bits (LSB) of word 4and the sequence counter was read out as the four LSB's of word 5.
Format Switching
The encoder was capable of switching between two 200-word formats; one format consisted pri-marily of Hughes Aircraft Company (HAC) experiment data. Control signals for reliable formatswitching came from the CIC. When the encoder was instructed to switch to the HAC format, it didso for 2 to 3 minutes before automatically returning to the normal format. Ouad-redundant-overridelogic in the encoder, controlled by grouad commands, assured that the encoder never remained in
the HAC format for longer than 2 to 3 minutes.
Programming Signals
From the encoderword decoderandcontrol logic, programmingsignalsto the experimentsandC]Cwere generated.The pulse duration and repetition rate were a function of program requirements.When a programming pulse changedfrom the quiescentstate to the logic-onestate, the transitionwas from a nominal 0 volt to a nominal pul_ lO volts. All programming signalswerebuffered be-fore leaving the encoder. All in-flight calibration ([FC) signalsoccurredat the beginningof the firstzero- to ten-volt transition of the sequencecounter following the EME hour nearestG.m.t. timegiven. The hour counter for the EME was the f'we most significant bits (MSB) of the 2?-bit milli-
secondcounter.The z-_rstzero- to ten-volttransition sequenceafter the hour counterdecodinggivenbelowdetermined [FC.
00100 UCLA s IFC
0 0 l 0 l MDAC2 , NASA/GSFC 3 IFC
Real.Time Clock
Real-time clock information was provided by the encoder in the form of a 2?-bit millisecond counter
and a 9-bit day counter. The millisecond counter control was from the l-kHz signal of the encode:timing chain.
The 27-bit millisecond counter counted from 0 to 86,399,999, rolled over to zero, and was repeti-tive. The 27 bits of the binary millisecond counter were read out in words 152, 153, and i 54 of thepulse code modulation format. In addition, the millisecond counter had the following capabilities:
• All 27 bits could be reset by ground command
• The five MSB's (hours section) could be reset to any desired number by ground command.The remalr_inll22 bits were not affected.
UntmnmyofCsMo_ atLo0Ans_seMcl)o_m_,i)c_ksCoq_orstion
tio_l Awm_t_ _ Spsm_a/Godds_ SiNusi_t Crater
1982008279-120

EMESUPPORTHARDWARE !01 :
The 9-bit day counter counted from 0 to 51 I, rolled over to zero, and was repetitive. The daycounter updated by one each time the millisecond counter rolled over to zero. The 9 bits of the daycounter were read out in the format in word 15I. The day counter was capable of being preset toany number by ground command.
Since there was no separate hour counter in the encoder, an EME hour did not have the same timespan as a customary hour. One EME hour was equivalent to 69 minutes and 54,304 millisecondsand there were 21 EME hours in a day.
Digital Accumulation/Compre_ion
Serial experiment digital data were accumulated in the encoder (with integration times rangingfrom 1/4 to I second) in one of forty 16-bit shift registers, and in all cases except one, was com-pressed to 9 or 10 bits by logarithmic compression. For the lone exception, no compression tookplace.
The maximum accumulator inpui rate permitted was 1 megahertz (Mhz). During a period of timelasting for 50 microseconds, each accumulator was reset to a one count and data was transferred tothe 16-bit shift register. Experiment data was inhibited during this time. The number of times anexperiment accumulator was inhibited per frame was a function of the experiment integration timerequirements.
Four logarithmic compressors were time shared and used to compress all experiment accumulatordata. A block diagram of a compressor is shown in Figure 5-1. One of lO accumulator inputs wasOWed into a 16-bit shift register. If the last bit in the register was not a 1, the register was shiftedto the right until the last bit was a I. A 4-bit counter counted the number of shifts required. Thelast bit in the register was always a 1; therefore, it was not telemetered. The next five left-most bitsand the 4 bits of the shift counter were stored in a 9-bit shift register until required for telemetryreadout. The next accumulator transfer pulse reset the shift register and counter and the processrepeated. The error resulting from this compression was ± 1/64 percent.
Digital data from all sources were OR'ed into an output stage whe:'e they were converted to splitphase for telemetry.
Discrete Data
The bilevel, or discrete digital, data were handled similarly to digital data except that accumulatorsor logarithmic compressors were not required. Experimental data were presented to a 9-bit registernn the encoder, from which they were serially shifted through the 16-bit "OR" gate to an outputstage where they were converted to split phase.
1982008279-121

!
102 ATS-6FINALENGINEERINGPERFORMANCEREPORT i
t
IqiOM IrllnlN _-
AND CONTROL f t
BIT CLOCK
_I_AT CONTROL81GNAI.t
Figure 5-1. Eneoder Logarithmic ComprNIor
The encoder sampled 128 housekeepinlisignalsin a =ubmultiplexedsequenceevery64 seconds,and40 an=lossilln=lsin a multiplexed sequenceevery second.All an=lOll=/lln=lswerequantizedto 9 bitswith a maximum accuracyof 7 bits for =ubmultiplexed=/l_n=lsand 9 bits for multiplexed Silln=ls.
Conversionof analogdata to dildtal bits wasperformed by either of two double-rampinteil_ratorA/D converters.The A/D procei= is shown in Fillum 5-2. The converteroutput wasparallelloadedinto a 9-bit shift reldsterfrom whichit wassated serially to the split-phaseoutput circuitry.
The multiplexer, commutator, output buffer, and A/D converter were redundant.One set handledhousekeepinl_ data exclusively read out in even frames and the other in odd frames. Each mudti-plexer consisted of 64 channels.
An analos 8round from each experiment was commutated in the encoder and was used differen-
tiaily in theA/D processto assistin establtddnllhtih accuracies.
P.Jri_ Ctmck
A parity Ilenerator in the encoder monitored every 100 bits of the pulse code modulation datastream. Old parity wu used, m that for an odd number of **l'n"sampled for 100 bits, the ¢orret-pondin= parity bit would be a "0," for an even number the bit would be a "1." Parity bits werefound in words 57 and 157 of the format.
1982008279-122

EMESUPPORTHARDWARE I03
A D INITIATE
U MH:CLOCK
ANALOG 13IrrART
$1 R IHIIT4.120V RIP COUNTER
/
-'_ 9-lilT AID.81ERIAL13
IIHIFT RI[GIIrrER OUTllqJI'
sl oN TIMING DIAGRAMOFF 1 I--"oN
m _l, ,, I Inuu'r .............. I L--U OFFIrrAMT It I •
COUN'rER_leo
STOPCOUNTER
LOAD
Figure5-2. Analog/Digita,2onversionProcess
Telemetry Output
All data were fed througha 16-bit input "OR" _ate to split phase circuitrythat provideda compli-mentaryoutput driverto a transformer.The "OR" gate, split phasecircuitry,and transformerwereall redundant.
The code used was Manchester11+ 180, which wassplit phase level with the orientation,asshownin Figure 5-3 for "ones" and"zeros" present at the EMEtelemetry interface.
IntarfilceClrmits
The encoderprovideddigital, prognmming, and analoginterfaces.The digital interfacecircuits wereexclutively Radio Corporationof Americacomplimentarymetal oxide semiconductor(CMOS).Theanalog circuits were composed of integrated linear amplifiers and p-channel metal oxide semicon-
ductor (MOS) unit._. The CMOS devices used in this design were of the lowest power drain type
available. In addition, they had the highest noise immunity and overall packing density. The analog
devices were selected for low power, high packing density, low ON and high OFF resistance (analog
twitches), and compatibility with CMOS logic.
Typical interfacecircuit_ areshownin Figure5-4, i
1982008279-123

104 ATS-6 FINAL ENGINEERINGPERFORMANCEREPORT
I I Ii
I IJ I
I "zu.o- I omeI t I
Figure5.3. M4mchcmetII Co(k
mGrTAL I P_OGRAMMmO
,mm,,_, I m_TA,_t
8xMnmlm I _ I......,.m. ] _ ,,1,r-,_,.o;,c,__.,.,L__.o1LK CO _ _" CO
NRIIII +10 _ . MR;n .....coummc,n_U,T ¢
I .L _J_ , I--I t 10tlrlplp_l
: I 1 HI,_ , ux_ninms_ I .,,. I
I
m i r-r 'i' it _ o ImT_
L ....... .]___ J " -V
i
Fion_e_wl. TypM_ Ertaodwh_lla_gmlCki:ulu
1982008279-124

EMESUPPORTHARDWARE 105
/
COMMAND INTERFACE CONTROL
Function
The prime function of the command interface control unit was to provide a common interface
between the spacecraft command receiver system and the eight scientific instruments included in
the EME. la addition, the command interface control contained the logic necessary for control of
the EME real-time clock system status monitor, and automatic power control for the Hughes experi-
ment. Sun-aspect data from a remote solar-a_pect sensor were also multiplexed in the command
interface control for transmission through telemetry.
Command Interface Control Operation
Inputs from the Spacecraft
The EME was assigned two command words (9-bit, NRZ-L) from each spacecraft command decoder.
The signals associated with each word were "ENABLE, .... CLOCK," "DATA," and "EXECUTE"
and had the characteristics shown in Figure 5-5. Word 1 is OCTAL 60 and Word 2 is OCTAL 70 inthe data-word address field of the normal-command word.
LOGICI T
q t
t
ENABLE_ 1 "1"
oJ0**
+I
CL 128 HZ, 50% DUTY CYCLE "0"
iI
0 0 1 1 NRZ-L CODEDA
-"--'_ (MSB-T--" (TYPICAL WORD) (LgB)( ' '°0"tt
IX lCU'lrw. I [_J El :1:4_PULIEWIDTH "1"*e0o*
@@ COINCIDENT<100MICROSECOND6@ CO'"C'O"NT,00 " "OaCO"O'
Figure5-5. Input Timing Cherecteristics
.L
1982008279-125

106 ATS-6FINALENGINEERINGPERFORMANCEREPORT
Inputs from the EME Encoder
The command interface control (CIC) required 13 signals from the EME encoder-programmer.These signals were used for logic clocking, data multiplexing, and lockout of automatic power
switching to the Hughes Aircraft Company (HAC) experiment.
There were 10 programming signals from the encoder that enabled the CIC to multiplex status datafor the telemetry transmission. These signals were 0 volt for 5 milliseconds (ms) and +I0 volts for
995 ms. The pulse occurred during the telemetry word prior to readout of data associated with aparticular telemetry word in the format. That is, a pulse during word 50 enabled transmission of
data that would appear in word 51.
There were two clock signals that had a period of 555 microseconds (/asec). These signals were imple-
mented redundantly so that failure of one clock signal would not prevent selection of any command
function. The duration and level of this pulse was 55/asec at 0 volt and 500/asec at +I0 volts.
One signal line from the encoder-programmer contained tl,e "solar cell lockout (busy)" signal. This
signal was normally at 0 volt, but could go to +10 volts when the telemetry format switched from"solar cell format" to "normal format." It remained at +10 volts for 2 or 3 hours. When the signal
was at +10 volts, the automatic power turn-on of the HAC experiment was disabled by overriding
the solar-aspect sensor command. That is, even though the Sun was normal to the HAC experiment
solar cell panel and the "HAC auto" command was on, the HAC experiment could not be turnedon.
Power Distribution
A block diagram of the power control logic is shown in Figure 5-6. It should be noted that WORD 1
(W1) spacecraft command address 60, was used exclusively for logic control of power on/off com-
mands, or commands :_ssociated with updating the EME system real-time clock. It should also be
noted that circuitry and input RW I is redundant to the OR gates and relay drivers.
Figure 5-7 is a diagram of how power was controlled and distributed by the CIC.
The experiment bus relays were redundant and normally it was only necessary to energize one relay
to supply power to the rest of the EME. These bus relays were electrically latched. That is, once
power had been applied to the EME and the experiment bus relay commanded on, the relay would
remain energized until primary power was removed from the EME.
The relays used to control the individual experiment power were magnetically latched and the coilsonly drained power when the execute pulse was active. Control of the magnetic latch relays wasindependent of the state of the experiment bus relays, which provided a means for orbital trouble-
shooting.
The relay labeled SUN NORMAL/HAC LOCKOUT was controlled automatically to supply powerto the HAC experiment. The signal to actuate this function was derived from a solar aspect sensor
1982008279-126

Figure 5-6. Power Control Log0c
remotely from tile EME. In nomlal orbit this relay would automatically actuate for 2 to 3 minutes
olice a day when the Sun was within 2 degrees of tile HAC experiment solar cell panel. Tile lockoutposition was co.troUed by the UME encoder-programmer. This signal ensured that the telemetry
format and power io the HAC experiment could not be recommenced until at least 2 to 3 hours
after the panel had seen the Sun. The status of the relay state was multiplexed in the CIC for telem-etry transmission.
The EME system survival heaters were powered through the off contacts of the experiment busrelays. |'he heater_ were 15 watts each and either zero, one, or two could be selected depending on
the sta_ of d,: experiment bus relays. Note, that heaters could only be energized if primary powerwas supplied from tht. sl:acet'raft to the I!ME.
1982008279-127

108 ATS-6FINALENGINEERINGPERFORMANCEREPORT
1982008279-128

EMESL_ORT HARDWARE 109 _;
Mode Control Logic
The mode control logic is presentedin block diagram form in Figure 5-8. One word (W2) from eachspacecraft decoder, spacecraft command address 70, was used in redundant fashion to derive theindividual mode commands. Tb'_ redundant circuits stopped at the output of the 9-bit commandregisters. ATS-6/EME system requirements were for 56 mode commands, and each command had aseparate address for the "1" or "0" state. To accomplish this, an 11 X 11 matrix was used to pro-
/vide a maximum capability of 121 functions. '.
In addition to the matrix decoded functions, another command path was provided for updatingthe system real-time clock. This was a serial logic path that allowed updating days, hours, or thereal-time clock with a single 9-bit word transmission from the ground.
The serial command path was enabled by decoding the states of particular commands in word 1(60). The serial path was incorporated to expeditiously update the EME system real-time clock witha minimum number of ground commands.
CommandVerification
The 9-bit data word had to be verified through telemetry prior to execution of that command. Theverification word was found in word 102 of the EME format with the most significant bit (MSB) :
transmitted first in time. After command verification and execution, W 102 would go to all "zeros"
until the next data word was sent to the CIC. If the telemetry indicated incorrect data, the com-mand word would be retransmitted. Both word 1 (60XXX) and word 2 (70XXX) data bits appearedin W102 and could not be distinguished.
POWERSUPPLY
The prime purpose of the power supply was to accept the single source voltage of +28 volts direct
current (Vdc) +3 percent provided by the spacecraft and condition this power to be used by thevarious support equipment within the EME package.
Function
The function of the power supply was to provide the necessary voltages for the pulse-code modula-tion encoder, the command interface control unit, the real-time clock, the automatic temperature
controllers and heaters for the encoder oscillators, the solar aspect sensor, and for thermistors thatwere located throughout the EME package. In addition to generating these voltages, the powersupply acted as an interface for aLl the units of the EME package. This feature was provided toimplement a current sensor within the power supply that sensed the total direct current drawn bythe EME package. The current sensor provided an output voltage signal to the encoder that waslinear with current. This current information wad telemetered as part of the pulse code modulationformat.
1982008279-129

110 ATS-6FINALENGINEERINGPERFORMANCEREPORT
1982008279-130

EMESUPPORTHARDWARE 111
PowerSupply Operation
The power supply consisted of 10 submodules. These included seven regulators, an oscillator-driver,an inverter, and a current sensor. A block diagram of the power supply is given in Figure 5-9. Thepower from the spacecraft (+28 Vdc) entered the power supply and passed through an LC filter.The purpose of the LC f'flterwas to minimize the interference between the spacecraft and the powersupply. From the LC filter, the current passed through the current sensor, and then branched intotwo paths. One path went through an LC filter to the CIC that powered the various EME experi-
ments and the other path went through an LC filter to the power supply, power inverter, andoscillator-driver. Again, the LC fdters were used to minimize the interference between the space-craft, the main section of the power supply, and the experiment_. The path to the power inverterand oscillator-driver supplied the current to the main section of the power supply.
The oscifi_ior-driver ,was a stable multivibrator that drove the power inverter to approximately15 kHz. From the inverter, various needed ac output voltages were developed by the power trans-former. These alternating current (ac) voltages were rectified and filtered to produce the requiredunregulated direct current (de) voltages. Some of these unregulated dc voltages were used directlywhile others requ_'_d more precise regulation. Where regulation was required, the unregulated dcvoltage was fed into a series-type regulator. All the regulators were basically the same. They em-ployed an integrate_ circuit regulator with an additional transistor output stage when additionalcurrent was required. Current limiting was done by u_ing a resistor to sense the current. Wl_enthevoltage developed across this resistor reached the desired current limiting value, the output voltagewas reduced so that the output current did not increase above the limit,
The current sensing device of the current sensor consisted of two pieces of resistance wire con-nected in parallel between two pins of the current sensing submodule. The two pieces of wire werein series with the return path of the spacecraft 28 Vdc. Thus, the resistance wire sampled all the cur-rent coming from the spacecraft to the EME package. The voltage developed across this resistancewire was amplified by use of a linear operational amplifier to provide an output voltage that waslinear with the input current. The current sensor gain was approximately 2.23 volts per ampere.
SYSTEM GROUNDING
The EME package contained a number of grounds. Special attention was given to the grounding of
all circuits and units to assure direct current isolation. A diagram of the EME system grounding isgiven in Figure 5-10. A summary of this diagram follows.
SyrmmGround
System ground was the one point in the EME package where signal ground and chassis ground weredirectly tied. From this point a ground strap was attached to the spacecraft chassis ground.
k,
1982008279-131

I 12 ATS-6 FINAL ENGINEFRINGPERFORMANCE REPORT
-#
1982008279-132

!L
EME SUPPORT HARDWARE 113
EMEPOWER ENCODER
BUWPLY ANALOG RETa
RET
81.11ELDTIEPROG.LEAD6
SYSTEMSIGNAL GROUND
SHIELD TIE ':
DIGITAL LEAN i _"
RET AGD ;
_I.IIELDTIE
DIGITAL TYPICAL_LEAD8 EXPERIMENT
i,COMMAND SHIELD TIEINTERFACE ANALOG LEAO_CONTROL
ATSIqDWIER ATS ATE A_S :OMOUNO COMMAND CHAIRIS TELEMETRY
DECODER GROUND RETGROUND
eEXPERIMENlll REQUIRING ONLY ANALOG DATAACCURACYOF ?BITS ORLrdI8 NEED NOT ISOLATEDG AND A_l AND ARE NOT REOUIRED TO SENDAN AGD LiNE TO THE ENCODER. ,_
Figure 5-10. ATS-6/EME Ground System
Support Equipment Grounds
Each EME support unit isolated all grounds (power, signal, and chassis) within that unit. The EME
encoder further isolated digital and analog signal grounds. The EME power supply and command
interface control units were referenced to spacecraft power and command returns respectively.
Experiment Grounds
With the _xception of selective ac ties, all grounds were isolate6 within a given experiment. Experi-ment design and fabrication, at times, dictated the use t:_"capacitive coupling. In those few cases,the experimenter was willing to live with the possibility of coupled system noi.se affecting hi_ unit.For high accuracy data (9 bits), the experimenter further isolated analog and digital grounds (AGand IX;) within his unit.
1982008279-133

114 ATS.6FINALENGINEERINGPERFORMANCEREPORT
ChassisGround
Chassis ground for all units in the EME packages was accomplished when the unit was solidlymounted to an aluminum sheet covering the honeycomb shelf. In addition, one or more AWG #20wires were run from a connector on each unit to a ground lug near the unit. At one point in thepackage, chassis ground became system ground.
Telemetry Return
The remaining ground sent to tne spacecraft was one side of a transformer winding used as the
telemetry modulator buffer. Tiffs ground was isolated from any other ground in the EME system.
ACTIVE THERMAL CONTROL SYSTEM
Purpose
The _urpose of the active thermal control system for the ATS-6/EME package was to keep the
mo, mting deck temperature levels and oscillations within a range of +10°C +10°C for the EMEexperiments and associated support units. The thermal control of the system was obtained throughthe use of variable-emittance louvered radiator systems on the north and south sides of the EMEpackage.
PhysicaiDescription
Each radiator system employed a louver assembly consisting of 12 highly polished aluminum bladesenclosed by a frame of the same material. The louver blades covered a quartz-mirror radiator surface
so that when the blades were closed, radiation from the quartz-mh-ror radiator was blocked. Whenthe blades were open, there was a relatively free radiation interchange between the quartz radiatorand outer space. The radiator surface was covered with a silica material on which silver was vapor-deposited, forming a mirror or optical solar reflector.
Each louver blade was free to rotate independently of the other blades and was also independentlyactuated. This independ_ nt actuation of each blade _erved to increase reliability and to minimize
any tempeL'ature gradient from one end of the louver system to the other that might be caused bynonuniform thermal flux. Actuation was performed by bimetal springs attached to the louver blade
shaft. These springs were located inside the actuator housing at the top of the louver system. Eachspring was conductively and radiatively connected to the quartz radiator so that when the tempera-ture of the radiator rose, the bimetal spring caused the louver blades to open and when the tempera-ture dropped, the blades closed. The radiator plate was bolted to the EME mounting deck. The flat-ness of both mounting surfaces was maintained at 0.005 inch per inch and thermal grease wasapplied on e_,'h surface prior to mating.
During solar illumination, the louver blades, frame and actuator housing became very hot. For tiffsreason, the frame was thermally isolated from the radiator plate by spacer,, and bushings. However,the base of the actuator system was in intimate contact with the radiator since the bimetal spring
1982008279-134

EME SUPPORT HARDWARE I 15
inside sensed the radiate r temperature. To minimize the heat transferred to the spring from thehousing exterior, the actuator housing was heavily insulated with multilayer insulation.
With the exception of several experiment sensors that needed an opening for a clear view of space,
the remaining EME structure was covered with multilayer superinsulation that was supported by a
fiberglass structure. The fiberglass structure had a single layer of aluminized mylar bonded to theinside to reduce radiation coupling between the internal units and the thermal cover. The outer sur-face of the fiberglass was covered by a i 7-layer thermal blanket whose outer layers were aluminizedkapton.
Thermal sealing around the sensors that looked through holes in the thermal cover was accom-plished by taping overlapping preshaped pieces of aluminized kapton to the sensor. A layer oftissueglass was then applied in the same manner. This process was continued until 17 layers of
aluminized kapton were taped to the sensor.
Descriptionof Operation
Thermal control of the EME package was accomplished by the two Iouvered radiator systems, andby the proper choice of sensor coatings and system insulation. Ideally, if the amount of heat ab-sorbed and rejected by the EME system were both constant, the system temperature would be con-stant. Since the heat absorbed is not a constant, the louver systems provided a means of varyingheat rejection as a function of temperature. As the temperature of the EME package rose, indicatingan increase in absorbed heat, tee louver blades opened, allowing an increased rate of heat rejec-
tion. Conversely, as the temperature dropped, the louvers closed. The louvers were mounted on the
north and south sides of the EME since these sides were not directly illuminated by the Sun. Thus
solar angles of incidence were limited to a minimum of 54 degrees, which minimized heat absorbedby the louvers.
The effectiveness of the louvers was reduced by leaks in the system. Because of the man,./experi-
ment sensors, the EME had many leaks. Therefore, when the system deck temperature was at0°C, the louvers were completely closed and rejected approximately 50 percent of the total systemheat. The remaining heat was rejected by the _ensors (38 percent), and the insulation (I 2 percent).As the deck temperatures rose, the louvers opened. At +20°C, the louvers radiated approximately70 percent of the system heat, the sensors 23 percent, and the insulation 7 percent.
Under normal operation in a nominal orbit (Earth synchronous-equatorial-three axis stabilized) theO
thermal control system maintained the EME deck at a temperature of+10 C ±IO°C. To survive allorbital conditions, the EME package also contained two 15-watt heaters operating from the main
power line. Power to each of the heaters was supplied through quadredundant thermostatic switches
in series with each of the two experiment bus power off contacts in the CIC. Each heater came on
when the thermostatic control switch reached -15°C (5°F) and deactuated when the temperaturereached -5°C (23°F).
1982008279-135

116 ATS_ FINALENGINEERINGPERFORMANCEREPORT
SOLAR ASPECT SENSOR
Purpou
The solar aspect sensor detected the position of the Sun within the sensor's field of view, and pro-vided this Sun-angle information on 14 parallel bits to the command interface control. This datawas used for two purposes:
• Automatic turn-on of the HAC experiment and format when the Sun was normal, in the
vertical axis, to the HAC solar panel mounted on the west face of the EME
• Provided angular information defining the orientation of ",heEME package
Physical Dmcriplion ._
The solar aspect sensor had three basic components: a sensor, an electronics unit, and a sunshade.The sensor contained 16 solar cells and 2 reticles. The sensor looked through the thermal blanketto the west, and connected to the electronics unit. The electronics unit contained all the electronic
components associated with the sensing system except for the solar cells. The electronics unit waslocated within the thermal blanket. The sunshade was made from fiberglass and was bonded to oneside of the sensor. All three units were painted black except for the edges of the sensor and themounting surface of the electronics which were bare aluminum.
Descriptionof Operation "-
The sensor contained two sets of eight solar cells and two orthogonally oriented reticles to provideSun aspect data when the Sun was within the 128 × 128-degree field of view of the sensor. Thesensor looked west; its horizontal axis was defined as the Y-Y axis and the vertical a_is of the sensor
was its Z-Z axis (Figure 5-I I ).
Seven cells in each axis provided the sensors for the digital readout of Sun position by differences incurrent outputs for illuminated cells and nonilluminated ceils. The Sun angle was encoded into a
7-bit binary number, as shown in Figure 5-I 2. Sunlight was passed through a reticle placed betweenthe Sun and the solar cells. The bottom of the reticle was divided into eight sections. Each sectionhad .', solar cell behind it, and seven of the sections were mbdivided into opaque and transparentsegments. The top of the reticle was opaque except for a narrow transparent slit _hat, when ilium-inated, projected a bright image on the bottom of the reticle. The position of the bright image ofthe slit on the bottom of the reticle was a function of the angle of incidence of the light on thesensor, but the image of the slit always fell across all eight sections of the bottom of the reticle.If the bright image fell across a 0ransparent segment of one of the sections, then the associated cellwas ill.minated and had a relatively large current output. !I"the image fell across an opaque Sell-ment. the associated cell was dark, and had relatively small current output. The transparent/opaquepatterns of the reticle were laid out in such a way that as the Sun swept from -64 to +64 degrees(causing the image of the slit to move from one side of the pattern on the bottom of the reticleto the other) i 28 different combinations of the seven digital readout cells were illuminated, therebydividing the angles from -64 to +64 degrees into ! 28 one-degree steps.
1982008279-136

1982008279-137

118 ATS-6 FINAL ENGINEERINGPERFORMANCEREPORT f
I, ENGORENTRANCE8LIT
GRAY4:OOtD PATTIEFIN
PHOTOCELLS
PHOTOCELL(X/TPUTIi
ATA I
ELECTRONICS AMPLIFIER
TOTIELIEMIETRYBUFFERSTORAGE
Figure5-12. Sol,lrAspectSemorOperationalDiagram
The eighth section of the pattern on the b_ttom of the reticle was not used directly for coding the
angle of the Sun. This section was transparent throughout it_ length so that the cell associated with
it was illuminated through the entire range of angles from -64 to +64 degrees. The output of this
cell was uc_d to determine how much current was to be expected from an illuminated cell in the
other seven sections, and, therefore, was an aid in determining whether the current output of the
other cells was due to illuminiation or was "dark current." This was necest, ary because the currep.t
output of an illuminated cell depended strongly on light intensity and angle of incidence. Th_
eighth ceil, the automatic threshold adjust (ATA), was illuminated through a transparent segment
that was one-half as wide as the transparent segments of the seven digital readout cells. The ATA
output was, therefore, one-half the output or"the other illuminated cells, and this lesser output was
used as a threshold (i.e., if a cell output was greater than the ATA, the cell was consddered to be a
"I ;" if the cell output was less than the ATA, the cell was considered to be a "0").
The output ,:ut.-ent of the 14 digital readout cells, a_d one of the ATA't, was :ed to the c;ectzonics
unit. The electronics compared each digitakreadout cell current with the ATA current, and put out
14 bits ot bilevel data to the CIC. This bilcvel data were telemetered in W54 and WSS. (Word 54
contained vettic_: [Z-axis] data and Word 55 contained horizontal [Y-axis] data.)The gcond func-
tion _erformed by the sensor was to provide a tignal for automatic turn-on of the HA(" experiment.The ('IC decoded the seven bits of the vertical axis. When those bits indicated a normal incidence
in this axis, the CIC provided a _dlgnalto turn the HAC on, and to switch to solar cell format, where-
by thL_ automatic feature was enabled,
1982008279-138

EMESUPPORTHARDWARE 119
The function of the shade gas to prevent reflected fight from reaching the sensor. The shade also
.had the effect of limiting the field of view in one direction to only 14 degrees from normal insteadof the 64 dt_greeswhich the sensor could view. The shade was painted black to prevent significantreflections from the shade itself.
:- The solar aspect _nsor electronics received +15 volts from the EME power supply as soon as the
EME package was turned on. The solar aspect sensor system required 0.2 watt.
1982008279-139

PRECEDING PAGE BLANK NOT FILMED
CHAPTER 6
SYNOPSIS OF ANOMALIES AND FAILURES OF EME
The Environmental Measurements Experiments (EME) on board the ATS-6 spacecraft consisted ofeight experiments, most of which experienced problems or anomalies in the synchronous orbitalenvironment. A summary of the failures and anomalies that occurred during the operation of theEME experiments are briefly described below.
SOLAR COSMIC RAY EXPERIMENT (McDONNELL-DOUGLAS AIRCRAFT CORPORATION)
The operation of the electron spectrometer and the p_'ticle telescope in the measurement of cosmicrays and trapped electrons and protons performed very well during all phases of the experiment. Noproblems were experienced during the performance of this experiment.
LOW ENERGY PROTON-ELECTRON EXPERIMENT (UNIVERSITY OF NEW HAMPSHIRE)
The purpose of this experiment was to continuously monitor the spectra and pitch angle distribu-tions of electrons and protons from 0 to 22 kiloelectron volts (keV).
A few hours after activation of the University of New Hampshire (UNH) experiment, a serious prob-lem was encountered where an unknown mode of interference (probably a high-voltage arc) occurredbetween this experiment and the EME package. Because of this, the UNH experiment was deacti-vated until the third year in orbit. This interference signal caused a permanent closure (short) in oneor more performance parameter multiplexer (MOSFET) switches in the EME telemetry generator.Interpretation of the EME performance parameter word 58 for other experiments was not possiblefollowing this incident.
This interference also produced abnomlalities on the EME clock signal that caused the clock to"jump" or become reset. The EME clock was also reset by an interference signal from some othersource in the spacecraft when the UNH experiment was not operating.
LOW ENERGY PROTON EXPERIMENT (NATIONAL AERONAUTICS AND SPACE ADMINIS-TRATION/GODDARD SPACE FLIGHT CENTER/NATIONAL OCEANIC AND ATMOSPHERICADMINISTRATION
The objective of this experiment was the investigation of protons that were considered to produce
storm-tinie extraterrestrial ring current in the geomagnetic storms. This experiment performedexceptionally well but two operational anomalies were experienced that affected the quality ofthe data transmitted.
121
1982008279-140

122 ATS-6FINALENGINEERINGPERFORMANCEREPORT
One anomaly was caused by the failure of the Mosfet switches mentioned in the University of NewHampshire Low Energy Proton-Electron Experiment. This failure caused a direct-current voltage tocontinuously occur on one EME data channel in which the housekeeping and heavy ion data weresampled for this experiment. All of the housekeeping parameters in this case were considered use-less. The heavy ion data, however, was reconstructed and completely recovered by introducing adirect-current offset voltage to the channel output signal.
The second operation anomaly resulted from the temperature of the EME platform, containing the
experiment's detectors, becoming 10°C higher than the design goal. This high temperature increasedthe thermal noise of the solid state detector_ and essentially affected only the lowest three channels
of the C telescope.
ELECTRON-PROTON SPECTROMETER (UNIVERSITY OF MINNESOTA)
An electron-proton spectrometer, containing two detector assemblies (one stationary and onescanning), was used in this experiment to investigate the origin and dynamics of electrons and pro-
tons in the outer radiation zone at the synchronous orbit altitude. The h_;her than anticipated tem-peratures of the EME package caused serious problems, one of which was the increase in the thermal
noise background level in the detectors. In the proton detector the noise level became unacceptable,
and nine months after the launch of ATS-6, the proton detector in the fixed spectrometer failed.
This failure became a serious loss and left only the scan detectors to provide data for this experi-ment. The proton detector in the scan system failed at 12 months. The mechanical drive for the
scanning system failed January 30, 1976, after more than 19 months of continuous trouble-free
operation.
The failure of the Mosfet switches mentioned in the previous experiments also affected this experi-
ment by not providing the temperature data from all of the detectors.
AURORAL PARTICLES EXPERIMENT (UNIVERSITY OF CALIFORNIA AT SAN DIEGO)
The objective of this experiment was to determine the magnetospheric processes that contained and
accelerated cbarged particles near the Earth, particularly those particles that are deposited into theupper atmosphere, and produce auroras. During the operation of this experiment a number of
failures and anomalies were experienced and consisted of the following:
• On July 29, 1974 one of the two deflection power supplies, for the east-west rotatingheads, failed. Failure was caused by the prolonged dwelling at 62 keV and to inadequatecooling. The fixed detector also failed at this time.
• The east-west detector failed to rotate on September 6, 1974.
• Starting on September 19, 1974 the north-south detector would periodically fail to rotate.
• Near the end of !974, the east-we_t electron channel began to have periods of large errorscaused by cross-talk from the north-south electron channel.
1982008279-141

SYNOPSISOFANOMALIESANDFAILURESOF EME 123
• The efficiencies of both the north-south ion and electron detectors degraded 10 to 20 per-cent from their original values beginning on May 21, 1975. Under high bias, both detectors
returned to their original efficiency on September 23, 1975.
• During the month of February 1976, the north-south detectors temporarily failed to rotateat the two angles of 180 degrees and 198 degrees.
• The efficiency of the north-south detector began degrading in September 1976 in spite ofoperating in the high bias mode.
• Complete failure of the instrnment occurred on May 15, 1977.
FLUXGATE MAGNETOMETER (UNIVERSITY OF CALIFORNIA AT LOS ANGELES)
The l:rimary objective of this _xperiment was to monitor continuously the Earth's magnetic field atsynchronous orbit altitude with a fluxgate magnetometer to provide data for models of the time-varying configuration of the magnetosphere.
Three serious problems occurred during the operation of the magnetometer. One of the problemswas the occurrence of an interfering noise in the sensor whose ma_itude was three times that in-herent in the sensor.
The second problem seriously delayed the processing of the magnetometer data and was _aused byanomalies in the associated attitude/orbit determination. The magnetometer ¢_atacontained periodicfluctuations that produced oscillations in the transformed data and affected the study of harmonicwaves so that it became almost impossible to analyze. This problem was later solved when the cor-rected attitude/orbit data became available.
On September 1975 the operation of the magnetometer sensor In the Y-axis failed when the offsetfield system would not stop hunting for the null.
SOLAR CELL RADIATION DAMAGE EXPERIMENT (HUGHES AIRCRAFT COMPANY)
The purpose of the solar cell experiment was to determine the degradation in performance of dif-ferent types of solar cells when exposed to the Sun's radiation in the synchronous orbit altitudeenvironment.
A failure of the current channel in the signal processing unit (SPU) No. 2 occurred prior to theactivation of the experiment in flight and caused the loss of data from half of the solar cells andfrom three thermistors. One thermistor associated with the SPU No. I also failed, leaving only onethermistor on the flexible solar test panel to measure the panel temperature.
Because of the thermistor failure, the temperature of the signal panel was determined from the opencircuit voltages of the associated solar cells.
1982008279-142

v!
124 ATS-6 FINAL ENGINEERING PERFORMANCE REPORT i
ENERGETIC PARTICLE SPECTROMETER EXPERIMENT (AEROSPACECORPORATION)
An energetic electron-proton spectrometer was used in this experiment to detect energetic electronsin four energy channels, energetic protons in five channels, and energetic alpha particles in threechannels.
Several anomalies occured during the operation of this experiment, none of which were consideredvery serious.
Whenever the experimental unit reached a temperature below -IO°C, an open circuit developed inone of the data channels. A large thermal gradient, occurring at the detector, was suspected ofcausing this open circuit. However, this malfunction resulted in only a minor loss of experimental
data. Apparently the ground tests performed on this experiment at temperatures well below -10°Cdid not properly simulate the large thermal gradients that were encountered in space.
Under certain operational conditions, intermittent noise was observed in one detector that resultedm noisy data. This effect was largely caused by the high temperatures of the detector that reachedvalues in excess of those expected.
Another problem that occurred was the loss of housekeeping data when the UNH experiment mal-functioned a few hours after launch of ATS-6. This malfunction produced interference with theEME data system and affected most of the experiments. The loss of this data considerably compli-cated the analysis of this experiment's data.
1982008279-143

?
CHAPTER 7
IN.r_'IALRESULTS FROM THE ENVIRONMENTALMEASUREMENTS EXPERIMENTS
INTRODUCTION
This chapter presents an outline of the results obtained by the instruments during the initial opera-tional period of the EME at 94°W longitude and a bibliography of associated published reports. Thesignificant areas of investigation discussed are as follows:*
• Specific characteristics of the main geomagnetic field 10 degrees above the magnetic !
equator at a geostationary distance
• Magnetic field and particle signatures of field-aligned currents
• Plasmasphere composition and temperature
• Periodic variations in the magnetic field and particles covering variations with periods f.mma few seconds to a few weeks
• "Typical" particle-eneigy spectra role of heavy ions, and role of spacecraft charging in thegeosynchronous environment.
INCLINATION OF THE MAGNETIC FIELD AT ATS-6
The University of Calilbnua at Los Angeles (UCLA) magnetometer on ATS-6 consisted of anorthogonal array of three fiuxgate sensors aligned with the body axes of the spacecraft. The instru-ment measured each component of the magnetic field to an accuracy of l/16 gamma with a dynamic
range of ±512 gamma. The root mean square (rms) noise in the bandwidth from 10"a to l hertz (Hz)was 85 meters. The direct current (d.c.) field of the spacecraft was small; the components perpen-
dicular to the Earth pointing axis were less than 2 gamma. Particle measurements indicated that thethird component of the spacecraft field was also small.
For geophysical studies, the magnetometer data were transformed from the local body system to a
geophysical coordinate system, dipole VDH. For the first year, ATS-6 was located on the geographic
equator approximately l0 degrees above the magnetic equator. Field lines through the satellitepassed through the magnetic equator at distances (L values) greater than 6.6 Earth radii. The It-axis of the dipole coordinate system was antiparallel to the Earth's dipole axis. The D-axis wasorthogonal to a plane defined by H and a radius vector through the spacecraft', V completed the
eRefer to blibi_aphy at the end of this chapter for details of the remit| that follow.
125
1982008279-144

I
126 ATS.6FINALENGINEERINGPERFORMANCEREPORT "
right-hand system so that V X D = H; V pointed away from the Earth parallel to the magneticequator. At times, it was convenient to display the magnetic field data in spherical polar coor-,8
dinates rather than the V, D, H system. In this case, BTOTAL was the field magnitude, 0 the polarangle with respect to the dipole H-axis, and ¢ the azimuthal angle measured in the VD plane positiveeastward from V towards D.
Spherical polar coordinates were useful in illustrating a surprising feature of the magnetic field
where ATS-6 was located. It was found that the mean field at local noon was tilted approximately30 degrees to the dipole axis and had a magnitude of about 135 gamma.
In a dipole field, these values would be 29 degrees and l 12.6 gamma. Early models of the magnetic
field predicted that values should be 21 degrees and 147 gamma. These predictions were based on
the physical notion that the solar wind compressed the day-side magnetosphere, increasing the fieldstrength at synchronous orbit, and simultaneously flattening the field lines against the dipole axis.The observations, however, clearly showed that the tilt of the field was larger and the field strength,
smaller, than predicted by such a model.
' The differences between the ATS-O observations and these early models can be explained if oneassumes that there is significant plasma within the magnetosphere. Off the magnetic equator, such
plasma would decrease tile field strength and tilt the field away from the dipole axis. Since early
models of the magnetopausc currents neglected internal plasma, it is not surprising that these pre-dictions were in error.
Another st_rprising characteristic of the mean field at ATS-6 was the obvious seasonal dependence
of tilt anti magnitude. The winter tilt at midnight was 10 degrees less than the summer tilt, andfield magnitude was 35 gamma less. These observations suggest that the surface of magnetic sym-
metry at synchronous orbit does not lie in the magnetic equator at the solstices. However, because
of a 1.54 degree tilt of the ATS-O orbit relative to the geographic equator, this cannot be unambig-
uously demonstrated.
MagneticEffectsof Sub_orm-Auociated Field-AlignedCurrents
"l'ransient azimuth magnetic field variations during substorms had been reported using data from
ATS-I at synchronous orbit. However, since ATS-! is located very near the magnetic equator, it
was difficult to explain why such magnetic perturbations should be observed. As is easily seen by
symmetry arguments, aximuthal effects of field-aligned currents connected to both northern andsot, thern auroral zones should cancel at the magnetic equator. Where ATS.6 was located, theazimuthal effects of field-aligned currents should not have cancelled.
Examination of daily magnetograms fro,n ATS-6 unambiguously showed the effects of substorm-
associated field-aligned currents. These effects are identical to those seen on the ground in thenorthern hemisphere at mid- and subauroral latitudes. These observations were entirely consistent
with accepted models ol substonns and field-aligned currents.
1982008279-145

r
[!
!
I!INITIALRESULTSFROMTHEENVIRONMENTALMEASUREMENTSEXPERIMENTS 127 IE
PARTICLE MEASUREMENTS ASSOCIATED WITH FIELD-ALIGNED CURRENTS
In the equatorial magnetosphere, ATS-6 was the first to observe intense beams of l- to 10-kilo- [electron volts (keV) electrons traveling parallel to the local magnetic field. The intense beams tseemed to occur only within the first 10 minutes after the onset of a hot plasma injection associa- !
ted with a magnetic substorm. I
Observations showed that a negative spike in the eastward component was usually coincident withthe occurrer,ce of the parallel fluxes of electrons, indicating that the fluxes are contributing to cur-rents flowing along the magnetic field. Although the origin and density of the parallel electronsare unknown, consideration of the total energy and number of particles transported guarantees that
they must play an important role in key magnetospheric processes. In particular, these particlesmay be associated with the initial brightening of auroral arcs.
The UnexpectedExistenceof a WarmPlasmain the Regionof the PlesmuphericBulge
ATS-6 observed enhancements in low-energy (warm) plasma (2 to 30 eV) occurring predominantlyin the late afternoon and dusk region of the equatorial magnetosphere. These observations wereparticularly significant because of their possible association with the plasmasphere. This class oflow-energy events often shows field-aligned anisotropies, but isotropic distributions, as well as dis-tributions indicative of flows perpendicular to the magnetic field, were also observed.
CorrelatedPeriodicVariationsof Particlesendthe MagneticField
An unusually large number of correlated wave and particle oscillations were observed by the ATS-6EME instruments while the satellite was located above 94°W longitude. The number of eventsappeared to be matched only by the variety in the wave and particle characteristics. This surprisingvariety of observations may have been a function of the satellite's location I0 degrees off the mag-
netic equator, or the result of an extremely low noise magnetometer and well designed and func-tioning particle instruments, or a combination of both.
Waveand ParticleOlmrvations of Pc I Oscillations I
ATS-6, for the first time, observed Pc 1 oscillations simultaneously in magnetic and particle data inthe equatorial magnetosphere.
The Pc I oscillations were observed predominantly within the dusk region low-energy enhancementsdiscussed under the heading "The Unexpected Existence of a Warm Plasma in the Region of thePlasmaspheric Bulge," with periods anywhere from 1 to 10 s (the proton gyro period in this region
is approximately 0.6 s). Also, the particle perturbations were observed predominantly within thelow-energy detector channels (50 eV), because the flow velocity associated with waves (5 to 50 kin/s)represented a small perturbation on the particle velocities at higher energies.
1982008279-146

128 ATS-6FINALENGINEERINGPERFORMANCEREPORT
Particle and Field Measurementsof StandingULF Waves
Oscillating plasma flows and associated ultra-low frequency magnetic oscillations were observedwith the University of California at San Diego (UCSD) particle experiment and tile UCLA magne-tometer experiment. On June 27, 1974, a Pc 4 event occurred that had a peak magnetic amplitude
of 10 gamma and a period of 150 seconds. The transverse magnetic wave was linearly polarized inthe east-west (azimuthal) direction. During a large seg_ent of the event, the three UCSD ion detec-
tors along the east-west axis provided two linear (polar) views in the _imuthal direction and thethird viewing perpendicular to this axis was in the radial direction. From the response of these three
detectors, it was possible to construct the particle-distribution function in this plane and to deter-mine its first moment, the flow velocity (v). In this plane, the flow velocity was also linearly polar-izcd, primarily in the east-west direction, and had a peak amplitude of 140 km/s. By constructingthe vector cross product of v with the static mag,_etic field, it was possible to infer the electric field,
E,. Having both the E and B components of the wave, Poynting's vector, Sk, was constructed todetermine the propagation characteristics of the wave. Note that the flow component parallel to Bwas not necessary for this calculation. The magnetic and electric components of the wave were out
of phase by 90 degrees, and the value of Sk oscillated around a value of zero. The relative phase of
the wave components and the behavior of Sk were consistent with an interpretation of the event asthe occurrence of the fundamental mode of a standing hydromagnetic wave on the ATS-6 field line:
that is, there was no net flow energy.
RingCurrent Proton ULF Waves
Seventy-one cases of ultra-low frequency oscillations of protonflux intensities were detected by theNatio,al Oceanic and Atmosphcri,: Administration (NOAA) instruments from Jtllle I I to Septem-ber 16. 1974. The oscillation pcriod_ ranged from 40 second_ to 6 minutes that corresponded to
Pc 4 and Pc 5 in magnetic pulsation terminology. Most of the waves wcrc observed in the dusk
region of the magnetosphere.
The low frequency Pc 4 wave typically had a maximum amplitude of approximately 10, primarily
m the v-_,,.uponcnt. Spectral analysis showed that the signal was linearly polarized, radially tl_wartl
m the meridian plane. Since the ambient field was tilted inward, the wave had a substantml COln-
prcssional component as evident in the oscillations el lhe field magnitude, i'xamination of the v-
component data suggested that the Pc 4 wave was modulating the amplitude of the Pc wave. Wcnote, however, that the Pc I amplitude maxima occurred at minima of the total ficltl: that is, dutilig
the rarefractlon phase of each cycle. It seems likc',_, thcretbrc, that the Pc 4 wave wa, 1101 _timula-
tmg Pc I wave growth by compression of the proton pitcil-anglc distribution and ion-c)clotron
instability. Instead, it was more likely that unstable plasma was being swept back and forth across
the spacecraft by the electric field associated with the Pc 4 wave.
EnergeticElectronWavesat SynchronouIOrbit
Approximately 25 cases of well defined low fiequency oscillations o, electron fhtxes were obser-
ved by the McDo,ncll-l)ouglas Astronautics Company (MDAC) electron spectrometer durHIg
1982008279-147

t
INITIALRESULTSFROMTHEENVIRONMENTALMEASUREMENTSEXPERIMENTS 129
the first 3 months of observation. The experiment was capable of 0.25-s time resolution. However,the routine survey plots used in this preliminary data analysis contained 30-s averages, and thusoscillations having periods shorter than approximately 3 minutes could not be observed. The oscil-lations observed showed no local time preference, Two types of oscillations were observed: Thefirst was characterized by phase differences between the various energy channels indicating energy-dependent dispersion of the electron waves; the second type of oscillation observed was character-ized by complete phase correlation between all of the electron channels. There was no generaliza-tion that could be made between oscillation amplitudes and energy. There existed as many caseshaving a maximum oscillation at low energy (50 to 100 keV), as ones having a maximum at high
energy (400 to 1000 keV). The UCLA magnetometer data, plotted in the VDH dipole coordinate ".system, were characterized by high frequency Pc 1 waves modulated by the longer period Pc 4 i"waves. The electron oscillations were 180 degrees out of phase with the magnetometer oscillations.
Lerp-Scale TrappingBoundary Waves
Large rapid decreases in the energetic proton flux followed by even more rapid increases werecharacteristic of disturbed periods on ATS-6. To unambiguously interpret such observations madeon a moving spacecraft, it is necessary to b' 1hie to separate spatial from temporal variations. Oneapproach to this problem is to use pro' _,x gradient information, since if a flux change is accom-panied by a _:hangein the gradient, t,,c motion of a system over the spacecraft may be inferred. The
enciget,¢ pio_on experiments on ATS-6 were uniquely suited to determine the proton flux gradient
The University of Minnesota experiment contained two nearly identical detector assemblies, which,when directed oppositely, could examine the flux of protons orbiting about gyrocenters displacedby up to two Larmor radii from one another. Thus, the spatial flux gradient along a line betweenthe gyrocenter._ ceuld be computed. The NOAA experiment contained three detector systemsdirected so that the gyrocenters ol protons entering these detectors laid on a line orthogonal to theline through the gyrocenters of p_oloas entering the Minnesota experiment. As the instrumentsresponded to ov..,iapping energy ranges, it was possible to determine the flux gradients at a givenenergy using data from these two experiments.
Modulation of EnergeticE_,'_rons in Associationwith the SectorBoundariesof the Interplm_m.ryMagneticField
The Aerospace Corporation energetic particle spectrometer aboard ATS-f_ observed a periodicity
in the energetic electron fluxes (Eo >1 MeV) associated with the passage of sector boundaries of theinterplanetary magnetic field (IMF). The changes in the electron flux associated with each boundarypassage were the major variability in the electron fluxes during conditions of low solar activity.
The ATS-6 electron fluxes (hourb averages) exhibited a very pronounced periodicity that was very
clearly associated with the passage of interplanetary magnetic-field sector boundaries. A limited setof data from ATS-I and ATS-5 was available for the same time period. Such comparisons indicatedthat ATS-I, ATS-5, and ATS-6 all observed the modulation described; that is, the modulation was
one that affected the entire magnetosphere.
1982008279-148

130 ATS-6FINALENGINEERINGPERFORMANCEREPORT
A similar study was conducted using ATS-I data from the Aerospace Corporation spectrometertaken in 1967 and 1968, the period near solar maximum. In that study, it was not possible to estab-lish that any close correlation existed between changes in the electron fluxes observed at synch-ronous altitude and changes in the direction of the interplanetary field.
Sector boundary passages did give rise to major excursions in the flux levels of energetic electrons;
however, equally large excursions also occurred when there were no IMF boundaries in the vicinityof the Earth.
THE EXISTENCE OF DOMINANT FLUXES OF ENERGETIC HEAVY IONS
The National Oceanic and Atmospheric Administration heavy-ion instrument provided the first
definitive measurements of energetic heavy ions present in the vicinity of the geostationary orbit.
The detector system was a two-element, solid-state detector telescope that incorporated an extremely
thin (3.8-micrometer) front element to accomplish ion nuclear charge (Z) identification by a dE/dx
and E technique, in a single reasohably isolated injection event that occurred at approximately
0030 Universal Time (UT) on June 18, 1974, the presence of ions with Z;_6 and F._4.0 MeV in thevicinity of the geostationary orbit was established. By noting that similar detectors, carried on
board the Interplanetary Monitoring Platform (IMP) H and J satellites, were responding at back-
ground levels in the interplanetary medium for 4 days surrounding tl_is event, it was concluded
that these ions were energized by the magnetosphere during these substorm-type events.
TYPICAL PARTICLE SPECTRA
I* i_ difztcult to locate particle-energy spectra measured instantaneously in the magnetosphere that
cover more than a limited energy range or that display more than one particle species in the litera-
ture. The EME particle instruments were capable of performing measurements on both the electron
and ion differential inte,_sities over an energy range from less than I electron volt (eV) to greaterthan I00 million electron volts.
SPACECRAFT CHARGING EFFECTS
Spacecraft in tile vicinity of the geostationary orbit have been shown to charge to various potentialsthat depend on conditi_'ns in the local plasma environment of the satellite. A more detailed pictureof the spacecraft charging effects emerged from the ATS-6 data than was available previously. Apeak in the counting rate of the low-energy (4 to 10 eV) electron detectors of the UCSD experi-
ment was shown to be due to photoelectrons and/or secondary electrons that were emitted bythe spacecraft and were returning to it. This implied the presence of a potential barrier about thespacecraft; however, the barrier, which kept out low-energy plasma electrons as well, was too largeto be explained in terms of a simple space-charge effect, it now appears that the satellite was dif-
ferentially charged, with parts of the spacecraft, such as the solar arrays, at a more negative potentialthan the main spacecraft body.
I
1982008279-149

INITIALRESULTSFROMTHEENVIRONMENTALMEASUREMENTSEXPERIMENT 131
The electric-field pattern that resulted was responsible for the potential barrier efi_ t. ATS-6 hadbeen observed to charge to a potential of-2200 volts during sunlit conditions and to a potentialof -19,000 volts during eclipse periods.
SUMMARY
These initial results from ATS-6 demonstrated the existence of two new particle populations, eventhough after nearly two decades of magnetospheric exploration, many researchers feel that all the
significant particle populations of the magnetosphere have been identified and their morphologicalfeatures well documented.
The unexpected existence of a warm plasma in the vicinity of the plasmaspheric bulge and the exis-tence of dominant fluxes of energetic ions heavier than protons produced during substorms mustnow be incorporated into currently held concepts of the magnetosphere.
The initial results ef the EME instruments on ATS-6 have provided significant insight into the roleof currents in the magnetosphere and the probable carriersof these currents, particularly in the caseof field-aligped substorm-associated currents whose particle signature has been observed for the firsttime near the equatorial plane.
The large variety of wave and particle interactio,ls observed on A'FS-6 will prove invaluable in delin-eating many of the specific acceleration and transport mechanisms active on the hot plasma dis-
tribution in the region of the geosynchronous magnetosphere. The fact that such a large variety ofinteractions has been observed indicates that there are probably many mechanisms at work simul-taneously in any one substorm or combination of substorm events.
The bibliography presented in this document mark the beginning of what appears to have been a
very successful experiment program. As further studies are undertaken involving correlations betweenthe various EME instruments themselves, with other satellites, and with ground-based programs,even more significant results should be forthcoming.
EME BIBLIOGRAPHY
1964 Mead, G. D., "Deformation of the Geomagnetic Field by t"e Solar Wind," J. Geophys.Res. 69, 1964, pp. 1181-1194
1969 Coleman, P. J., Jr., and R. L. McPherron, "Fluctuations in the Distant G,omagnetic FieldDuring Substorms: ATS-i ," in Particles and Fields in the Magnetosphere, B. M. McCormac,
ed., Advanced Study Institute, Earth's Particles and Fields, University of California, SantaBarbara, ! 969, pp. 17 !- 194.
Cummings, W. D., et. al., "Standing AIfven Waves ,n the Magnetosphere," J. GeophysRes., 74(3), 1969, pp. 778-793.
1972 DeForest, S. E., "Spacecraft Charging at Synchronous Orbit," J. Geophys. Res., 77(4),1972, pp. 65 !-65q.
1982008279-150
l
132 ATS-6FINALENGINEERINGPERFORMANCEREPORT _•
I,1973 McPherron, R. L., et. al., "Satellite Studies of Magnetospheric Substorms on August 15, !:
1968. Part 9. Phenomenological Model for Substorms," J. Geophys. Res., 78(16), 1973,pp. 3131-3149.
1974 Coleman, P. J., Jr., et. aL "A System for Simultaneous Measurements of Magnetic Fieldsat the Earth's Surface and .,, Space," Institute of Geophysics, Univer_;ty of California, LosAngeles, Californi_ 90025, November 1974.
Oison, W. P., and K. A. Pfitzer, "A Quantitative Model of the Magnetospheric MagneticField," J. Geophys. Res., 79, 1974, pp. 3739-3748.
Pfitzer, K. A., "The Expected Quiet Time Magnetic Field at ATS-6," McDonnell-DouglasCorp. Space Sciences Dept., August 1974.
Russell, C. T., "The Solar Wind and Magnetospheric Dynamics," in Correlated Interplane-
tary and Magnetosphertc Observations, D. E. Page, ed., D. Reidel Publishing Co., Dordrecht, "_Holland, 1974, pp. 3-47.
1975 Anderson, H. R., and R. R. Vondrak, "Observations of Birkeland Currents at Auroral
Latitudes," Rev. Geophys. and Space Phys., i3( I ), 1975, pp. 243-262.
McIIwain, C. E., "Auroral Electron Beams Near the Magnetic Equator," in Nobel Sympos.ium 30th: Physics of the Hot Plasma of the Magnetosphere, B. Hultqvist and L. Stenflo,
eds., Plenum Press, N.Y., 1975, pp. 91-112. _-
McPherron, R. L., et. al., "ATS-6 UCLA Fluxgare Magnetometer," IEEb: Trans. Aerospace
and Electronic Systems, AES-I i(6), 1975, pp. I I iO-I 117.
Sugiura, M., "Identification of the Polar Cap Boundary and the Auroral Belt in the High-Altitude Magnetosphere: A Model for Field-Aligned Currents," J. Geophys. Res., 80(16),1975, pp. 2057-2068.
Svalgaard, L., An Atlas of Interplanetary Sector Structure 19_ 7-1974, Stanford UniversityInstitute for Plasma Research Report 629, June 1975.
Walker, R. J., et. al., "Substorm Associated Particle Boundary Motion in SynchronousOrbit," (Abstract). EOS: Transactions of the American Geophysical Union, $6(I), !_)75,
p. 4..,..
1976 Fritz, T. A., and B. Wilken, "Substorm Generated Fluxesof Heavy Ionsat the GeostationaryOrbit," in Magnetosphertc Particles and Fiel.ls, B. M. McCormac, ed., D. Reidei PublishingCo., Dordrecht, Holland, 1976, pp. 171-179.
1982008279-151

INITIALRESULTSFROMTHEENVIRONMENTALMEASUREMENTSEXPERIMENT 133
Su, S.-Y., et. ai., "Repeated Sharp Flux Dropouts Observed at 6.6 RE During a Geomag-netic Storm," J. Geophys. Res., 81, 1976, pp. 245-252.
Whipple, E. C,, Jr., "Observation of Photoelectrons and Secondary Electrons Reflected
from a Potential Barrier in the Vicinity of Ars-6," J. Geophys. Res., 81(4), 1976, pp. 715-720.
Whipple, E. C., Jr., "Theory of the Spherically Symmetric Photoelectron Sheath: A Thick
Sheath Approximation and Comparison with the ATS-6 Observation of a Potential Barrier,"
J. Geophys. Res., 81(4), 1976, pp, 601-607.
1977 Fritz, T. A., et. al., "Significant Initial Results from the Environmental MeasurementsExperiment on ATS-6," NASA Technical Paper, ! I01, December 1977.
Su, S.-Y., et. al., "On the Propagation Direction of Rmg-Currem Proton ULI Waves
Observed by ATS-6 at 6.t_ Rr ""J. (;eophys. Res., 82, 1977, pp. 1859-1868.
1978 Spjeldvik, W. N., and T. A. Fritz, "Energetic Ionized Helium in the Quiet Time Radiation
Belts: Theory and Comparison with Observations," J. Geophys. Res., g3, 1978, p. 654.
Spjeldvik, W. N., and T. A. Fritz, "Composition of Hot Plasmas in the Inner Magneto-sphere: Observations and Theoretical Analysis of Protons, ttelium Ions, and OxygenIons," Space Research |'111, M. J. Rycroft and A. C. Strickland, eds., Oxford, I!ngland,
Pergamon Press, 1978, pp. 3 ! 7-320.
Wilken, B., et. al., "Substonn-assoc_ated Injections of Energetic Ions Observed by (;l'OS-Ianti ATS-e, In and Near Synchronous Altitude," Advances m Magnetospherie Physics with
GEOS-i and ISEE, K. Knott, A. Durney, and K. Ogilvie, ed., D. Reidel Publishing ('o..
Dordrecht, tlolland, 1979, pp. 327-337. (Also published in Space Scwnce Rtvit, w, 22,1978, p. ¢_47.)
1079 "ATS-6 Handbook." June 1979, Universit_ of California, San l)icgo, La Jolla, ('alifornta,
Department of Physics, Space Physics Group.
I'auhkas, (,. A., and J, B. Blake. "'Final Report. Reduction and Am_tysis of A I'S-t_ Data(I November 1078-30 June 1979)," Aerospace Report No. ATR.T9 176421-.3prepared forNASA Goddard Space Flight ('enter, Space Sciences Laboratory, Labotator) Operations,
The Aerospace Corporation, I-I Segundo, California, 90245, I Jtine 1979.
Singer, H. J., et. al., "The Spatial Structure of PC3, 4, and 5 Pui_tions Near the Magne-
tosphenc Equator." Geoph)'s. Re._.Lts.. 6. 1079, p. 889.
Su, S.-Y.. et. al., "On the Fnergy-l_pendent Modulation of the ULF Ion Flux Oscillahons
Observed at Small Pitch Anises, J. Geophvs. Res., g4. It_79, p. eJ,_.0.
1982008279-152

134 ATS-6FINALENGINEERINGPERFORMANCEREPORF
Wilken, B., et. al., "Multiple Satellite Observations of Large Scale Trapping BoundaryMotion, In: Proceeding,_ o/Magnetosphertc Boundary Layers," Conference, Alpbach,Austria l 1-15 June 1979,ESA SP-143, 161, 1979.
1980 Konradi, A., et. al., "Average Properties of Energetic Heavy Ions at the Geostationary
Orbit," J. Geophys. Res., 85, 1980, p. 5149.
Su, S,-Y., et al., "Observations of ULF Oscillations in the Ion Fluxes at Small Pitch Angleswith ATS-6," J. Geophys. Res., 85, 1980, p. 515.
1982008279-153

J
CHAPTER 8 •
U.S./U.S.S.R. MAGNETOMETER EXPERIMENT -:
PURPOSE
The U.S./U.S.S.R. Magnetometer Experiment (Mace) was conducted when ATS-6 was located above
35°E longitude and was designed to measure geomagnetic activity to a high order of temporal :,accuracy, e.g.. micropulsations, substorms, and stomls, using a three dimensional array of magne-tometers consisting of tile University of California at Los Angeles (UCLA) tuagnctonleter aboard
ATS-6 and a network of ground-based magnetonleters called data collection platfonus (DCP).
The experiment was designed to handle up to five DCP's. As actually conducted, three DCP's were
deployed by the U.S.S.R. near tile 35°E longitude geographic meridian at Archangel, Minsk, andOdessa.
The Principal Investigator was Dr. P. J, Coleman, Jr., Institute of t;cophysics aild Planetary Physics,University of -'alifornia, Los Angeles, California. The Russian team was headed by Dr. A. Zaitsev,Institute of Terrestrial Magnetism, lonospherc and Radio Wave Propagation OZMIRAN); U.S.S.R.Academy of Sciences; Moscow, U.S.S.R.
BACKGROUND
In the field of magnetospheric physics, tile importance of simultaneous measurements from observa-
tory networks on tile Earth's surface and spacecraft in Ilear-I:arth space has been well established, itis difficult to obtain useful sets of such nwasurements bcc,msc of the timing uncertainties, tilemultiphcity of recording techniques, and tile differences in the measurillg iw,strumcnts. I'crhaps themost serious of these difficulties is that many of tlw measurements arc recorded on fihn or charts.
Thus, considerable effort is required to translorm the records into forms that arc suitable for com-puterized methods of analysis and display.
The Mage enabled simultaneous teconting of magncttc data gathered by the three IX'P's and relayedby ATS-6, and the ATS_ magneton,eter. Subsequent computer processing introduced adjustments
for radio time of flight and ATS-6 attitude, and merged the IX'P and th,' ATS-6 Enviroxlmcntal
Measurements Experiments (EME) data Ibr u_c by tier.A, IZMIRAN, and other interested organiza-tions.
OVERALL SYSTEM DESCRIPTION
Figure 8-1 shows tile radio frcquency links for Magc.
135
1982008279-154

136 ATS-6 FINAL ENGINEERING PERFORMANCE REPORT
|_z ,
<
i! "3"
.9
_ _ _
o/
1982008279-155

E
U.S./U.S.S.R.MAGNETOMETEREXPERIMENT 137
The very high frequency (vhf) downlink at 137.11 megahertz (MHz), containing the ATS-6 magneto-meter data in the EME bit stream, served three purposes. It provided the ATS-6 magnetometer data
for permanent recording at the Madrid Hybrid Terminal, it provided synchronizing and timing sig-nals for the U.S.S.R. DCP's and it relayed the DCP on-off commands initiated by the hybrid station
that were transmitted to the spacecraft over the nonnal EME command link at 154.20 MHz.
Each DCP transmitted its magnetometer and other data at 300 bits per second (bps) to the space-
craft using on-off keying (OOK _ by vhf on its individual frequency assignment (Minsk, 150.687MHz; Odessa, 150.719 MHz; and Archangel, 150.740 MHz). The spacecraft was operated in the vhf
X C-band PLACE* (remodulation) mode, so the C-band downlink carrier was phase modulated bythree subcarriers (687 kHz, 719 kHz and 740 kHz) each of which was keyed by the respective DCPbit stream.
At the hybrid terminal, the C-band downlink was received and demodulated to recover the datafrom the three DCP's which was recorded on magnetic tape. The DCP data was processed at God-
dard Space Flight Center (GSFC), sent to UCLA for ATS-6 attitude processing, and then returned
to GSFC where it was merged with the ATS-6 EME magnetometer data to produce the final tapethat was distributed to UCLA and the U.S.S.R.
SYSTEM HARDWARE
DataCollectionPlatform
A data collection platform was located at each remote observatory in the system. Each DCP encoded
the measurements of interest and telemetered the data to ATS-6. Figure 8-2 is a block diagram of
the DCP. The DCP included separate fixed transmit and receive crossed-yagi vhf antennas of approx-imately 10 decibels gain pointed at the geostationary ATS-6 and a 200-watt transmitter (amplitude
modulation). Circular polarization was employed to minimize the etfect of Faraday rotation oil
signal strength.
When the hybrid station and the spacecraft were available to acquire data from DCP's, tile "DCP
transmitter on" command was sent from the control station to the spacecraft over the EME com-mand link and relayed by the spacecraft to the DCP by the EME telemetry link. The EME data weretelemetered from the spacecraft by pulse code modulation (pcm) at 1800 bps with the format as
shown in Figure 8-3. The EME telemetry was decoded by a bit, word, and frame synchronizer in the
DCP. The decoded signal was then used to synchronize the analog multiplexer and the analog-to-
digital converter at one-s_xth the incoming rate or 300 bps. Synchronization of the DCP digital sys-tem by the EME telemetry signal resulted in one-to-one correspondence between the digital infor- "
mation from each of the remote stations and that from the EME on board ATS-6. The synchroniza-
tion was performed to simplify the formatting of the DCP data at the receiving and recording
*Potition Location tad Alrcrtft Communiottton. Experiment
1982008279-156

138 ATS-6 FINAL ENGINEERING PERFORMANCE REPORT
1982008279-157

U.S./U.S.S.R.MAGNETOMETEREXPERIMENT 139
I
1982008279-158

140 ATS-6FINALENGINEERINGPERFORMANCEREPORT
stations. Later corrections for the differences in radio path links from each DCP to the spacecraft,
enabled the data from all stations to be timed to an accuracy of a few milliseconds.
The analog multiplexer sampled X-, Y-, and Z-axis magnetic data and sent it to the analog-to-digital }converter where it was converted to digital information. The digital data were then used to key a
vhf transmitter on and off at 300 bps.
The transmitted DCP bit stream format is shown in Figure 8-4. -:
Presence of the "DCP transmitter on" command word (70552) enabled the transmitter; absence of
tile 70552 command word for a period of 5 minutes shut the transmitter off.
SpacecraftConfiguration
ATS-6 was configured in the vhf X C-band PLACE (remodulation) mode using the Earth-coverage
horn to transmit at C-band to the hybrid station. In the PLACE mode, the uplink vhf signals at150.687 MHz (Minsk), 150.719 MHz (Odessa) and 150.740 MHz (Archangel) were downconverted
to baseband to 687 kHz, 719 kHz, and 740 kHz, respectively. These signals phase-modulated the
downlink C-band carrier. The spacecraft transponder bandwidth was selected for 12 MHz and thelow-pass filter (approximately 2.5 MHz bandwidth) was employed prior to C-band modulation.
MadridHybrid Terminal -,
Figure 8-5 shows the hybrid terminal configured for the Mage.
The downlink C-band carrier bearing the three subcarriers, each corresponding to a I)CP, was down-
converted to 70 MHz and demodulated (phase modulation). The resulting signals at 687 kHz, 719kHz and 740 kHz were then demodulated (amplitude modulation) recovering the Minsk, Odessa,
and Archangel data respectively and recorded on a 10-track analog tape recorder.
The EME vhf telemetry data was recorded on a separate tape. ._i
DATA REDUCTION
Figure 8-6 shows the Mage data flow.
The DCP telemetry and the EME telemetry were recorded at the hybrid station on separate tapes,
DCPRAN and EMERAN, respectively, and mailed to GSFC for processing. At the Goddard SpaceFlight Center Information Processing Division (IPD), the data from the UCLA magnetometer
aboard ATS-6 were extracted from the EMERAN tapes and transferred to other tapes, EMEMAG,
that were mailed to UCLA along with separate tapes, ATSATT, containing data on the attitude andlocation of ATS-6. From these, UCLA produced digital tapes, REDMAG, containing accurately
timed reduced magnetometer data, that were then shipped to IPD. Meanwhile, IPD, having digitized
the data on the DCPRAN tapes and performed data quality editing to produce new tapes, DCPTLM,
1982008279-159

• !
U.S./U.S.S.R.MAGNETOMETEREXPERIMENT 141
ATS-E
MAGNETOMETER
DCP U.ILLR. FORMAT
GID INPUT
1 2 3 4 E 6 7
DAY I MILLlUCOND$ FRM SEO STATIONSYNC OF I OF
] YEAR Ii DAYI CNT : CNT IDI I I
_ RETRANSMITTED ;- I
8 9 10 11 26
X Y Z -- XYZ REPEATWORD6 11 THROUGH 25
WORD 1o2 EYNC - 76681460
3, 4, 6 CLOCK " EME WORDS 151,162, 15.1, 1M
E EEOU:ENC_ COUNT " EME WORD 6 BIT 23. 20BIT 2--- 2 'v OCTAL - 0 THROUGH 12
6 ; IR¢2_1_COaUNT " EME WORD 4 BIT 23 - 20• 2-- OCTAL - 0 THROUGH 63
7 STATION ID - _ - DEFINED
Figure 8-4. DCP Data Format
merged the DCPTLM and REDMAG tapes to produce the I)CPEME tapes which was the Mage out-
put. Copies of the DCPEME tape were sent to UCLA and the U.S.S.R.
EXPERIMENT BACKGROUND
The initial UCLA concept paper of November 1974 detailed the requirements and envisioned theuse of up to ten I)CP's to be located in the Eastern Hemisphere. The basic concept as presented didnot change, but some of the engineering details did.
1982008279-160

142 ATS-6 FINAL ENGINEERING PERFORMANCE REPORT
, !l w,,,I I,
' - : , I *,i
-- I:'-:: _-- " ",I "I"I
ll_---r - -_._ | II
I t-"I _'
i f I_ J ._
1982008279-161

t
U,S./U.S.S.R. MAGNETOMETEREXPERIMENT 143
5 I ':
11 ',, ,_j. I
1982008279-162

144 ATS-6FINALENGINEERINGPERFORMANCEREPORT
During early and late 1975, the radio link decibel (dB) budgets were developed. These confirmedthat tile use of IO-dB antennas and 200-watt transmitters for the DCP's would be adequate. How-
ever, some considerable effort was expended before it was decided to use the ATS-6 remodulation(PLACE) rather than the frequency translation mode for the return data link and to arrive at anoptimum configuration for the hybrid station receiver. The decisions were arrived at after consider-ing relative costs and performance analyses, and after reviewing the results of intermodulation levelmeasurements conducted through the spacecraft from Rosman Ground Station. By this time, bud-getary considerations in implementing the hybrid station channel demodulators permitted the u_"
of no more than five IXTP's and a frequency plan was adopted that was designed to minimize inter-modulation and crosstalk problems between the DCP channels.
Early in the planning stage it was thought that assigning IX?P vhf transmit frequencies in a region
0.55 to 1.50 MHz higher than the spacecraft 150-Mitz intermediate frequency would enable the useof inexpensive standard amplitude modulation (AM) broadcast radios in implementing the channeldemodulators a_ the hybrid station. A number of factors conspired against this arrangement, how-ever, and the channel demodulators were dcsignc I anti fabricated at Goddard Spa "c Flight Cent, _.
While the above work was proceeding, the detailed effort in the data processing area was commenced
at Goddard Space Flight Center (GSFC) with the initial effort being directed toward enabling data
quality checks in time for the urcoming visit to GSFC by the U.S.S.R. scientists with their bread-board DCP. This visit took place during the latter part of April and the first half of May !975.
The tests on the U.S.S.R. breadboard equipment followed an agreed upon test plan and consisted
first of laboratory tests, and then tests with Rosman Ground Station through the spacecraft. A
number of equipment deficiencies were encountered, mainly involving a vhf receiver incompatiblewith the EME bit stream modulation format and a seriou_ transmitter-to-receiver radio frequency_rt')cross-talk problem. With the temporary substitution of GSFC items and components, the sys-
tem demonstrated satisfactory data handling performance with bit-error rates on the order of IO s
The LI.S.S.R. team headed back to the Soviet Union apparently with an adequate understanding of
the problems involved and the methods of solution to be incorporated into their final DCP hard-ware. ..
During this period, some of the logistics were initially worked out, and shortly after tile U.S.S.R.
team departed, an in-orbit test plan was submitted to them to enable an orderly test and checkoutprocedure with tile hybrid station using the final hardware deployed in the U.S.S.R.
Then followed a period from mid-May to mid-August 1975 (at which time the initial in._rbit opera-
tion commenced) during which the U.S.S.R. was fabricating their DCP's at IZMIRAN and GSFCwas readying the data processing system and fabricating the channel demt'_htlators to be shipped tothe t:ybrid station.
The U.S.S.R. team, proceeding according to their plan, was fabricating and testing their DCP's atIZMIRAN prior to deploying them one at a time to the observatory sites. By early August, theyreported that they were receiving the ATS-6 EME telemetry with their first unit ldestined Ibr
1982008279-163
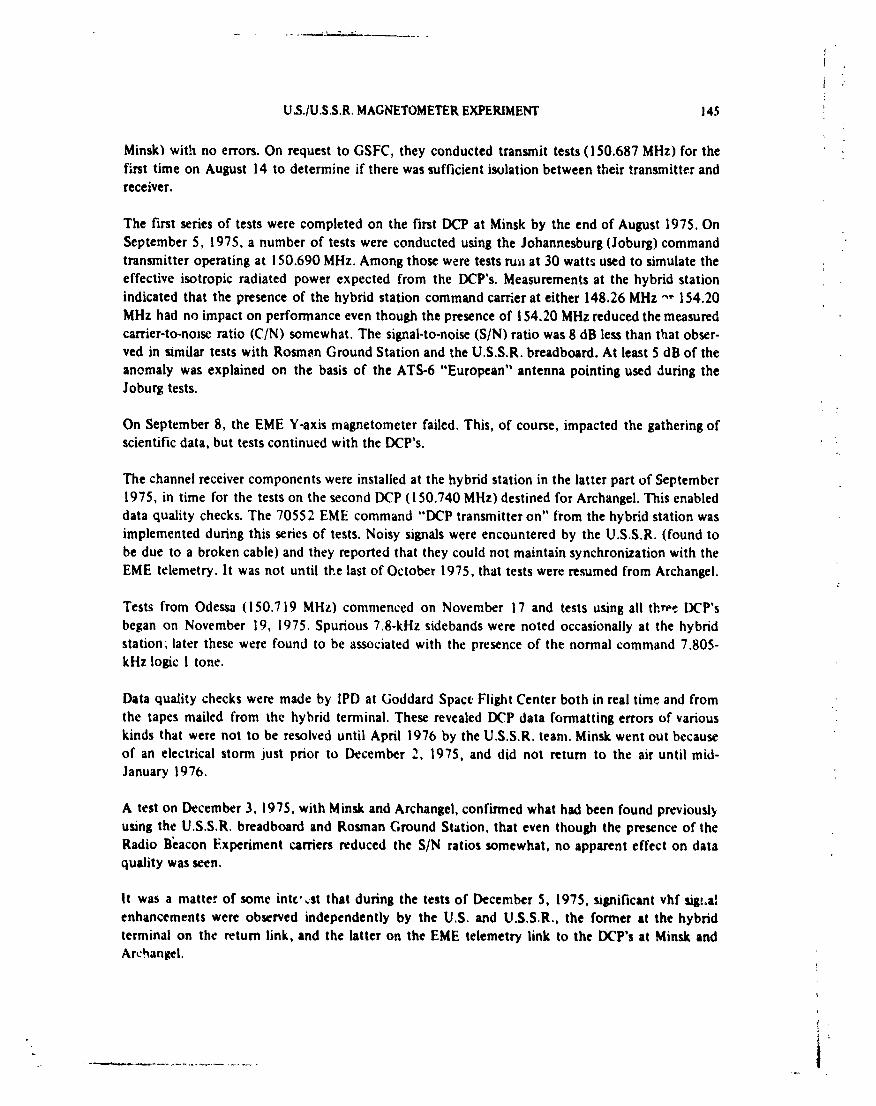
U.S./U.S.S.R.MAGNETOMETEREXPERIMENT 145
Minsk) with no errors. On request to GSFC, they conducted transmit tests (150.687 MHz) for thefirst time on August 14 to determine if there was sufficient isolation between their transmitter andreceiver.
The first series of tests were completed on the first DCP at Minsk by the end of August 1975. On
September 5, 1975, a number of tests were conducted using the Johannesburg (Joburg)commandtransmitter operating at 150.690 MHz. Among those were tests run at 30 watts used to simulate theeffective isotropic radiated power expected from the DCP's. Measurements at the hybrid stationindicated that the presence of the hybrid station command carrier at either 148.26 MHz "- 154.20MHz had no impact on performance even though the presence of 154,20 MHz reduced the measured
carrier-to-noise ratio (C/N) somewhat. The signal-to-noise (S/N) ratio was 8 dB less than that obser-ved in similar tests with Rosm_n Ground Station and the U.S.S.R. breadboard. At least 5 dB of the
anomaly was explained on the basis of the ATS-6 "European" antenna pointing used during theJoburg tests.
On September 8, the EME Y-axis magnetometer failed. This, of course, impacted the gathering ofscientific data, but tests continued with the DCP's.
The channel receiver components were installed at the hybrid station in the latter part of September1975, in time for the tests on the second DCP (150.740 MHz) destined for Archangel. This enableddata quality checks. The 70552 EME command "DCP transmitter on" from the hybrid station wasimplemented during this series of tests. Noisy signals were encountered by the U.S.S.R. (found tobe due to a broken cable) and they reported that they could not maintain synchronization with theEME telemetry. It was not until tl'.e last of October 1975, that tests were resumed from Archangel.
Tests from Odessa (150.719 MHz) commenced on November 17 and tests using all three DCP'sbegan on November 19, 1975. Spurious 7.8-kHz sidebands were noted occasionally at the hybridstation; later these were found to be associated with the presence of the normal command 7.805-kHz logic 1 tone.
Data quality checks were made by IPD at Goddard Space Flight Center both in real time and fromthe tapes mailed from the hybrid terminal. These revealed DCP data formatting errors of variouskinds that were not to be resolved until April 1976 by the U.S.S.R. team. Minsk went out because
of an electrical storm just prior to December 2, 1975, and did not return to the air until mid-January 1976.
A test on December 3, 1975, with Minsk and Archangel, contrtrmedwhat had been found previousl_using the U.S.S.R. breadboard and Rosman Ground Station, that even though the presence of theRadio Beacon Experiment carriers reduced the S/N ratios somewhat, no apparent effect on dataquality was seen.
It was a matte: of some int¢'¢st that during the tests of December 5, 1975, significant vhf sigt.a!enhancements were observed independently by the U.S. and U.S.S.R., the former at the hybridterminal on the return link, and the latter on the EME telemetry link to the DCP's at Minsk andArchangel.
1982008279-164

146 ATS-6FINALENGINEERINGPERFORMANCEREPORT
Tests resumed with a four-day series commencing on January 20, 1976, with all three DCP's exhibit-ing data formatting difficulties of various sorts and Archangel experiencing modulation depth prob-lems. The formatting errors prompted a two-way TWX interchange between GSFC and the U.S.S.R.team on January 27, 1976, in which GSFC described the formatting errors. Tests during :he firstweek in February exhibited much the same difficulties as the previous series.
Tests with all three DCP's were resumed on March 14, 1976, with much improved data formattingand excellent frame sync lock on Minsk and Odessa. By March 19, the Minsk and Archangel data
formatters were operating properly, but Odessa was not s*.raightened out until over a month later.
Routine data gathering commenced during the first part of April 1976. Frame sync lock was gener-ally reported to be 95 percent or better. Measured bit-error rate ranged from slightly less than 10.5
to about 10"_. Two factors contributed to the higher than expected error rate. First, the signa!4o-noise ratios were significantly lower than anticipated (thought to be, but by no means conclusively,due to suppression of the desired signals by terrestrial vhf sources entering the spacecraft on the up-
link). Secondly, fading was encountered at vhf on these mid- and high-latitude paths. As it turnedout, adequate scientific data requireG that valid data points occur only every fi:w seconds, so thatoverall the data-gathering performance of the system was more than satisfactory despite the com-paratively high error rate.
During the submquent months, data processing w_:scompleted and the tapes were delivered to the
U.S.S.R. It was not until one-and-a-half to two years later, that the U.S.S.R. sent a team (not the
original) to UCLA for a series of conferences concerning the tapes. It appeared that the U.S.S.R.
team was having difficulty reading the tapes. Nothing has been heard from that group since, and noU.S.S.R. published results are known.
CONCLUSIONS
In most respects, the Mage was a tremendous success. It demonstrated for the first time the actual-itv c_I simultaneously recording data from spatially scpara' :d magnetometers in real time to anaccuracy of a few milliseconds. The data processing employed by the Mage eliminated the tedious
task of reducing data from charts, films, etc., with its inherent inaccuracies. The liaison among al'parties involved in the experiment was outstanding and probably was as good as th,,t experienceddaring the Apollo-Soyu? program regardilkgthe interclzange between the U.S. and U.S.S.R. teams.
the percent data coverage was high. it was somewhat disappointing that the U.S.S.R. k-aagnetom-eters could measure only to a sensitivity of ! gamma (-f) whereas the UCLA ATS-6 magnetometerwas capable of i/16 3'. Wavelike disturbances in the ._'_arth'smagnetic field typically experience
perturbations of greater than ! "yfor those having a period _n the order of 500 s. Disturbances havingperiods on the order of 10 s typically have amplitudes tha! are small fractions of a 1'and so pre-sumably co,Jld not be recorded by the U.S.S.R. magnetometers.
It can only be speculated that the U.S.S.R. attached some importance to the experimtnt as eviden-ced by thuJr vistt to UCLA well after the completion of the experiment to resolve their difficulties
1982008279-165

U.S./U.S.S.R. MAGNETOMETEREXPERIMENT 147
in reading the data tapes, it is a matter of further speculation as to whether they will publish theresults of the findings in the literature.
1982008279-166

: PRECEDING PAGE BLANK NOT FILMED
L
APPENDIX
ACRONYMS AND ABBREVIATIONS :_
A ampere
._ Angstrom i
ABC analog backup controller _!
AC attitude control _a.c. alternatiitg current
ACE actuator control electronics
ACP acquisition control programa
acq. acquisitionACS attitude control subsystem
ACSN Appalachian Community Service NetworkA/D analog to digital
ADC analog-to-digital converter _"
ADPE automatic data l_rocessing equipment _
ADS automatic deployment sequencer "ADSS auxiliary digital Sun sensor
ADVM adaptive delta voice modulation
A/E absorbtivity t emissivityAerosat aeronautical satelliteAES Ahmedabad Earth Station
AESP Appalachian Education Satellite Projectaf audio frequency
AFC automatic frequency control
AFTE Advanced Thermal Control Flight ExperimentAGC automatic gain control
AGE aerospace ground equipmentAh ampere-hour
AID Agency for International Development _
AIDSAT Agency for International Development Television Demonstratioo sAIR All India Radio
ALC aut,,matic level control _"
ALED Alaska Education Experiment :'
am, AM amplitude-modulationAMP amplifierAOS acauisition of satellite
APM antenna pattern measurement
149
1982008279-167

150 ATS-6FINALENGINEERINGPERFORMANCEREPORT
APT :'utomatic picture transmission
ARC Appalachian Regional Commission
ASC Aerospace Corporation
ASP automated sequential processorASSY assembly
ASTP Apollo-Soyuz Test Program
ASTP-TV ASTP television coverage experiment
ATA automatic threshold adjust
AT&T American Telephone and Telegraph (Spacecraft)ATC air traffic control, active thermal control
ATFt- Advanced Thermal Control Flight Experiment
atm, ATMOS atlnosphere(s)ATS Applications Technology SatelliteATS-6 Applications Technology Satellite-6ATSOCC ATS Operations Control Center
ATS-R ATS rangingATSSIM ATS simttlator
Atten attenuator (_ttenuation)Aux auxiliary
B
B&I! Broadcast and Engineering
BAM budding attenu,'ltion measurementBB baseband
BER bit error rate
bps bits per secondBRC Balcones Research Center
BSA btt synchronization acquisition
BTC binary time code
BT!! bench test equil_mCntBtu British thermal unit
BW bandwidth
C
(" Celsius
Cap Corn Capsule CommunicatorC'CIR International Radio Consultative Committee
('I)D command/decoder distributor
('El", designator lbr "career education course for elementary-grade teachers"
CES designator Ibr "'career education course fer secondary-grade teachers"
CFSP conlputer executive system l,rogramCI.SS coarse/fine Sun senu, r,q
1982008279-168

ACRONYMSANDABBREVIATIONS 151 _
CIC command interface control _'
CIE cesium ion engine
C/L capacitance-to-inductancecm centimeter
: CM communications module
C/M carrier-to-multipath' CMD command
CMOS complimentary metal oxide semiconductor
C/N ° carrier power to spectral noise density ratioCNR, C/N carrier-to-noise ratiocntr ceater
Comsat Communications Satellite Corporation
ConUS, Continental United StatesCONL._
CONV converter
COSMOS complimentary symmetry metal oxide semiconductor iCPI cross polarization isolation
CPR cross polarization ratio
CPU central processing unitCRT cathode-ray tubeCSM command-service module
CSP command service programCSS coarse Sun sensor
CTNE Companie Telephonica Nacional de Espana
CW carrier wave, continuous wave
D
DA design adequacy
D/A digital to analogDACU data acquisition and control unit
DAF Data Acquisition FacilitydB decibel
dBi decibel isotropic (gain relative to an isotropic antenna)
dB/K deci0el per degree KelvindBm decibels referred to I milliwatt
dBW decibel (reference level 1 watt)13£ downconverterd.c. direct current
D(TP data collection platforms
DDDF duplex digital data formatterDDS digital Sun sensor
DECPSK differentially encoded coherent phase shift key (modulated)DEG, deg degree
1982008279-169

152 ATS-6FINALENGINEERINGPERFORMANCEREPORT
DEM digital evaluation mode
Depl deploymentDES Delhi Earth Station
DESA double electrostatic analyzer
DIB data input bufferdiv division
DIX data interface transmitter
PJS Dzhusaly (designator)DLO dual local oscillator
DM docking module
I)OC digital operational controllerDOD depth-of-discharge
DOT Department of TransportationDOT/FAA Tile Department of Transportation/Federal Avaiation Administration
DOT/TSC Tile Department of Transportation/Transportation Systems CenterDPRI diagnostic and prescriptive reading instruction
DR Copenhagen (designator)
DRR data recorder/reproducer
DRS direct reception systemDSS digital Sun sensorDSU data switching unitDTS data transmission system
DUT Denver Uplink Terminal
E
EBU European Broadcast Union
ECtt Earth-coverage hornE('i Earth centered inertial
c.d.t.. EDT eastern daylight time
e.i.r.p, eflL'ctive isotropic radiated powerEME Environmental Measurements Experimentsemi, ['MI electromagnetic interferenceFM L equivalent monomolecular layerenc encoder
Eng. engineeringEOL cnd-ul-life
EPIRB Emergency Position Indicating Radio Beacon
EPS electrical power subsystem
ERP effective radiated powerES Earth sensor
ESA Earth sensor a,_mbly, European Space AgencyESA/PSA Earth sensor assembly/Polaris sensor assemblye.s.l., EST eastern standard time
1982008279-170

!t
ACRONYMSANDABBREVIATIONS 153
ETR Eastern Test Range _ ':eV electronvolt i
EVM Earth-viewing module
EVT Eupatoria (designator)
F
f frequencyF Fahrenheit
FAA Federal Aviation AdministrationFCC Federal Communications Commission
FCHP feedback-controlled variable conductance heat pipe _
FCP flight computer programFCT fixed calibration terminal
f/d ratio of focal distance to diameter
FDM frequency diversity modulation; frequency division multiplexer ;,
fm, FM frequency modulatedFOV field-of-view ::
FOWG Flight Operations Working Group
Freq. frequencyFRMS Federation of Rocky Mountain States
fsk frequency shift keying _FSS fine Sun sensor
ft foot, feet
FT frequency translationft-lb foot-pound
FTO functional test objectiveFTS Federal Tdecomnumications System ',
G o
g grams, gravityG gainGAC ground attitude controlGEOS-3 Geodetic Earth-Orbiting Satellite-3 _,
GFRP graphite fiber reinforced plasticGHz gigahertz
gm gram
G.m.t., GMT Greenwich mean time _GRD groundGRP group
GSFC Goddard Space Flight Center
G/T dB/K, gain over temperatureGTT ground transmit term inal
GVHRR Geosynchronous Very High Resolution Radiometer
1982008279-171

154 ATS-6FINALENGINEERINGPERFORMANCEREPORT
H
HAC Hughes Aircraft Company
HDRSS high data rate storage system
HET Health, Education, Telecommunications (experiment)
HEW Department of Health, Education, and Welfare
ilt" high frequencyHGA high gain antenna
H1 Honeywell hlternationalHPBW half power bandwidthHR hour
HSE high-speed execute
HTR heater; high-time resolutionHz hertz
IBM International Business Machines
IDT image dissector tubeIEB interface electronics box
i.f. in termed iatc frequency
IFC in-flight calibrationIHS Indian Itcalth Service (Alaska)
IHSDL intcrl\'rometcr high speed d.'lta linkIM intennodulation
IMF interplanetary magnetic field
r _P Interplanetary Monitoring Platformin. inch
in.-oz inch-ounce
lntelsat International Telecommunications Satellite
INTF interferometcr
1/O inpu t/outptlt
IPI) informalion I)roccssing l)ivisionIR infrared
IRAC intcrdcp,lrtmcnt Radio Advisory CommitteeIS RO Indiall Space Research OrganizationIT intensive terminalITS Institute of ]clccommunications Sciences
ITU International Telecommunications Union
I-V current voltageIW incrtia wheel
IZMIRAN Institute of Terrestrial Magnetism, Ionosphere and Radio Wave Propagation
1982008279-172

ACRONYMSAND ABBREVIATIONS 155
J
JAM jet-assist mode
Joburg Johannesburg (designator)
JSC Johnson Space Center
K
K Kelvin
kbps kilobits per secondkcV kiloelectronvolt
kg kilograxnkHz kilohertz
km kilometer
KSC Kennedy Space Center .,kW kilowatt
L
Ib pound
LC inductive-capacitanceLD linear detector
LI:T long l\_nu test
LIC load interface circuit
LLI) lower level discriminator
LO local oscillator
LOS line-of-sightLRIR limb radiance inversion radiometer
LSB least significant bit
LT local time
LV local vertical
L.V. latch valve
M
nl illett'r
Ill 2 square meter
mA milliamperesMad Mad rid
MAD-tiYB Madrid Hybrid
Mage U.S./U.S.S.R. Magnetometer ExperimentMarad Maritime Administration
MASFP roam sequential programMax. Illaximl.llll
1982008279-173

156 ATS-6FINALENGINEERINGPERFORMANCEREPORT i
MCC-H Mission Control Center, HoustonMCC-M Mission Control Center, Moscow
MDAC McDonnell-Douglas Aircraft CorporationMDHS meteorological data handling system
MESC magnetoelectrostatic plasmaMeV megaelectronvoltsMHz megahertz/_f microfaradtam micrometer (micron)
_s, usec microsecondMILA Merritt Island Launch Annexrain, MIN minute
mlb miilipound _.MMW Millimeter Wave ExperimentmN millinewton
MOCC Mult_satellite Operahons Control Center
MOCR Mission Operations Control RoomMONO monopulse
MOR Mission Operations RoomMOS met. 1oxide semiconductor
MSB most significant bitms. msec millisecond
m/s meters per secondMT multitone
mV millivoltsmW milliwatt
MWE Millimeter Wave ExperunentMW XMTR microwave transmitter
N
N Newton
NAFEC National Aviation Facilities Experiment CenterNASA National Aeronautics and Space AdministrationNascom NASA Communications Network
NBFM narrowband frequency modulationNCC Network Coordination CenterNCE normal command encoder
NDR Hamburg (designator)nm nanometer
NMRC National Maritime Research Center
NOAA National Oceanic and Atmospheric Administration
N/P negative/positiveNRL Naval Research Laboratories
1982008279-174

i ;
ACRONYMSANDABBREVIATIONS 157
ns nanosecond
NTSC National Television System Committee color (U.S.)
O
O&M operations and maintenanceOC orbit control
OCJ orbit control jet
OCP operation',d control programo.d. outside diameter
OD Operations and Distribution (Center)omni omnidirectional (
OSR optical solar reflectorsOSU Ohio State University
OYA Helsinki (designator)
P
PA power amplifier, preamplifier
PAL phase alternation live color (Europe)
PAM pulse amplitude modulatedPAO Public Affairs Office
PARAMP parametric amplifierPB phonetically balancedPBS Public Broadcasting Service
Pc course phase measurenlent[-cm, PCM pulse code modulation
pcm/fsk/am pulse code modulation/frequency shift keying/amplitude modulationPCT portable calibration tenuinal
PCU power control unit
PDM pulse duration modulation
pf picofaradPFD power flux density
PFF prime-focus feed
PGE PI.ACE ground etlt|ipnlent
PIC power interface circuit
PLACE Position Location and Aircraft Communications Experiment
PLU Project Look-Up
PM phase-modulated
PN pseudo-heir"POCC Project Operations Control Center
p-p peak-to-peak
PPK Petropavlovsk-Kamchatskt (designator)
ppm parts per million
1982008279-175
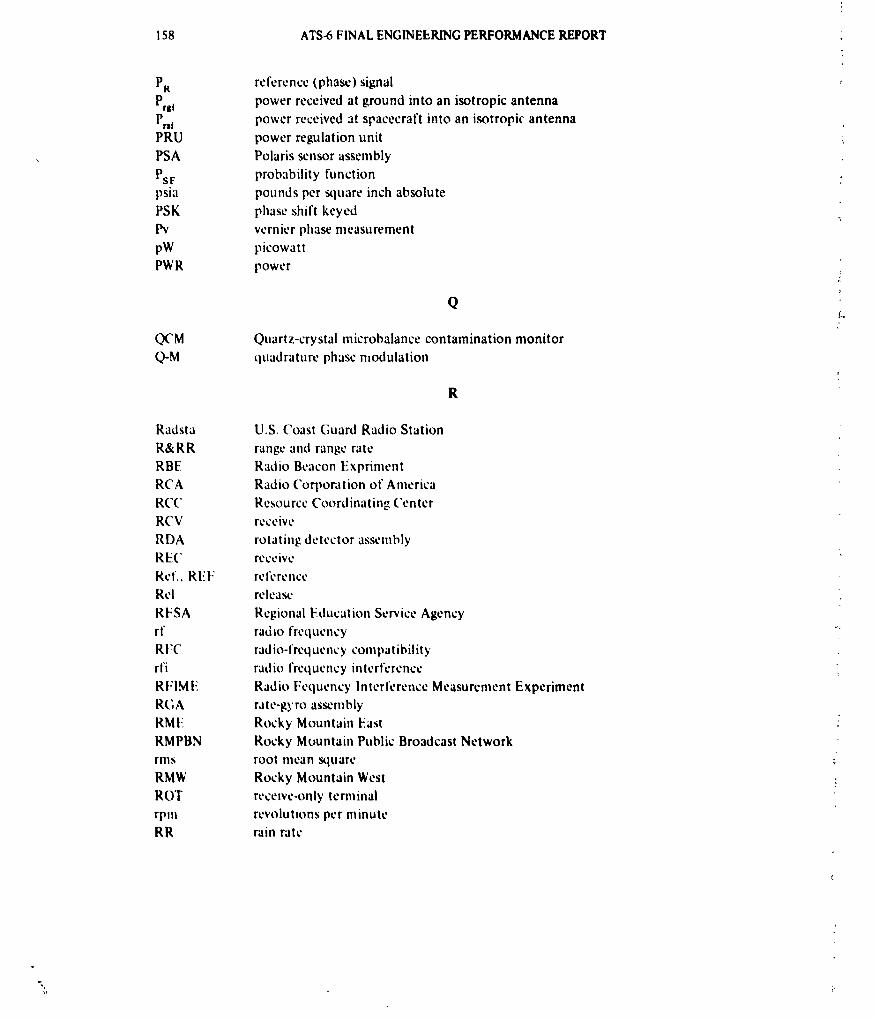
158 ATS-6FINALENGINEERINGPERFORMANCEREPORT
PR reference (phase) signal
Prsl power received at ground into an isotropic antennaPr,J power received at spacecraft into an isotropic antennaPRU power regulation unit
, PSA Polaris sensor assembly
PSF probability functionpsia pounds per square inch absolute
PSK phase shift keyed _.Pv vernier phase measurementpW picowatt
PWR power ,_?
Q
QCM Quartz-crystal microbalance contamination monitor
Q-M quadrature phase modulation
R
Radsta U.S. Coast Guard Radio Station
R&RR range and range rate
RBE Radio Beacon kxpriment
RCA Radio ('oworation of AmericaRCC Resource Coordinating CenterRCV receive
RDA rotating detector assemblyREC receive
Ref., RE|: referenceRel release
RESA Regional Education Service Agency
rf radio frequency
R|:(" radio-frequency compatibilityrfi radio frequency interference
RFIM|" Radio Fequency Interference Measurement ExperimentRGA rate-gyro assembly
RME Rocky Mountain EastRMPBN Rocky Mountain Public Broadcast Network
this root Inean square
RMW Rocky Mountain WestROT receive-only terminal
rpm revolutions per minuteRR rain rate
1982008279-176

i!
i
ACRONYMS AND ABBREVIATIONS 159 _-
$
S/A solar array
SAPPSAC Spacecraft Attitude Precision Pointing and Slewing Adaptive Control (Experiment)• SAR search and rescue
S&R surveillance and rangingSatcom Satellite CommunicationsSC sudden commencement
S/C spacecraftSCAM.a switching, conferencing, and monitoring arrangementSCAMP small command antenna medium powerSE system effectivenesssec, s secondSECAM Sequential Couleurs a Memoire (Ill) color (U.S.S.R.)SEL Space Environmet_t LaboratorySENS sensor
S.G. signal generator _
SITE Satellite Instructional Television ExperimentSITEC sudden increase in total electron content
SIU squib interface unitS-IVB Saturn IB second stageSMSD spin motor sync detectorSNR, S/N signal-to-noise ratioSpec specificationSPS spacecraft propulsion subsystem
SPU signal processing unitsr steradian
SR Stockholm (designator)SRT SAPPSAC remote terminal _:-
SSC sudden storm commencement
SSEA Sun sensor electronics assemblySSR Staff Support RoomSTA station
STADAN Space Tracking and Data Acquisition NetworkSTDN Spaceflight Tracking and Data NetworkSTRUCT structural
SWBT Southwestern Bell Telephone CompanySYN synthesizerSYNC synchronous
SYSSIM system simulator
I
in
1982008279-177

160 ATS-6 FINAL ENGINEERINGPERFORMANCEREPORT
T
T&C lelcmeh y and commandTACH tachometer
T&CS telemetry and command subsystem
J'&DRE Trackin._ and Data Relay ExperimentTART transmit and receive terminal
TASO Television Allocation Study OrganizationTB(" time base corre_:tor
TCD transponder command decoder
T('S telemetry anti command subsystem, thermal control subsystem
TDA tunnel diode amplifier
TDRE Tracking and Data Relay Experiment
TEMP temperature
THIR temperature-hunudity infrared radiometer
TID traveling ionospheric disturbances
TLM. TM telemetry
TGRQ torquer
]'RUST Television Relay Using SmaU TerminalsTSM thermal structural model
FSP telemetry service program
TSU temperature (control) and signal (conditioning) unit
TT/N test-tone signal-to-noise ratio
I'I'Y teletypefV tel...'vision
FVfX" Tclevisioll operational Control Cehtcrs
TWT traveling wave tube
fWIA traveling wave tube amplifier
U
[ I(" upconvcrter
U('I.A U,uverstty of ('alifornia at I.os Angeles
tIC'SD University of ('alilbrnia at San Diego
uhf ultralugh fretluency
UK I.IIllted !_lngtlonl
LIKfV University of Kentucky Television
ulf ultralow frequency
UNll Llniversity el New HampshireU.S. United Slates
USA t, biquitous spectrum analyzer
LiSAF United States Air Force
US('G United Stat.'s Coast Guard
USK Ussuruisk (designator|
I
1982008279-178

1
IACRONYMSANDABBREVIATIONS 161
U.S.S.R. Union of Soviet Socialist RepublicsUT universal time
UV ultraviolet
V
v velocityV volt
VA VeteransAdministration
VCA voltagecontrolledamplifierVCHP passive"cold-reservoir"variableconductanceheatpipe
VCXO voltagecontrolledcrystaloscillatorVdc voltsdirectcurrent
V/deg voltsperdegreeVer ,.. vertical
vhf, VHF very high frequencyVHRR very high resolution radiometerVIP versatile informationprocessorVIRS vertical interval reference signalVITS vertical interval test signalsVPi Virginia Polytechnic InstituteVS. versus
VSWR voltage standing-wave ratio
V/T voltage/temperatureVTR video-tape recorderVU MTR VU meter
W
W watt
WAM! Washington, Alaska, Montana, Idaho (medical education)WBDU Wideband Data Unit
WBVCO widebandvoltage-controlledoscillatorWHL, WH wheel
X
XMIT transmit
XMTR transmitter
XTAL crystal
XTAL DET. crystal detector
1982008279-179

162 ATS-6FINALENGINEERINGPERFORMt?_CEREPORT
Y
YIRU yaw inertial reference unit
Z
ZAZ Z-axis azimuthZcoel Z-coelevation
.J
1982008279-180

BIBLIOGRAPHYk
Environmental Measurements in Space
_t
"ATS-6 Solar Cosmic Ray and Trapped Particle Experiment," Final Report, Contract No. NAS
5-22913, TRW, Defenr,e and Space Systems Group, One Space Park, Redondo Beach, California90278.
Erickson, K. N., et al., "A Study of Magneto._ph*_reDynamics During Auroral Electrojet Events byObservations of Energetic Electron Intensity Changes at Synchronous Orbit," Jr. Geophys. Res.,
4
84, p. 931, 1979.
Kaye, S. M., et al., "Adiabatic Modulation of Equatorial Pitch Angle Anisotropy," J. Geophys.Res., 83, p. 2675, 1978.
Sauvaud, J. -A., and J. R. Winckler, "Dynamics of Plasma, Energetic Particles, and Fields near ::
Synchronous Orbit in the Night Time Sector During Magnetospheric Substorms," J. Geophys.Res., In Press, 1980.
Walker, R. J., et al., "Studies of the Trapped Radiation at Synchronous Orbit with the University
of Minnesota ATS-6 Electron-Proton Spectrometer," IEEE Trans. Aerosp. Electron. Syst.,
AES-I 1(6), p. 1131, 1975.
Walker, R. J., et al, "Substorm-Associated Particle Boundary Motion at Synchronous Orbit,"
J. Geophys. Res., 81, p. 5541, 197C
Walker, R. J., et al.. "Pitch Angle Dispersion of Drifting Energetic Protons at Synchronous Orbit,"J. Geophys. Res., 83, p. 1595. 1978.
Magnetometer
ATS-6 Magnetometer Data Reduction System Dcsign Document, CSC/SC-75/6055 ComputerSciences Corporation, June 1975.
Barry, J. D., and R. 2. Snare, "A Fiuxgate Magnetometer for the Applications Technology Satel- _,lite," IEFE Trans. ? ":clear $cieace, Vol. NS-I 3, 1966.
Gore, W., "AnMysis and r_esign of a Fluxgate Magnetometer," M.S. Thesis, Institute of Geophysicsand Planetary Physics, U.C.L _,., Pub. 78-1445, 1974.
163
1982008279-181

164 ATS-6FINALENGINEERINGPERFORMANCEREPORT
BIBLIOGRAPHY (continued)
Power, J. J., "A Digital Offset Fluxgate Magnetometer for Use in Remote Geomagnetic Observa- :
" tories," M.S. Thesis, Institute of Geophysics and Planetary Physics, U.C.L.A., Pub. 1247-37,1973.
Snare, R. C., and C. R. Benjamin, "A Magnetic Field Instrument for the OGO-E Spacecraft,"IEE_ Trans. Nuclear Science, Vol. NS-13, No. 6, p. 333, 1966.
Snare, R. C., and G. N. Spellman, "Digital Offset Field Generator for Spacecraft Magnetometers,"
Proc. Syrup. on Space Mag. Explor. and Tech., Reno, Nevada, August 30, 1967.
Radio Beacon
Bouwer, S. D., et al., "ATS-6 Radio Beacon Electron Content Measurements at Ootacamund, 'i
India, October 1975-July 1976," NOAA Report UAG-74. ,.
Davies, K., et al., "Electron Content Measurements Over the U.S.," Joint Radio Beacon Program,
NOAA/MPAE/Graz, Station Report, ATS-6 94°W, Max-Planck-Institut fur Aeronomie, Postfach
20, I3-3411 Katlenburg-Lindau 3, Germany, 1977.
Davies, K., G. K. Hartmann, and R. Leitinger, "A Comparison of Several Methods of Estimatingthe Columnar Electron Content of the Plasmasphere," J. Atmos. Terr. Phys., 39, pp. 571-580,1977.
Davies. K., and J. D. Whitehead, "A Radio Lens in the Ionosphere," J. A tmos. Terr. Ph)'s., 39,pp. 383-387, 1977. ,.
Davies, K., et al., "ATS-6 Satellite Radio Beacon Measurements at Ootacamund, India," Radio Sci.. ..
14, (1), pp. 85-95. 1979.
Davies, K., et al., "Nighttime Increases in Total Electron Content Observed With the ATS-6 Radio
Beacon,",/. Geophys. Res., 84, (A4), pp. 1536-1542, 1979.
Davies, K., "Overview of Published Research Using the ATS-6 Radio Beacon," Beacotp Satellite
Measurements of Plasmasphertc and Ionospheric Properties, Editor P. F. Cheat "i, Research
Institute for Electromagnetic Wavos, Florence, Italy, pp. 1-1 through 1-,19, 1979 _,
Davies, K., :t al., "ATS-6 Satellite Radio Beacon Measurements at Ootacamu:,t_, India," Beacon
_tellite Measurements of Plasmaspheric and Ionospheric Properties, Italy, pp. 2-I through 2-33,1979.
Davies, K., et al., "Nighttime Increases in Total Electron Content Observed With the ATS-6 Radio
Beacon," Beacon Satellite Measurements of Plasmaspheric end Ionospheric Properties, Italy,pp. 4-I through 4-16, 1979.
|
1982008279-182

BIBLIOGRAPHY 105
r
BIBLIOGRAPHY (continued) 'i
Davies, K., et al., "Some Measurements of Total Electron Content Made With tilt' ATS-6 Radio
Beacon," Bcacon Satellite Measurements of Plasmasplwric and Ionospheric Propcrties, Italy. :'
pp. 14-I through 14-7, 1979.
Davies, K., et ai.. "Comparison of Total Electron Cot_tent Measurements Made With the ATS-O
Radio Beacon Over U.S. and Europe," J. Atmos. Terr. Phys., 42, pp. 411-416, Iq80.
Davies, K., and M. P. Paul. "ATS-6 Boulder Measurements of Plasmaspheric and Total l-lectron
Content During Phase 111," Proceedings of COSPAR Satellite Beacon (;roup, Warsaw, l q80.
Davies, K., "Recent Progess in Satellite Radio Beacon Studies With Particular l:'ml_hasis on the /ATS-6 Radio Beacon Expcrimcnt," Space Sci. Roy., 5, pp. 357-430, Iq81.
l)cgcnhardt, W., ctal., "Dctenumation of Fravclling ltmosphcric l)isturbanccs.'" .I...l trees. Tcrr.
• ! _,q- i 234, 1978.t'h vs., 40, pp. "_"
Degenhardt, W., et al., "Determination of Travelling Ionospheric Disturbances," Beacon Satellite "
: Measurements o.f l'lasmaslflwric umt hmost,hcric Frol,ertics, Italy, pp. 27- I through 27-7. I q7q.
Deshpandc, m. R., et al., "Frequency l)cpendence of Equatorial Ionospheric Scintillations, t'roc
Italian Acad. Sci,, 87A, (7), pp. 173-I 78, Iq78.
l)eshl_amlc, M. R., el al., "Achievements of ATS-O Beacon l:xperiment Over Indtan Subcontincnt,'"
Beacon Satdlitc hh'asttrcmcnts o.f t'hlsmasldwrw am/ lonosl_hcric Propt'rtics, Italy, pp. 3-1
through 3-0, IO70.
l)onnclly, R. F., et al., "lnteq_rctation of the Shape Factor at Ootacamund, Intha,'" Beacon Satdlitc
Mc_lsttr_'mcptts o.fl_lasm_ISlgtcric and hmosl_ht'ric t'rolwrtics, Italy, pp. 17- I through 17- 15, 107 t).
l)onnclly, R. F., el al., "The Fquatorial Total Flcclron Content and Shape Factor,"./ Gcophvs.
Res., 84, pp. 735q-7364, Iq7q.
!tcron, M. L., and K. Davies, "The tlse of Low |:rcqucncy It1" Beacons to l)crwc Layer Shape,"
Beacon S,:tcllite ,lh'asuremcrtts of IYasmasldwric aml hmo,whcric l'rolwrtit's, Italy, pp. 43-1
ti_rough 43-8, I,)'70. :"
Oku/awa, T. ;ll|tl K n'_ies "Pulsations in Total ('ohmmar Flcctron (t lilt, tit, .L (;_'ophl',_" Rt'._'.,
86. Iq81.
Rastogi, R. G., et al., "Amplitude Scintillations of A'I'S-¢_ Radio Beacon Signals Within The I:qtta-17,.torial |-lectrojct Region _Ootacamund, dip 4°NL '' Pramana. 8, pp. I- 13, q "
!
1982008279-183

166 ATS.6FINALENGINEERINGPERFORMANCEREPORT
f
BIBLIOGRAPHY (continued)
Rastogi, R. G., et al., "Daytime Satellite Radio Scintillation and Sporadic E Near the MagneticEquator," Geophys. Res. Letters, 4, (3), pp. 113-115, 1977.
?
Rastogi, R. G., et al., "Simultaneous Observations of Equatorial Ionospheric Scintillation on FourFrequencies," Nature, 273, No. 5660, pp. 285-287, 1978. ¢
Rastogi, R. G., et al., "Total Electron Content and F-Region Electron Density Distribution Nearthe Magnetic Equator in India," J. Atmos. Terr. Phys., 41, pp. 561-564, 1979.
L
Sethia, G., et al., "Total Electron Content from ATS-6 Group Delay Measurements at Ootacamund, ..
India," Beacon Satellite Measurements of Plasmaspheric and Ionospheric Properties, Italy,pp. 14-1 through 14-7, 1979.
1982008279-184