Ozone Monitoring Procedure - Washington is not emitted directly into the air, but is a result of a...
41
Ozone Monitoring Procedure Air Quality Program April 2008 95-201G (rev. 4/08)
-
Upload
truongduong -
Category
Documents
-
view
216 -
download
1
Transcript of Ozone Monitoring Procedure - Washington is not emitted directly into the air, but is a result of a...

Ozone Monitoring Procedure
Air Quality Program
April 2008
95-201G (rev. 4/08)

The Department of Ecology is an equal opportunity agency and does not discriminate on the basis of race, creed, color, disability, age, religion, national origin, sex, marital status, disabled veteran's status, Vietnam Era veteran's status, or sexual orientation.
If you need this information in an alternate format, please contact Tami Dahlgren at (360) 407-6800. If you are a person with a speech or hearing impairment, call 711 or-1-800-833-6388 for TTY.
Ozone Monitoring Procedure
TABLE OF CONTENTS
1 INTRODUCTION..................................................................................................................1
2 STATION INSTALLATION................................................................................................4
3 CALIBRATION STANDARDS............................................................................................6
4 DATA QUALITY INDICATORS ........................................................................................9
5 EQUIPMENT AND MAINTENANCE..............................................................................11
6 QUALITY ASSURANCE....................................................................................................12
7 DATA RECORDING, VALIDATION AND REPORTING............................................12
8 DATA QUALITY ASSESSMENT .....................................................................................12
9 REFERENCES.....................................................................................................................13
APPENDIX A OPERATING PROCEDURES ........................................................................... I
APPENDIX B OZONE CRITICAL CRITERIA, OPERATIONAL, SYSTEMATIC CRITERIA TABLES............................................................................................................... XXI
APPENDIX C CALIBRATION CHECK FORM.............................................................. XXIV

1
1 INTRODUCTION This document is intended for individuals responsible for collecting ozone data supported by the Washington State Department of Ecology (Ecology).
The U.S. Environmental Protection Agency (EPA) has determined ground level ozone is a health and environmental concern. National Ambient Air Quality Standards (NAAQS) for ozone are for the protection of public health. EPA requires that states monitor for ozone to demonstrate that ozone standards are being met. Ecology’s Air Quality Program has the responsibility to monitor for ozone and has an established network of ozone monitoring stations operated by personnel from various agencies.
This document was written to assist personnel tasked with operating ozone instruments in Ecology’s air monitoring network. The successful capture of accurate data with minimal loss will depend not only on reliable equipment, but with procedures designed to assure that Ecology’s Data Quality Objectives are met.
Data Quality Objectives
Data Quality Objectives (DQOs) are a set of specifications needed to design a data collection effort that maximize the likelihood data will be adequate for its intended use.
Specific monitoring objectives must be determined to design a strategy that will effectively meet the objectives and the resources. Ecology’s Air Quality Program DQOs are designed to determine:
• The highest concentrations of ozone expected to occur in the area.
• Representative concentrations of ozone in areas of high population density.
• General background ozone concentration levels.
• Collect only credible data that has the greatest opportunities to benefit public health.
• Focus sampling where the information is critical to protect or assess public health.
Careful Site Selection for Ozone Monitoring
Ozone is not emitted directly into the air, but is a result of a complex photochemical reaction involving organic compounds, oxides of nitrogen, and solar radiation. Ozone can cover a widespread area when conditions conducive to its formation occur.
The highest ozone episodes in Washington State occur when a slow-moving, high-pressure system develops in the summer promoted by the combination of hydrocarbons, high solar radiation and high air temperatures. This complex relationship involving precursors of ozone (i.e. transportation and industrial sources), local meteorology, population and topography determines where monitoring takes place in order to meet the DQOs.

2
Ecology ozone analyzers are housed in shelters usually located downwind of large metropolitan areas (Seattle/Tacoma/Bellevue, Portland/Vancouver, and Spokane) and operate from May through September when ozone concentrations rise.
Theory of Operation
All ozone analyzers operating in Ecology’s air monitoring network use the basic principle of Beer’s Law to measure for ozone in the atmosphere. The Beer-Lambert equation defines how light of a specific wavelength is absorbed by a particular gas molecule over a certain distance at a given temperature and pressure.
The ozone analyzer is simply an optics bench (absorptions tubes) controlled by a microprocessor. A sample of ambient air is drawn into the instrument and is illuminated at one end of the optics bench by a UV lamp. The intensity of the lamp is measured at the opposite end by a detector. Each sample measurement contains two half cycles, one with zero gas and the other with the sample gas. After each cycle, the intensity of the light is stored by the microprocessor. The difference between the two half cycles is the amount of ozone in the ambient sample.
The microprocessor records the UV absorption measurements made after each cycle, the current temperature and pressure, then applies a stored calibration curve on the sample to calculate a final ozone concentration. This concentration value is reported to the user via a front panel display or a variety of digital and analog signal outputs. This cycle is repeated every six seconds.
Locating the Monitoring Station
The monitoring equipment is housed in a clean, dry, secure and temperature controlled space.
Careful thought and planning is required in locating a monitoring station. The individual responsible for the installation must consider:
• Proximity to the nearest power source. A 120 VAC source is required for operation of the ozone monitoring instruments.
• The space where the equipment is housed requires the need for an air conditioner and a heater controlled by a thermostat.
• The availability of monitoring equipment.
• The accessibility of the equipment to the operator. The operator must be able to safely access the equipment during regular business hours.
• The security of the equipment. Monitoring instruments are expensive. They must be placed in a location where security can be assured.
• Contracts for rental of space or power. Contracts need to be signed with the owner of the property where the instruments are to be located.
• Must have DSL access or USB modem access.

3
• Local building codes. In most cases, the contractor installing the power, structure, concrete, etc. know the local building codes. The individual responsible for the installation should call the building facility management staff to inquire about the proposed plan and what is required.
• Noise considerations. The noise of the pumps in the instruments can be annoying if people are located nearby. It may be necessary to demonstrate how loud the instrument is before commitments are made.
• Aesthetics of the monitoring station and sample probe. An air monitoring shelter or a sampling probe attached to a building may detract from the aesthetics of the structure. It is a good idea to have photos or a diagram to explain the proposal.
Most ozone monitoring stations are small temperature controlled shelters designed specifically for air monitoring purposes. The shelters are placed on a concrete pad surrounded by a fence to provide security.
Probe Placement
Once the location of the station has been identified, the individual responsible for the installation must be familiar with the criteria for locating the probe. The location of the sample probe is critical and individuals performing the installation must follow specific guidelines involving;
• The distance of the probe inlet from nearby obstructions (buildings and trees).
• The vertical and horizontal distance of the probe inlet from the ground and support structure.
• Air flow around the inlet of the probe.
• The distance of the probe inlet from nearby roads.
These guidelines often dictate the location of the air monitoring station. Requirements for locating the probe are summarized in Table 1. For new installations in the Ecology air monitoring network, a Probe Inlet Site Criteria Checklist must be completed once the probe has been installed and the station is operational.
For specific information on monitoring site criteria refer to Title 40, Code of Federal Regulations, Part 581(40 CFR 58) and Washington State Department of Ecology, Air Quality Program, Site Selection and Installation Procedures2.
1 To obtain a copy of 40 CFR Part 58 contact Superintendent of Documents, Government Printing Office, Washington, DC 20402 (phone 202-783-3238). 2 To obtain a copy of Site Selection and Installation Procedures contact the Washington State Department of Ecology, Air Program/Quality Assurance Unit, P. O. Box 47600, P.O. Box 47600, Olympia, WA 98504-7600 (phone 360-407-6837).

4
Table 1 Requirement for Locating the Probe
Distance From Supporting Structures in Meters
Scale Height Above Ground in
Meters Vertical Horizontal
Other Spatial Criteria
Micro 3 ± ½ ≥ 1 ≥ 1
Must be at least 10 meters from nearest intersection and should be at a mid-block location. Must be at least 2 meters and no more than 10 meters from edge of nearest traffic lane. 3. Must have an unrestricted air flow of 270º around the inlet probe, or 180º if located on side of building
Middle and
Neighbor-hood
Between 3 and 15 ≥ 1 ≥ 1
Must have an unrestricted airflow of 270º around the inlet probe, or 180º if located on side of building. 2. Spacing from roads varies with traffic (see 40 CFR Part 58, Appendix E).
2 STATION INSTALLATION
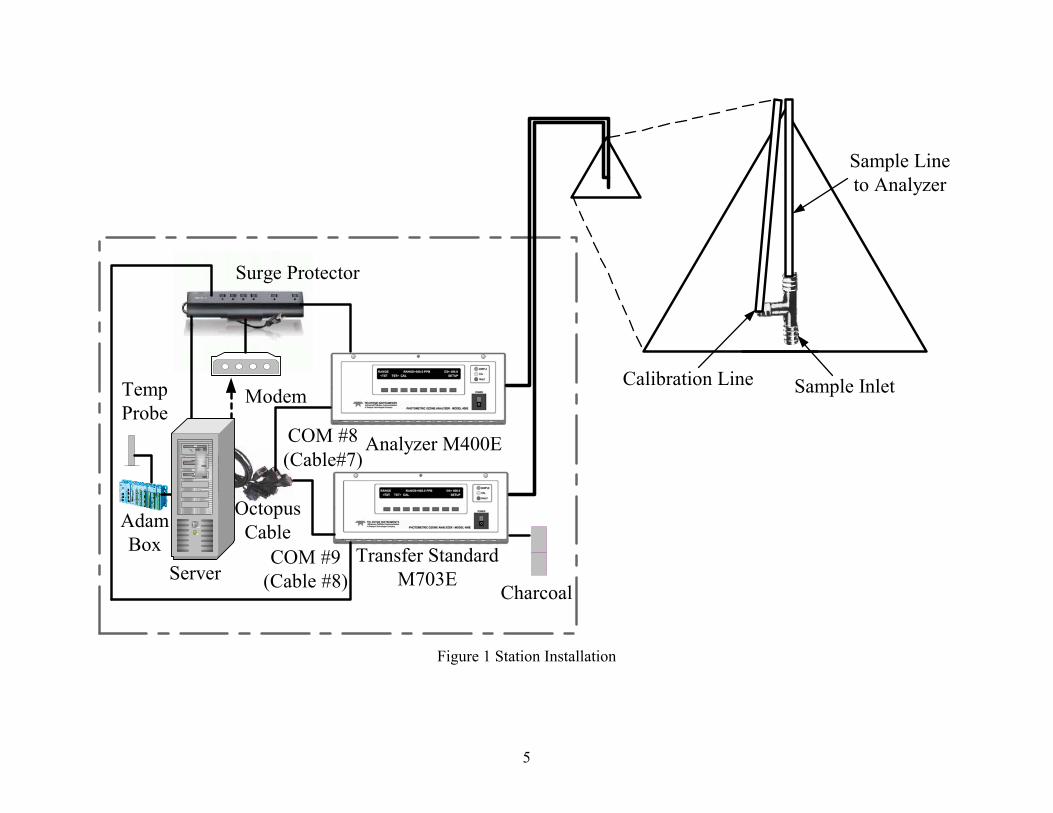
An air monitoring station contains several instruments linked together to form a system that will analyze, record, and store ambient air data (figure 1). Once the structure to house the equipment is ready, the operator must obtain and install required instruments and supplies. For the sampling of ozone, all Ecology sites require;
• An ozone analyzer that has been certified by the EPA as an equivalent reference method.
• An ozone calibrator that has been checked against a primary ozone standard, referred to as an ozone transfer standard, for calibration and precision checks.
• FEP Teflon tubing for sampling lines, ¼ inch (outside diameter).
• A computer server and communication peripherals.
• Calibration report forms and log books.
Modem
Analyzer M400E
Transfer StandardM703E
Charcoal
Surge Protector
TempProbe
Sample Inlet
Sample Lineto Analyzer
Calibration Line
AdamBox
Server
COM #8(Cable#7)
COM #9(Cable #8)
OctopusCable
Figure 1 Station Installation
5

6
• An activated charcoal column to supply zero air. The column removes NO2, O3, hydrocarbons, and various other substances.
• An electronic temperature sensor connected to the server to monitor room temperature.
• The manufacturer's instrument manuals.
In order to collect data and perform necessary maintenance on the equipment, instruments should be placed in a shelter that provides easy access by the station operator. The instruments must not be located against heaters or air conditioners as they may affect their performance.
Station Inspection
A site operator should inspect each air monitoring station every two weeks. The purpose of inspection is to check the condition of the shelter and air monitoring instruments.
Before entering the station, the perimeter should be inspected for damage. Extreme weather conditions, neglected maintenance or vandalism may have resulted in damage to the site since the operator's last visit. Check that the sample probe is intact and has not been damaged.
3 CALIBRATION STANDARDS
In ambient air monitoring applications, precise ozone concentrations called standards are required for the calibration of ozone analyzers. Ozone standards cannot be stored for any practical length of time due to the reactivity and instability of the gas. Therefore, ozone concentrations must be generated and certified on site.
Ozone standards are classified into two basic groups: primary standards and transfer standards.
Primary Standards
The primary standard is used to check the accuracy of ozone transfer standards and analyzers. An ultraviolet (UV) photometer is designated as the primary standard, recognized as the authority capable of generating and measuring ozone concentrations with impeccable accuracy. The concentrations generated by the designated primary ozone standard are recognized as the most accurate ozone concentrations available. It is required that the primary photometer used for the calibration of transfer standards be dedicated exclusively to such use, never used for ambient air sampling and maintained under meticulous conditions.
Ecology’s Primary Ozone Standards are compared against a Standard Reference Photometer in Region 9 on a yearly basis.
Transfer Standards
Transfer standards are used to calibrate the station "field" analyzer and to perform calibration checks. Instruments designated as transfer standards are used so the primary standard can remain at a fixed laboratory location where conditions can be carefully controlled and damage to the instrument minimized. Transfer standards are calibrated against the higher-level, primary
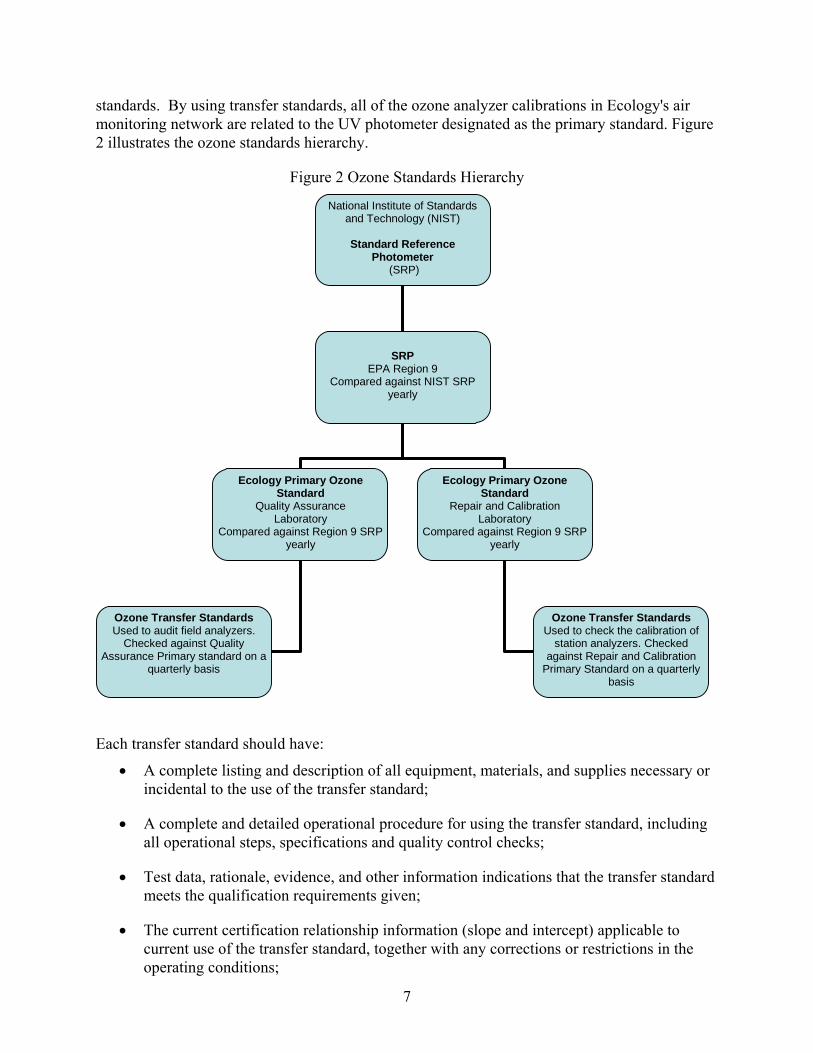
standards. By using transfer standards, all of the ozone analyzer calibrations in Ecology's air monitoring network are related to the UV photometer designated as the primary standard. Figure 2 illustrates the ozone standards hierarchy.
Figure 2 Ozone Standards Hierarchy
National Institute of Standards and Technology (NIST)
Standard Reference
Photometer (SRP)
SRP EPA Region 9
Compared against NIST SRP yearly
Ecology Primary Ozone Standard
Quality Assurance Laboratory
Compared against Region 9 SRP yearly
Ecology Primary Ozone Standard
Repair and Calibration Laboratory
Compared against Region 9 SRP yearly
Ozone Transfer StandardsUsed to check the calibration of
station analyzers. Checked against Repair and Calibration
Primary Standard on a quarterly basis
Ozone Transfer Standards Used to audit field analyzers.
Checked against Quality Assurance Primary standard on a
quarterly basis
Each transfer standard should have:
• A complete listing and description of all equipment, materials, and supplies necessary or incidental to the use of the transfer standard;
• A complete and detailed operational procedure for using the transfer standard, including all operational steps, specifications and quality control checks;
• Test data, rationale, evidence, and other information indications that the transfer standard meets the qualification requirements given;
• The current certification relationship information (slope and intercept) applicable to current use of the transfer standard, together with any corrections or restrictions in the operating conditions;
7
• A logbook including a complete chronological record of all certification and recertification data as well as all ozone analyzer calibrations carried out with the transfer standard.
• An activated charcoal column to supply zero air. The column removes NO2, O3, hydrocarbons, and various other substances;
• The manufacturer's manuals for the instruments.
Qualification, Certification and Recertification
The ozone instruments are calibrated by the Calibration and Repair Laboratory before each ozone season and should not require any physical adjustments during the ozone season.
Qualification consists of demonstrating that the transfer standard is sufficiently stable (repeatable) to be useful as a transfer standard. After a transfer standard has been shown to meet the qualification requirements, certification is required before it can be used.
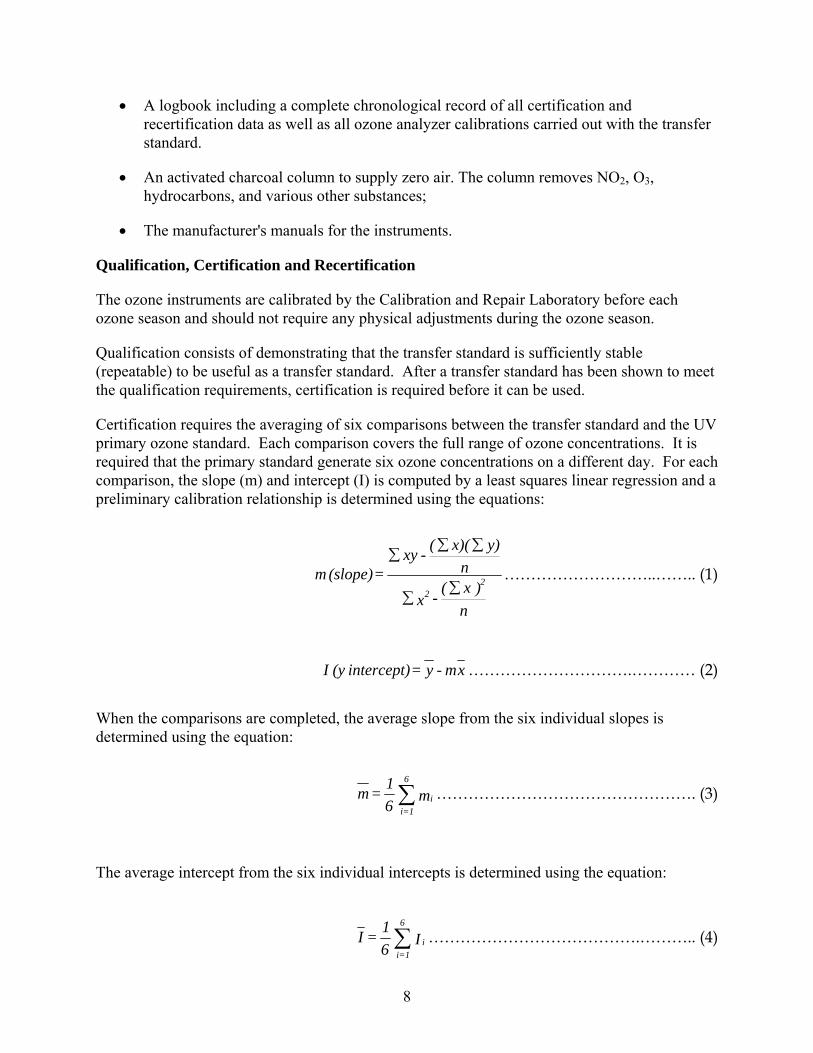
Certification requires the averaging of six comparisons between the transfer standard and the UV primary ozone standard. Each comparison covers the full range of ozone concentrations. It is required that the primary standard generate six ozone concentrations on a different day. For each comparison, the slope (m) and intercept (I) is computed by a least squares linear regression and a preliminary calibration relationship is determined using the equations:
8
nx( - x
)n
-xy = (slope) m 2
2 ∑∑
y)x)(( ∑∑∑
………………………..…….. (1)
………………………….………… (2) xm - y = intercept)(y I
When the comparisons are completed, the average slope from the six individual slopes is determined using the equation:
m 1 = m i
6
∑ …………………………………………. (3) 6 =1i
The average intercept from the six individual intercepts is determined using the equation:
I 61 = I i
6
=1i∑ ………………………………….……….. (4)
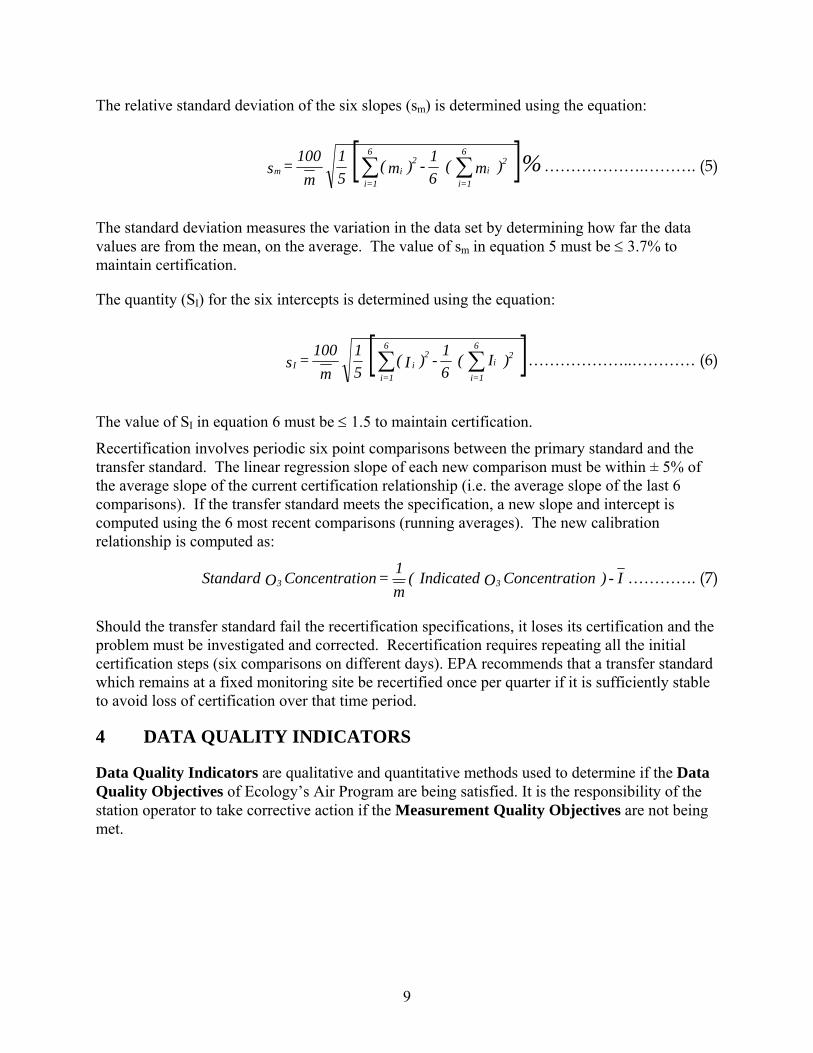
The relative standard deviation of the six slopes (sm) is determined using the equation:
[ ]% )m ( 61 - )m(
51
m100 = s 2
i
6
=1i
2i
6
=1im ∑∑ ……………….………. (5)
The standard deviation measures the variation in the data set by determining how far the data values are from the mean, on the average. The value of sm in equation 5 must be ≤ 3.7% to maintain certification.
The quantity (SI) for the six intercepts is determined using the equation:
[ ] )I ( 1 - )I( 1 100 = s 2i
62
i
6
I ∑∑ 65m =1i=1i
………………..………… (6)
The value of SI in equation 6 must be ≤ 1.5 to maintain certification.
Recertification involves periodic six point comparisons between the primary standard and the transfer standard. The linear regression slope of each new comparison must be within ± 5% of the average slope of the current certification relationship (i.e. the average slope of the last 6 comparisons). If the transfer standard meets the specification, a new slope and intercept is computed using the 6 most recent comparisons (running averages). The new calibration relationship is computed as:
9
I - ) ionConcentrat O Indicated ( m1 = ionConcentrat O Standard 33 …………. (7)
Should the transfer standard fail the recertification specifications, it loses its certification and the problem must be investigated and corrected. Recertification requires repeating all the initial certification steps (six comparisons on different days). EPA recommends that a transfer standard which remains at a fixed monitoring site be recertified once per quarter if it is sufficiently stable to avoid loss of certification over that time period.
4 DATA QUALITY INDICATORS
Data Quality Indicators are qualitative and quantitative methods used to determine if the Data Quality Objectives of Ecology’s Air Program are being satisfied. It is the responsibility of the station operator to take corrective action if the Measurement Quality Objectives are not being met.
10
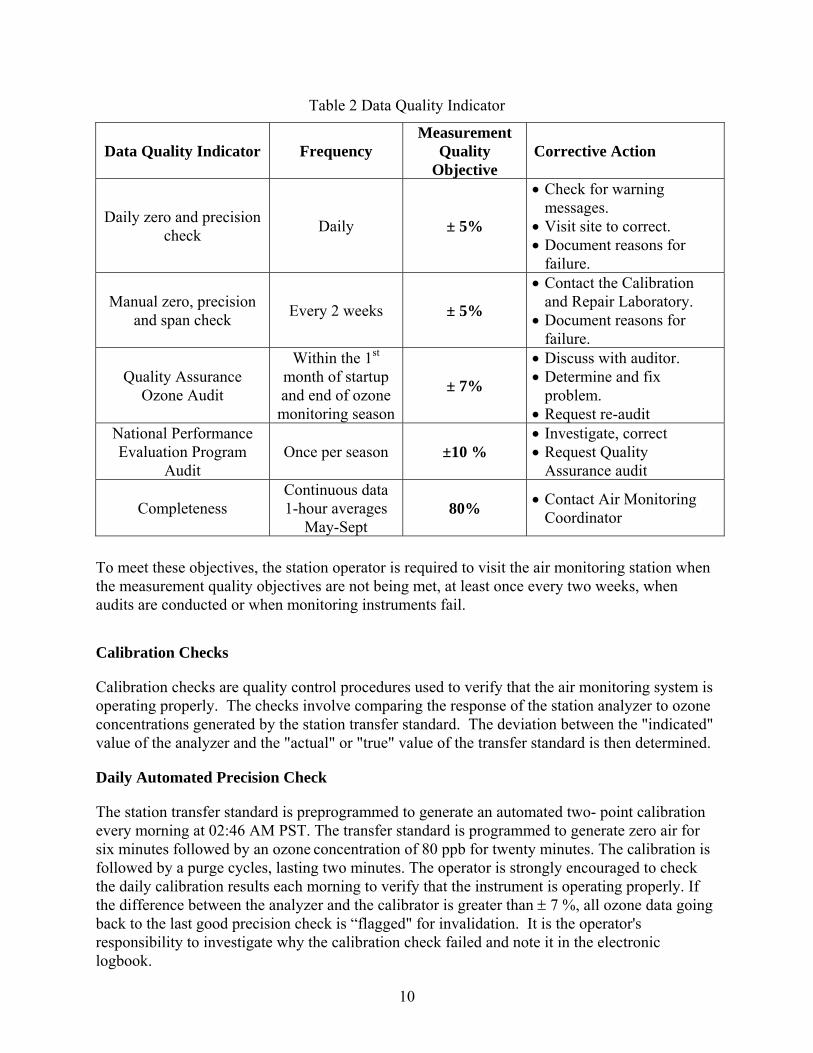
Table 2 Data Quality Indicator
Data Quality Indicator Frequency Measurement
Quality Objective
Corrective Action
Daily zero and precision check Daily ± 5%
• Check for warning messages.
• Visit site to correct. • Document reasons for
failure.
Manual zero, precision and span check Every 2 weeks ± 5%
• Contact the Calibration and Repair Laboratory.
• Document reasons for failure.
Quality Assurance Ozone Audit
Within the 1st month of startup and end of ozone monitoring season
± 7%
• Discuss with auditor. • Determine and fix
problem. • Request re-audit
National Performance Evaluation Program
Audit Once per season ±10 %
• Investigate, correct • Request Quality
Assurance audit
Completeness Continuous data 1-hour averages
May-Sept 80% • Contact Air Monitoring
Coordinator
To meet these objectives, the station operator is required to visit the air monitoring station when the measurement quality objectives are not being met, at least once every two weeks, when audits are conducted or when monitoring instruments fail.
Calibration Checks
Calibration checks are quality control procedures used to verify that the air monitoring system is operating properly. The checks involve comparing the response of the station analyzer to ozone concentrations generated by the station transfer standard. The deviation between the "indicated" value of the analyzer and the "actual" or "true" value of the transfer standard is then determined.
Daily Automated Precision Check
The station transfer standard is preprogrammed to generate an automated two- point calibration every morning at 02:46 AM PST. The transfer standard is programmed to generate zero air for six minutes followed by an ozone concentration of 80 ppb for twenty minutes. The calibration is followed by a purge cycles, lasting two minutes. The operator is strongly encouraged to check the daily calibration results each morning to verify that the instrument is operating properly. If the difference between the analyzer and the calibrator is greater than ± 7 %, all ozone data going back to the last good precision check is “flagged" for invalidation. It is the operator's responsibility to investigate why the calibration check failed and note it in the electronic logbook.

11
Manual Zero, Precision and Span Check
Every two weeks the station operator should go to the monitoring station and perform a manually initiated calibration check on the station analyzer. The operator is required to check the instrument test functions, manually start the ozone transfer standard, and program it to generate zero air, ozone concentrations of 80 ppb (the precision) and 200 ppb (the span). While each concentration is measured by the transfer standard (the actual or true value) and the station analyzer (the indicated value), the operator records the measured responses on the Monthly Precision Check Summary Form (see Appendix).
A manual calibration check should never be performed on days when high ozone concentration is forecast for the region.
Following the manual calibration check, the deviation from the true ozone value is determined using the equation provided on the form. If the deviation is greater than ± 5%, the cause for the error must be investigated and corrected. If the results of the calibration check exceed the ± 7% limit, the data recovered since the previous calibration check is subject to invalidation. The results are compared to subsequent calibration checks to detect possible analyzer drift or a change in the response.
The station operator has the primary responsibility for distinguishing valid measurements from indications caused by malfunctioning instruments or source interferences.
Telemetry
The telemetry system is used by station operators to scan data transmitted from the monitoring station to a central location. This enables the operator to "call" the central location and examine the data recorded at the monitoring station (e.g. ozone concentrations and station temperature). The station operator should be familiar with daily concentration variations (i.e. the times daily maximum concentrations occur and the interrelationship of ozone). By recognizing abnormal data, the operator is alerted that the instruments may not be operating properly and a station visit may be necessary. However, monitoring a station by telemetry is not to be substituted for the bi-monthly station visit.
5 EQUIPMENT AND MAINTENANCE
It is the operator's responsibility to maintain the monitoring station. Routine maintenance includes keeping the interior and exterior of the shelter clean and being observant of potential problems. Examples of potential problems include:
• Water leaking into the structure;
• Shelter temperature exceeding the parameters;
• Accumulation of dirt and debris;
• Infestation by rodents or insects; and
• Overgrowth of vegetation around the shelter.

12
Each instrument must be periodically examined and serviced to anticipate and prevent instrument failure. Scheduled maintenance on the instruments will prevent costly repairs and loss of data. The routine maintenance required on the instruments by the station operator is minimal. By keeping track of the instruments responses from week to week, trends can be observed which would alert the operator of a potential problem and to correct the situation before the instrument fails.
Ecology’s air monitoring network uses the Teledyne API M400E analyzer and M703E calibrator. Each instrument comes with a Teledyne operation manual.
Due to the reactivity of ozone, Ecology uses quarter inch (outside diameter) FEP Teflon tubing for the sample intake line. It is important that the sample line be as short as possible and kept clean. No matter how non reactive the sample line material is initially, after a period of use reactive particulate matter is deposited on the line walls. Dirt, insects, cobwebs, and moisture can accumulate in the sample line and on the sample intake filter. These contaminates absorb ozone in the ambient air sample as it flows through the sample line resulting in a reduced ozone concentration.
6 QUALITY ASSURANCE
Performance Audits
During each calendar quarter, utilizing the procedures and calculations specified in 40 CFR 58, Appendix A, "Quality Assurance Requirements for State and Local Air Monitoring Stations (SLAMS)," at least 25% of the operating automated analyzers will be audited.
System Audits
The systems audit is an on-site review and inspection of the entire ambient air monitoring program to assess its compliance with established regulations governing the collection, analysis, validation, and reporting of ambient air quality data. A systems audit will be performed annually by the Quality Assurance Coordinator. To provide uniformity in the evaluation, the criteria and procedures specified in EPA's Quality Assurance Handbook for Air Pollution Measurement Systems, Volume II, Section 2.0.11 will be applied.
7 DATA RECORDING, VALIDATION AND REPORTING
For detailed information on handling, recording, and validating air monitoring data, refer to Ecology's Automated Method Data Documentation and Validation Procedures.
All data will be reviewed using three tables of criteria, (where each table has a different degree of implication about the quality of the data) and certified by Quality Assurance prior to being reported or used to make decisions concerning air quality, air pollution abatement or control.
8 DATA QUALITY ASSESSMENT
For each calendar quarter and year, the Quality Assurance Unit will prepare data precision, accuracy and completeness reports for the Program Manager and EPA.

13
Precision
The precision will be evaluated and reported employing the frequencies, procedures and calculations in 40 CFR Part 58, Appendix A, "Quality Assurance Requirements for State and Local Air Monitoring Stations (SLAMS)".
Accuracy
Using results from the performance audits and the calculations specified in 40 CFR 58, Appendix A, "Quality Assurance Requirements for State and Local Air Monitoring Stations". The accuracy will be evaluated and reported.
Data Completeness
The completeness of the data will be determined for each monitoring instrument and expressed as a percentage. Percent valid data will be a gauge of the amount of valid data obtained from the monitoring instrument, compared to the amount expected under ideal conditions (24 hours per day, 365 days per year). Exceptions will be made for analyzers which have a seasonal sampling period, which were not installed at the beginning, or which were discontinued prior to the end of any reporting period for calculation purposes.
9 REFERENCES 1) Air Pollution Training Institute, Course 435 Atmospheric Sampling, Student Manual, Second Edition, Research Triangle Park, NC. 1983.
2) McElroy, F.F., Transfer Standards for the Calibration of Ambient Air Monitoring Analyzers for Ozone, Research Triangle Park, NC. 1979.
3) McElroy, F.F., R.J. Paur, Technical Assistance Document for the Calibration of Ambient Ozone Monitors, Research Triangle Park, NC. 1979.
4) Rehme, K.A., Smith C.F., and Paur, R.J., Standard Reference Photometer for Verification and Certification of Ozone Standards User's Guide, Research Triangle Park, NC. 1989.
5) Teledyne Instruments, Instructional Manual Ozone Analyzer Model 400E, San Diego, CA. 2006
6) Teledyne Instruments, Operator’s Manual Model 703E Photometric O3 Calibrator, San Diego, CA. 2006
7) Washington State Department of Ecology, Air Quality Program, Site Selection and Installation Procedures, Lacey, WA. Oct. 1993.
APPENDIX A OPERATING PROCEDURES
A.1 General Information
The Teledyne Air Pollution Instruments Model M400E Ozone Analyzer measures ozone in ambient air while the Model 703E Ozone Calibrator/Transfer Standard (referred to transfer standard thereafter in this document) is used only to check the calibration of the M400E. Both instruments are microprocessor controlled. The instruments require an environment where stable temperatures, pressures and flows be maintained in order to accurately measure ozone.
The instruments have the ability to reject interferences from SO2, NO and H2O. However, hydrocarbons and mercury vapor may cause problems for the instruments. Examples include hydrocarbons contained in dense smoke generated from a fire or mercury vapor from a broken mercury thermometer.
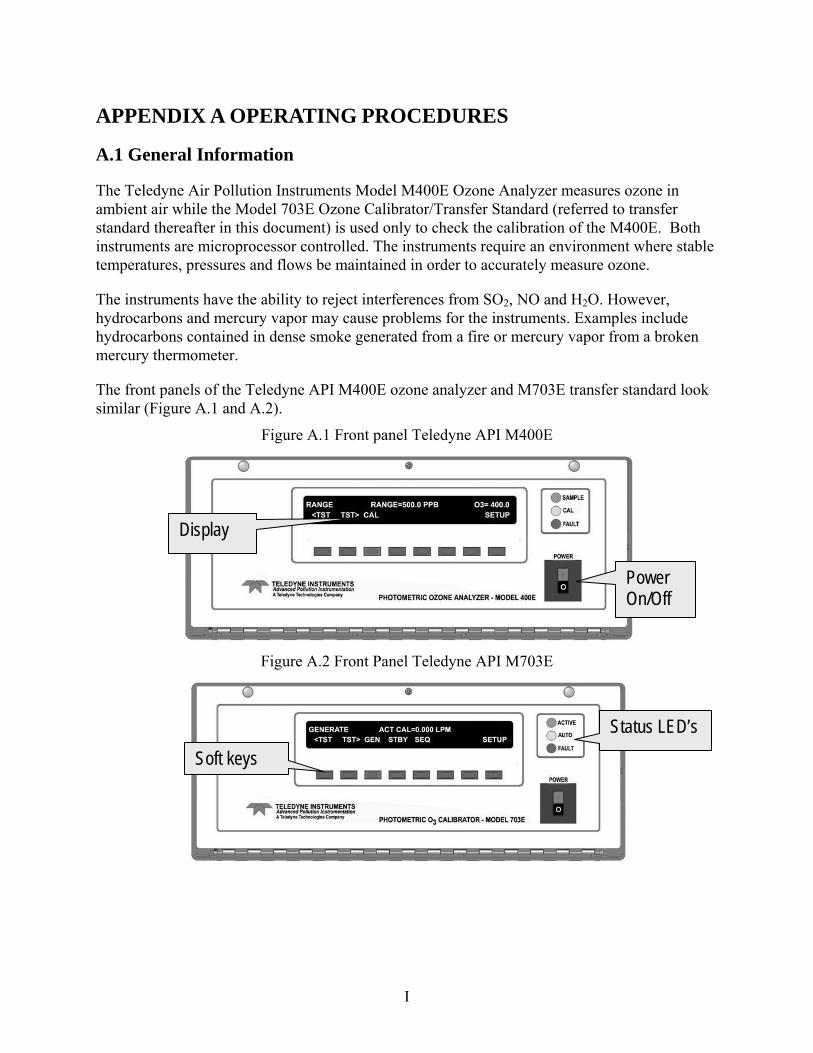
The front panels of the Teledyne API M400E ozone analyzer and M703E transfer standard look similar (Figure A.1 and A.2).
Figure A.1 Front panel Teledyne API M400E
Display
Power On/Off
Figure A.2 Front Panel Teledyne API M703E
Status LED’s Soft keys
I

A.2 Inspection
Before installing the instruments, verify that there is no external or internal shipping damage and inspect the interior of the instruments to make sure all circuit boards and other components are in place.
Remove the top cover of the instrument (identical steps for either the analyzer or the transfer standard):
• Remove the set screw located in the top, center of the front panel (black, may have already been taken off);
• Remove the TWO screws fastening the top cover to the unit (one per side, stainless);
• Slide the cover back and lift the cover straight up.
If any damage is observed, contact Ecology’s Calibration and Repair Laboratory.
A.3 Installation
The instruments should be placed on a stable surface with at least 4 inches clearance in the back and 1 inch clearance for the sides, above and below. In order to prevent dust from getting into the gas flow lines, both instruments are shipped with small plugs inserted into each of the open inlets on the back panel. Remove these plugs and connect them as instructed below (Figure A.3 and A.4):
Figure A.3 API M400E Analyzer Rear Panel Connection
Exhaust To sample probe
To #7 channel of the Octopus Cable (Com port # 8)
To 120 VAC outlet
• Connect the SAMPLE port to the sampling line of the sample probe;
• Connect EXHAUST port to vent outside;
• Connect RS232 port to #7 channel of the Octopus Cable (COM port #8);
• Connect the power cords to the instruments and the male end of the cord to a 120 VAC surge protected power source.
II

Figure A.4 API M703E Transfer Standard Rear Panel Connection
III
• Cap one of the ports marked CAL GAS OUT, cap the VENT port, and cap the ZERO AIR IN port (done before shipment);
• Use a short length of ¼ inch Teflon tubing and fittings to connect the PHOTO ZERO IN port with the PHOTO ZERO OUT port (done before shipment);
• Use a short length of ¼ inch Teflon tubing and fittings to connect the PHOTO IN port with the PHOTO OUT port (done before shipment);
• Connect a charcoal column to the port marked DRY AIR IN;
• Connect one of the ports marked CAL GAS OUT to the calibration line of the sample probe;
• Connect EXHAUST port to a suitable vent outside;
• Connect RS232 port to a #8 channel of the Octopus Cable (COM port #9);
• Connect the power cords to the instruments and the male end of the cord to a 120 VAC surge protected power source.
Remember to:
• Always vent the exhaust to a suitable area where there is good ventilation.
• Never pressurize the instruments.
• Only use PTFE (Teflon), FEP or stainless for sample lines and fittings.
• Do not stack instruments.
• Make sure that air conditioners and heaters are not blowing directly on the instrument.
Exhaust To charcoal column Port is pre-capped
Ports pre-connected using ¼ inch Teflon tubing
To #8 channel of the Octopus Cable (Com port # 9)
To 120 VAC outlet To sample probe
A.4 Operation
A.4.1 Startup
A.4.1.1 M703E Transfer Standard Startup
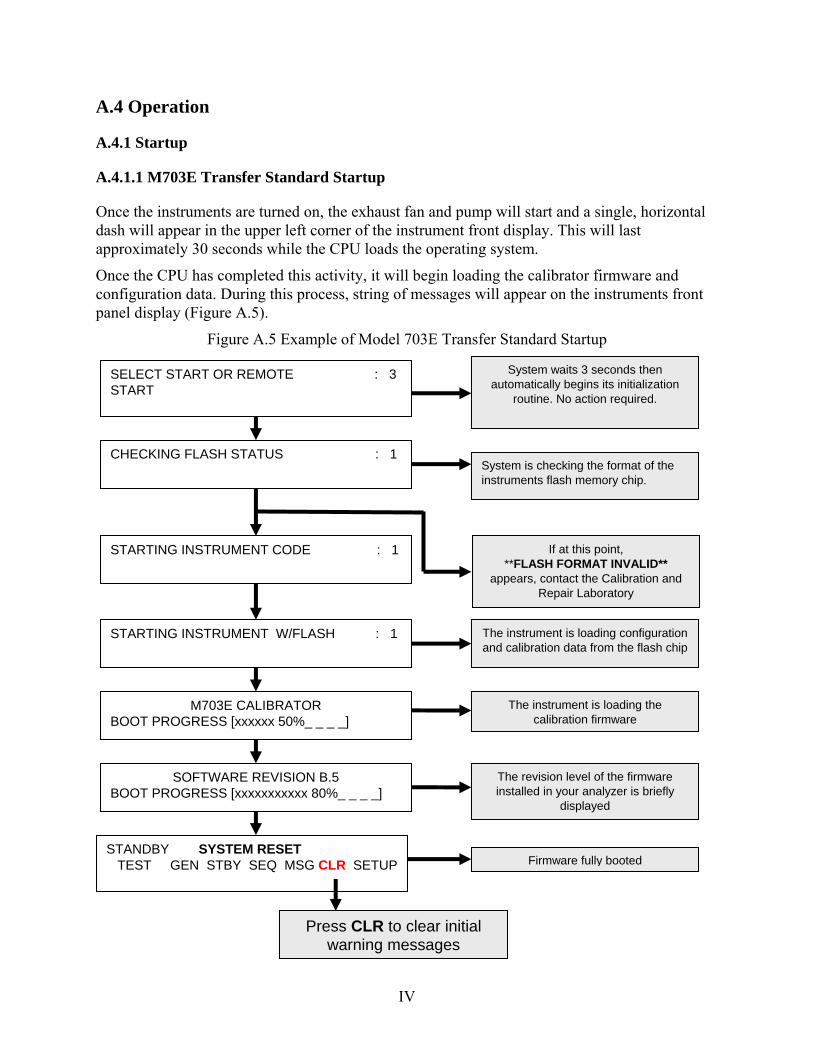
Once the instruments are turned on, the exhaust fan and pump will start and a single, horizontal dash will appear in the upper left corner of the instrument front display. This will last approximately 30 seconds while the CPU loads the operating system.
Once the CPU has completed this activity, it will begin loading the calibrator firmware and configuration data. During this process, string of messages will appear on the instruments front panel display (Figure A.5).
Figure A.5 Example of Model 703E Transfer Standard Startup
System waits 3 seconds then automatically begins its initialization
routine. No action required.
CHECKING FLASH STATUS : 1
STARTING INSTRUMENT CODE : 1
STARTING INSTRUMENT W/FLASH : 1
M703E CALIBRATOR BOOT PROGRESS [xxxxxx 50%_ _ _ _]
STANDBY SYSTEM RESET TEST GEN STBY SEQ MSG CLR SETUP
System is checking the format of the instruments flash memory chip.
The instrument is loading configuration and calibration data from the flash chip
The instrument is loading the calibration firmware
The revision level of the firmware installed in your analyzer is briefly
displayed
SOFTWARE REVISION B.5 BOOT PROGRESS [xxxxxxxxxxx 80%_ _ _ _]
Firmware fully booted
Press CLR to clear initial warning messages
If at this point, **FLASH FORMAT INVALID**
appears, contact the Calibration and Repair Laboratory
SELECT START OR REMOTE : 3 START
IV

After completing the boot-up sequences and the SYSTEM RESET warning message has been cleared, the M703E calibrator should automatically switch to STANDBY. Because internal temperatures and other conditions may be outside the specified limits during the instrument warm-up period, the software will suppress most warning conditions for 30 minutes after power up. The instruments require about thirty minutes for all internal components to come up to temperature before reliable ozone measurements can be taken. The green ACTIVE Light Emitting Diode (LED) on the front panel should be on.
A.4.1.2 M400E Analyzer Startup
The M400E analyzer has the similar start-up screen as the M703E transfer standard (Figure A.6). Figure A.6 Example of Model 400E Ozone Analyzer Startup
System waits 3 seconds then automatically begins its initialization
routine. No action required.
CHECKING FLASH STATUS : 1
STARTING INSTRUMENT CODE : 1
STARTING INSTRUMENT W/FLASH : 1
M400E O3 ANALYZER BOOT PROGRESS [xxxxxx 50%_ _ _ _]
SAMPLE SYSTEM RESET O3 = XXX <TST TST> CAL CLR SETUP
System is checking the format of the instruments flash memory chip.
If at this point, **FLASH FORMAT INVALID** appears, contact Repair and
Calibration Laboratory.
The instrument is loading configuration and calibration data from the flash chip
The instrument is loading the calibration firmware
The revision level of the firmware installed in your analyzer is briefly
displayed
SOFTWARE REVISION E.0 BOOT PROGRESS [xxxxxxxxxxx 80%_ _ _ _]
Firmware fully booted. Green SAMPLE LED on the front panel should be on, and the red FAULT LED should be
flashing, indicating a SYSTEM RESET fault. This is normal
Press CLR to clear initial warning messages
SELECT START OR REMOTE : 3 START
Press the CLR soft key to clear the SYSTEM RESET and the M400E analyzer should V

automatically switch to SAMPLE mode. The word SAMPLE in the upper left corner may flash on and off for several minutes as the unit warms up. The display may indicate a value of XXXX in the O3 concentration field (upper right corner) when it is just turned on. It will show an actual concentration after 30 minutes. Because internal temperatures and other conditions may be outside the specified limits during the analyzers warm-up period, the software will suppress most warning conditions for 30 minutes after power up. The instruments require about thirty minutes for all internal components to come up to temperature before reliable ozone measurements can be taken. The green SAMPLE LED on the front panel should be on.
A.4.2 Status LED’s
The Status LED’s are located on the front panel of the instruments in the upper right corner. During normal operation, the M400E Sample LED will indicate green to indicate the instrument is operating properly (Figure A.7). No LED’s on the M703E will be lit (as it is always in the standby mode) until a manual or automatic calibration is initiated. Whenever the M703E is activated (such as for a manual calibration check), the green ACTIVE LED on the M703E will be displayed.
Figure A.7 Status LED
SAMPLE
CAL
FAULT
ACTIV
AUTO
FAULT
Example of M400E in the active mode
status.
Example of M703E in standby
ACTIV
AUTO
FAULT
Example of M400E or M703E in fault
mode
The FAULT LED on both instruments should glow red only when first turning on the instruments and during the warm up period (usually this takes less than 30 minutes). The fault light should turn off once the fault message is cleared. If the red LED continues to flash a MSG warning, contact the Calibration and Repair Laboratory.
A.4.3 Instrument Test Functions
The test functions are viewed from the front panel and can be used to isolate and identify several operational problems when combined with a thorough understanding of the instruments (Figure A.8). Tables A.1 and A.2 list the most important test functions which the operator should check and record when performing a manual check. For the full list of test function, refer to the manufacture M400E manual Appendix A (Page A-18) and M703E manual Appendix A (Page A-17).
VI

Figure A.8 Test Function Keys
Test Function Keys
Table A.1 M400E Important Test Functions
Test Functions Description Acceptable limits RANGE Data range 500 ppb STABIL Concentration stability <0.5 ppb O3 REF Photometer detector reference
reading 3000-4800 mV
PRES Sample pressure 27.0-29.9 In-Hg-A SAMP FL Sample flow rate 720-880 cc/min
BOX TEMP Internal chassis temperature 20-40 ºC SLOPE Slope for current range, computed
during zero/span calibration 0.85-1.15
OFFSET Offset for current range, computed during zero/span calibration
0±3 ppb
Table A.2 M703E Important Test Functions
Test Functions Description Valid Range ACT Actual concentration being generated,
computed from real-time inputs Varies
TARG Target concentration to generate Varies OUTPUT FLOW Output flow rate 3.0-4.0 LPM
BOX TEMP Internal chassis temperature 20-40 ºC PHOTO
REFERENCE Photometer detector reference reading
3000-4800 mV
PHOTO FLOW Photometer sample flow rate 0.72-0.88 LPM PHOTO SPRESS Photometer sample pressure 27.0-29.9 In-Hg-A PHOTO SLOPE Photometer slope computed during
zero/span bench calibration 0.85-1.15
PHOTO OFFSET Photometer offset computed during zero/span bench calibration
0±3 ppb
A.4.4 Backpressure
VII
When first installing the M703E transfer standard, a zero check must be performed (see section A4.5.2). If the M703E indicates a stable but non-zero concentration when generating zero air, backpressure compensation to the M703E may be required. Contact the Calibration and Repair

VIII
Laboratory to perform site specific backpressure compensation diagnostic. This discrepancy experienced by the instrument is site specific but once corrected should compensate for any offsets the transfer standard experiences at the site due to pressure. If the M703E does not attain a stable zero, the Calibration and Repair Laboratory must be contacted to investigate the situation.
REMEMBER! THIS STEP NEEDS TO BE PERFORMED ONLY WHEN FIRST INSTALLING THE M703E AT A MONITORING SITE.
A.4.5 Zero, Precision and Span Check
The most important measurement quality objective is that the analyzer is operating properly. It is the responsibility of the station operation to check the status of the analyzer on a routine basis, either by computer or by physically going to the air monitoring station.
The manual quality control check requires the station operator to press specific keys on the M703E transfer standard to generate various ozone concentrations. The ozone concentrations are used to check the calibration of the M400E ozone analyzer. The corresponding readings must be recorded on the Calibration Check Sheet (Table A.3) and electronic logbook.

Table A.3 Calibration Check
Site Name: Cando Utoo AIRS #: 53-054-0001
Date: June 21, 2008 Operator: Jack Sparrow
Disabled at: 0900 PST Enabled at: 1045 PST
Transfer Standard SN#: 72 Analyzer SN#: 1349
Parameter Range Reading Within Range Parameter Range Reading Within
Range Output Flow
(LPM) 3.0-4.0 3.4 √ O3 REF (mv) 3000-4800 4312.0 √
Box Temp (ºC) 20-40 31.1 √ PRES (in-Hg-A) 27.0-29.9 27.9 √
Photo Reference (mV)
3000-4800 4485.8 √ SAMP FL (cc/m) 720-
880 767 √ Photo Flow
(LPM) 0.72-0.88 .8592 √ BOX TEMP (ºC) 20-40 27.7 √
Photo Pressure (In-Hg-A)
27.0-29.9 28.9 √ Slope See Cal.
Sheet 1.024 √
Photo Slope See Cal. Sheet 1.006 √ Offset (ppb) See Cal.
Sheet -0.7 √
Photo Offset (ppb)
See Cal. Sheet -0.8 √
Please mark here if a filter is changed √
ANALYZER TRANSFER STANDARD Setting (ppb) Stability1
(ppb) Indicated
(ppb) Actual (ppb)
Difference2 (%)
0 0.3 1.1 0 N/A 80 0.2 83.2 80 4.0 200 0.1 207.1 200 3.6
1Stability should ≤ 0.3 ppb
IX
2Difference (%) = 100% x Actual StandardTransfer
Actual StandardTransfer - IndicatedAnalyzer
The difference must be within ± 7%. If it is greater than ± 5%, the cause needs to be investigated. Contact the Calibration and Repair Laboratory for assistance.
Information in the last table (Shaded) should be recorded into the electronic log book along with your routine maintenance information (e.g. cleaning the line, changing the filter, etc.).

A.4.5.1 Offscan channels
Once at the station, check the status LED of the M400E. The Green LED on the M400E should be on, while on the M703E no LED’s will be on as the M703E should be in the STDBY mode.
Please OFFSCAN O3 (Channel 6), O3 TS ACT CONC (Channel 19) and O3 TS TARG CONC (Channel 20) on ENVIDAS DYNAMIC TABULAR through your laptop before you perform a manual calibration check and other maintenances listed in the A.5 section. Set all channels back to ORIGINAL before leaving the site.
A.4.5.2 The zero check
Begin the quality control check control by pressing GEN on M703E followed by AUTO then 0 0 0 0 ppb O3 ENTR to generate clean (zero) air (Figure A.9)
After ENTR is pressed, the pump in the M703E draws in ambient air purified by the external activated carbon column. The charcoal column should sufficiently cleanse the air of contaminants likely to cause a detectable response on the analyzer.
Figure A.9 Generating Zero Air
STANDBY ACT = STANDBY <TST TST> GEN STBY SETUP
GENERATE GENERATE AUTO EXIT
Press AUTO
Press GEN
GENERATE GENERATE: 0 ppb O3 0 0 0 0 PPB O3 ENTR EXIT
GENERATE ACT = 0 PPB O3 <TST TST> GEN STBY SETUP
The display is the actual O3 concentration measured by the M703E
Toggle the soft keys to set the
target concentration.
Then Press ENTR
Once both instruments stabilize, use the Calibration Check Sheet to record the concentration displayed by the M703E and the M400E in the “0 ppb” line. The stability can be judged by toggling <TST TST> soft key on M400E analyzer till STABIL is displayed. If STABIL reading is less than 0.3 ppb, both instruments are considered to be stable. The displayed concentrations on the analyzer (O3=) and transfer standard (ACT) together with the stability (STABIL) reading shown on the analyzer should be recorded on the calibration check sheet.
The output flow generated by the M703E is preset in the laboratory and can be checked by pressing the <TST TST> soft key several times until OUTPUT FLOW is displayed.
X
The minimum output flow should equal the flow requirements of the ozone analyzer being checked plus at least 1.0 LPM excess flow. If the analyzer to be calibrated has a flow of 800 cc/min, the proper OUTPUT FLOW of the M703E should be set at a minimum of 2.6 LPM. (l LPM + 800 cc + 800 cc = 2.6 LPM). The transfer standard must run between 3-4 LPM with best around 3.5 LPM. If the flow rate is outside of range, adjust the output flow rate.
• SETTING THE M703E’S OUTPUT FLOW RATE:
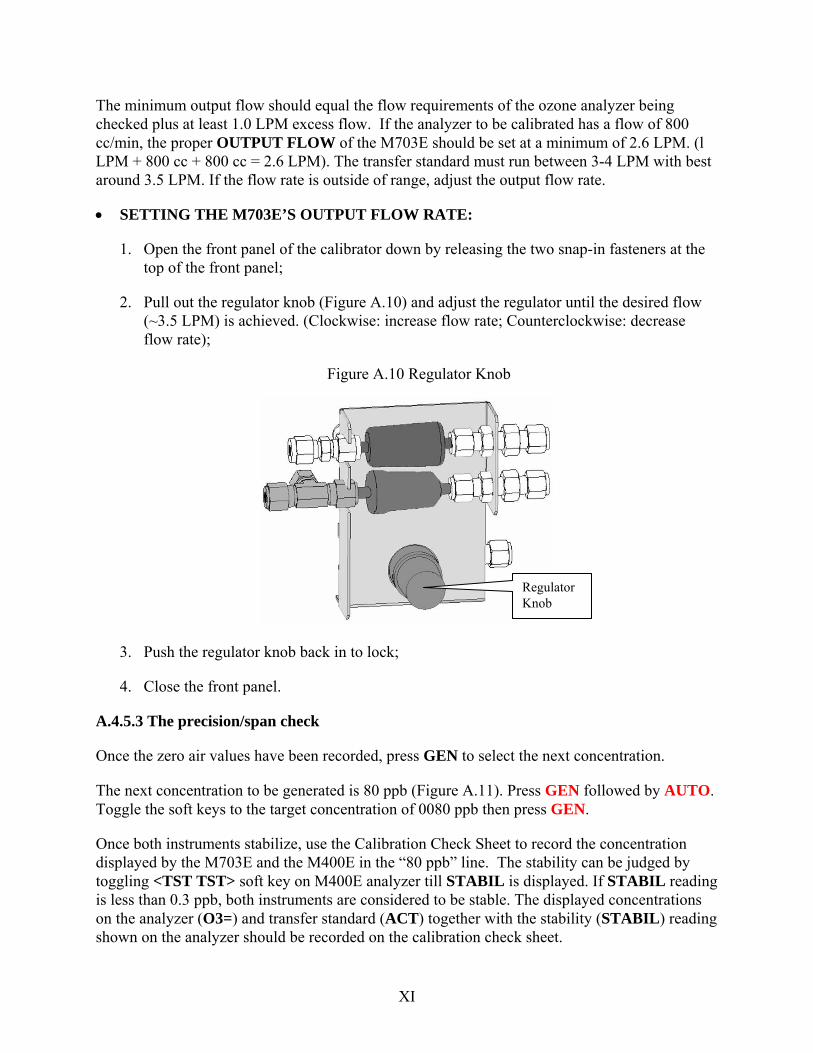
1. Open the front panel of the calibrator down by releasing the two snap-in fasteners at the top of the front panel;
2. Pull out the regulator knob (Figure A.10) and adjust the regulator until the desired flow (~3.5 LPM) is achieved. (Clockwise: increase flow rate; Counterclockwise: decrease flow rate);
Figure A.10 Regulator Knob
Regulator Knob
3. Push the regulator knob back in to lock;
4. Close the front panel.
A.4.5.3 The precision/span check
Once the zero air values have been recorded, press GEN to select the next concentration.
The next concentration to be generated is 80 ppb (Figure A.11). Press GEN followed by AUTO. Toggle the soft keys to the target concentration of 0080 ppb then press GEN.
Once both instruments stabilize, use the Calibration Check Sheet to record the concentration displayed by the M703E and the M400E in the “80 ppb” line. The stability can be judged by toggling <TST TST> soft key on M400E analyzer till STABIL is displayed. If STABIL reading is less than 0.3 ppb, both instruments are considered to be stable. The displayed concentrations on the analyzer (O3=) and transfer standard (ACT) together with the stability (STABIL) reading shown on the analyzer should be recorded on the calibration check sheet.
XI

Figure A.11 Generating 80 ppb Ozone
XII
The final concentration to be generated is 200 ppb (Figure A.12). Press GEN followed by AUTO. Toggle the soft keys to the target concentration of 0200 ppb then press GEN.
Figure A.12 Generating 200 ppb Ozone
Once both instruments stabilize, use the Calibration Check Sheet to record the concentration displayed by the M703E and the M400E in the “200 ppb” line. The stability can be judged by toggling <TST TST> soft key on M400E analyzer till STABIL is displayed. If STABIL reading is less than 0.3 ppb, both instruments are considered to be stable. The displayed concentrations
Press GEN to select next
concentration
GENERATE ACT = 80 PPB O3 <TST TST> GEN STBY SETUP
GENERATE GENERATE AUTO EXIT
Toggle the soft keys to set the
target concentration.
Then press ENTR
Press AUTO
GENERATE GENERATE: 200 PPB O3 0 2 0 0 PPB O3 ENTER EXIT
GENERATE ACT = 200 PPB O3 <TST TST> GEN STBY SETUP
The display is the actual O3 concentration measured by the M703E
GENERATE ACT = 0 PPB O3 <TST TST> GEN STBY SETUP
GENERATE GENERATE AUTO EXIT
Press GEN to select next
concentration
Toggle the soft keys to set the
target concentration.
Then press ENTR
Press AUTO
GENERATE GENERATE: 80 PPB O3 0 0 8 0 PPB O3 ENTER EXIT
GENERATE ACT = 80 PPB O3 <TST TST> GEN STBY SETUP
The display is the actual O3 concentration measured by the M703E
XIII
on the analyzer (O3=) and transfer standard (ACT) together with the stability (STABIL) reading shown on the analyzer should be recorded on the calibration check sheet.
After finishing the precision check, please press STBY. Otherwise, the M703E will continue to generate ozone until the STBY button is pressed.
Determine the difference between the analyzer and the transfer standard using the equation in the Calibration Check Sheet. If the difference is greater than ± 5% or if the zero reading is greater than ± 3 ppb, the Calibration and Repair Laboratory should be notified. If the results of the calibration check exceed ± 7%, the data recovered since the previous calibration check is subject to invalidation. Once the problem is identified and corrected, a calibration check must be performed to demonstrate that the system is operating properly.
A.5 Maintenance
Major maintenance and repairs on the instruments will be performed at the Calibration and Repair Laboratory in the Ecology headquarters. However, the station operator is still required to perform a minimum amount of routine maintenance on the instruments. The maintenance is required to be recorded in the electronic log book.
A.5.1 Cleaning/Replacing the Sample Lines
A routine cleaning or replacement of the sample lines is required before the beginning of the ozone monitoring season or if the operator suspects a loss in ozone concentrations due to contamination.
To clean the sample lines, disconnect the Teflon tubing from the port marked CAL GAS OUT on the M703E transfer standard and the port marked SAMPLE on the M400E analyzer. Inject both lines with a soapy water solution (a syringe works well) and push the liquid through the line using a small pump, air compressor or cylinder air. Do this process several times and then flush the lines with clean water. Using the clean air source, blow air through the tubing for several minutes to remove all the water from the sample lines and then reconnect the tubing to the instruments. Condition the probe by generating an ozone concentration of 800 ppb for at least 30 minutes (the length of time may vary due to the length of the inlet probe). This procedure is followed by a span check at 200 ppb to confirm that the sample line has been properly conditioned and the analyzer and transfer standard agree (≤ ±5%).
A.5.2 Replacing the Particulate Filter
A Teflon filter is used to keep dirt from entering the analyzer. The filter must be checked during each station visit and changed when it becomes noticeably dirty. Slow analyzer response during a calibration check may indicate a dirty filter.
The Teflon filter is located inside the analyzer and the filter holder is mounted to the left side of the front panel. It is accessed by removing the Phillip-head screw at the top-center of the front panel. Pull the two black pegs on the top of the front panel of the analyzer until the front panel opens allowing the front panel to fold down.

To replace the Teflon filter (Figure A.13);
1. Unscrew the black rim around the glass piece and remove the glass cover;
2. Remove the large o-ring and cut-outs that holds the filter in place;
3. Remove the old filter and replace with a new filter, paying attention to place the Teflon coated side of the filter downward in the holder;
4. Place the cut-out and o-ring on the filter;
5. Place the glass cover on the o-ring and screw the black rim onto the filter holder;
6. Lift the front cover to close the instrument by pushing the black pegs into place.
Figure A.13 Replacing the Particulate Filter
After changing the filter, it is recommended to perform a leak check to make sure that filter is sitting well in its housing.
1. Turn the analyzer ON, and allow enough time for flows to stabilize;
XIV

2. Cap the sample inlet port with a Teflon Cap (Do not use a metal cap);
3. After 2 minutes, when the pressures have stabilized, note the SAMP FL test function reading on the front panel (toggle the <TST TST> key till SAMP FL appears on the screen);
4. If SAMP FL < 10 CC/M then the analyzer is free of any large leaks.
A concentration of 800 ppb is required to be generated by the ozone transfer standard for approximately 30 minutes to remove any potential contaminations on the particulate filter. This procedure is followed by a span check at 200 ppb to confirm that the filter has been properly conditioned and the analyzer and transfer standard agree (≤ ±3%).
A.5.3 Adjusting the UV Source lamp
This procedure should be done whenever the O3 REF (M400E analyzer) or Photo Reference (M703E transfer standard) value drops below 3000 mV.
1. Make sure the analyzer/transfer standard is warmed-up and has been running for at least 15 minutes before proceeding;
2. Remove the cover from the analyzer/transfer standard (please see A.2 instruction to remove the cover);
3. Locate the Optical Bench Assembly inside of analyzer/transfer standard;
4. Locate the UV DETECTOR GAIN ADJUST POT on the photometer assembly (at the rear of the optical bench for M400E analyzer while at the front of the optical bench for M703E transfer standard) (Figure A.14);
Figure A.14 Optical Bench
5. Perform the following procedures to bring PHOTO_DET to the front screen (Figure A.15 and A.16):
XV

Figure A.15 Steps to Bring PHOTO_DEC for M400E Analyzer
SETUP E.0 SECONDARY SETUP MENU COMM VARS DIAG EXIT
SETUP E.0 PRIMARY SETUP MENU CFG DAS RNGE PASS CLK MORE EXIT
SAMPLE RANGE=500.0 PPB O3=27.5 <TST TST> CAL SETUP
SETUP E.0 ENTER PASSWORD: 818 8 1 8 ENTR EXIT
DIAG SIGNAL I/O NEXT ENTR EXIT
DIAG I/O 0) EXT_ZERO_CAL=OFF NEXT JUMP PRNT EXIT
DIAG I/O JUMP TO: 0 3 1 ENTR EXIT
SAMPLE ENTER PASSWORD: 818 8 1 8 ENTR EXIT Toggle the
soft keys to set the password 818
DIAG I/O 31) PHOTO_DET=2900.2 MV PREV NEXT JUMP PRNT EXIT
XVI

Figure A.16 Steps to Bring PHOTO_DEC for M703E Analyzer
SETUP B.5 SECONDARY SETUP MENU COMM VARS DIAG EXIT
SETUP B.5 PRIMARY SETUP MENU O3 SEQ CFG CLK PASS MORE EXIT
STANDBY ENTER PASSWORD: 818 8 1 8 ENTR EXIT
SETUP B.5 ENTER PASSWORD: 818 8 1 8 ENTR EXIT
DIAG SIGNAL I/O NEXT ENTR EXIT
DIAG I/O 0) CONTROL_IN_1=OFF NEXT JUMP PRNT EXIT
DIAG I/O JUMP TO: 0 4 2 ENTR EXIT
STANDBY ACT=STANDBY <TST TST> GEN STDBY SETUP
Toggle the soft keys to set the password 818
DIAG I/O 42) PHOTO_DET=2900.2 MV PREV NEXT JUMP PRNT EXIT
XVII

XVIII
6. Using an insulated pot adjustment tool, turn the UV DETECTOR GAIN adjustment pot counter-clockwise to increase the PHOTO_DET signal. The target is to adjust PHOTO_DET as high as possible within the range of 3500-4600 mV;
7. (Option) If necessary, additional adjustment can be made by physically rotating the lamp in its housing. To do this, slightly loosen the UV LAMP SETSCREW. Next, slowly rotate the lamp up to ¼ turn in either direction while watching the PHOTO_DET signal. TO finish, re-tighten the LAMP SETSCREW;
8. If the 3500-4600 mV range cannot be reached by either of the adjustment methods in step 6 and 7, then the lamp must be replaced. Please call Calibration and Repair laboratory for the new lamp and following next section to replace the lamp;
9. Replace the cover on the instruments and press EXIT key on the front panel till to the main interface.
A.5.4 Replacing the UV Source lamp
If the lamp can no longer be adjusted as described in A.5.3 or seems to be noisy (judged when both the Photo Reference and Photo Measure are moving around), the lamp has to be replaced.
1. TURN THE ANALYZER/TRANSFER OFF!
2. Remove the analyzer/transfer standard cover.
3. Locate the Optical Bench Assembly.
4. Locate the UV lamp at front or rear of the optical bench assembly (M400E: Front; M703E: Rear).
5. Unplug the lamp cable from the power supply connector on the side of optical bench;
6. Slightly loosen (but do not remove) the UV LAMP SETSCREW and pull the lamp from its housing.
7. Install the new lamp in the housing, pushing it all the way in. Do not tighten the setscrew.
8. Turn the analyzer/transfer standard back on and allow to warm up for at least 15 minutes;
9. Turn the UV DETECTOR GAIN ADJUSTMENT POT clockwise to its MINIMUM value. The pot should click softly when the limit is reached.
10. From the front panel, following A.5.3 Step 5 to bring PHOTO_DET signal displayed.
11. While watching the PHOTO_DET signal, slowly rotate the lamp in its housing (up to ¼ turn in either direction) until a MINIMUM value is observed. Make sure the lamp is pushed all the way into the housing while performing this rotation. Tighten the LAMP SETSCREW at the approximate minimum value observed.
12. Adjust the UV DETECTOR GAIN ADJUSTMENT POT counter-clockwise to increase PHOTO_DET signal within the range of 4400-4600 mV.
13. Replace the cover on the instruments and press EXIT key on the front panel till to the main interface.
NOTE: Please put the bad UV lamp into the replacement lamp box and write down the instrument model number and serial number. PLEASE SHIP THE BAD LAMP BACK TO CALIBRATION AND REPAIR LAB. DO NOT DISPOSE OF IT.
A.6 Troubleshooting and Faults
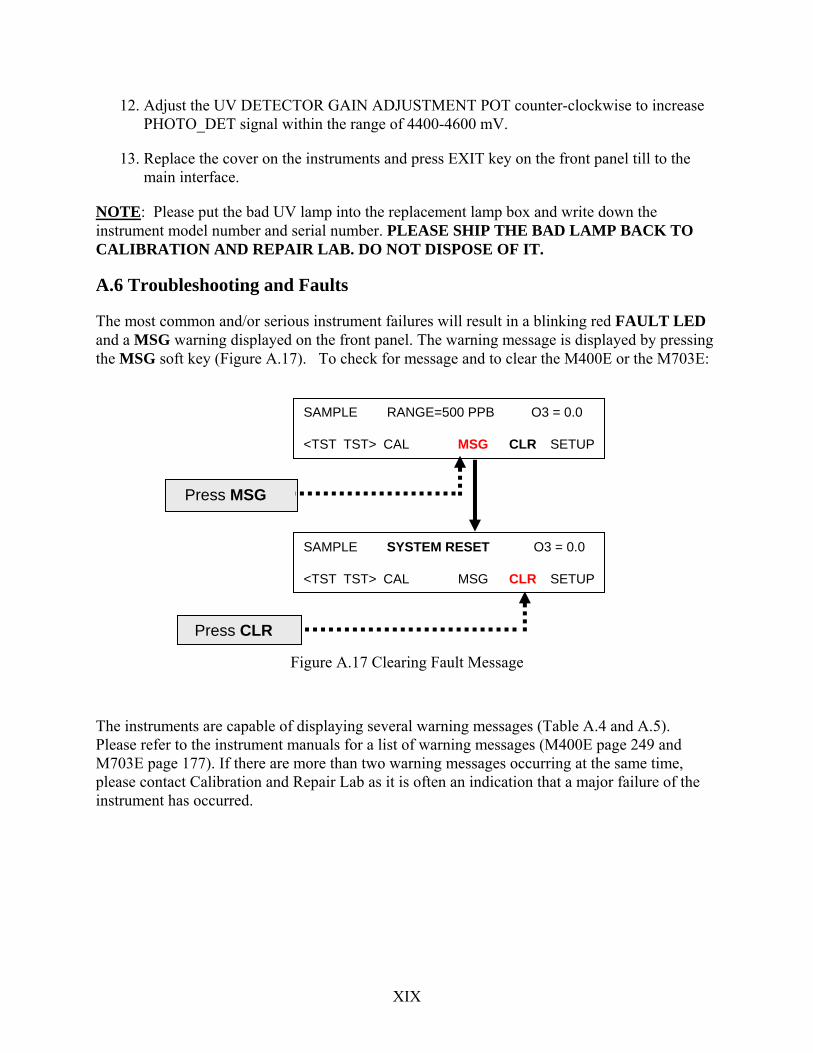
The most common and/or serious instrument failures will result in a blinking red FAULT LED and a MSG warning displayed on the front panel. The warning message is displayed by pressing the MSG soft key (Figure A.17). To check for message and to clear the M400E or the M703E:
Press MSG
SAMPLE SYSTEM RESET O3 = 0.0 <TST TST> CAL MSG CLR SETUP
Press CLR
SAMPLE RANGE=500 PPB O3 = 0.0 <TST TST> CAL MSG CLR SETUP
Figure A.17 Clearing Fault Message
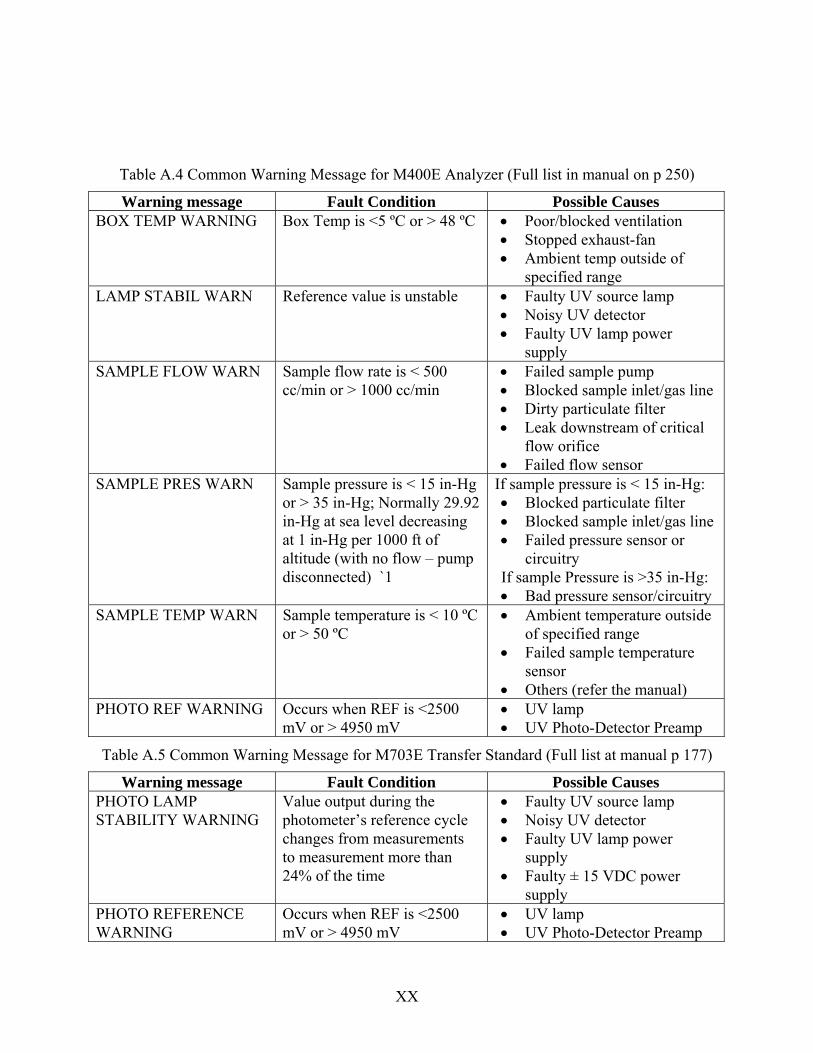
The instruments are capable of displaying several warning messages (Table A.4 and A.5). Please refer to the instrument manuals for a list of warning messages (M400E page 249 and M703E page 177). If there are more than two warning messages occurring at the same time, please contact Calibration and Repair Lab as it is often an indication that a major failure of the instrument has occurred.
XIX
XX
Table A.4 Common Warning Message for M400E Analyzer (Full list in manual on p 250)
Warning message Fault Condition Possible Causes BOX TEMP WARNING Box Temp is <5 ºC or > 48 ºC • Poor/blocked ventilation
• Stopped exhaust-fan • Ambient temp outside of
specified range LAMP STABIL WARN Reference value is unstable • Faulty UV source lamp
• Noisy UV detector • Faulty UV lamp power
supply SAMPLE FLOW WARN Sample flow rate is < 500
cc/min or > 1000 cc/min • Failed sample pump • Blocked sample inlet/gas line • Dirty particulate filter • Leak downstream of critical
flow orifice • Failed flow sensor
SAMPLE PRES WARN Sample pressure is < 15 in-Hg or > 35 in-Hg; Normally 29.92 in-Hg at sea level decreasing at 1 in-Hg per 1000 ft of altitude (with no flow – pump disconnected) `1
If sample pressure is < 15 in-Hg: • Blocked particulate filter • Blocked sample inlet/gas line • Failed pressure sensor or
circuitry If sample Pressure is >35 in-Hg: • Bad pressure sensor/circuitry
SAMPLE TEMP WARN Sample temperature is < 10 ºC or > 50 ºC
• Ambient temperature outside of specified range
• Failed sample temperature sensor
• Others (refer the manual) PHOTO REF WARNING Occurs when REF is <2500
mV or > 4950 mV • UV lamp • UV Photo-Detector Preamp
Table A.5 Common Warning Message for M703E Transfer Standard (Full list at manual p 177)
Warning message Fault Condition Possible Causes PHOTO LAMP STABILITY WARNING
Value output during the photometer’s reference cycle changes from measurements to measurement more than 24% of the time
• Faulty UV source lamp • Noisy UV detector • Faulty UV lamp power
supply • Faulty ± 15 VDC power
supply PHOTO REFERENCE WARNING
Occurs when REF is <2500 mV or > 4950 mV
• UV lamp • UV Photo-Detector Preamp

Appendix B Ozone Critical Criteria, Operational, Systematic Criteria Tables
Observations that do not meet each and every criterion on the Critical Criteria Table should be invalidated unless there are compelling and justification for not doing so. The sample or group of samples for which one or more of these criteria are not met is invalid until proven otherwise. The cause of not operating in the acceptable range for each of the violated criteria must be investigated and minimized to reduce the likelihood that additional samples will be invalidated.
OZONE CRITICAL CRITERIA TABLE
Criteria Acceptable Range Frequency 40 CFR
QA Guidance Reference Standard Reporting Units ppm All data 40 CFR, Pt 50.9
Completeness (seasonal)
Maximum 1-hour concentration 75% values from 9:01 AM to 9:00 PM (LST) Daily 40 CFR, Pt 50, App H, S 3
Precision
Single analyzer .080 - 100 ppm
1/ 2 weeks for seasonal sites or sites where manual QC checks are performed
1/4 weeks at year round automated sites
40 CFR, Pt 58, App A
Reporting organization 1/3 months 95% CI <15% EPA-600/4-83-023 Vol II, App 15, S 6
Accuracy
Single analyzer None
25 % of sites 40 CFR, Pt 58, App A
Annual accuracy 95% CI <20% quarterly (all sites yearly) EPA-600/4-83-023 Vol II, App 15, S 6
Quality Control Check Zero/span check -level 1 If Cal updated at each zero/span
Zero drift <20 to 30 ppb Span drift <20 to 25 %
1/ 2 weeks Vol II, S 12.6
Zero/span check -level 1 If fixed Cal used to calculate data
Zero drift <10 to 15 ppb Span drift < 15%
1/ 2 weeks Vol II, S 12.6
XXI

Criteria that are important for maintaining and evaluating the quality of the data collection system are included on the Ozone Operational Evaluation Table. Violation of a criterion or a number of criteria may be cause for invalidation. The decision should consider other quality control information that may or may not indicate the data are acceptable for the parameter being controlled.
OZONE OPERATIONAL TABLE
Criteria Acceptable Range Frequency 40 CFR
QA Guidance Reference
Shelter Temperature
Temperature range 20° to 30° C. (Hourly average) or
Instrument must be operated per manufacturers specifications
Daily (hourly values)
40 CFR, Pt. 53.20Vol II, S 7.1
Temperature control < 2° C Daily
Ozone analyzer calibration
Multipoint calibration (at least 5 points
Linearity error <5% Upon receipt, adjustment, or 1/year if cont. zero/span
1/ 6 months if manual zero/span
40 CFR, Pt 50, App D, S 5.2.3 EPA-600/4-79-057 S.5
Vol. II, S 12.2
Residence Times Required to be < 20 seconds from sample inlet to sample port of instrument.
Recommended to be < 10 seconds.
40 CFR, Pt 58, App E, S 9.0
Quality Assurance Handbook for Air Pollution Measurement Systems Volume II: Part 1,
Section:7
Zero Air Free of any substance that might react with ozone
Performance Evaluation
(NPAP) Mean absolute difference <15% 1/year at selected sites Vol. II, S 16.3
State audits State requirements
1/year Vol II, App 15, S 3
XXII
XXIII
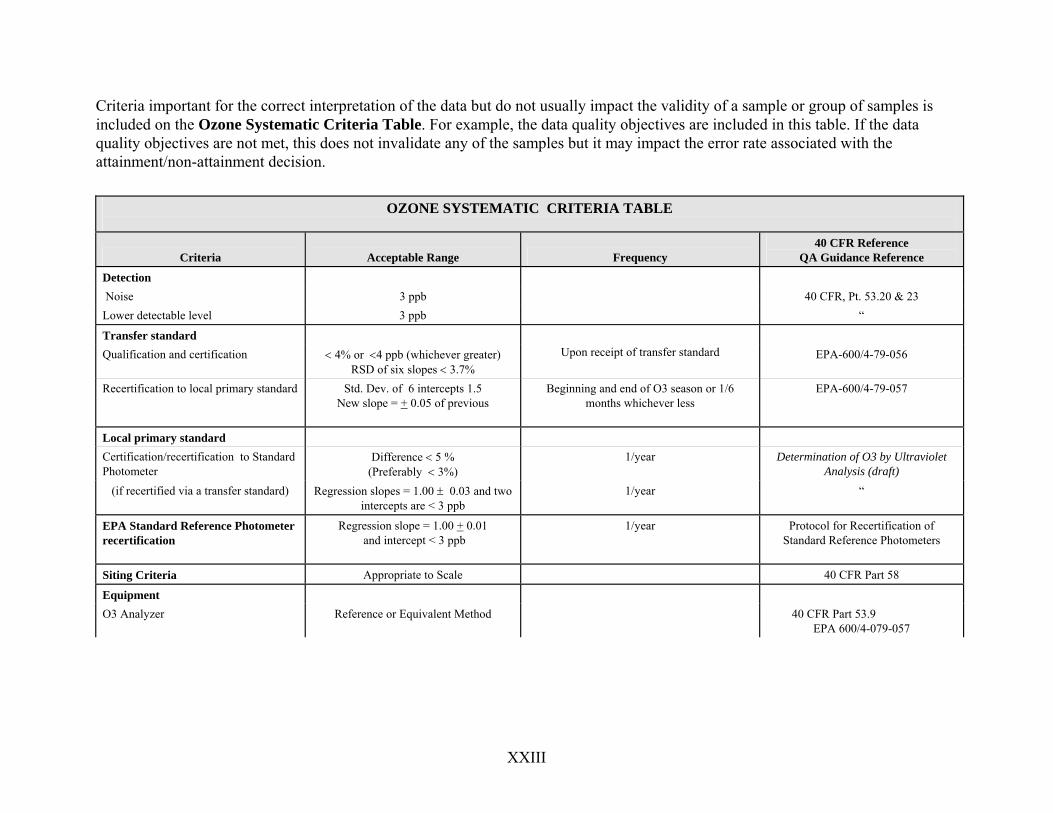
Criteria important for the correct interpretation of the data but do not usually impact the validity of a sample or group of samples is included on the Ozone Systematic Criteria Table. For example, the data quality objectives are included in this table. If the data quality objectives are not met, this does not invalidate any of the samples but it may impact the error rate associated with the attainment/non-attainment decision.
OZONE SYSTEMATIC CRITERIA TABLE
Criteria Acceptable Range Frequency 40 CFR Reference
QA Guidance Reference
Detection Noise 3 ppb 40 CFR, Pt. 53.20 & 23 Lower detectable level 3 ppb “
Transfer standard Qualification and certification < 4% or <4 ppb (whichever greater)
RSD of six slopes < 3.7% Upon receipt of transfer standard EPA-600/4-79-056
Recertification to local primary standard Std. Dev. of 6 intercepts 1.5
New slope = + 0.05 of previous Beginning and end of O3 season or 1/6
months whichever less
EPA-600/4-79-057
Local primary standard Certification/recertification to Standard Photometer
Difference < 5 % (Preferably < 3%)
1/year Determination of O3 by Ultraviolet Analysis (draft)
(if recertified via a transfer standard) Regression slopes = 1.00 ± 0.03 and two intercepts are < 3 ppb
1/year “
EPA Standard Reference Photometer recertification
Regression slope = 1.00 + 0.01 and intercept < 3 ppb
1/year Protocol for Recertification of Standard Reference Photometers
Siting Criteria Appropriate to Scale 40 CFR Part 58
Equipment O3 Analyzer Reference or Equivalent Method 40 CFR Part 53.9
EPA 600/4-079-057

Appendix C Calibration Check Form Site Name __________________________ AIRS #______________________________
Date_______________________________ Operator_____________________________
Disabled at: _____________________PST Enabled at: _______________________ PST
Transfer Standard SN#____________ Analyzer SN#_______________
Parameter Range Reading Within Range Parameter Range Reading Within
Range Output Flow (LPM) 3.0-4.0 O3 REF (mv) 3000-
4800
Box Temp (ºC) 20-40 PRES (in-Hg-A) 27.0-29.9
Photo Reference (mV)
3000-4800 SAMP FL (cc/m) 720-
880
Photo Flow (LPM)
0.72-0.88 BOX TEMP (ºC) 20-40
Photo Pressure (In-Hg-A)
27.0-29.9 Slope See Cal.
Sheet
Photo Slope See Cal. Sheet Offset (ppb) See Cal.
Sheet
Photo Offset (ppb)
See Cal. Sheet
Please mark here if a filter is changed
ANALYZER TRANSFER STANDARD Setting (ppb) Stability1
(ppb) Indicated
(ppb) Actual (ppb)
Difference2 (%)
0 N/A 80
200
1Stability should ≤ 0.3 ppb
XXIV
2Difference (%) = 100% x Actual StandardTransfer
Actual StandardTransfer - IndicatedAnalyzer
The difference must be within ± 7%. If it is greater than ± 5%, the cause needs to be investigated. Contact the Calibration and Repair Laboratory for assistance.
Information in the last table (Shaded) should be recorded into the electronic log book along with your routine maintenance information (e.g. cleaning the line, changing the filter, etc.).