
Ozon Raises GMV Growth Guidance to 120% YoY as Order ...
27
1 Ozon Raises GMV Growth Guidance to 120% YoY as Order Growth Accelerates to a Record 239% YoY in Third Quarter 2021 November 16, 2021 – Ozon Holdings PLC (NASDAQ and MOEX: “OZON”, thereafter referred to as “Ozon” or the “Company”), a leading Russian e-commerce platform, announces its unaudited financial results for the third quarter ended September 30, 2021. Alexander Shulgin, Chief Executive Officer of Ozon commented: “In Q3 our GMV more than doubled compared to last year. Given strong momentum year to date we raise our GMV growth guidance to 120% in 2021. GMV growth accelerated in Q3. In addition, we optimized our investments to achieve greater efficiency. The result is higher gross profit, lower marketing spend, and Adjusted EBITDA, under like for like methodology, improving as a percentage of GMV in Q3 compared to Q2 despite a temporary surge in cost pressure from the new warehouse and last mile infrastructure. Last quarter we added a record amount of warehouse space reaching over 770 thousand sqm. We see encouraging returns on our investments, with improving unit economics. In preparation for the next leg of our development, we have already secured over 80% of the targeted new fulfillment space for 2022 which is pivotal to our medium-term growth. We also see continuous improvement in the cost per order on year-on-year basis – a testimony to the fact that our strategy to focus on high-frequency operations is paying-off.” Third Quarter 2021 Financial and Operating Highlights • Gross merchandise value (GMV) incl. services increased to RUB 108.3 billion, compared to RUB 44.2 billion in Q3 2020, with growth materially accelerating to 145% year-on-year in Q3 2021 from 94% year-on-year in Q2 2021, and a notable 22% quarter-on-quarter growth. • Number of orders grew by a record 239% year-on-year to 56.2 million delivered in Q3 2021 from 16.6 million orders in Q3 2020. Ozon achieved a record high order growth in Q3 2021, on the back of a marked improvement in the cohort performance with a 50% higher order frequency, as well as an extremely strong growth in its customer base year- on-year. The number of orders increased by an impressive 37% quarter-on-quarter. As continuously improving cohorts augment order growth operating costs per order decline, leading to better unit economics. • Despite a lower average order value year-on-year, our GMV per user is up materially compared to Q3 2020 as a result of users engaging with the platform more often, leading to decreasing costs per order and greater returns on our investments in customer acquisition and infrastructure. • The Ozon platform attracted circa 1 million active users per month during Q3 2021 and, as a result, its customer base exceeded 21 million active users in Q3 2021, up 16% quarter-on-quarter. Whilst the 87% year-on-year growth in Q3 2021 marks the highest growth in active users in the last seven quarters, the Company also achieved greater marketing efficiency with sales and marketing expenses as a percentage of GMV declining to 6.0% in Q3 2021, compared to 6.4% in Q2 2021.
Transcript of Ozon Raises GMV Growth Guidance to 120% YoY as Order ...

1
Ozon Raises GMV Growth Guidance to 120% YoY as Order Growth
Accelerates to a Record 239% YoY in Third Quarter 2021
November 16, 2021 – Ozon Holdings PLC (NASDAQ and MOEX: “OZON”, thereafter referred
to as “Ozon” or the “Company”), a leading Russian e-commerce platform, announces its
unaudited financial results for the third quarter ended September 30, 2021.
Alexander Shulgin, Chief Executive Officer of Ozon commented: “In Q3 our GMV more than
doubled compared to last year. Given strong momentum year to date we raise our GMV growth
guidance to 120% in 2021.
GMV growth accelerated in Q3. In addition, we optimized our investments to achieve greater
efficiency. The result is higher gross profit, lower marketing spend, and Adjusted EBITDA, under
like for like methodology, improving as a percentage of GMV in Q3 compared to Q2 despite a
temporary surge in cost pressure from the new warehouse and last mile infrastructure. Last
quarter we added a record amount of warehouse space reaching over 770 thousand sqm. We
see encouraging returns on our investments, with improving unit economics. In preparation for
the next leg of our development, we have already secured over 80% of the targeted new
fulfillment space for 2022 which is pivotal to our medium-term growth. We also see continuous
improvement in the cost per order on year-on-year basis – a testimony to the fact that our
strategy to focus on high-frequency operations is paying-off.”
Third Quarter 2021 Financial and Operating Highlights
• Gross merchandise value (GMV) incl. services increased to RUB 108.3 billion, compared
to RUB 44.2 billion in Q3 2020, with growth materially accelerating to 145% year-on-year
in Q3 2021 from 94% year-on-year in Q2 2021, and a notable 22% quarter-on-quarter
growth.
• Number of orders grew by a record 239% year-on-year to 56.2 million delivered in Q3
2021 from 16.6 million orders in Q3 2020. Ozon achieved a record high order growth in
Q3 2021, on the back of a marked improvement in the cohort performance with a 50%
higher order frequency, as well as an extremely strong growth in its customer base year-
on-year. The number of orders increased by an impressive 37% quarter-on-quarter. As
continuously improving cohorts augment order growth operating costs per order decline,
leading to better unit economics.
• Despite a lower average order value year-on-year, our GMV per user is up materially
compared to Q3 2020 as a result of users engaging with the platform more often, leading
to decreasing costs per order and greater returns on our investments in customer
acquisition and infrastructure.
• The Ozon platform attracted circa 1 million active users per month during Q3 2021 and,
as a result, its customer base exceeded 21 million active users in Q3 2021, up 16%
quarter-on-quarter. Whilst the 87% year-on-year growth in Q3 2021 marks the highest
growth in active users in the last seven quarters, the Company also achieved greater
marketing efficiency with sales and marketing expenses as a percentage of GMV
declining to 6.0% in Q3 2021, compared to 6.4% in Q2 2021.

2
Daniil Fedorov, Chief Operating Officer of Ozon, said: “In Q3 we set a new record with order
growth of 239%, making it the seventh consecutive quarter with order growth exceeding 100%!
And last week we reached a new milestone of 1 million orders per day! With much higher order
volume, our operating expenses per order decreased in Q3 2021 compared to Q3 2020 despite
unprecedented infrastructure expansion.
As we grow and develop, we aim to serve the communities that form part of our ecosystem. I
am excited to share that in September Ozon launched its Charity Program that enables our
buyers and sellers to make charitable contributions to non-profit organisations, as we aim to
serve communities that we operate in.”
• The number of active sellers nearly quadrupled in the last twelve months exceeding
60,000. Close to 40,000 sellers joined the platform since the start of the year, attracted
by a variety of fulfillment and delivery options, Ozon’s proprietary market and business
analytics tools, a wider suite of advertising instruments and financial services that assist
sellers in scaling their business faster. In Q3 2021 Ozon also launched sole proprietor
sales on the platform, which should further boost the platform’s assortment.
• The outstanding growth in the merchant base contributed to growing Share of
Marketplace which edged up reaching 66.7% as a percentage of GMV incl. services,
compared to 51.4% in Q3 2020.
• In Q3 2021 Adjusted EBITDA was impacted by a one-off expenditure on an in-progress
research and development project in the amount of RUB 370 million. Further the
Company made an incremental adjustment to the estimate of an inventory valuation
allowance of approximately RUB 500 million related to the recent clarifications issued by
IFRS Interpretations Committee (IFRIC). Excluding the change in allowance and one-off
expenditure, Adjusted EBITDA would have amounted to a negative RUB 10.4 billion.
As a percentage of GMV Adjusted EBITDA improved quarter-on-quarter to 9.6% in Q3
2021 compared to 10.3% in Q2 2021, adjusted for the impact of the aforementioned one-
off expenditure on the research and development project and the change in an inventory
valuation allowance methodology. The improvement was largely driven by better gross
profit and improved sales and marketing expense as a percentage of GMV. Fulfilment
and delivery costs were higher quarter-on-quarter, following aggressive expansion of the
infrastructure in preparation for the high season of 4Q 2021.
In 3Q 2021 Adjusted EBITDA was a negative RUB 11.3 billion, compared to a negative
RUB 1.9 billion, corresponding to an Adjusted EBITDA as a percentage of GMV of a
negative 10.4% in Q3 2021, compared to a negative 4.2% in Q3 2020. Although at the
aggregate level operating costs have increased year-on-year due to our investments into
infrastructure, marketing, and talent acquisition, the per order basis costs improved
materially year-on-year, driven by the scale effect which stems from a significant uptick
in the order frequency per active user year-on-year. The higher frequency should be the
key driver of further dilution of the costs on per order basis in the future. During Q3 2021,
the Company also deployed dedicated investments into the new verticals such as the
quick commerce and Fintech.
• Loss for the period amounted to RUB 14,018 million in Q3 2021, compared to RUB 3,879 million in Q3 2020.
• The Company had cash and cash equivalents of RUB 116.5 billion as of September 30, 2021, compared to RUB 122.8 billion as of June 30, 2021.
3
Financial Outlook
The below forward-looking statements reflect Ozon’s expectations as of November 16, 2021,
considering trends year to date and could be subject to change, and involve inherent risks which
we are not able to control, for example the overall impact of the coronavirus pandemic and any
ongoing or new potential disruptions caused by COVID-19. The below forecasts assume no
further escalation of the COVID-19 pandemic and supply chain issues impact.
Based on the recent performance and current outlook:
• Ozon raises its growth guidance for the Company’s GMV incl. services to 120% from
110% for Full-Year 2021, compared to Full-Year 2020.
• Ozon reiterates its capital expenditure plans of between RUB 20 billion to RUB 25 billion
for the Full-Year 2021.
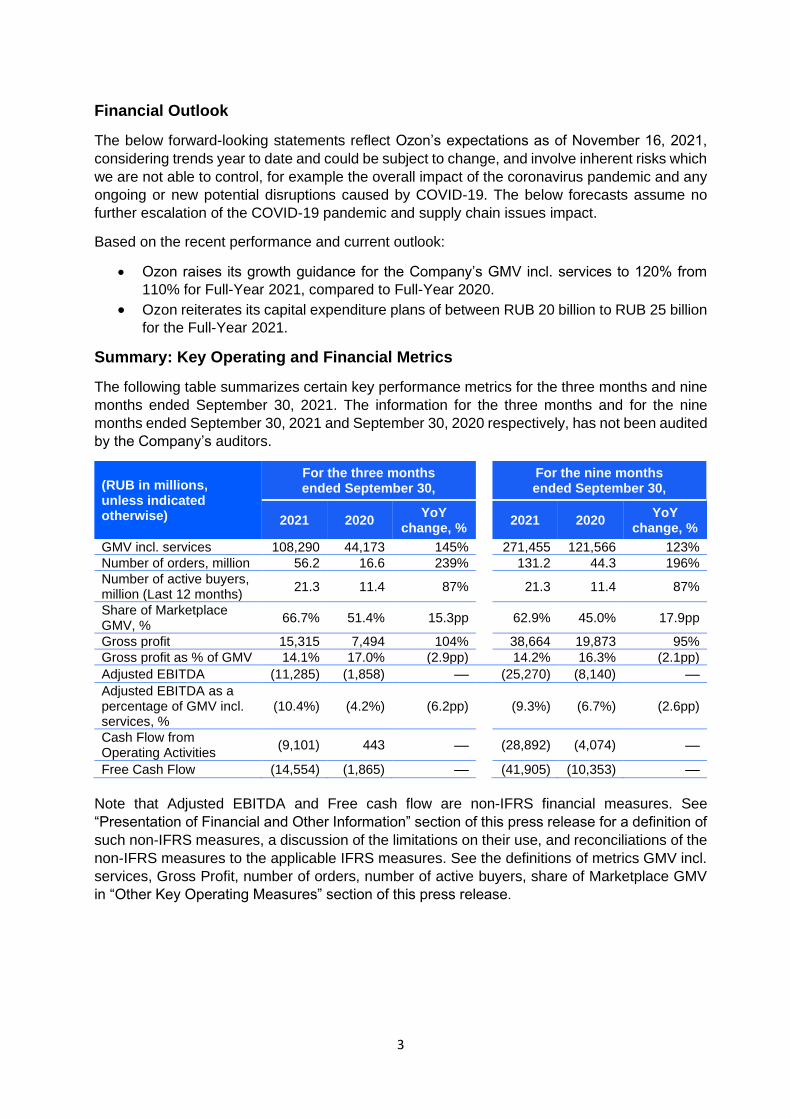
Summary: Key Operating and Financial Metrics
The following table summarizes certain key performance metrics for the three months and nine
months ended September 30, 2021. The information for the three months and for the nine
months ended September 30, 2021 and September 30, 2020 respectively, has not been audited
by the Company’s auditors.
(RUB in millions, unless indicated otherwise)
For the three months ended September 30,
For the nine months ended September 30,
2021 2020 YoY
change, % 2021 2020
YoY change, %
GMV incl. services 108,290 44,173 145% 271,455 121,566 123%
Number of orders, million 56.2 16.6 239% 131.2 44.3 196%
Number of active buyers, million (Last 12 months)
21.3 11.4 87% 21.3 11.4 87%
Share of Marketplace GMV, %
66.7% 51.4% 15.3pp 62.9% 45.0% 17.9pp
Gross profit 15,315 7,494 104% 38,664 19,873 95%
Gross profit as % of GMV 14.1% 17.0% (2.9pp) 14.2% 16.3% (2.1pp)
Adjusted EBITDA (11,285) (1,858) — (25,270) (8,140) —
Adjusted EBITDA as a percentage of GMV incl. services, %
(10.4%) (4.2%) (6.2pp) (9.3%) (6.7%) (2.6pp)
Cash Flow from Operating Activities
(9,101) 443 — (28,892) (4,074) —
Free Cash Flow (14,554) (1,865) — (41,905) (10,353) —
Note that Adjusted EBITDA and Free cash flow are non-IFRS financial measures. See
“Presentation of Financial and Other Information” section of this press release for a definition of
such non-IFRS measures, a discussion of the limitations on their use, and reconciliations of the
non-IFRS measures to the applicable IFRS measures. See the definitions of metrics GMV incl.
services, Gross Profit, number of orders, number of active buyers, share of Marketplace GMV
in “Other Key Operating Measures” section of this press release.
4
Key Highlights and Business Developments
Ozon e-commerce business achieved an outstanding GMV growth of 145% year-on-year to
RUB 108.3 billion, compared to RUB 44.2 billion in Q3 2020. This represents a significant
acceleration from Q2 2021 growth of 94%, and an increase of 22% quarter-on-quarter. The
uptick in growth was bolstered by a record order growth of 239% year-on-year in Q3 2021. The
step up in order frequencies stems from a greater convenience and higher quality of service on
Ozon platform, reflected in improved NPS scores. The enhancements were achieved through a
major expansion of the fulfillment and logistics services, which enabled Ozon e-commerce
business to expedite delivery time and boost selection and availability of merchandise,
especially in the regions. The value-added services provided to Ozon customers by the new
verticals further bolstered user engagement.
Ozon Marketplace
In Q3 2021 Gross Merchandise Value of Ozon Marketplace increased by 217% year-on-year,
with Marketplace (3P) as a percentage of GMV reaching 66.7%, compared to 51.4% in Q3 2020.
The Marketplace growth has been boosted by an accelerated growth in the number of
merchants on Ozon platform contributing to a greater choice for consumers. Wider assortment
and better service coupled with strategic marketing investments enabled Ozon to grow its
customer base by c. 80% year-on-year for the last seven consecutive quarters, with growth
picking up to 87% in Q3 2021.
Sellers
The number of sellers grew 3.6x year-on-year and reached more than 60 thousand, as more
large, small and medium size businesses leverage Ozon’s multi-million consumer audience and
capabilities in terms of wide range of services, including fulfillment and logistics, various market
analytics, video streaming, advertising tools, and financial services. One of the key
differentiating factors for Ozon’s platform is the variety of marketplace models on offer (FBO,
FBS, Storefront). The ability to customize the fulfillment and delivery solutions enables Ozon to
cater for individual businesses’ needs and more sellers to use the platform.
Ozon Marketplace continues to operate with the new commission structure introduced in
February 2021. The new structure offers distinct incentives to the sellers to utilize the regional
fulfillment infrastructure, to engage with the platform more frequently and to drive higher
turnover.
Launch of self-employed entrepreneurs’ sales
From October 2021 Ozon enabled sole proprietors, also referred to as self-employed
entrepreneurs, to sell a wide range of goods that they produce on its platform. There is
an estimated 2.7 million self-employed individuals in Russia. This initiative will further
expand the assortment for Ozon customers who will be able to purchase unique
handmade goods.
Ozon cross-border operations
Ozon cross-border business continues to gain scale. More than 3,000 cross-border
sellers from 26 countries, including markets such as China, as well as South-East Asia
and Europe already operate on Ozon platform and contribute over 6 million SKUs to
Ozon’s assortment as of September 30, 2021.

5
Assortment
As a result of Ozon’s seller base nearly quadrupling in the last twelve months and improved
content creation processes, the assortment on Ozon platform reached approximately 46
million SKUs, up from 9 million as of September 30, 2020.
Buyers
• Number of active customers on Ozon’s platform increased by 87% year-on-year,
reaching 21.3 million as of September 30, 2021, compared to 11.4 million as of
September 30, 2020. The acceleration in the buyer base resulted from the customer
acquisition through a strategic year-on-year step-up in marketing spend, coupled with
organic growth as Ozon became the go-to shopping platform for consumers in Moscow
and in the regions.
• Annual order frequency of Ozon’s buyers increased significantly, up by 50% to 7.5 in Q3
2021, compared to 5.0 in Q3 2020. Over the past two years, order frequency doubled,
as a result of higher repurchase rate across cohorts. Such uptick in the frequency is a
testimony to our progress towards a high-frequency shopping model.
Ozon Fulfillment & Logistics
Fulfillment and logistics network expansion is a key prerequisite to fuel growth of Ozon’s e-
commerce business.
• Ozon expanded its total warehouse capacity by over 150% year-on-year. Our total
warehouse space exceeded 770,000 sqm as of September 30, 2021 including over
420,000 sqm of fulfillment footprint. The new fulfillment facilities typically require several
months to prepare for the large shipping volumes during the high season and to reach
its steady state utilization level, therefore the cost pressure in Q3 2021 mounted.
• Ozon currently operates fulfillment centers across Moscow, Moscow region, Tver, Saint-
Petersburg, Kazan, Rostov-on-Don, Yekaterinburg, Novosibirsk, and Khabarovsk,
enabling Ozon to increase speed of delivery, enrich assortment and availability of stock
across Russia.
• Rapid expansion of the Ozon logistics infrastructure makes Ozon one of the leading last
mile network operators and logistics companies in Russia. Moreover, transformation of
the last mile operations in the last 18 months has been pivotal to accelerating growth of
Ozon’s e-commerce and also its quick commerce operations.
• In the last twelve months Ozon nearly doubled the number of pick-up locations and more
than quadrupled its sorting center capacity. This allowed Ozon to bring the goods closer
to the consumer and improve speed and accuracy of the delivery time. In Q3 2021 the
Ozon logistics business was able to process and deliver parcels with 98% on time
delivery.
• Significant expansion of the logistics network resulted in the temporary cost pressure
during this year and in Q3 specifically as the new locations scale up over a course of
several months after the launch. Excluding this effect, Ozon achieved a significant
6
improvement in the unit economics of the offline pick-up points due to a strong volume
growth and an introduction of the Ozon’s operations optimization and efficiency gains.
Third Party Logistics Services
• Earlier this year Ozon began to offer its logistics services to third parties. Provision of
services to third parties creates a new incremental profitable revenue source, improves
utilization and enables faster ramp up for Ozon’s logistics infrastructure. In Q3 2021 the
Company continued to expand its third-party logistics operations, with over 1,000 clients,
including large international brands such as IKEA and Decathlon, already leveraging
Ozon’s nation-wide network to deliver over 10,000 orders per day with good growth
dynamics and best-in-class service quality and speed.
Ozon New Initiatives & Verticals
Ozon Financial Services
Ozon Fintech continued to demonstrate extensive growth in TPV driven by higher penetration
among the existing customers as well as the new clients. In Q3 2021 Ozon Fintech completed
the rebranding of Oney Bank LLC acquired in Q2 2021 into “Ozon Bank”. Ozon Bank will mostly
focus on providing infrastructure and payment solutions deeply integrated with the core e-
commerce platform. This should result in the seamless purchases for the buyers and efficient
financial service operations for sellers on Ozon’s platform, which in turn boosts loyalty to Ozon’s
platform and promotes Ozon’s financial solutions brand amongst B2B and B2C financial
services providers outside of the platform.
B2C Initiatives
• Ozon Card further strengthened its position among the top-3 payment methods on
Ozon’s platform in Q3 2021 with c.1.6 million cards issued as of September 30, 2021.
Ozon Card continued to drive consumer loyalty, reflected in the Ozon cardholders’ 1.6x
higher order frequency over the last 12 months compared to the customers using other
payment methods.
• In September 2021 we piloted the combined Ozon Card and Ozon Premium loyalty
points offering additional benefits and improving UX to the clients using both products.
The initiative was successfully rolled out in October 2021 and we observe promising
results so far.
B2B Initiatives
• In Q3 2021 c.5 thousand sellers used Ozon’s Flexible Payment Plan, up 109% quarter-
on-quarter. This product also allows Ozon’s sellers to arrange a payment schedule that
fits their individual business needs. We see greater willingness to invest more into
business growth by the SMEs utilizing this instrument for better working capital
management.
• In Q3 2021 Ozon Credit, the microcredit company founded in May 2021, started
providing loans to the sellers operating on our platform. Ozon Credit leverages more
than 40 different indicators, processed by machine learning, aiding Ozon with faster and
more accurate credit scoring. Ozon Credit will enable to structure various lending
products in accordance with the desired specifications of its customer base and
merchants.

7
Ozon Express
Ozon Express is the Company’s quick commerce business, which offers one-hour delivery for
over 20,000 SKUs including food and non-food assortment, such as FMCG, children’s goods
and electronics. Ozon Express launched its initial pilot in Moscow in 2020 and rapidly proved its
potential as we saw strong demand for our quick commerce solution among our customers.
Following our success in Moscow, Ozon launched Express operations in St. Petersburg in Q2
2021.
• In Q3 2021 Ozon Express started to scale its operations outside of Moscow and St.
Petersburg by opening its first dark stores in Tver, Krasnodar and Rostov-on-Don, with
the goal of unlocking the access to one-hour delivery service for over 20 million
consumers.
• As of September 30, 2021 Ozon Express launched a multitude of FMCG products, such
as coffee, snacks and other foods under its own private label, along with Ozon’s own
ready-to-eat meals production.
Ozon Technology
In July 2021 Ozon launched an IT robotics laboratory in Innopolis, Kazan. The laboratory will
focus on developing robotics and automation of fulfillment and logistics solutions. Introduction
of robotics technologies should drive reduction in costs per order over time, as well as increase
the productivity of the supply chain. Ozon launched a competition for the development of e-
commerce robotization solutions “Ozon RoboFactory”, and aims to award top five authors with
grants to further develop and implement their ideas with Ozon.
Ozon International Operations
CIS Expansion
Ozon continues its international expansion, that allows to further expand the total addressable
market and grasping the opportunity in underpenetrated e-commerce markets. Ozon is on track
to scale its operations in Belarus and opened its first sorting center in Minsk. Ozon sales in
Belarus have grown by approximately 10 times since the beginning of the year, whilst sales of
sellers from Belarus on Ozon’s platform increased 5 times since March 2021. During Q3 2021
Ozon partnered with national post operator, which enabled buyers to pick orders in one of 3,000
offline pick-up locations across the country. In order to further enhance Belarus’ buyers shopping
experience, Ozon launched its pick-up points franchising solution.
In Q3 2021 Ozon entered Kazakhstan market with sorting centers in Nur-Sultan and Almaty.
With over 19 million population, similar consumer profile and underpenetrated e-commerce
market set to grow at 41% CAGR through to 2025 to US Dollar 12.2 billion, Kazakhstan offers
an attractive opportunity for Ozon to offer its wide multi-category goods to the customers and
suite of Ozon services to the local sellers.
8
Ozon Charity Program
In September 2021 Ozon launched its own charity program, Ozon Care. The Program enables
sellers and buyers on our marketplace to make charitable contributions to reliable non-profit
organisations.
The charities will be able to receive funds from the sales of charity gift cards, products with the
Ozon Care label, sale of products by the charities themselves. The charitable foundations will
gain access to millions of users, who will be able to combine charitable giving with shopping
online. Charities will periodically share information on their social networks about the recipients
of charitable assistance and how they were able to help them.
The Program includes the following six charities: Vera Hospice Charity Fund, Anton’s Right
Here, the Leukaemia Foundation, the RAY foundation for homeless animals, the Upwards
centre for equal opportunities and Movement Up foundation for children and adolescents. More
information about Ozon Care charity program participants can be found on our website
https://corp.ozon.com.
Elena Chernina, Ozon’s head of social projects, commented: “As part of our charity
program, we decided to include a variety of social issues – from providing support for adult
patients to helping animals. Like the Ozon marketplace, the Ozon Care program will function as
a platform that brings together customers, sellers and non-profit organizations. Ozon customers
can choose for themselves which charity to support, and sellers can make deductions from sales
to verified charities.”
COVID-19 Impact
The number of new COVID-19 cases in Russia started to grow in September 2021 and reached
a new record high in October. To prevent the spread of infection, the Russian Government
introduced some restrictions, including limitations on the movement of citizens, on commercial
activities and measures to stimulate vaccination of population. To provide the employees with
the safe working conditions and to meet the government requirements, Ozon introduced the
following measures:
• Regular body temperature checks of the workers (telemetry), with the temporary
suspension from work of those whose temperature is elevated.
• Ensuring the availability and use of protective equipment - masks and gloves,
disinfectants, bactericidal air recirculation systems.
• Separation of workers’ flow, adherence to social distancing requirements.
• Conducting testing of the employees using the PCR tests.
Measures to counter the spread of coronavirus also include remote working requirement for
more than 30% of the office staff. Moreover, Ozon regularly arranges free vaccination with
Sputnik V and Sputnik Light for its employees. Employees are alerted about the health and
safety requirements associated with the coronavirus infection through the video campaigns, the
audio messages, and the other materials as well as the webinars with doctors.
9
Ozon Operational and Financial Results
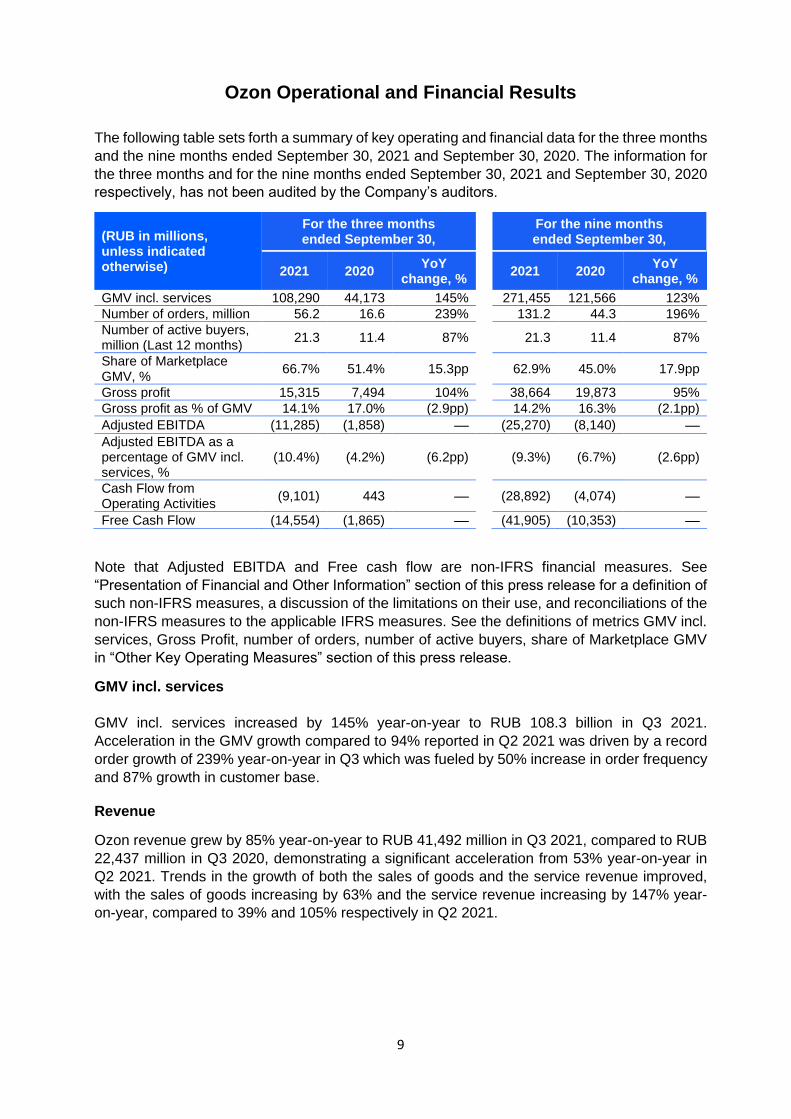
The following table sets forth a summary of key operating and financial data for the three months
and the nine months ended September 30, 2021 and September 30, 2020. The information for
the three months and for the nine months ended September 30, 2021 and September 30, 2020
respectively, has not been audited by the Company’s auditors.
(RUB in millions, unless indicated otherwise)
For the three months ended September 30,
For the nine months ended September 30,
2021 2020 YoY
change, % 2021 2020
YoY change, %
GMV incl. services 108,290 44,173 145% 271,455 121,566 123%
Number of orders, million 56.2 16.6 239% 131.2 44.3 196%
Number of active buyers, million (Last 12 months)
21.3 11.4 87% 21.3 11.4 87%
Share of Marketplace GMV, %
66.7% 51.4% 15.3pp 62.9% 45.0% 17.9pp
Gross profit 15,315 7,494 104% 38,664 19,873 95%
Gross profit as % of GMV 14.1% 17.0% (2.9pp) 14.2% 16.3% (2.1pp)
Adjusted EBITDA (11,285) (1,858) — (25,270) (8,140) —
Adjusted EBITDA as a percentage of GMV incl. services, %
(10.4%) (4.2%) (6.2pp) (9.3%) (6.7%) (2.6pp)
Cash Flow from Operating Activities
(9,101) 443 — (28,892) (4,074) —
Free Cash Flow (14,554) (1,865) — (41,905) (10,353) —
Note that Adjusted EBITDA and Free cash flow are non-IFRS financial measures. See
“Presentation of Financial and Other Information” section of this press release for a definition of
such non-IFRS measures, a discussion of the limitations on their use, and reconciliations of the
non-IFRS measures to the applicable IFRS measures. See the definitions of metrics GMV incl.
services, Gross Profit, number of orders, number of active buyers, share of Marketplace GMV
in “Other Key Operating Measures” section of this press release.
GMV incl. services
GMV incl. services increased by 145% year-on-year to RUB 108.3 billion in Q3 2021.
Acceleration in the GMV growth compared to 94% reported in Q2 2021 was driven by a record
order growth of 239% year-on-year in Q3 which was fueled by 50% increase in order frequency
and 87% growth in customer base.
Revenue
Ozon revenue grew by 85% year-on-year to RUB 41,492 million in Q3 2021, compared to RUB
22,437 million in Q3 2020, demonstrating a significant acceleration from 53% year-on-year in
Q2 2021. Trends in the growth of both the sales of goods and the service revenue improved,
with the sales of goods increasing by 63% and the service revenue increasing by 147% year-
on-year, compared to 39% and 105% respectively in Q2 2021.
10
Revenue from sales of goods
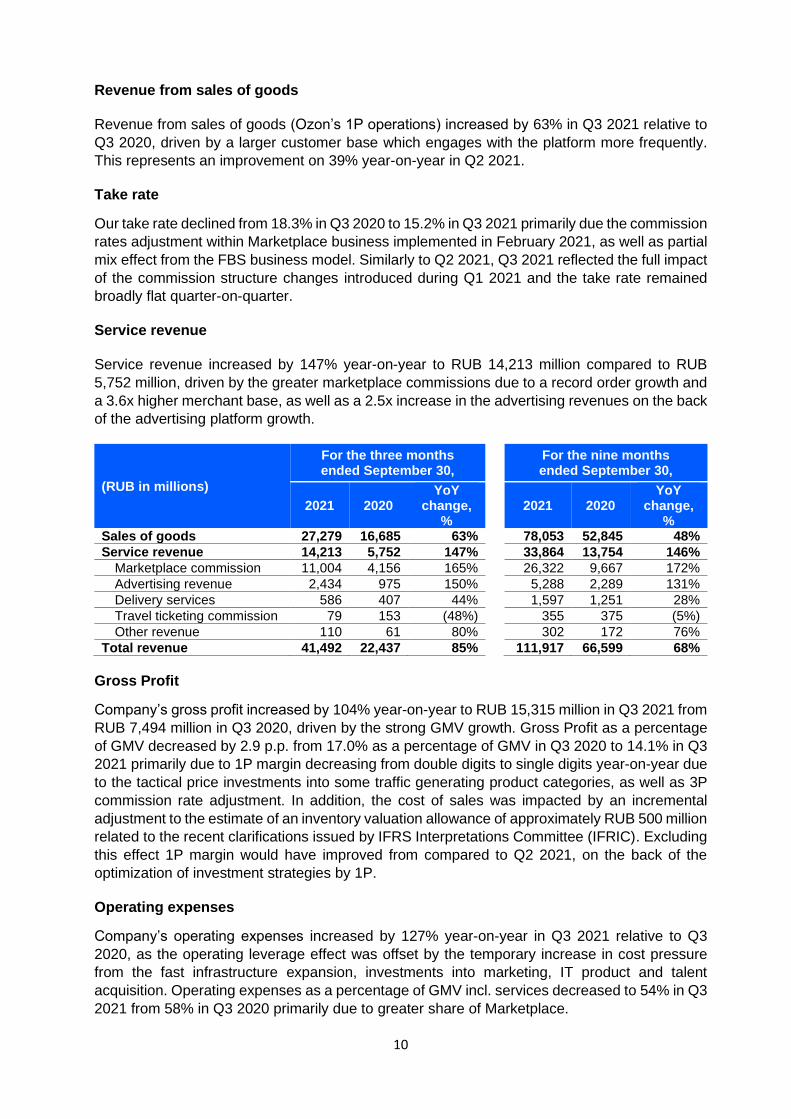
Revenue from sales of goods (Ozon’s 1P operations) increased by 63% in Q3 2021 relative to
Q3 2020, driven by a larger customer base which engages with the platform more frequently.
This represents an improvement on 39% year-on-year in Q2 2021.
Take rate
Our take rate declined from 18.3% in Q3 2020 to 15.2% in Q3 2021 primarily due the commission
rates adjustment within Marketplace business implemented in February 2021, as well as partial
mix effect from the FBS business model. Similarly to Q2 2021, Q3 2021 reflected the full impact
of the commission structure changes introduced during Q1 2021 and the take rate remained
broadly flat quarter-on-quarter.
Service revenue
Service revenue increased by 147% year-on-year to RUB 14,213 million compared to RUB
5,752 million, driven by the greater marketplace commissions due to a record order growth and
a 3.6x higher merchant base, as well as a 2.5x increase in the advertising revenues on the back
of the advertising platform growth.
(RUB in millions)
For the three months ended September 30,
For the nine months ended September 30,
2021 2020 YoY
change, %
2021 2020 YoY
change, %
Sales of goods 27,279 16,685 63% 78,053 52,845 48%
Service revenue 14,213 5,752 147% 33,864 13,754 146%
Marketplace commission 11,004 4,156 165% 26,322 9,667 172%
Advertising revenue 2,434 975 150% 5,288 2,289 131%
Delivery services 586 407 44% 1,597 1,251 28%
Travel ticketing commission 79 153 (48%) 355 375 (5%)
Other revenue 110 61 80% 302 172 76%
Total revenue 41,492 22,437 85% 111,917 66,599 68%
Gross Profit
Company’s gross profit increased by 104% year-on-year to RUB 15,315 million in Q3 2021 from
RUB 7,494 million in Q3 2020, driven by the strong GMV growth. Gross Profit as a percentage
of GMV decreased by 2.9 p.p. from 17.0% as a percentage of GMV in Q3 2020 to 14.1% in Q3
2021 primarily due to 1P margin decreasing from double digits to single digits year-on-year due
to the tactical price investments into some traffic generating product categories, as well as 3P
commission rate adjustment. In addition, the cost of sales was impacted by an incremental
adjustment to the estimate of an inventory valuation allowance of approximately RUB 500 million
related to the recent clarifications issued by IFRS Interpretations Committee (IFRIC). Excluding
this effect 1P margin would have improved from compared to Q2 2021, on the back of the
optimization of investment strategies by 1P.
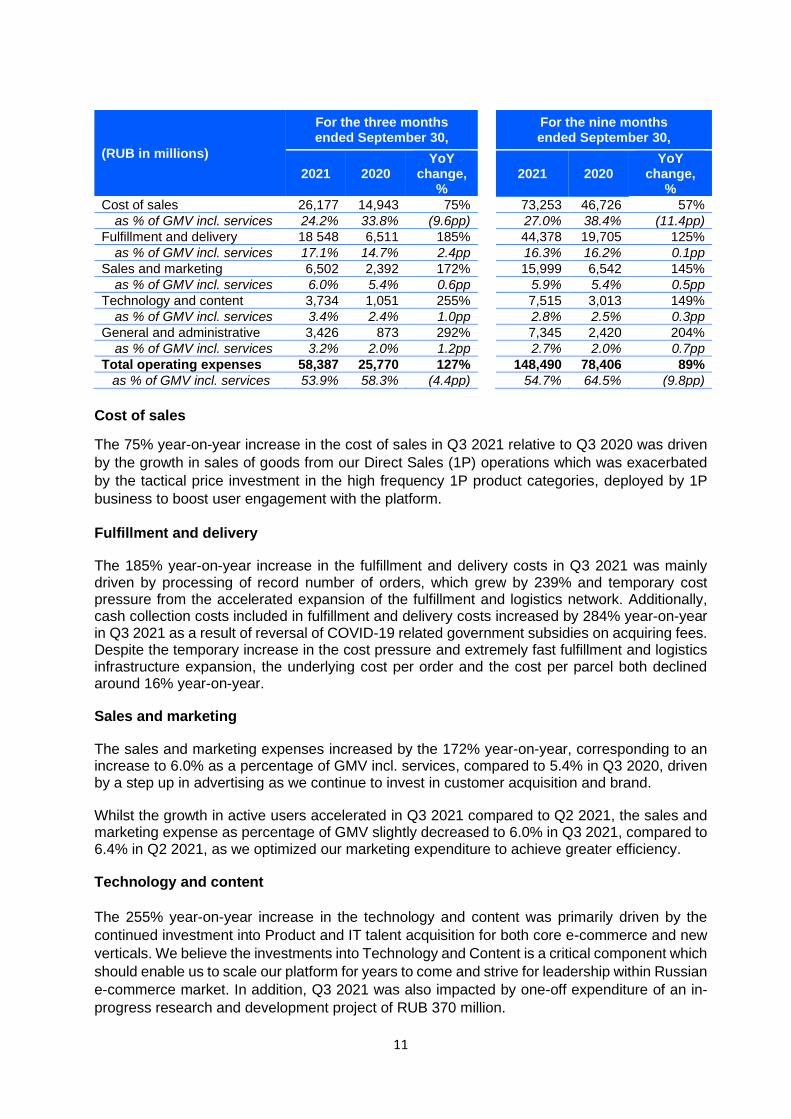
Operating expenses
Company’s operating expenses increased by 127% year-on-year in Q3 2021 relative to Q3
2020, as the operating leverage effect was offset by the temporary increase in cost pressure
from the fast infrastructure expansion, investments into marketing, IT product and talent
acquisition. Operating expenses as a percentage of GMV incl. services decreased to 54% in Q3
2021 from 58% in Q3 2020 primarily due to greater share of Marketplace.
11
(RUB in millions)
For the three months ended September 30,
For the nine months ended September 30,
2021 2020 YoY
change, %
2021 2020 YoY
change, %
Cost of sales 26,177 14,943 75%
73,253 46,726 57%
as % of GMV incl. services 24.2% 33.8% (9.6pp)
27.0% 38.4% (11.4pp)
Fulfillment and delivery 18 548 6,511 185%
44,378 19,705 125%
as % of GMV incl. services 17.1% 14.7% 2.4pp
16.3% 16.2% 0.1pp
Sales and marketing 6,502 2,392 172%
15,999 6,542 145%
as % of GMV incl. services 6.0% 5.4% 0.6pp
5.9% 5.4% 0.5pp
Technology and content 3,734 1,051 255%
7,515 3,013 149%
as % of GMV incl. services 3.4% 2.4% 1.0pp
2.8% 2.5% 0.3pp
General and administrative 3,426 873 292%
7,345 2,420 204%
as % of GMV incl. services 3.2% 2.0% 1.2pp
2.7% 2.0% 0.7pp
Total operating expenses 58,387 25,770 127% 148,490 78,406 89%
as % of GMV incl. services 53.9% 58.3% (4.4pp)
54.7% 64.5% (9.8pp)
Cost of sales
The 75% year-on-year increase in the cost of sales in Q3 2021 relative to Q3 2020 was driven
by the growth in sales of goods from our Direct Sales (1P) operations which was exacerbated
by the tactical price investment in the high frequency 1P product categories, deployed by 1P
business to boost user engagement with the platform.
Fulfillment and delivery
The 185% year-on-year increase in the fulfillment and delivery costs in Q3 2021 was mainly driven by processing of record number of orders, which grew by 239% and temporary cost pressure from the accelerated expansion of the fulfillment and logistics network. Additionally, cash collection costs included in fulfillment and delivery costs increased by 284% year-on-year in Q3 2021 as a result of reversal of COVID-19 related government subsidies on acquiring fees. Despite the temporary increase in the cost pressure and extremely fast fulfillment and logistics infrastructure expansion, the underlying cost per order and the cost per parcel both declined around 16% year-on-year.
Sales and marketing
The sales and marketing expenses increased by the 172% year-on-year, corresponding to an increase to 6.0% as a percentage of GMV incl. services, compared to 5.4% in Q3 2020, driven by a step up in advertising as we continue to invest in customer acquisition and brand.
Whilst the growth in active users accelerated in Q3 2021 compared to Q2 2021, the sales and marketing expense as percentage of GMV slightly decreased to 6.0% in Q3 2021, compared to 6.4% in Q2 2021, as we optimized our marketing expenditure to achieve greater efficiency.
Technology and content
The 255% year-on-year increase in the technology and content was primarily driven by the
continued investment into Product and IT talent acquisition for both core e-commerce and new
verticals. We believe the investments into Technology and Content is a critical component which
should enable us to scale our platform for years to come and strive for leadership within Russian
e-commerce market. In addition, Q3 2021 was also impacted by one-off expenditure of an in-
progress research and development project of RUB 370 million.
12
General and administrative
The 292% year-on-year increase in the general and administrative expenses in Q3 2021,
corresponding to the 3.2% as a percentage of GMV, was driven by investment into talent
acquisition to support further growth of the platform. The share based compensation expense
had a significant impact on the increase in the general and administrative expenses year-on-
year.
Adjusted EBITDA
Adjusted EBITDA was a negative RUB 11.3 billion, compared to negative RUB 1.9 billion in Q3
2020. As a percentage of GMV incl. services Adjusted EBITDA was negative 10.4% in Q3 2021
compared to negative 4.2% in Q3 2020. The decline in the margin can be attributed to the
temporary cost pressure from a large number of recently launched fulfillment and logistics
facilities, as well as strategic investments into sales and marketing, technology and product, and
talent acquisition within core e-commerce business and new verticals.
In addition, Adjusted EBITDA was impacted by the one-off expenditure on an in-progress
research and development project in the amount of RUB 370 million. Further the Company made
an incremental adjustment to the estimate of an inventory valuation allowance of approximately
RUB 500 million related to the recent clarifications issued by IFRS Interpretations Committee
(IFRIC). Excluding the aggregate effect, related to the aforementioned changes to accounting
estimate and one-off R&D expenditure, Adjusted EBITDA would have amounted to a negative
RUB 10.4 billion. This corresponds to 9.6% as a percentage of GMV in Q3 2021, which indicates
a clear quarter-on-quarter improvement compared to 10.3% in Q2 2021.
Interest expense
Ozon interest expense was RUB 1,615 million compared to RUB 623 million in Q3 2020. The
higher expense was driven by the increase in the outstanding borrowings to RUB 60,358 million
as of September 30, 2021, following the issuance of the convertible bonds in February 2021 and
greater lease liabilities of RUB 35,715 million as of September 30, 2021.
Interest income
Interest income was RUB 388 million compared to RUB 51 million in Q3 2020, because of higher
deposit levels in Q3 2021. Short-term deposits are comprised of varying periods of between one
day and three month deposits, depending on the immediate cash requirements of the Company,
and earn interest at the respective short-term deposit rates.
Foreign currency exchange gain / (loss), net
Our foreign currency exchange gain amounted to RUB 515 million compared to a loss of RUB
1 million in Q3 2020, primarily caused by the change in the foreign currency position and
fluctuation in U.S. dollar exchange rates.
Income tax benefit / (expense)
Our income tax expense was RUB 19 million which is lower compared to benefit of RUB 18
million in Q3 2020 because of deferred tax charges.
Loss for the period amounted to RUB 14,018 million in Q3 2021, compared to RUB 3,879
million in Q3 2020.

13
Shares Issued
The total number of shares issued as of September 30, 2021 was 216,413,735 including
9,553,220 ADSs ordinary shares held by the Ozon Employee Benefit Trust and related to
exercise of share-based awards under equity incentive plans.
Share Based Compensation
In April 2021, the Company entered into a trust deed with a trustee for operation of the
Company’s equity incentive plans (the “EIPs”). The trust holds ordinary shares or ADSs of the
Company to be distributed under share-based awards (the “SBAs”) granted to and exercisable
by directors, officers and employees and deliver the shares or other securities exercisable under
the EIPs to such participants upon exercise. The Company neither owns shares nor has voting
rights in the trust.
In August 2021, the Company granted to Mr Alexander Shulgin, 3,200,000 RSUs with zero
exercise price. Under this grant, each RSU entitles Mr Shulgin, subject to vesting and other
terms, to receive for no consideration one ordinary share of the Company. Awards will vest with
time over ten years so that 1/40th of the RSUs subject to the award will vest on the last day of
each consecutive calendar quarter beginning March 31, 2022.
During the nine months ended September 30, 2021 the Company granted to certain employees
4,685,455 SBAs in a form of Restricted Share Units (“RSU”) with zero exercise price (including
3,200,000 SBAs granted to Mr. Alexander Shulgin). Under these grants, each RSU entitles the
recipient, subject to vesting and other terms, to receive for no consideration one ordinary share
of the Company.
In October 2021, Mr Shulgin exercised 1,058,275 ADSs under the option agreement entered on
August 1, 2018.
Cash flow from operating activities
Cash flow from operating activities was negative RUB 9.1 billion, compared to positive RUB 0.4
billion in Q3 2020 on the back of an increase in the operating costs, driven by the strategic
investments into scale, partially offset by the inflows from the working capital.
Capital Expenditure
Capital expenditure in Q3 2021 amounted to RUB 4,618 million, compared to RUB 1,674 million
in Q3 2020, mainly consisting of payments for fulfillment equipment, computer equipment and
other hardware.
Free cash flow was negative RUB 14,554 million, relative to negative RUB 1,865 million in Q3
2020.
Working Capital
Our working capital is primarily comprised of trade and other payables and inventory. Our accounts payable mainly include trade payables for the products purchased from suppliers and payables to the third-party sellers on Ozon Marketplace. As of September 30, 2021, our accounts payable amounted to RUB 47,554 million. Our inventories mainly include merchandise
14
held for resale and goods in transit, associated with our Direct (1P) Sales. As of September 30, 2021, Ozon had RUB 19,394 million of inventories.
Borrowings
Convertible bonds
On August 24, 2021 Ozon processed the first payment associated with 1.875% coupon payable semi-annually on the senior unsecured convertible bonds issued in February 2021 for the USD 750 million in aggregate principal amount. Total proceeds from the Bonds amounted to RUB 54,499 million net of RUB 988 million issue costs.
The Bonds are due 2026 at par, and are convertible into cash, ordinary shares of the Company, represented by the ADSs, or a combination of cash and the ADSs, at the Group’s discretion, based on the conversion price set at USD 86.6480. The Bonds were offered in accordance with the Regulation S under the Securities Act through a private placement only to institutional investors that are not U.S. persons, outside the United States.
Bank Loans
In August 2021, the Group received 9,900 in cash net of a one-off utilization commission of 100 under a one-year unsecured loan facility agreement with a third party bank. The loan facility carries interest at a nominal rate of 8.5% per year. The interest is payable on a monthly basis. The principal amount is repayable in August 2022.
Lease Liabilities and Commitments
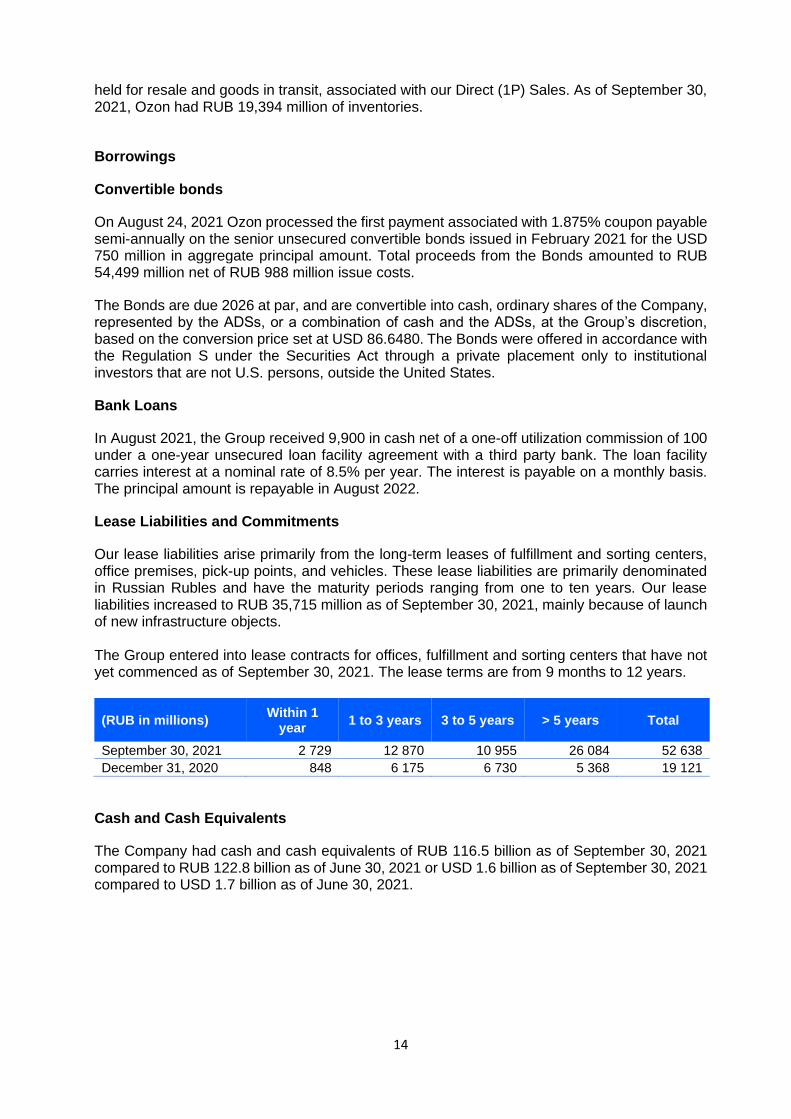
Our lease liabilities arise primarily from the long-term leases of fulfillment and sorting centers, office premises, pick-up points, and vehicles. These lease liabilities are primarily denominated in Russian Rubles and have the maturity periods ranging from one to ten years. Our lease liabilities increased to RUB 35,715 million as of September 30, 2021, mainly because of launch of new infrastructure objects. The Group entered into lease contracts for offices, fulfillment and sorting centers that have not yet commenced as of September 30, 2021. The lease terms are from 9 months to 12 years.
(RUB in millions) Within 1
year 1 to 3 years 3 to 5 years > 5 years Total
September 30, 2021 2 729 12 870 10 955 26 084 52 638
December 31, 2020 848 6 175 6 730 5 368 19 121
Cash and Cash Equivalents
The Company had cash and cash equivalents of RUB 116.5 billion as of September 30, 2021 compared to RUB 122.8 billion as of June 30, 2021 or USD 1.6 billion as of September 30, 2021 compared to USD 1.7 billion as of June 30, 2021.

15
Subsequent Events
Share-based compensation
In November 2021, the Company granted 1,419,488 RSUs with zero exercise price to certain
employees. Under this grant, each RSU entitles the recipient, subject to vesting and other terms,
to receive for no consideration one ordinary share of the Company. Awards will vest with time
over four years following the award date so that one quarter of the RSUs subject to the award
will vest on the calendar quarter end after the anniversary of the award date (cliff period) and
one sixteenth will vest on the last day of each consecutive calendar quarter.
Conference Call and Webcast Details
The Company’s management will host an analyst and investor conference call, including question-and-answer session, to discuss its financial results for the Q3 2021 ended September 30, 2021, at 16.30 Moscow time / 13.30 London / 8.30 New York on Tuesday, November 16, 2021. This call might contain material information regarding the Company’s financial and operating results as well as forward-looking statements. Please note that the forward-looking statements are based on management’s current expectations and actual results may differ materially from such statements. Live webcast can be accessed via https://edge.media-server.com/mmc/p/hwcgqxun
Company’s results presentation will be available at the Ozon Investor Relations website
https://ir.ozon.com on November 16, 2021.
Replay
Following the call, a replay will be available on the Ozon Investor Relations website https:// https://ir.ozon.com
16
Disclaimer
This press release contains forward-looking statements within the meaning of the Private
Securities Litigation Reform Act of 1995 that reflect the current views of Ozon Holdings PLC
(“we”, “our” or “us”, or the “Company”) about future events and financial performance. All
statements contained in this press release that do not relate to matters of historical fact should
be considered forward-looking statements.
These forward-looking statements are based on management’s current expectations. However,
it is not possible for our management to predict all risks, nor can we assess the impact of all
factors on our business or the extent to which any factor, or combination of factors, may cause
actual results to differ materially from those contained in any forward-looking statements we may
make. These statements are neither promises nor guarantees but involve known and unknown
risks, uncertainties and other important factors and circumstances that may cause Ozon’s actual
results, performance or achievements to be materially different from its expectations expressed
or implied by the forward-looking statements, including conditions in the U.S. capital markets,
negative global economic conditions, potential negative developments in the COVID-19
pandemic, other negative developments in Ozon’s business or unfavorable legislative or
regulatory developments. We caution you therefore against relying on these forward-looking
statements, and we qualify all of our forward-looking statements by these cautionary statements.
These and other important factors could cause actual results to differ materially from those
indicated by the forward-looking statements made in this press release. Any such forward-
looking statements represent management’s estimates as of the date of this press release.
While Ozon may elect to update such forward-looking statements at some point in the future,
Ozon disclaims any obligation to do so, even if subsequent events cause its views to change.
These forward-looking statements should not be relied upon as representing Ozon’s views as
of any date subsequent to the date of this press release.
This press release includes certain non-IFRS financial measures not presented in accordance
with IFRS, including but not limited to Contribution Profit/(Loss), Adjusted EBITDA and Free
Cash Flow. These financial measures are not measures of financial performance in accordance
with IFRS and may exclude items that are significant in understanding and assessing our
financial results. Therefore, these measures should not be considered in isolation or as an
alternative to loss for the period or other measures of profitability, liquidity or performance under
IFRS. You should be aware that the Company’s presentation of these measures may not be
comparable to similarly titled measures used by other companies, which may be defined and
calculated differently. See “Presentation of Financial and Other Information” in this press release
for a reconciliation of certain of these non-IFRS measures to the most directly comparable IFRS
measure.
This press release includes quarterly information for the three months and nine months ended
September 30, 2021 and the three months and nine months ended September 30, 2020. This
information has not been audited or reviewed by the Company’s auditors.
The trademarks included herein are the property of the owners thereof and are used for
reference purposes only. Such use should not be construed as an endorsement of the products
or services of the Company.
17
Ozon Holdings PLC
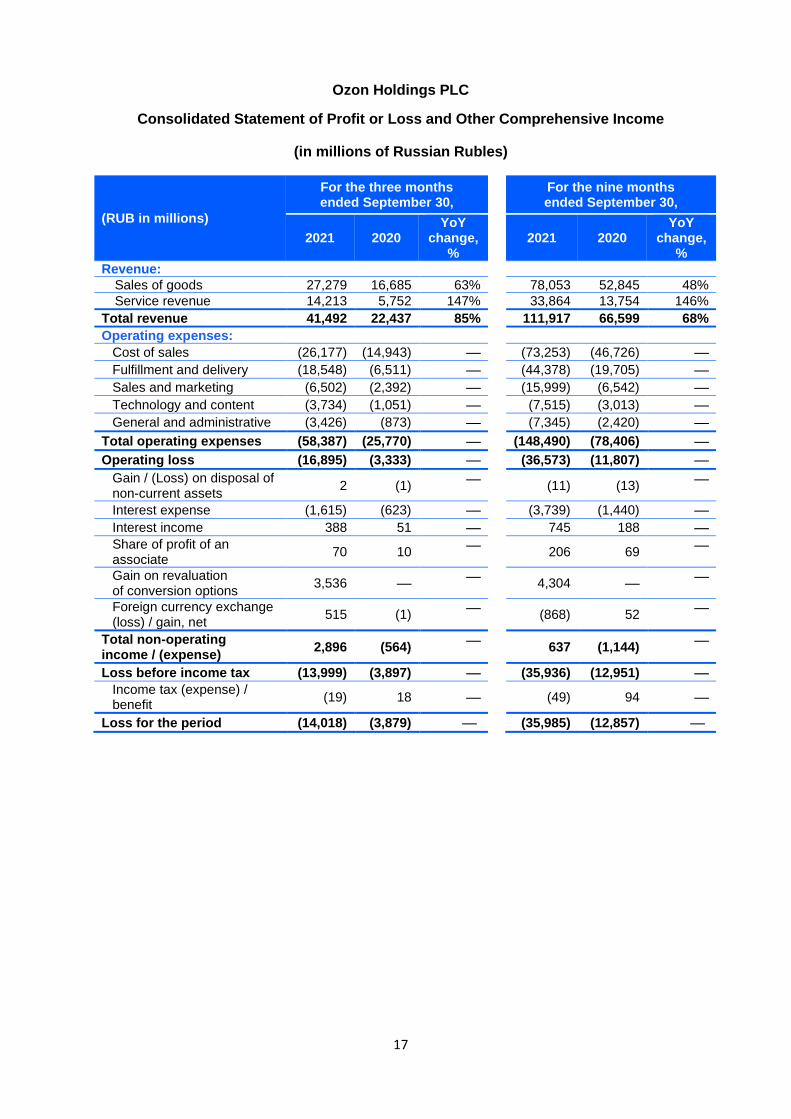
Consolidated Statement of Profit or Loss and Other Comprehensive Income
(in millions of Russian Rubles)
(RUB in millions)
For the three months ended September 30,
For the nine months ended September 30,
2021 2020 YoY
change, %
2021 2020 YoY
change, %
Revenue:
Sales of goods 27,279 16,685 63% 78,053 52,845 48%
Service revenue 14,213 5,752 147% 33,864 13,754 146%
Total revenue 41,492 22,437 85% 111,917 66,599 68%
Operating expenses:
Cost of sales (26,177) (14,943) — (73,253) (46,726) —
Fulfillment and delivery (18,548) (6,511) — (44,378) (19,705) —
Sales and marketing (6,502) (2,392) — (15,999) (6,542) —
Technology and content (3,734) (1,051) — (7,515) (3,013) —
General and administrative (3,426) (873) — (7,345) (2,420) —
Total operating expenses (58,387) (25,770) — (148,490) (78,406) —
Operating loss (16,895) (3,333) — (36,573) (11,807) —
Gain / (Loss) on disposal of non-current assets
2 (1) — (11) (13)
—
Interest expense (1,615) (623) — (3,739) (1,440) —
Interest income 388 51 — 745 188 —
Share of profit of an associate
70 10 — 206 69
—
Gain on revaluation of conversion options
3,536 — — 4,304 —
—
Foreign currency exchange (loss) / gain, net
515 (1) — (868) 52
—
Total non-operating income / (expense)
2,896 (564) — 637 (1,144)
—
Loss before income tax (13,999) (3,897) — (35,936) (12,951) —
Income tax (expense) / benefit
(19) 18 — (49) 94 —
Loss for the period (14,018) (3,879) — (35,985) (12,857) —
18
Ozon Holdings PLC
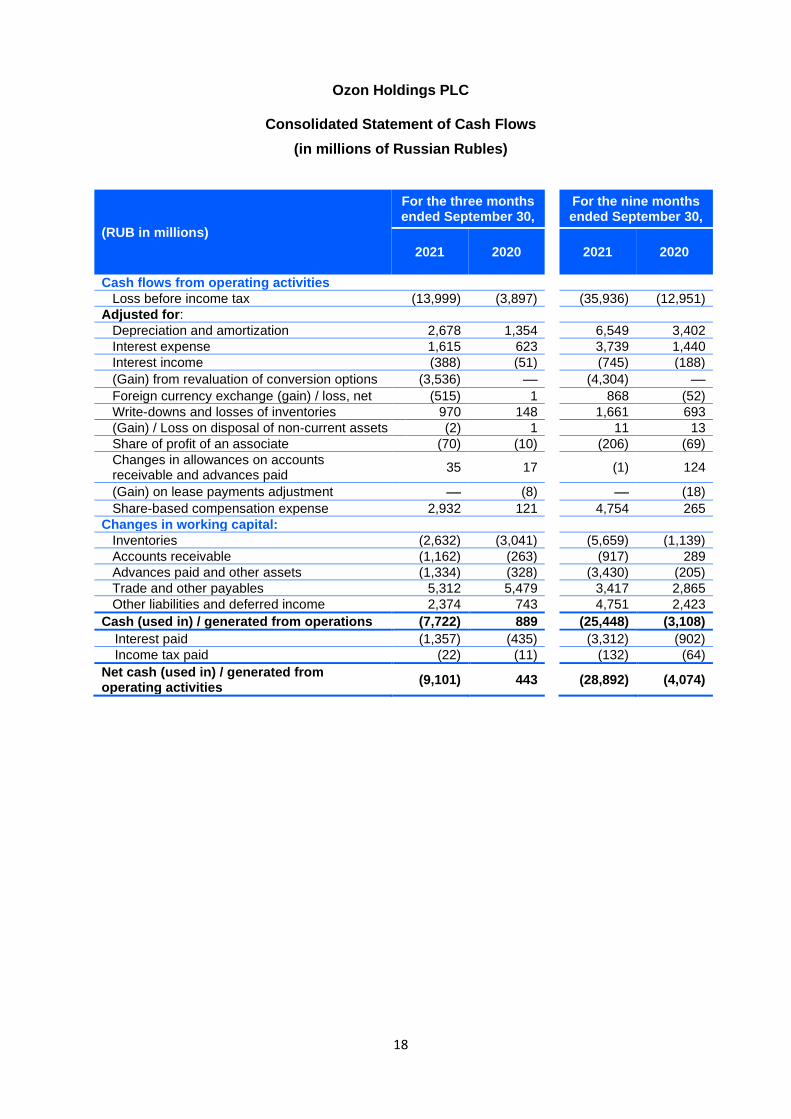
Consolidated Statement of Cash Flows
(in millions of Russian Rubles)
(RUB in millions)
For the three months ended September 30,
For the nine months ended September 30,
2021
2020 2021 2020
Cash flows from operating activities
Loss before income tax (13,999) (3,897) (35,936) (12,951)
Adjusted for:
Depreciation and amortization 2,678 1,354 6,549 3,402
Interest expense 1,615 623 3,739 1,440
Interest income (388) (51) (745) (188)
(Gain) from revaluation of conversion options (3,536) — (4,304) —
Foreign currency exchange (gain) / loss, net (515) 1 868 (52)
Write-downs and losses of inventories 970 148 1,661 693
(Gain) / Loss on disposal of non-current assets (2) 1 11 13
Share of profit of an associate (70) (10) (206) (69)
Changes in allowances on accounts receivable and advances paid
35 17 (1) 124
(Gain) on lease payments adjustment — (8) — (18)
Share-based compensation expense 2,932 121 4,754 265
Changes in working capital:
Inventories (2,632) (3,041) (5,659) (1,139)
Accounts receivable (1,162) (263) (917) 289
Advances paid and other assets (1,334) (328) (3,430) (205)
Trade and other payables 5,312 5,479 3,417 2,865
Other liabilities and deferred income 2,374 743 4,751 2,423
Cash (used in) / generated from operations (7,722) 889 (25,448) (3,108)
Interest paid (1,357) (435) (3,312) (902)
Income tax paid (22) (11) (132) (64)
Net cash (used in) / generated from operating activities
(9,101) 443 (28,892) (4,074)

19
Ozon Holdings PLC
Consolidated Statement of Cash Flows (Continued)
(in millions of Russian Rubles)
(RUB in millions)
For the three months ended September 30,
For the nine months ended September 30,
2021
2020 2021 2020
Cash flows from investing activities
Purchase of property, plant and equipment (4,417) (1,626) (9,994) (4,708)
Purchase of intangible assets (201) (48) (506) (73)
Interest received 353 43 702 167
Dividends received from an associate — — 141 —
Placement of bank deposits (2,966) — (2,966) —
Issuance of loans (137) — (137) —
Net cash used in investing activities (7,368) (1,631) (12,760) (4,614)
Cash flows from financing activities
Convertible bonds issue proceeds — — 54,499 —
Proceeds from exercise of share option 313 — 313 —
Convertible loans issue proceeds — — — 6,171
Proceeds from borrowings 9,900 441 10,131 6,418
Repayment of borrowings (111) (39) (6,382) (370)
Payment of principal portion of lease liabilities (835) (634) (2,513) (1,498)
Net cash (used in) / generated from financing activities
9,267 (232) 56,048 10,721
Net (decrease) / increase in cash and cash equivalents
(7,202) (1,420) 14,396 2,033
Cash and cash equivalents at the beginning of the period
122,849 6,500 103,702 2,994
Effects of exchange rate changes on the balance of cash held in foreign currencies
821 46 (1,630) 99
Cash and cash equivalents at the end of the period
116,468 5,126 116,468 5,126

20
Ozon Holdings PLC
Consolidated Statement of Financial Position (in millions of Russian Rubles)
(RUB in millions) As of
September 30, 2021 December 31, 2020
Assets
Non-current assets
Property, plant and equipment 16,874 11,869
Right-of-use assets 33,322 14,579
Intangible assets 830 317
Investments in an associate 1,235 1,111
Deferred tax assets 53 44
Advances for non-current assets and security deposits 6,276 1,880
Total non-current assets 58,590 29,800
Current assets
Inventories 19,394 15,342
Accounts receivable 4,400 3,405
Prepaid income tax 40 14
VAT receivable 1,127 908
Advances and prepaid expenses 2,934 1,055
Short-term bank deposits 2,918 22
Other current assets 617 360
Cash and cash equivalents 116,468 103,702
Total current assets 147,898 124,808
Total assets 206,488 154,608
Equity and liabilities
Equity
Share capital 12 11
Share premium 134,174 133,439
Treasury shares (1) —
Equity-settled employee benefits reserves 5,484 1,152
Other capital reserves — —
Accumulated losses (91,330) (55,345)
Total equity 48,339 79,257
21
Ozon Holdings PLC
Consolidated Statement of Financial Position (Continued)
(in millions of Russian Rubles)
(RUB in millions) As of
September 30, 2021 December 31, 2020
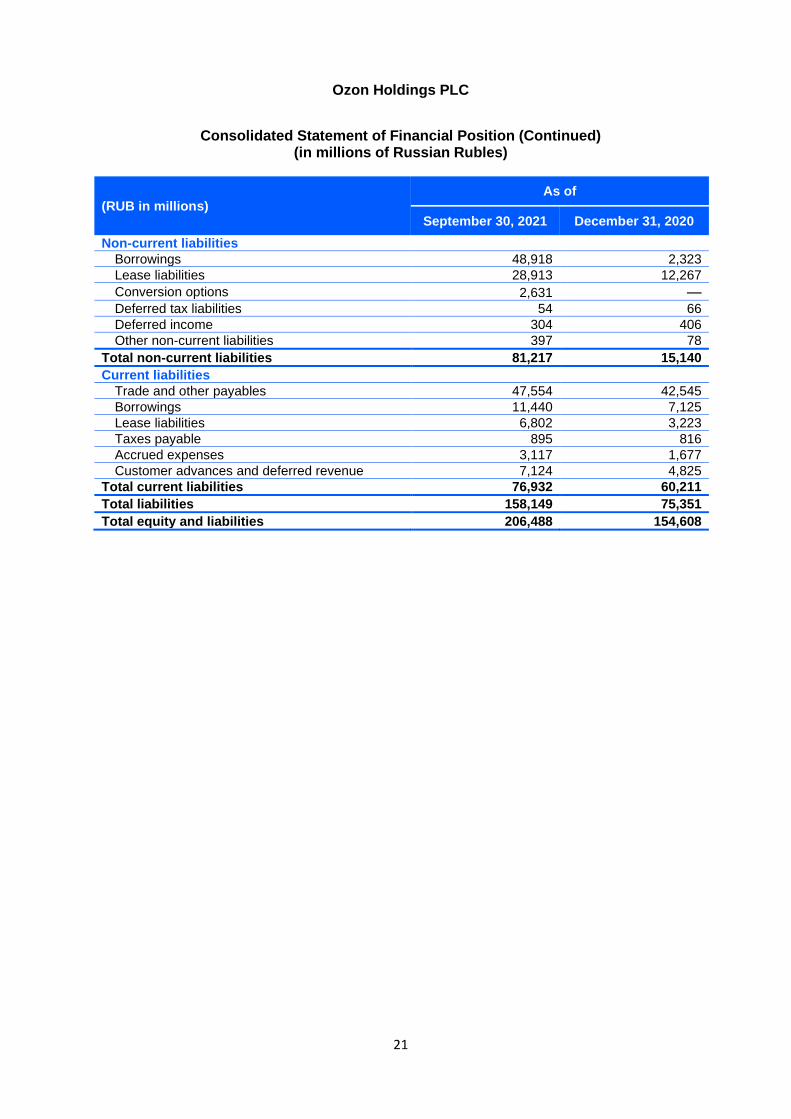
Non-current liabilities
Borrowings 48,918 2,323
Lease liabilities 28,913 12,267
Conversion options 2,631 —
Deferred tax liabilities 54 66
Deferred income 304 406
Other non-current liabilities 397 78
Total non-current liabilities 81,217 15,140
Current liabilities
Trade and other payables 47,554 42,545
Borrowings 11,440 7,125
Lease liabilities 6,802 3,223
Taxes payable 895 816
Accrued expenses 3,117 1,677
Customer advances and deferred revenue 7,124 4,825
Total current liabilities 76,932 60,211
Total liabilities 158,149 75,351
Total equity and liabilities 206,488 154,608
22
Presentation of Financial and Other Information
Use of Non-IFRS Financial Measures
We report under International Financial Reporting Standards (“IFRS”) as adopted by the
International Accounting Standards Board (the “IASB”). None of our financial statements were
prepared in accordance with generally accepted accounting principles in the United States. We
present our consolidated financial statements in Rubles.
Certain parts of this press release contain non-IFRS financial measures, including, among
others, Contribution Profit/(Loss), Adjusted EBITDA and Free Cash Flow. We define:
• Contribution Profit/(Loss) as loss for the period before income tax benefit/(expense), total non-operating (expense)/income, general and administrative expenses, technology and content expenses and sales and marketing expenses.
• Adjusted EBITDA as loss for the period before income tax benefit/(expense), total non-operating (expense)/income, depreciation and amortization and share-based compensation expense.
• Free Cash Flow as net cash generated from / (used in) operating activities less payments for purchase of property, plant and equipment and intangible assets, and the payment of the principal portion of lease liabilities.
Contribution Profit/(Loss), Adjusted EBITDA and Free Cash are used by our management to monitor the underlying performance of the business and its operations. These measures are used by other companies for a variety of purposes and are often calculated in ways that reflect the circumstances of those companies. You should exercise caution in comparing these measures as reported by us to the same or similar measures as reported by other companies. Contribution Profit/(Loss), Adjusted EBITDA and Free Cash Flow may not be comparable to similarly titled metrics of other companies. These measures are unaudited and have not been prepared in accordance with IFRS or any other generally accepted accounting principles.
Contribution Profit/(Loss), Adjusted EBITDA and Free Cash Flow are not measurements of
performance or liquidity under IFRS or any other generally accepted accounting principles, and
you should not consider them as an alternative to loss for the period, operating loss, net cash
generated from / (used in) operating activities or other financial measures determined in
accordance with IFRS or other generally accepted accounting principles. These measures have
limitations as analytical tools, and you should not consider them in isolation. Accordingly,
prospective investors should not place undue reliance on these non-IFRS financial measures
contained in this press release.

23
Other Key Operating Measures
Certain parts of this press release contain our key operating measures, including, among others,
gross merchandise value including revenue from services (“GMV incl. services”), Gross profit,
share of our online marketplace (our “Marketplace”) GMV (“Share of Marketplace GMV”),
number of orders and number of active buyers. We define:
• GMV incl. services as the total value of orders processed through our platform, as well as revenue from services to our buyers and sellers, such as delivery, advertising and other services rendered by our Ozon.ru operating segment. GMV incl. services is inclusive of value added taxes, net of discounts, returns and cancellations. GMV incl. services does not represent revenue earned by us. GMV incl. services does not include travel ticketing commissions, other service revenues or value of orders processed through our Ozon.travel operating segment.
• Gross profit represents revenue less cost of sales in a given period.
• Share of Marketplace GMV as the total value of orders processed through our Marketplace, inclusive of value added taxes, net of discounts, returns and cancellations, divided by GMV incl. services in a given period. Share of Marketplace GMV includes only the value of goods processed through our platform and does not include services revenue.
• Number of orders as the total number of orders delivered in a given period, net of returns and cancellations.
• Number of active buyers as the number of unique buyers who placed an order on our platform within the 12-month period preceding the relevant date, net of returns and cancellations.
24
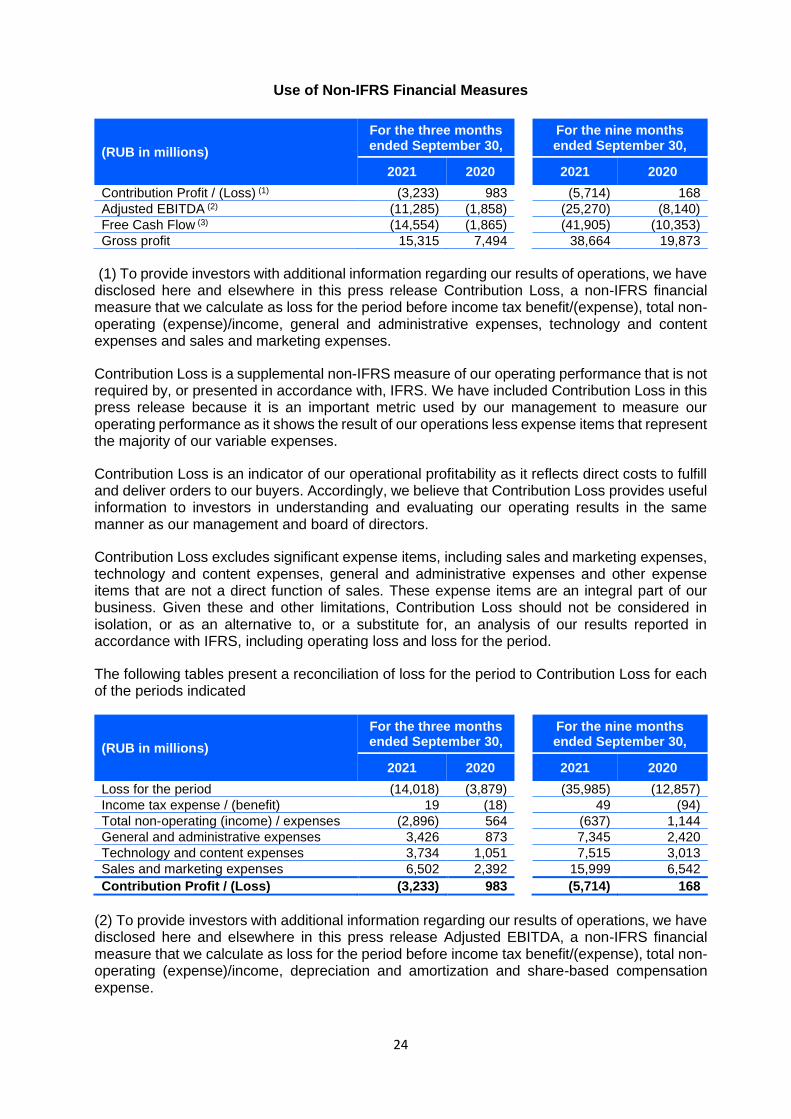
Use of Non-IFRS Financial Measures
(RUB in millions)
For the three months ended September 30,
For the nine months ended September 30,
2021 2020
2021 2020
Contribution Profit / (Loss) (1) (3,233) 983 (5,714) 168
Adjusted EBITDA (2) (11,285) (1,858) (25,270) (8,140)
Free Cash Flow (3) (14,554) (1,865) (41,905) (10,353)
Gross profit 15,315 7,494 38,664 19,873
(1) To provide investors with additional information regarding our results of operations, we have disclosed here and elsewhere in this press release Contribution Loss, a non-IFRS financial measure that we calculate as loss for the period before income tax benefit/(expense), total non-operating (expense)/income, general and administrative expenses, technology and content expenses and sales and marketing expenses.
Contribution Loss is a supplemental non-IFRS measure of our operating performance that is not required by, or presented in accordance with, IFRS. We have included Contribution Loss in this press release because it is an important metric used by our management to measure our operating performance as it shows the result of our operations less expense items that represent the majority of our variable expenses.
Contribution Loss is an indicator of our operational profitability as it reflects direct costs to fulfill and deliver orders to our buyers. Accordingly, we believe that Contribution Loss provides useful information to investors in understanding and evaluating our operating results in the same manner as our management and board of directors.
Contribution Loss excludes significant expense items, including sales and marketing expenses, technology and content expenses, general and administrative expenses and other expense items that are not a direct function of sales. These expense items are an integral part of our business. Given these and other limitations, Contribution Loss should not be considered in isolation, or as an alternative to, or a substitute for, an analysis of our results reported in accordance with IFRS, including operating loss and loss for the period.
The following tables present a reconciliation of loss for the period to Contribution Loss for each of the periods indicated
(RUB in millions)
For the three months ended September 30,
For the nine months ended September 30,
2021 2020
2021 2020
Loss for the period (14,018) (3,879) (35,985) (12,857)
Income tax expense / (benefit) 19 (18) 49 (94)
Total non-operating (income) / expenses (2,896) 564 (637) 1,144
General and administrative expenses 3,426 873 7,345 2,420
Technology and content expenses 3,734 1,051 7,515 3,013
Sales and marketing expenses 6,502 2,392 15,999 6,542
Contribution Profit / (Loss) (3,233) 983 (5,714) 168
(2) To provide investors with additional information regarding our results of operations, we have disclosed here and elsewhere in this press release Adjusted EBITDA, a non-IFRS financial measure that we calculate as loss for the period before income tax benefit/(expense), total non-operating (expense)/income, depreciation and amortization and share-based compensation expense.
25
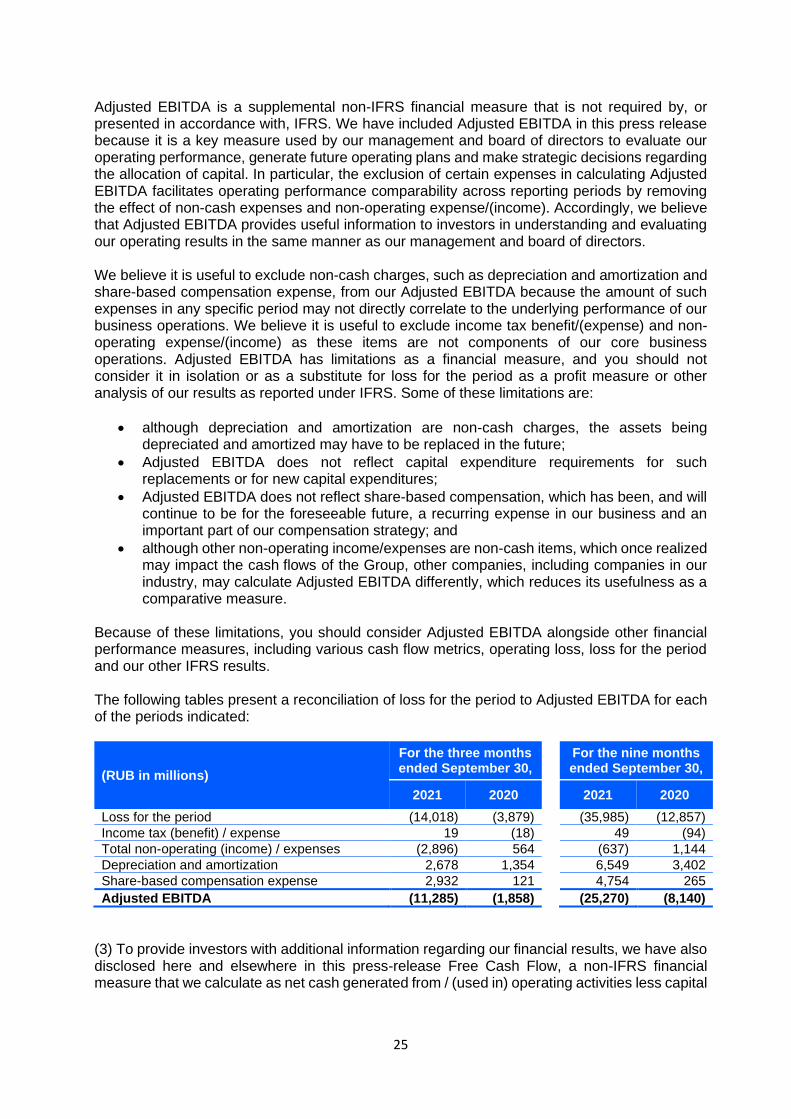
Adjusted EBITDA is a supplemental non-IFRS financial measure that is not required by, or presented in accordance with, IFRS. We have included Adjusted EBITDA in this press release because it is a key measure used by our management and board of directors to evaluate our operating performance, generate future operating plans and make strategic decisions regarding the allocation of capital. In particular, the exclusion of certain expenses in calculating Adjusted EBITDA facilitates operating performance comparability across reporting periods by removing the effect of non-cash expenses and non-operating expense/(income). Accordingly, we believe that Adjusted EBITDA provides useful information to investors in understanding and evaluating our operating results in the same manner as our management and board of directors. We believe it is useful to exclude non-cash charges, such as depreciation and amortization and share-based compensation expense, from our Adjusted EBITDA because the amount of such expenses in any specific period may not directly correlate to the underlying performance of our business operations. We believe it is useful to exclude income tax benefit/(expense) and non-operating expense/(income) as these items are not components of our core business operations. Adjusted EBITDA has limitations as a financial measure, and you should not consider it in isolation or as a substitute for loss for the period as a profit measure or other analysis of our results as reported under IFRS. Some of these limitations are:
• although depreciation and amortization are non-cash charges, the assets being depreciated and amortized may have to be replaced in the future;
• Adjusted EBITDA does not reflect capital expenditure requirements for such replacements or for new capital expenditures;
• Adjusted EBITDA does not reflect share-based compensation, which has been, and will continue to be for the foreseeable future, a recurring expense in our business and an important part of our compensation strategy; and
• although other non-operating income/expenses are non-cash items, which once realized may impact the cash flows of the Group, other companies, including companies in our industry, may calculate Adjusted EBITDA differently, which reduces its usefulness as a comparative measure.
Because of these limitations, you should consider Adjusted EBITDA alongside other financial performance measures, including various cash flow metrics, operating loss, loss for the period and our other IFRS results. The following tables present a reconciliation of loss for the period to Adjusted EBITDA for each of the periods indicated:
(RUB in millions)
For the three months ended September 30,
For the nine months ended September 30,
2021 2020
2021 2020
Loss for the period (14,018) (3,879) (35,985) (12,857)
Income tax (benefit) / expense 19 (18) 49 (94)
Total non-operating (income) / expenses (2,896) 564 (637) 1,144
Depreciation and amortization 2,678 1,354 6,549 3,402
Share-based compensation expense 2,932 121 4,754 265
Adjusted EBITDA (11,285) (1,858) (25,270) (8,140)
(3) To provide investors with additional information regarding our financial results, we have also disclosed here and elsewhere in this press-release Free Cash Flow, a non-IFRS financial measure that we calculate as net cash generated from / (used in) operating activities less capital
26
expenditures, which consist of payments for purchase of property, plant and equipment and intangible assets, and the payment of the principal portion of lease liabilities.
Free Cash Flow is a supplemental non-IFRS financial measure that is not required by, or presented in accordance with, IFRS. We have included Free Cash Flow in this press release because it is an important indicator of our liquidity as it measures the amount of cash we generate/(use) and provides additional perspective on the impact of our cash capital expenditures and assets used by us through lease obligations. Accordingly, we believe that Free Cash Flow provides useful information to investors in understanding and evaluating our operating results in the same manner as our management and board of directors.
Free Cash Flow has limitations as a financial measure, and you should not consider it in isolation or as substitutes for net cash used in operating activities as a measure of our liquidity or other analysis of our results as reported under IFRS. There are limitations to using non-IFRS financial measures, including that other companies, including companies in our industry, may calculate Free Cash Flow differently. Because of these limitations, you should consider Free Cash Flow alongside other financial performance measures, including net cash generated from/(used in) operating activities, capital expenditures and our other IFRS results.
The following tables present a reconciliation of loss for the period to Free Cash Flow for each of the periods indicated:
(RUB in millions)
For the three months ended September 30,
For the nine months ended September 30,
2021 2020 2021 2020
Net cash (used in) / generated from operating activities
(9,101) 443 (28,892) (4,074)
Purchase of property, plant and equipment (4,417) (1,626) (9,994) (4,708)
Purchase of intangible assets (201) (48) (506) (73)
Payment of the principal portion of lease liabilities
(835) (634) (2,513) (1,498)
Free Cash Flow (14,554) (1,865) (41,905) (10,353)
27
About OZON Ozon is a leading multi-category e-commerce platform and one of the largest internet companies in Russia. Its fulfillment infrastructure and delivery network have some of the widest coverage among e-commerce players in the country, enabling Ozon to provide Russian population with fast and convenient delivery via couriers, pick-up points, and parcel lockers. Its extensive logistics footprint and fast-developing marketplace platform allow thousands of entrepreneurs to sell their products across Russia’s 11 time zones and offer millions of customers one of the widest selections of goods across multiple product categories. Ozon actively seeks to expand its value-added services such as fintech and other new verticals such as Ozon Express online grocery delivery. For more information, please visit https://corp.ozon.com/
Contacts Investor Relations Maryia Berasneva-McNamara, Head of Investor Relations, OZON [email protected] Press Office Maria Zaikina, Director of Public & Industry Relations, OZON [email protected]