Oxygen regulation of vascular smooth muscle cell ... · Oxygen regulation of vascular smooth muscle...
195
Oxygen regulation of vascular smooth muscle cell proliferation and survival by Julie Basu Ray A thesis submitted in conformity with the requirements for the degree of doctor of philosophy Institute of Medical Sciences University of Toronto © Copyright by Julie Basu Ray, 2009
Transcript of Oxygen regulation of vascular smooth muscle cell ... · Oxygen regulation of vascular smooth muscle...

Oxygen regulation of vascular smooth muscle cell
proliferation and survival
by
Julie Basu Ray
A thesis submitted in conformity with the requirements
for the degree of doctor of philosophy
Institute of Medical Sciences
University of Toronto
© Copyright by Julie Basu Ray, 2009

ii
Oxygen regulation of vascular smooth muscle cell
proliferation and survival
Julie Basu Ray
Doctor of Philosophy
Institute of Medical Sciences
University of Toronto
2009
ABSTRACT
Arterial smooth muscle cells (SMCs) from the systemic and pulmonary circulations
experience a broad range of oxygen concentrations under physiological conditions. The hypoxic
response, however, has been inconsistent, with both enhanced proliferation and growth arrest
being reported. This variability precludes a definitive conclusion regarding the role of oxygen
tension in arterial disease.
In the first part of this study, we determined if hypoxia elicits different proliferative and
apoptotic responses in human aortic SMCs (HASMCs) incubated under conditions which do or
do not result in cellular ATP depletion and whether these effects are relevant to vascular
remodeling in vivo. Gene expression profiling was used to identify potential regulatory
pathways. In HASMCs incubated at 3% O2, proliferation and progression through G1/S
interphase are enhanced. Incubation at 1% O2 reduced proliferation, delayed G1/S transition,
increased apoptosis and cellular ATP levels were reduced. In aorta and mesenteric artery from
hypoxia exposed rats, both proliferation and apoptosis are increased after 48hrs. p53 and
p21expression is differentially affected in HASMCs incubated at 1% and 3% O2. Hypoxia
iii
induces a state of enhanced cell turnover, conferring the ability to remodel the vasculature in
response to changing tissue metabolic needs while avoiding the accumulation of mutations that
may lead to malignant transformation or abnormal vascular structure formation. A unifying
hypothesis in which events at the G1/S transition and apoptosis activation are coordinated by
effects on p53, p21, their downstream effector genes and regulatory factors is proposed.
Differences in the contractile responses of systemic and pulmonary arterial smooth
muscle cells to hypoxia are well studied. Differences in proliferation and survival are anticipated
because of differences in embryonal cell origin, oxygen concentrations within their respective
microenvironments and in cellular energetics but these responses have not been directly
compared.
In the second part of the study, human pulmonary arterial SMCs (HPASMCs)
proliferated at oxygen concentrations which inhibited cell growth in HASMCs. HPASMCs
survived and maintained their intracellular ATP levels at levels of hypoxia sufficient to deplete
ATP and induce apoptosis in HASMCs. In vivo studies in rats show proliferation and apoptosis
in main or branch PASMCs only after 7 days of hypoxia. VSMCs are able to proliferate under
hypoxic conditions as long as cellular ATP levels are maintained. HPASMCs have an enhanced
capacity to maintain cellular energy status compared to HASMCs and hence their viability is
preserved and the proliferative response predominates at lower oxygen concentrations.

iv
“I have become my own version of an optimist. If I can't make it through one door, I'll go
through another door - or I'll make a door. Something terrific will come no matter how dark the
present.”
Rabindranath Tagore
“Take up one idea. Make that one idea your life - think of it, dream of it, live on that idea.
Let the brain, muscles, nerves, every part of your body, be full of that idea, and just leave every
other idea alone. This is the way to success.”
Swami Vivekananda

v
ACKNOWLEDGMENTS
The path towards this work spans several years of research and it is a pleasure to thank the
many people who made this thesis possible. I acknowledge my debt to all those who have helped
along the way, who have been involved and contributed to the presented ideas and understanding
gained.
It is difficult to overstate my gratitude to my Ph.D. supervisor, Dr. Michael E Ward. With
his enthusiasm, his inspiration, and his great efforts to explain things clearly and simply, he
helped to make research fun for me. I am indebted to his continued encouragement and
invaluable suggestions especially during my thesis-writing period. He has been a wonderful
guide and a great teacher. I would also like to include my gratitude to Dr. Linda Penn, my co-
supervisor, and Dr. Philip Marsden who have provided support for this research all along the
way.
I am deeply indebted to my student colleagues at the Terrence Donnelley Research
Laboratories at the St. Michael’s Hospital, for providing a stimulating and fun environment in
which to learn and grow. I would specially like to thank Jeff He, Lakshmi Kugathasan, Massey
Rezai and Yupu Deng for their extremely valuable support, and insights. Many others who have
been involved also deserve recognition. It is, however, not possible to list them all here. Their
support in this effort is, however, greatly appreciated.
I would like to thank the many people who have initiated me into the rites of science - my
high school teachers at Calcutta Girls’ High School, my undergraduate teachers at Presidency
College, and my graduate teachers at the University of Calcutta, India.

vi
I wish to thank my friends in high school, college and university, and my friends in Toronto,
Buffalo and Boston, whose continued support helped me get through the difficult times, and for
all their emotional support, camaraderie, entertainment, and caring they provided.
Finally I want to thank my family. A special thought is devoted to my parents, Anil and
Jayanti Ghosh for a never-ending support. They bore me, raised me, supported me, taught me,
and loved me. I am indebted to my entire family for providing a loving environment for me.
The encouragement and support from my husband, Indranill, have always been a powerful
source of inspiration and energy.
Lastly, and most importantly, I thank from the bottom of my heart my son, Ishan, whose
adjustment and sacrifice of many a childhood demand and wish have helped me sail through to
this goal. To him I dedicate this thesis.

vii
CONTRIBUTIONS
The work presented in Chapter 2 has been published in Am J Physiol Heart Circ Physiol
Feb 2008; 294: H839 - H852. Basu Ray J, Arab S, Deng Y, Liu P, Penn L, Courtman DW, Ward
ME. Oxygen Regulation of Arterial Smooth Muscle Cell Proliferation and Survival. Permission
has been obtained from the American Physiological Society and all of the authors for inclusion
of the paper in the thesis.
As the first author of the publication, I contributed to study design, figure making and
manuscript writing. I performed all of the experiments and data analysis except Table 2.1:
Experiment and data analysis was done by Dr. Sara Arab from Dr. Peter Liu’s lab at the Toronto
Genomic Core Centre at the Hospital for Sick Children. Dr. Yupu Deng has helped with the
animal sacrifices for Figures 2.10 and 2.11 and confocal microscopic analysis of sections.
The work presented in Chapter 3 has been written into a manuscript and is expected to be
submitted for publication before December 2009. As the first author of this manuscript, I
contributed to study design, figure making and manuscript writing. I performed all of the
experiments and data analysis. Dr. Yupu Deng has helped with the animal sacrifices for Figures
3.7 and 3.8.
In the Supplement chapter, experiment design and data analysis for Figure S1 has been
done by Karen Ho from Dr. Philip A Marsden’s lab.
The research work has been funded by Canadian Institute of Health Research Grant and
Keenan Collaborative Research Award by Keenan Research Foundation, Toronto.

viii
TABLE OF CONTENTS
ABBREVIATIONS xi
LIST OF FIGURES xiii
LIST OF TABLES xvi
CHAPTER 1 Review of literature
1.1 Introduction 2
1.2 Systemic and pulmonary circulations 2
1.3 Vascular smooth muscle cells 5
1.4 Oxygen delivery 6
1.5 Physiological responses to hypoxia 9
1.5.1 Systemic responses 9
1.5.2 Regulation of cellular metabolism 10
1.6 Regulation of gene expression 11
1.6.1 Hypoxia-inducible factors 12
1.6.2 Regulation of HIF activity 14
1.6.3 HIFs as transcriptional regulators 17
1.6.4 HIF independent transcriptional activation 21
1.7 Hypoxic regulation of mRNA stability 23
1.8 Hypoxic repression of transcription 23
1.9 Hypoxic control of protein translation 25
1.10 Cell cycle and hypoxia 25
1.10.1 The mammalian cell cycle 25
1.10.2 Effects of hypoxia on cell cycle 30
1.11 Apoptosis and hypoxia 32
1.11.1 Apoptotic pathways 32
1.11.2 Regulation of apoptosis during hypoxia 38
1.11.2.1 Role of p53 in hypoxia-induced apoptosis 38

ix
1.11.2.2 Role of Bcl-2 family proteins 39
1.11.2.3 Role of PI3-kinase pathway 40
1.11.2.4 Role of electron transport chain inhibition 41
1.12 Oxygen sensing mechanisms 42
1.12.1 Evidence of heme as oxygen sensor 43
1.12.2 NAD(P)H oxidases 44
1.12.3 Mitochondria 47
1.13 Thesis objective 50
1.14 Aims and hypotheses 52
CHAPTER 2 Oxygen regulation of systemic arterial smooth muscle cell proliferation and
survival
2.1 Introduction 54
2.2 Materials and Methods
2.2.1 Antibodies and reagents 56
2.2.2 Cell culture studies 56
2.2.3 Cell counting 57
2.2.4 [3H]-thymidine incorporation 57
2.2.5 Ki67 protein levels 58
2.2.6 Annexin V- Propidium iodide labeling 58
2.2.7 Caspase activation 59
2.2.8 TUNEL 59
2.2.9 Cell cycle analysis 59
2.2.10 Mitochondrial membrane potential 60
2.2.11 Intracellular ATP concentration 60
2.2.12 Western blotting 60
2.2.13 Microarray analysis 61
2.2.14 In vivo apoptosis 63
2.2.15 In vivo proliferation 64

x
2.3 Results 66
2.4 Discussion 89
CHAPTER 3 Oxygen regulation of pulmonary arterial smooth muscle cell proliferation
and survival
3.1 Introduction 98
3.2 Materials and Methods
3.2.1 Antibodies and reagents 101
3.2.2 Cell Culture Studies 101
3.2.3 Cell counting 102
3.2.4 Cell cycle analysis / BrdU incorporation 102
3.2.5 Annexin V- Propidium iodide labeling 102
3.2.6 Caspase activation 103
3.2.7 Mitochondrial membrane depolarization 103
3.2.8 Measurement of Intracellular ATP concentration 103
3.2.9 Western blotting 104
3.2.10 In vivo apoptosis 105
3.2.11 In vivo proliferation 106
3.3 Results 108
3.4 Discussion 128
CHAPTER 4 General discussion and conclusions 135
CHAPTER 5 Future directions 143
Supplement 150
REFERENCES 158

xi
ABBREVIATIONS
ANOVA analysis of variance
APAF apoptotic protease activating factor
AP-1 activator protein 1
ARD1 arrest defective 1
ARNT aryl hydrocarbon receptor nuclear translocator
ATM ataxia telangiectasia mutated
ATP adenosine triphosphate
ATR ATM and rad3 related
Bcl B-cell leukemia/lymphoma
bHLH basic helix-loop-helix
BNIP BCL2/adenovirus E1B 19kD interacting protein like
BrdU Bromodeoxyuridine
CBP CREB binding protein
CCN Cyclin
CDK Cyclin dependent kinase
CDKI Cyclin dependent kinase inhibitor
CO carbon monoxide
Dec1 deleted in esophageal cancer 1
DPG 2,3-disphosphoglycerate
eIF eukaryotic initiation factor
ets-1 erythroblastosis virus E26 oncogene homolog-1
ET-1 endothelin-1
ETC electron transfer chain
FIH factor-inhibiting HIF
H2O2 hydrogen peroxide
HIF hypoxic inducible factor
HO heme oxygenase
HPV hypoxic pulmonary vasoconstriction
HRE hypoxia responsive element
HUVEC human umbilical vein endothelial cell
HVR hypoxic ventilatory response
IAP inhibitor of apoptosis
IRES internal ribosomal entry site
JC-1 5,5’,6,6’-tetrachloro-1,1’,3,3’-tetraethylbenzimidazolcarbocyanine iodide
Kv voltage activated potassium current
MAPK mitogen-activated protein kinase
MMP-2 matrix metalloproteinase-2
mTOR mammalian target of rapamycin
NLS nuclear localization signal
NO nitric oxide
ODD oxygen dependent degradation domain
ORP150 oxygen-regulated protein 150

xii
PERK PKR-like endoplasmic reticulum kinase
PHD prolyl hydroxylase
PI propidium iodide
pO2 partial pressure of oxygen
PPAR peroxisome proliferator-activated receptor gamma
ROS reactive oxygen species
SRC sarcoma (Schmidt-Ruppin A-2) viral oncogene homolog
TAD transactivation domain
TIF transcriptional intermediary factor 1
TIMP tissue inhibitors of matrix metalloproteinase
TNF- tumor necrosis factor
UTR untranslated region
VEGF vascular endothelial growth factor
VHL von Hippel-Lindau
VSMC vascular smooth muscle cell

xiii
LIST OF FIGURES
CHAPTER 1
Figure 1.1 Regional distribution of pO2 from the airways to the cytosol 7
Figure 1.2 Oxyhaemoglobin dissociation curve 8
Figure 1.3 HIF-1, HIF-2 and HIF-3 subunit structure 13
Figure 1.4 Regulation of HIF activity 16
Figure 1.5 Cell cycle phases and G1/S transition 30
Figure 1.6 Pathways of apoptosis 37
Figure 1.7 Heme sensor model 43
Figure 1.8 Structure of NAD(P)H oxidase 45
Figure 1.9 NAD(P)H oxidase as oxygen sensor 46
Figure 1.10 Mitochondrial electron transport chain 47
CHAPTER 2
Figure 2.1 (A) Effects of hypoxia on HASMC cell numbers. Effects of HASMC cell
numbers to PDGF-BB at (B) 1% O2 and (C) and 3% O2. 67
Figure 2.2 [3H]-Thymidine incorporation in HASMCs after incubation at (A) 1% O2 and
(B) 3% O2 compared with the normoxic cells. 70
Figure 2.3 The percentage of cells positive for the Ki67 antigen after incubation at (A) 1%
O2 and (B) at 3% O
2. 71
Figure 2.4 CDC6 (A and B) and MCM2 (C and D) protein levels after normoxic and
hypoxic (1% O2 and 3% O2) incubation. 72

xiv
Figure 2.5 Flow cytometric analysis of propidium iodide stained cells at (A) 1% O2 and
(B) 3% O2. 74
Figure 2.6 Apoptosis assays in HASMCs. (A) Annexin V/PI (B) Caspase activity and (C)
TUNEL. 75
Figure 2.7 Mitochondrial membrane depolarization after incubation at 1% O2 (A) and 3%
O2 (B). 78
Figure 2.8 Cellular ATP concentration after incubation at 1% O2 (A) and 3% O2 (B).
79
Figure 2.9 Nuclear levels of (A) HIF-1 , (B) p21 and (C) p53 after incubation of
HASMCs at normoxic and hypoxic (1% or 3% O2) conditions. 82
Figure 2.10 (A) PI staining of en face sections and (B) TUNEL in paraffin embedded
sections of normoxic and hypoxic rat aorta and mesenteric artery. (C)
Quantitative analysis 84
Figure 2.11 (A) Immunohistochemical staining of incorporated BrdU (B) Double staining
with TO-PRO-3 and (C) -Smooth Muscle Actin in paraffin embedded sections
of normoxic and hypoxic rat aorta and mesenteric artery (D) Quantitative
analysis of incorporated BrdU and TO-PRO-3 staining. 87
CHAPTER 3
Figure 3.1 Effects of hypoxia on human pulmonary artery smooth muscle (HPASMC) (A)
cell numbers and (B) viability 109
Figure 3.2 % BrdU incorporated cells in HPASMCs 111
Figure 3.3 (A,B) Annexin V/PI (C,D) Caspase activity and (E) JC-1 monomer formation
after incubation at 3%, 1% and 0% O2 113

xv
Figure 3.4 Cell cycle analysis of propidium iodide stained normoxic and hypoxic (3%, 1%
or 0% O2) HPASMC cells. 117
Figure 3.5 Nuclear levels of (A) p21, (B) p53 and (C) HIF-1 in HPASMCs at normoxic
and hypoxic (1% or 3% O2) conditions. 119
Figure 3.6 Cellular ATP concentrations in normoxic and hypoxic (3%, 1% or 0% O2)
HPASMC cells. 122
Figure 3.7 (A) PI staining of en face sections of normoxic and hypoxic rat pulmonary
artery and pulmonary artery branch, (B) Quantitative analysis of PI stained
cells, (C) TUNEL in paraffin-embedded sections of normoxic and hypoxic rat
pulmonary artery and pulmonary artery branch (D) Quantitative analysis of
TUNEL positive cells. 124
Figure 3.8 (A) Immunohistochemical staining of incorporated BrdU and -smooth muscle
actin in paraffin-embedded sections of pulmonary artery and pulmonary artery
branch from normoxic and hypoxic rats. (B) Quantitative analysis of BrdU
positive cells. 126
Supplement
Figure S1 Average fold change of mitochondrial DNA levels 152
Figure S2 Cytoplasmic levels of Phosphoglycerate kinase and Enolase protein in
HPASMCs (A, C) and HASMCs (B, D), lactate concentration after incubation
of HPASMCs (E) and HASMCs (F) under normoxic and hypoxic (3, 1 or 0%
O2) conditions. 153

xvi
LIST OF TABLES
Table 1.1 Hypoxia-inducible genes harboring HRE sequences 19
Table 2.1 Normalized expression of pro- and antiproliferative genes and pro- and
antiapoptotic genes under hypoxia. 80
Table 3.1 Influence of hypoxia on pulmonary artery smooth muscle cell proliferation.
100
Table 3.2 Medial wall thickness of pulmonary artery and pulmonary artery branch from
normoxic and hypoxia exposed rats. 127
Table 5.1 Phenotypic heterogeneity in pulmonary artery smooth muscle cells.
144

Chapter 1
1
CHAPTER 1
Review of literature

Chapter 1
2
1.1 Introduction
The efficient delivery of oxygen to the tissues of the body is required for aerobic ATP
production to support their metabolic activities and as a substrate in the synthesis of a number of
signaling molecules such as carbon monoxide and nitric oxide [1-3]. Inadequate oxygen supply
will impair the capacity to meet these needs and result in the failure of vital functions. Hypoxia
refers to conditions under which oxygen concentration becomes limiting for normal cellular
processes [4]. The oxygen concentration in the atmosphere is 20.9% (partial pressure ~ 160
mmHg at sea level). The cells that comprise the vascular wall, however, experience much lower
oxygen tensions (25 mm Hg at the preterminal arterioles) [5, 6] with even lower levels
(bordering on anoxia) reported in vessels affected by disease [7-9] . At levels of 3-5% oxygen
vascular cells are close to the hypoxic range, although oxygen availability is not yet limiting to
cellular viability or function. Any further decrease in oxygen levels, however, will trigger
hypoxia-induced responses, which includes regulation of both cell proliferation and/or cell
survival to alter the structure of the vessels [10, 11]. These are aimed at both enhancing the
capacity to utilize the available oxygen supply and, in the event that hypoxia is prolonged to
protect cell viability and function. The molecular mechanisms underlying these responses are
complex and remain poorly understood. Their elucidation will aid in the development of
therapeutic approaches to ameliorate the effects of hypoxia in diseases associated with reduced
systemic oxygen delivery.
1.2 Systemic and pulmonary circulations
Structural and functional differences between the systemic and pulmonary circulations
support their respective physiological functions. The pulmonary circulation is a low pressure

Chapter 1
3
system with a mean pressure of 10-22 mm Hg, compared to 70-105mm Hg in the systemic
circulation. The pulmonary vasculature is thin walled compared to the systemic circulation, and
contains much less vascular smooth muscle. In the systemic circulation, 75–80% of vascular
resistance is maintained by small muscular arterioles whilst resistance is relatively evenly
distributed throughout the normal pulmonary circulation.
Pulmonary vascular reactivity to endogenous and exogenous vasoconstrictors and to
hypoxia is influenced by the level of basal tone. Baseline vascular tone is low in the normal lung
but is enhanced during hypoxia due to mechanisms intrinsic to the smooth muscle and because of
the effects of locally released and circulating vasoactive mediators such as Endothelin-1,
vasoconstrictor prostaglandins, histamine and serotonin [12, 13]. In the systemic circulation
basal tone is maintained by tonic activity of the sympathetic nervous system. Sympathetic
innervation of the pulmonary circulation does exist and its activation has similar effects as in the
systemic circulation but contributes little to the maintenance of basal vasomotor tone.
Pulmonary arteries exhibit a vasoconstrictor response to hypoxia in contrast to the
vasodilator response to hypoxia exhibited by the systemic circulation [14, 15]. In the foetus, this
hypoxic pulmonary vasoconstriction (HPV) serves to increase pulmonary vascular resistance and
divert the circulation through the ductus arteriosus. As a result the foetal pulmonary circulation
only receives ~10% of the cardiac output unlike the situation after birth where exposure to
atmospheric oxygen fully dilates the pulmonary circulation which henceforth receives 100% of
the cardiac output. After birth, HPV is required for ventilation-perfusion matching. Despite its
clinical and physiological relevance the mechanism of HPV remains largely unresolved. Recent

Chapter 1
4
hypothesis for HPV proposes hypoxia-induced inactivation of voltage activated potassium (Kv)
channels in the pulmonary circulation [16].
The larger arteries in the vasculature provide little resistance to blood flow and therefore
serve as a rapid conduit for blood to travel. The walls of these vessels contain large amounts of
elastic and fibrous tissue. As the arteries branch into smaller arteries, the amount of elastic tissue
in the walls decreases while the amount of smooth muscle increases. Arteries less than 0.1mm in
diameter lose most of their elastic properties and are sometimes called muscular arteries. The
combination of stiffness and flexibility enables arteries to act as pressure reservoirs to ensure a
continual smooth flow of blood through the vasculature even when the heart is not pumping
blood. The arterioles are the blood vessels that provide the greatest resistance to blood flow. In
the systemic circuit, blood enters arterioles at an average pressure of about 90 mmHg and leaves
them at a pressure of about 40 mmHg. The walls of arterioles contain little elastic material but
have an abundance of circular smooth muscle that forms rings around the arterioles. Resistance
is regulated by the contraction and relaxation of the circular smooth muscle.
The arteries have two functions. One is to deliver an adequate supply of blood to
peripheral tissues and to smooth out pressure oscillations due to intermittent ventricular ejection.
The efficiency of conduit function is related to the width of the arteries and the almost constancy
of mean blood pressure along the arterial tree. Resistance arteries with an internal diameter of
150 m contribute significantly to total peripheral resistance and basal vascular tone. Resistance
arteries are continuously subjected to changes in mechanical forces (flow and pressure) that
regulate active vasomotion, fitting blood flow continuously to local demands. The fundamental
function of resistance-sized arteries is control of blood flow to the capillary beds, partly achieved

Chapter 1
5
by a putative pressure-sensing mechanism. Vascular remodeling is an adaptive process
occurring in response to long-lasting changes in arterial pressure or flow, and whose ultimate
effect tends to maintain the constancy of tensile and/or shear stresses. In response to blood
pressure increase, the luminal diameter in large conduit arteries is usually unchanged while width
of wall increases. In distal resistive arteries and arterioles, luminal diameter is reduced but
medial layer is not hypertrophied.
1.3 Vascular smooth muscle cells
The vascular smooth muscle cell (VSMC) in mature animals is highly specialized whose
principal function is contraction and regulation of vessel tone and diameter, blood pressure,
and
distribution of blood flow. SMCs within adult blood vessels proliferate at a low rate and express
a unique repertoire of contractile proteins, ion channels, and signaling molecules required for the
cell's contractile function [17, 18].
Three independent embryonic origins for VSMCs have been identified: (a) Vessels that
recruit SMCs from progenitors that originate in cardiac neural crest; (b) Coronary SMCs arise
from mesothelial cells that line villus-like projections of the proepicardial organ and (c) Vessels
that recruit SMCs from either lateral or splanchnic mesoderm depending on the position of a
particular vessel within the embryo [19-23]. SMCs are also recruited from endothelial cells and
from circulating multipotential stem cells at later stages of development and in adults [24-27].
The majority of VSMCs exhibit common properties regardless of their origins, however, certain
lineage-specific differences in growth and transcriptional responses to various cytokines and
other factors implicated in the progression of arterial diseases persist beyond the embryonic
period.

Chapter 1
6
Unlike either skeletal or cardiac muscles, that are terminally differentiated, VSMCs
within adult animals retain remarkable plasticity. The
ability of VSMCs to be plastic in their
growth responses is a key mechanism by which the vasculature responds to hemodynamic,
developmental, and injurious stimuli. Biological processes during which VMSC growth is vital
include vessel development, the vascular response to tissue injury, and vessel remodeling in
response to changes in tissue demand [28-32]. Pathological examples include atherosclerosis,
hypertension, restenosis post angioplasty, and vasculitis. In these situations, interactions between
endothelial cells and VSMC, as well as between VSMC and other cells (e.g., fibroblasts,
dendritic cells, and inflammatory cells) within the vessel wall, determine
the nature of the growth
response [33]. The role of SMCs is not a simple function of alterations in its growth state but
rather is a function of very complex changes in the differentiated state of the SMC
including
increased matrix production [34], production of various proteases [35], participation in chronic
inflammatory responses including production of inflammatory cytokines and
expression of
inflammatory cell markers [36, 37], altered contractility and expression of contractile proteins
[38]. On one hand, the plasticity exhibited by VSMCs prevents accumulation of replication
errors or mutations. On the other, the high degree of plasticity
exhibited by the VSMCs
predisposes the cells to abnormal environmental cues/signals that can lead to adverse phenotypic
switching and the acquisition of characteristics that can contribute to development and/or
progression of vascular disease.
1.4 Oxygen Delivery
The primary function of the cardiovascular system is the delivery of oxygen that we
breathe from the air to the cells that comprise the body. The partial pressure of oxygen (pO2) of
Chapter 1
7
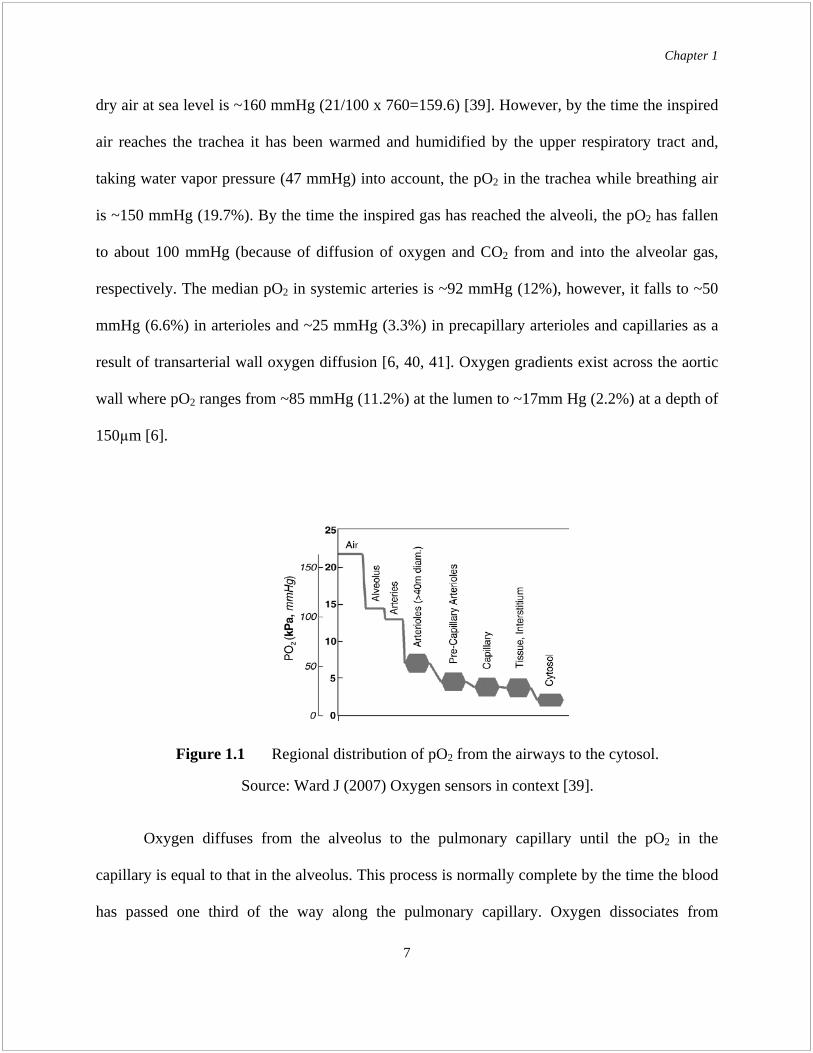
dry air at sea level is ~160 mmHg (21/100 x 760=159.6) [39]. However, by the time the inspired
air reaches the trachea it has been warmed and humidified by the upper respiratory tract and,
taking water vapor pressure (47 mmHg) into account, the pO2 in the trachea while breathing air
is ~150 mmHg (19.7%). By the time the inspired gas has reached the alveoli, the pO2 has fallen
to about 100 mmHg (because of diffusion of oxygen and CO2 from and into the alveolar gas,
respectively. The median pO2 in systemic arteries is ~92 mmHg (12%), however, it falls to ~50
mmHg (6.6%) in arterioles and ~25 mmHg (3.3%) in precapillary arterioles and capillaries as a
result of transarterial wall oxygen diffusion [6, 40, 41]. Oxygen gradients exist across the aortic
wall where pO2 ranges from ~85 mmHg (11.2%) at the lumen to ~17mm Hg (2.2%) at a depth of
150 m [6].
Oxygen diffuses from the alveolus to the pulmonary capillary until the pO2 in the
capillary is equal to that in the alveolus. This process is normally complete by the time the blood
has passed one third of the way along the pulmonary capillary. Oxygen dissociates from
Figure 1.1 Regional distribution of pO2 from the airways to the cytosol.
Source: Ward J (2007) Oxygen sensors in context [39].

Chapter 1
8
haemoglobin in red blood cells to the tissues according to the oxyhaemoglobin dissociation
curve.
Sequential branching of the arteriolar tree forms microvessels of decreasing diameter,
which, in turn, increases the surface area per unit volume available for the diffusion of oxygen to
the tissue [40]. In any oxygen-consuming tissue, the rate of intravascular oxygen loss is inversely
related to arteriolar vessel diameter, thereby creating an intravascular longitudinal oxygen
gradient. The affinity with which oxygen binds to hemoglobin is also influenced by pH, carbon
monoxide (CO), temperature and erythrocyte 2, 3-disphosphoglycerate (DPG) concentration [42,
43]. Lastly, increasing capillary perfusion increases the capacity for oxygen extraction during
exercise [44, 45].
Figure 1.2 Oxyhaemoglobin dissociation curve for normal adult haemoglobin.
Source: http://www.anaesthesiamcq.com/downloads/odc.pdf

Chapter 1
9
1.5 Physiological responses to hypoxia
The tissue oxygen supply is regulated by the number and function of the blood vessels,
whereas the demand is regulated by the number of cells in the tissue and their rate of
metabolism. All nucleated cells in the body respond to reduced O2 availability, through a series
of coordinated responses in a time and oxygen concentration-dependent manner. Stimulus-
response pathways induced by hypoxia can be categorized as either acute or chronic. Acute
responses are of rapid onset and short-term duration, whereas chronic responses are of delayed
onset and long-term duration. This difference in kinetics reflect the underlying molecular
mechanisms: acute responses involve post-translational modifications of existing proteins that
alter their activity whereas chronic responses are comprised of transcriptional and post-
transcriptional events involving changes in gene expression that result in the synthesis of novel
proteins or increased synthesis of proteins already present in the cell.
1.5.1 Systemic responses
During acute hypoxic exposure, oxygen supply to essential organs is maintained by the
following: (i) the hypoxic ventilatory response increases the respiratory rate and tidal volume
[46]. In humans, this is almost solely due to depolarization of glomus cells in the carotid body
which leads to enhanced ventilation and increased alveolar oxygen concentrations [47], (ii) the
pulmonary vasculature O2 sensors initiate hypoxic pulmonary vasoconstriction (HPV) to increase
efficiency of gas exchange. Pulmonary arterial vasoconstriction directs blood to better
oxygenated regions of the lung while changes in bronchial and bronchiolar tone optimize the
distribution of gas flow within the lung. An increase in pulmonary arterial blood pressure forces
blood into greater numbers of alveolar capillaries than normal [22], (iii) activation of the

Chapter 1
10
sympathetic system increases oxygen extraction by increasing the heart rate and diverting
unnecessary blood flow away from organs such as the kidneys and splanchnic viscera toward the
essential organs like the heart and brain [43], (iv) Vessels in essential organs accommodate the
increased blood flow through both a sympathetically-mediated increase in arteriolar tone and the
release of vasodilators in areas of imbalance between metabolic demand and oxygen supply.
The sympathetic excitation results partly through chemoreceptor reflexes and partly through
altered baroreceptor function, (v) The O2 sensors in the vasculature of other tissues activate
expression of VEGF-1 to promote angiogenesis, (vi) O2 sensors in the kidney and liver activate
the expression of erythropoietin to up-regulate red blood cell mass to improve oxygen carrying
capacity.
1.5.2 Regulation of cellular metabolism:
1.5.2.1 Effect of hypoxia on mitochondria
Mitochondria are the seat of oxidative phosphorylation and the main source of high
energy phosphate bond molecules in normal cells. Studies on isolated mitochondria have shown
that limited oxygen availability inhibits the electron transport chain and increases the proton
leak, although phosphorylation is less affected [1]. The inhibition of the respiratory chain occurs
at pO2 levels high above the Km of cytochrome c oxidase, indicating that a
specific inhibitory
mechanism, still unknown, is switched on well before oxygen concentration by itself would limit
the activity of this enzyme [48].
1.5.2.2 Cellular adaptation to hypoxia

Chapter 1
11
At the cellular level, adaptation to hypoxia is brought about on one hand by increased
anaerobic glycolysis activity, and on the other hand by decreasing energy-consuming processes
[49, 50]. Ion-motive ATPases and protein synthesis are the dominant energy-consuming
processes of cells at normal metabolic rates, making up more than 90% of the ATP consumption
in rat skeletal muscle and 66% in rat thymocytes [50]. As energy becomes limiting, protein
synthesis and RNA/DNA synthesis are the first to be inhibited while Na+/K
+ pumping and Ca
2+
cycling are potentiated. This phenomenon, known as oxygen conformance, involves precise
regulatory mechanisms mostly at the level of translation initiation [51].
The switch between aerobic and anaerobic pathways of ATP regeneration during hypoxia
was first noted by Pasteur in the late 19th century, hence its name "Pasteur effect." Although
glycolysis is less efficient than oxidative phosphorylation in the generation of
ATP, in the
presence of sufficient glucose, glycolysis can sustain ATP production due to increases in the
activity of the glycolytic enzymes.
1.6 Regulation of Gene Expression
Faced with a hypoxic challenge, the early physiological responses include increased
ventilation and cardiac output, a switch from aerobic to anaerobic metabolism, improved
vascularization, and enhancement of the O2 carrying capacity of the blood. In the longer term,
these responses are reinforced by up-regulation of genes encoding factors which facilitate these
responses, such as (i) tyrosine hydroxylase, which is involved in dopamine synthesis in carotid
body type I cells; (ii) glycolytic enzymes and glucose transporters Glut-1 and Glut-4; (iii) VEGF,
PDGF which promote angiogenesis, and inducible NO synthase which increases
vasodilation;

Chapter 1
12
and (iv) erythropoietin and transferrin receptors that favor erythrocyte production [52]. This
transcriptional response is mediated in large part by the action of HIF-1 .
1.6.1 Hypoxia-inducible factors
Hypoxia increases nuclear translocation of a family of hypoxia inducible transcription
factors (HIFs) activates expression of genes participating in the compensatory mechanisms that
support cell survival in a potentially lethal microenvironment [53].
HIF transcription factors are composed of one of three alpha subunits (1 , 2 or 3 ), and
beta ( ) subunits. HIF-1 is also denoted as the aryl hydrocarbon receptor nuclear translocator
(ARNT) [54]. In the subunit, the basic helix-loop-helix (bHLH) and the Per Arnt Sim (PAS)
domains in the N-terminus are important for dimerization and DNA binding [55-57]. HIF-1
and HIF-2 proteins also contain two transactivation domains (TADs) in their C-terminal region.
Within the N-terminal TAD there is an oxygen-dependent degradation (ODD) domain that is
responsible for degradation of the subunit under normoxic conditions [58, 59]. The main
function of the C-terminal TAD is to recruit transcriptional coactivators such as CBP, p300,
SRC1 and TIF-2 [56, 60, 61].
Under hypoxic conditions, the HIF heterodimer (named HIF-1, -2 or -3) translocates to
the nucleus where it binds to a core DNA sequence (5-ACGTG-3) - the hypoxia-responsive
element (HRE), located in the promoter/enhancer regions of many hypoxia-regulated genes [53,
62].

Chapter 1
13
Of the three HIF- -subunits, HIF-1 is the best studied and characterized to date.
Nevertheless, the understanding of HIF-2 (also known as endothelial PAS domain protein 1,
EPAS-1) function has increased dramatically, whereas the most recently identified and
consequently less-well studied subunit is HIF-3 [63, 64]. Although the HIF-1 and -2 subunits
can bind to the same DNA motifs, they appear to control rather distinct biological functions.
Mouse knockout studies have shown the vital importance of HIF-1 for development and
survival, and that HIF-2-/-
mice have different phenotypes depending on their genetic

Chapter 1
14
background, thus illustrating the importance of HIF-2 [65, 66]. In addition, a recent study has
demonstrated that HIF-2 cannot functionally substitute for HIF-1 in embryonic stem cells
[67]. Whereas HIF-1 is expressed in virtually all cell types, HIF-2 exhibit a more restricted
expression pattern in endothelial cells and in catecholamine producing cells in the organs of
Zuckerkandl [68]. The biological function of HIF-3 is under investigation, but a HIF-3 splice
variant, denoted inhibitory PAS (IPAS), appears to function as a negative regulator of hypoxia-
inducible responses [69, 70].
HIF- is not controlled by oxygen levels and is found constitutively expressed in all cell
types [71]. By contrast, -subunit levels are under tight control. In response to changing oxygen
levels, the control of HIF- subunit expression is achieved by regulating protein level, although
other stimuli such as oncogene activation and cytokines can induce both transcription and protein
synthesis increases of the subunits [72].
1.6.2 Regulation of HIF activity
Nuclear levels of HIF- proteins, which are extremely low under normoxic conditions,
dramatically increase in response to hypoxia. The presence of HIF- subunits only in conditions
of low oxygen tension or after treatment with iron chelators had puzzled researchers until a
group of novel oxygen-dependent enzymes essential for regulating HIF- protein levels was
discovered. These are the prolyl hydroxylases (PHDs), of which four isoforms (PHD1, PHD2,
PHD3 and PHD4) have been identified at this time [73]. The PHD enzymes are members of the
2-oxoglutarate-dependent hydroxylase superfamily.
Hydroxylation of two proline residues (402 and/or 564) in the HIF- ODD domain by
PHDs serves as a recognition/binding site for the von Hippel-Lindau (pVHL) E3 ubiquitin ligase
Chapter 1
15
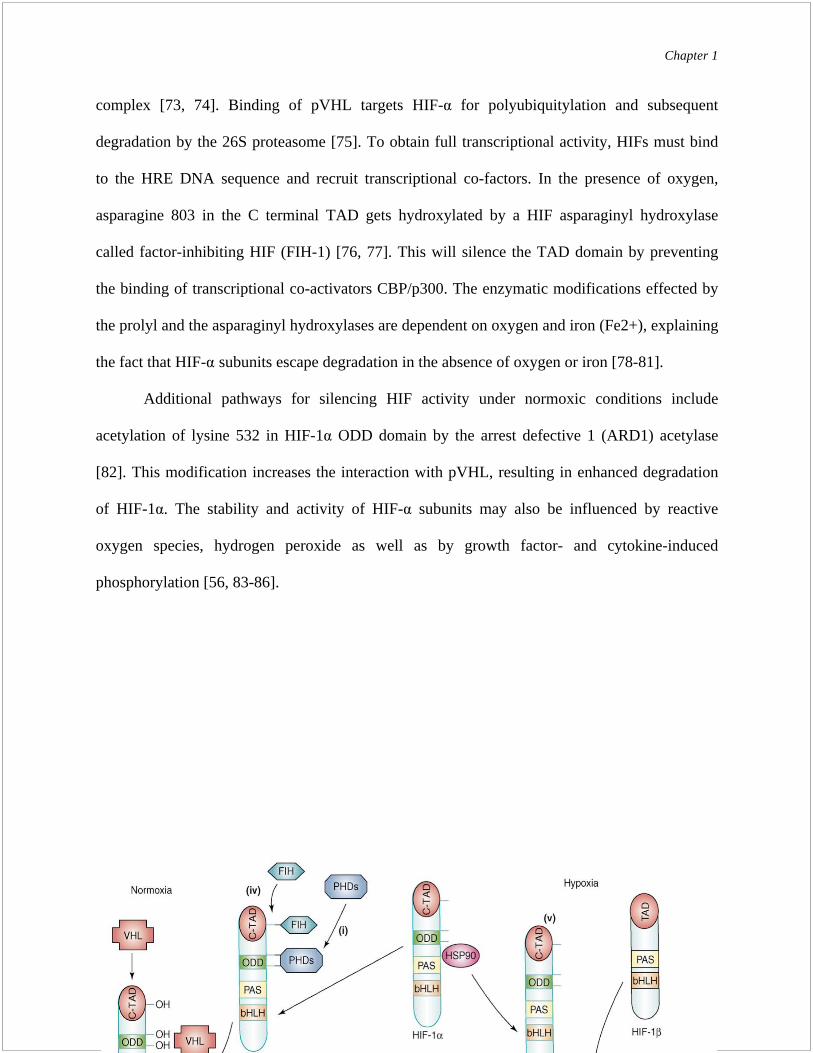
complex [73, 74]. Binding of pVHL targets HIF- for polyubiquitylation and subsequent
degradation by the 26S proteasome [75]. To obtain full transcriptional activity, HIFs must bind
to the HRE DNA sequence and recruit transcriptional co-factors. In the presence of oxygen,
asparagine 803 in the C terminal TAD gets hydroxylated by a HIF asparaginyl hydroxylase
called factor-inhibiting HIF (FIH-1) [76, 77]. This will silence the TAD domain by preventing
the binding of transcriptional co-activators CBP/p300. The enzymatic modifications effected by
the prolyl and the asparaginyl hydroxylases are dependent on oxygen and iron (Fe2+), explaining
the fact that HIF- subunits escape degradation in the absence of oxygen or iron [78-81].
Additional pathways for silencing HIF activity under normoxic conditions include
acetylation of lysine 532 in HIF-1 ODD domain by the arrest defective 1 (ARD1) acetylase
[82]. This modification increases the interaction with pVHL, resulting in enhanced degradation
of HIF-1 . The stability and activity of HIF- subunits may also be influenced by reactive
oxygen species, hydrogen peroxide as well as by growth factor- and cytokine-induced
phosphorylation [56, 83-86].

Chapter 1
16
1.6.3 HIFs as transcriptional regulators

Chapter 1
17
When the protein levels of HIF- increase, e.g. in response to hypoxia, it translocates to
the nucleus, dimerizes with the subunit and activates the transcription of a number of target
genes displaying an HRE motif (Table 1.1). Nuclear localization signal (NLS) domains in the
and subunits confer autonomous translocation into the nucleus [87]. One group of HIF-1 target
genes is involved in the adaptive response facilitating oxygen delivery to oxygen-deprived
tissues. These include the genes encoding erythropoietin, vascular endothelial growth factor-A
(VEGF-A) and the inducible NOS (iNOS) [62]. The erythropoietin (Epo) gene, was discovered
as the first true hypoxia-inducible gene in 1992 [53]. EPO stimulates red blood cell production
(erythropoiesis), thereby increasing oxygen delivery. Hypoxia also promotes iron uptake and
transport by increasing the expression of transferrin and the transferrin receptor [88, 89]. Another
well-known hypoxia-regulated gene is Vegf-a, which plays a crucial role in development and
growth of blood vessels [90, 91]. One of the VEGF receptors, encoded by the Vegfr-1 gene, is
also a direct HIF target, harboring an HRE motif [92]. The Vegfr-2 gene, which at first was
reported to lack HIF binding sites, has now been shown to be upregulated by HIF-2 [93].
Hypoxia also affects vascular tone and local blood flow by induction of vasoconstrictors, such as
endothelin-1 (ET-1) [94], or by increased expression of genes regulating vasodilation, such as
heme oxygenase-1 (HO-1) and iNOS [95, 96].
Another group of genes upregulated by HIF-1 acts to compensate for the loss of oxygen-
dependent metabolism in hypoxia. The increased expression of various glucose transporters and
glycolytic enzymes under hypoxic conditions, allows for oxygen-independent generation of ATP
(glycolysis). When oxygen levels fall to a critical point, metabolic switches turn off oxidative
phosphorylation and mitochondrial electron transport and instead oxygen-independent or
anaerobic energy production (glycolysis) is induced. In the glycolytic pathway, four ATP

Chapter 1
18
molecules are produced when glucose is metabolized to two molecules of pyruvate. As two ATP
molecules are consumed during this process, this leaves a net yield of two ATP. Compared to
aerobic conditions where pyruvate is further oxidized in the Kreb’s cycle and the net yield is 31
molecules of ATP, anaerobic glycolysis is much less efficient.
In addition to the “classic” hypoxia-inducible genes, that are direct transcriptional targets
of HIF, the response to low oxygen triggers expression of select micro RNAs (miRNAs), which
in turn down regulate specific genes. MicroRNAs are short non-coding transcripts. A wide set of
hypoxia-regulated miRs (HRMs) have been identified. Among them HIF plays an important
regulatory role for miR-210, 26 and 181. Studies have revealed a highly complex spectrum of
candidate targets of HRMs. These include key genes of the apoptotic pathway such as BID (miR-
23), BIM (miR-24); CASP3 (miR-30), CASP 7 (miR-23), APAF1 (miR-27), BAK1 (miR-26),
Bnip3L (miR-23). Conversely, antiapoptotic Bcl2 is a target of miR15 and 16. Another process
known to be affected by hypoxia is proliferation, since many cell types undergo cell cycle
slowdown or arrest during oxygen deprivation. A multitude of cell cycle genes are HRM targets,
a few examples being cdc25A (miR-21, miR-103/107), cyclin D2 (miR-26, miR-103/107),
cyclin E1 (miR-26), cyclin H (miR-23), cdk6 (miR-26, miR-103/107) [97-99]. HRMs miR-16,
miR-20, let-7b, miR-17-5p, miR-27, miR-106, miR-107, miR-193, miR-210, miR-320 and miR-
361 have been shown to target VEGF [100].
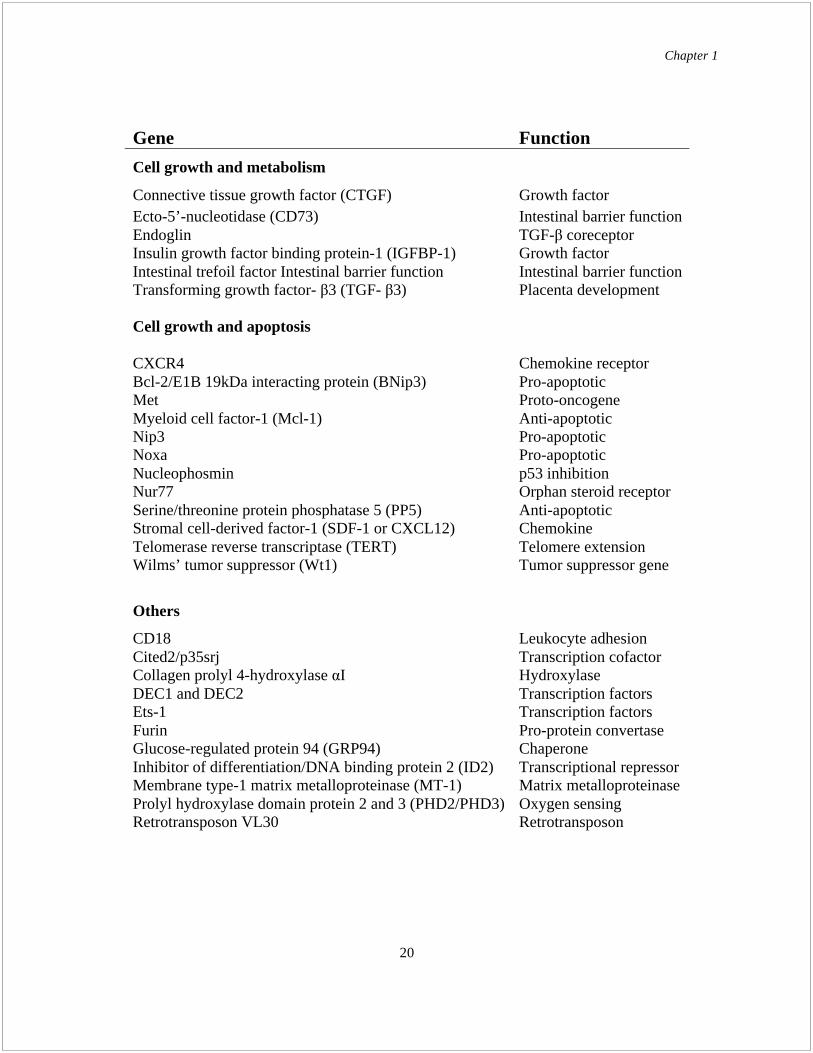
Table 1.1 Hypoxia-inducible genes harboring HRE sequences [62].

Chapter 1
19
Gene Function
Oxygen supply
1B-adrenergic receptor Vessel diameter
Adrenomedullin Vessel diameter
Atrial natriuretic peptide (ANP) Blood volume
Breast cancer resistance protein (BCRP) Heme binding
Endothelial nitric oxide synthase (eNOS) Vessel diameter
Endothelin-1 Vessel diameter
Erythropoietin Erythropoiesis
Ferrochelatase Heme synthesis
Heme oxygenase 1 Vessel diameter
Inducible nitric oxide synthase (iNOS) Vessel diameter
Leptin Metabolism/ Angiogenesis
Transferrin Iron transport
Transferrin receptor Iron transport
Plasminogen activator inhibitor-1 (PAI-1) Blood flow
Vascular endothelial growth factor-A (VEGF-A) Angiogenesis
VEGF-D Angiogenesis
VEGF receptor-1 (VEGFR-1) Angiogenesis
VEGFR-2 Angiogenesis
Cellular metabolism
Aldolase A Glycolysis
Carbonic anhydrase-9 (CA-9) pH regulation
Cytochrome P450 2C11 (CYP2C11) Metabolism
CYP3A6 Metabolism
CYP4B Eicosanoid synthesis
Enolase 1 Glycolysis
Glucose transporter 1 (Glut1) Glucose uptake
Glucokinase Glycolysis
Glutathione peroxidase-3 (GPx-3) Glutathione peroxidase
Glyceraldehyde-3-phosphate dehydrogenase (GAPDH) Glycolysis
Lactate dehydrogenase A Glycolysis
Multidrug resistance gene 1 (MDR1) Xenobiotic transporter
Phosphoenolpyruvate carboxykinase (PEPCK) Gluconeogenesis
Phosphofructokinase L (PFKL) Glycolysis
6-Phosphofructo-2-kinase/fructose-2,6-biphosphatase-3 Glycolysis
6-Phosphofructo-2-kinase/fructose-2,6-biphosphatase-4 Glycolysis
Phosphoglycerate kinase 1 (PGK1) Glycolysis
Table 1.1 Hypoxia-inducible genes harboring HRE sequences (contd)
Chapter 1
20
Gene Function
Cell growth and metabolism
Connective tissue growth factor (CTGF) Growth factor
Ecto-5’-nucleotidase (CD73) Intestinal barrier function
Endoglin TGF- coreceptor
Insulin growth factor binding protein-1 (IGFBP-1) Growth factor
Intestinal trefoil factor Intestinal barrier function Intestinal barrier function
Transforming growth factor- 3 (TGF- 3) Placenta development
Cell growth and apoptosis
CXCR4 Chemokine receptor
Bcl-2/E1B 19kDa interacting protein (BNip3) Pro-apoptotic
Met Proto-oncogene
Myeloid cell factor-1 (Mcl-1) Anti-apoptotic
Nip3 Pro-apoptotic
Noxa Pro-apoptotic
Nucleophosmin p53 inhibition
Nur77 Orphan steroid receptor
Serine/threonine protein phosphatase 5 (PP5) Anti-apoptotic
Stromal cell-derived factor-1 (SDF-1 or CXCL12) Chemokine
Telomerase reverse transcriptase (TERT) Telomere extension
Wilms’ tumor suppressor (Wt1) Tumor suppressor gene
Others
CD18 Leukocyte adhesion
Cited2/p35srj Transcription cofactor
Collagen prolyl 4-hydroxylase I Hydroxylase
DEC1 and DEC2 Transcription factors
Ets-1 Transcription factors
Furin Pro-protein convertase
Glucose-regulated protein 94 (GRP94) Chaperone
Inhibitor of differentiation/DNA binding protein 2 (ID2) Transcriptional repressor
Membrane type-1 matrix metalloproteinase (MT-1) Matrix metalloproteinase
Prolyl hydroxylase domain protein 2 and 3 (PHD2/PHD3) Oxygen sensing
Retrotransposon VL30 Retrotransposon

Chapter 1
21
Besides prolyl hydoxylases, stabilization and/or synthesis of HIF-1 under hypoxia is also
dependent on the activity of the PI-3 kinase/Akt pathway [84]. PI-3K inhibitors inhibits the
accumulation of HIF-1 in these conditions, while dominant negative
mutants for PI-3K or for
Akt decrease the hypoxia-induced overexpression of VEGF. Conversely, disruption of PTEN, a
phosphatidylinositol triphosphate phosphatase that inactivates Akt, leads to increased
VEGF
expression in normoxic cells [101]. Finally, growth factor- or cytokine-induced activation of
HIF-1 in normoxia results from an increased synthesis of HIF-1 which is also dependent on the
PI3K/Akt pathway. It remains unclear, however, how the PI-3K/Akt pathway interacts with the
prolyl hydroxylase-pVHL system to regulate HIF-1 protein level.
Post stabilization, redox status, dissociation from the chaperone hsp90, association with
co-activators like CBP/p300 or SRC-1 as well as phosphorylation are also required for full
transcriptional activity (36, 37). Hypoxia directly regulates the association of HIF-1 with the
coactivator CBP/p300. Similar to prolyl hydroxylase, an asparagyl hydroxylase, whose activity
strictly depends on
the presence of oxygen, hydroxylates HIF-1 carboxyl-terminal
transactivation domain on Asn 803. This modification prevents its association with CBP/p300
under normoxic conditions [76, 77].
1.6.4 HIF independent transcriptional activation
Although HIF-1 is a pivotal regulator of transcription in hypoxia, other transcription
factors induced in response to hypoxia include the early growth response protein (Egr-1),
Nuclear factor- B (NF- B) and activator-protein 1 (AP-1). The early growth response protein
(Egr-1) is a zinc finger nuclear phosphoprotein that is induced and activated within minutes of
oxygen deprivation [50]. Induction of Egr-1 DNA binding activity leads to activation of tissue

Chapter 1
22
factor gene transcription. In Egr-1 null mice, expression of tissue factor and intravascular fibrin
deposition were severely decreased after hypoxia. This general effect of Egr-1 activation extends
to the tissue factor (TF), VEGF, plasminogen-activator inhibitor (PAI), intracellular adhesion
molecule (ICAM), as well as several interleukins. The Egr-1 and HIF-1 pathways appear to be
initiated independently of each other, indicative of the separate role they each play in inducing
different facets of the adaptive response to hypoxia [102].
The p50-p60 heterodimer of Nuclear factor- B (NF- B) is induced both under hypoxia
and following re-oxygenation. To date the role of NF- B in mediating induction of hypoxia-
responsive genes is poorly understood. Studies by Koong et al and Imbert et al have suggested
hypoxia-induced activation of NF- B to occur via a mechanism involving tyrosine
phosphorylation of the upstream inhibitory subunit I B . One of the genes thought to be
regulated by NF- B in hypoxia is cyclooxygenase-2 (COX-2), which is induced in human
vascular endothelial cells by the binding of p65 to the NF- B consensus element in the COX-2
promoter [103-106].
The activator-protein 1 (AP-1) is a dimeric transcription factor comprising subunits from
the jun and fos multigene families. The DNA binding and transcriptional activity of AP-1 has
been demonstrated to be strongly induced by hypoxia [107]. A single cysteine residue in the
DNA-binding domain of fos and jun is responsible for this redox sensing and signaling.
Activation of VEGF [108], tyrosine hydroxylase [109], collagenase IV [110], endothelin-1 [111]
and c-jun [112] has been shown to correlate with the activation of AP-1. The hypoxic regulation
of AP-1 may be functionally distinct from other AP-1-inducing stresses, as it was shown that
ectopically expressed c-jun functionally cooperates with HIF-1 to regulate HRE-dependent

Chapter 1
23
reporter expression without binding to AP-1. Furthermore, induction of c-jun mRNA expression
and phosphorylation by prolonged hypoxia was dependent on HIF-1 [113].
1.7 Hypoxic regulation of mRNA stability
Both transcriptional activation and post-transcriptional mechanisms contribute to the
hypoxia-mediated regulation of gene expression. Hypoxic regulation of cis-acting regulatory
elements found at the 3-UTR of the hypoxia-responsive mRNAs are responsible for hypoxia-
specific message stabilization [114] and the most commonly described cis-acting sequences
include the AU-rich element (ARE), stem-loop element and pyrimidine-rich element. Hypoxia
has been known to specifically increase stability of the mRNAs of vascular endothelial growth
factor (VEGF), tyrosine hydroxylase (TH), glucose transporter (GLUT-1) and erythropoietin
(EPO) [115]. Hypoxic induction of VEGF occurs in a biphasic manner: initial activation via
transcriptional induction is followed by augmented mRNA stability mediated by binding of
specific proteins such as the heterogeneous nucleoprotein L (hNRP L) and the RNA binding
protein, HuR [116-118]. Likewise, as shown in pheochromocytoma-derived PC12 cells, the
hypoxia-dependent stabilization of the TH gene mRNA is due to a hypoxia-inducible protein
binding site (HIPBS) in the 3-UTR of the TH mRNA [119].
1.8 Hypoxic repression of transcription
In contrast to inducing the expression of specific genes, hypoxia can also result in
specific gene repression. Several proteins have been reported to contribute to transcriptional
repression in hypoxic cells. These include negative cofactor 2 (NC2), differentiated embryo
chondrocyte 1 (Dec 1), histone deacetylases (HDAC), mSin3a, and p53.
Chapter 1
24
NC2, a transcriptional repressor, activated in extracts from hypoxia-treated hepatoma
cells inhibits the formation of the pre-initiation complex through direct interaction with the
TATA binding protein (TBP). This interaction prevents access to the promoter by TFIIB, thus
preventing the formation of the RNA polymerase holoenzyme, and thereby blocks transcription
[120, 121]. Because of the large number of TATA-containing genes in the human genome, the
activation of NC2 may contribute to a global repression of transcription during hypoxia.
A more specific hypoxia-dependent transcriptional repressor is Dec1 (Stra13, Sharp2).
Dec1 is a member of the basic helix loop helix family of transcription factors and has been
demonstrated to repress expression through binding to E-box elements [122]. Hypoxia can
prevent differentiation or cause dedifferentiation in a number of cell types including adipocytes,
breast carcinomas and neuroblastomas [123, 124]. Hypoxic induction of Dec1 has been shown to
be able to block the expression of PPAR 2 in pre-adipocytes, blocking their differentiation
[125].
In addition to DNA binding by direct acting repressors, gene expression can be down
regulated by corepressors such as histone deacetylases (HDACs) that act to modify the local
chromatin. HDACs function as co-repressors through their association with transcription factors,
such as p53, which can recruit and target them to specific genes. Hypoxia has been shown to
elevate HDAC activity [126] in addition to increased interactions with factors like p53. p53
protein has been shown to be stabilized under severe hypoxia, but the protein does not activate
transcription of its typical target genes [127]. However, in addition to its transactivation property,
p53 can also repress target genes, and this activity is retained under hypoxia [128]. To repress
gene transcription, p53 selectively interacts with its known transcriptional co-repressors mSin3a
and HDAC1 in hypoxic cells [129]. In addition, studies show that hypoxic induction of this
Chapter 1
25
complex containing p53, HDAC1 and mSin3a represses genes such as stathmin and Map4,
proteins which play a role in microtubule organization and ultimately in G2/M phase growth
arrest [128-130].
1.9 Hypoxic control of protein translation
Regulation of gene expression by hypoxia may occur at a post-transcriptional level.
Phosphorylation of eIF2 by the endoplasmic reticulum associated kinase PERK, during severe
hypoxia, results in a global reduction in protein synthesis. The activation of the PERK kinase is a
recognized response to ER stress, and the blocking of new protein synthesis is a means of
reducing that stress. Koumenis et al also shows that cells deficient in this response have also
been shown to be more sensitive to hypoxia-induced toxicity [131, 132].
Mammalian cells respond to wide ranges of oxygen concentration through alterations in
both metabolic states and growth rates. Hypoxia alters cellular proliferation by regulating the cell
cycle as well as by programmed cell death or apoptosis. The following two sections (1.10 and
1.11) give an overview of the cell cycle and apoptosis and outlines the effects of hypoxia on each
of these processes.
1.10 Cell cycle and hypoxia
1.10.1 Overview of mammalian cell cycle
The mammalian cell cycle consists of four distinct phases: G1, S (synthesis), G2
(collectively known as interphase) and M (mitosis). In the interphase, the cell grows,
accumulating nutrients needed for mitosis and duplicating its DNA and in the M phase, the cell

Chapter 1
26
splits itself into two daughter cells. M phase is itself composed of two tightly coupled processes:
mitosis, in which the cell's chromosomes are divided between the two daughter cells, and
cytokinesis, in which the cell's cytoplasm divides forming distinct cells. Activation of each phase
is dependent on the proper progression and completion of the previous one. Cells that have
temporarily or reversibly stopped dividing are said to have entered a state of quiescence called
G0 phase.
The first phase within interphase, from the end of the previous M phase until the
beginning of DNA synthesis is called G1 (G indicating gap). This phase is marked by synthesis
of various enzymes that are required in S phase, mainly those needed for DNA replication. In the
S phase the chromosomes are replicated with each chromosome having two (sister) chromatids.
Rates of RNA transcription and protein synthesis are low during this phase, except for histone
production, most of which occurs during the S phase [133]. The cells then enter the G2 phase,
which lasts until the cell enters mitosis. Significant protein synthesis occurs during this phase,
mainly involving the production of microtubules, required during mitosis. Inhibition of protein
synthesis during G2 phase prevents the cell from undergoing mitosis. The M phase has been
broken down into several distinct phases, sequentially known as prophase, prometaphase,
metaphase, anaphase and telophase leading to cytokinesis.
Control mechanisms ensuring the fidelity of cell division are called the checkpoints.
These verify whether the processes at each phase of the cell cycle have been accurately
completed before progression into the next phase. DNA damage checkpoints sense DNA damage
both before the cell enters S phase (a G1 checkpoint) as well as after S phase (a G2 checkpoint).
Damage to DNA before the cell enters S phase inhibits the action of CDK2 thus stopping the
progression of the cell cycle until the damage can be repaired. In case of irreparable damage, the

Chapter 1
27
cell self-destructs by apoptosis. Damage to DNA after S phase (the G2 checkpoint), inhibits the
action of Cdk1 thus preventing the cell from proceeding from G2 to mitosis.
The first checkpoint is located before entry into S phase, making the key decision of
whether the cell should divide, delay division, or enter a resting stage. The G1 checkpoint
(restriction point) is where eukaryotes typically arrest the cell cycle if environmental conditions
make cell division impossible [134]. The restriction point is mainly controlled by action of the
CKI- p16 (CDK inhibitor p16). This protein inhibits CDK4/6 and ensures that it can no longer
interact with cyclin D1 to cause cell cycle progression. The second checkpoint is located at the
end of G2 phase, triggering the start of the M phase (mitosis). The CDKs associated with this
checkpoint are phosphorylated by the "Maturation promoting factor" (or Mitosis Promoting
Factor, MPF). The MPF activates the CDK in response to environmental conditions being right
for the cell and allows the cell to begin DNA replication. An activating phosphatase, Cdc25,
under favourable conditions removes the inhibitory phosphates present within the MPF complex.
However, DNA is frequently damaged prior to mitosis, and to prevent transmission of this
damage to daughter cells, the cell cycle is arrested via inactivation of the Cdc25 phosphatase (via
phosphorylation with other protein kinases). There are also spindle checkpoints that detect any
failure of spindle fibers to attach to kinetochores and arrest the cell in metaphase until all the
kinetochores are attached correctly (M checkpoint).
In differentiated mammalian cells, G1 to S progression is regulated by the
hypophosphorylated Rb gene or its related proteins, p107 and p130, which inhibit the expression
of genes required for entry into S phase by sequestering the E2F family of transcription factors.
During G1 phase the Rb/HDAC repressor complex binds to the E2F-DP1 transcription factors
inhibiting downstream transcription. Eukaryotic cell cycle progression is dependent, in part, on

Chapter 1
28
the tightly regulated activity of CDKs. CDK4/CDK6 and Cdk2 whose regulatory partners are the
D-type cyclins (D1, D2 and D3) and cyclin E, respectively, represent two different classes of G1-
specific CDKs whose activation is required for entry into S phase. Cyclin D/CDK4–CDK6
activity occurs in mid-late G1 phase, upstream of CDK2/cyclin E activity. The mitogenic activity
of CDKs are inhibited by cell cycle inhibitory proteins, including p15 (INK4B), p16 (INK4A),
p18 (INK4C), p19 (INK4D), p21 (CIP), p27 (Kip1) and p57 (Kip2).
Studies have suggested that cyclin D/CDK complexes also play a second non-catalytic
role in G1 progression by sequestering proteins of the Cip/Kip family, including p27 (Kip1) and
p21(Cip1), two potent inhibitors of CDK2 [135]. Binding of Cip/Kip proteins to cyclin
D1/CDK4 stabilizes the complex and facilitates its nuclear import [136]. Mitogen withdrawal
results in the disassembly of the cyclin D/CDKs and in addition mobilizes the latent pool of
p27Kip1, which blocks the activity of cyclin E/CDK2 and facilitates cell cycle exit. Murine
embryonic fibroblasts (MEFs) lacking p27 and p21 do not express D-type cyclins and have a
significant reduction in CDK activity, but continue to proliferate normally, suggesting that D-
type cyclins might not be essential for cell cycle progression, at least in a setting where Cip/Kip
proteins are absent [136]. Further studies have shown that activation of the cyclin D1/CDK4
complex occurs when quiescent p21/p27-null MEFs are stimulated to re-enter the cell cycle. In
addition, the ectopic expression of p34 SEI-1, a mitogen-induced CDK4 activator, increased the
levels of active cyclin D1/CDK4 complex in the absence of p21 and p27, suggesting that there
are several independent pathways to stimulate the assembly of the cyclin D1/CDK4 complex
[137]. More recent studies have highlighted the role of an additional cell cycle regulatory
mechanism at the G1 to S transition that is able to govern the initiation of histone gene
expression needed for packaging of newly replicated DNA [138]. This is commonly referred as

Chapter 1
29
the S point and is initiated by cyclin E/Cdk2-dependent phosphorylation of p220 NPAT and the
formation of a functional HiNF-p220 NPAT complex that controls H4 gene transcription.
The expression of cell cycle inhibitory protein, p21, is tightly controlled by the tumor
suppressor protein p53, through which this protein mediates the p53-dependent cell cycle G1
phase arrest in response to a variety of stress stimuli. p21 can interact with proliferating cell
nuclear antigen, a DNA polymerase accessory factor, and plays a regulatory role in S phase
DNA replication and DNA damage repair [139]. p21 has been reported to be specifically cleaved
by Casp-3 like caspases, leading to apoptosis [140].
p53 is a transcription factor which in humans is encoded by the TP53 gene. The three
main functions of p53 include (a) activation of DNA repair proteins when DNA has sustained
damage; (b) induction of growth arrest at G1/S by activation of p21 expression, to allow DNA
repair proteins time to fix the damage; and (c) intiation of apoptosis if the DNA damage proves
to be irreparable. p53 becomes activated in response to a variety of stress signals including
hypoxia. The half-life of p53 is increased causing p53 accumulation in stressed cells. Also a
conformational change causes p53 to function as a transcriptional regulator in these cells.
Phosphorylation of the p53 N-terminal domain makes it a traget of two groups of protein kinases,
namely the MAPK family (JNK1-3, ERK1-2, p38 MAPK), and the ATR, ATM, CHK1 and 2
kinases which are implicated in the genome integrity checkpoint. Oncogenes also stimulate p53
activation, mediated by p14ARF. In unstressed cells, p53 levels are kept low through its
continuous degradation. Mdm2 binds to p53, preventing its action and transports it from the
nucleus to the cytosol. Also Mdm2 acts as ubiquitin ligase and covalently attaches ubiquitin to
p53 leading to its proteasomal degradation. This is reversible and a ubiquitin specific protease,
USP7, can cleave ubiquitin off p53, preventing its proteasome-dependent degradation.

Chapter 1
30
Phosphorylation of the N-terminal end of p53 disrupts Mdm2-binding. Other proteins, such as
Pin1, are then recruited to p53 and induce a conformational change in p53 which prevents
Mdm2-binding even more. Phosphorylation also allows for binding of transcriptional
coactivators, like p300, which then acetylate the carboxy terminal end of p53, exposing the DNA
binding domain of p53, allowing it to activate or repress specific genes. Deacetylase enzymes,
such as Sirt1 and Sirt7, can deacetylate p53, leading to inhibition of apoptosis [141].
1.10.2 Effects of hypoxia on cell cycle
When cells are exposed to severe hypoxia cell cycle progression and DNA synthesis
rapidly cease. The induction of HIF-1 activation prevents G1/S transition through the action of
CKIs and the regulation of cyclin E expression [142, 143]. Expression of p21 and p27 is
increased transcriptionally in a HIF-1-dependent manner [142, 144]. Sustained expression of
Figure 1.5 Cell cycle phases and G1/S transition.
Source: Herrup K (2007) Cell cycle regulation.

Chapter 1
31
these CKIs is observed in wild-type cells, but not in HIF-1 null cells. These CKIs suppress
cyclin/CDK2 activity, and thus reduce the ratio of phosphorylated to dephosphorylated Rb
protein, resulting in cell cycle arrest at the G1/S interface [145, 146]. HIF-1 may also regulate
cyclin E protein levels; CCNE binds to CDK2 and modulates its kinase activity dependent upon
cell cycle phase [146]. It has been reported that hypoxic cells lacking HIF-1 displayed enhanced
and sustained accumulation of cyclin E, without any effect on CDK2 protein expression, relative
to wild-type cells. In accordance with changes in cyclin E expression, cyclin E/CDK2 kinase
activity in HIF-1 -deficient cells was also increased, resulting in somewhat retarded, but still
substantial, cell growth, even under hypoxia.
Hypoxia causes an increase in the CDKN1A mRNA in a p53-independent manner [127].
The number of cells in G1 phase in p53 null cultures is increased relative to wild-type cultures.
This change may be attributable to enhanced HIF-1 activity by inactivation of p53, rather than
the direct action of p53, because expression and transcriptional activity of p53 change little under
hypoxia. HIF-1 null, p53 wild-type cells do not show any hypoxia-induced G1 arrest. Rather,
S-phase entry is accelerated, indicating that HIF-1, but not p53, plays an essential role in the
regulation of cell cycle progression under hypoxia [147, 148]. Cells lacking functional copies of
both p53 and HIF-1 have been shown to display no change in the proportion of cells entering S-
phase, as was seen in HIF-1 null cells. These cells appear to lose the ability to sense and
respond to hypoxia. Collectively, these data strongly suggest that both transcription factors, HIF-
1 and p53, cooperate to regulate the cell cycle progression through distinct mechanisms, but HIF-
1 serves as the primary determinant for cell cycle regulation under hypoxia. Previous studies
have indicated that hypoxia-induced cell cycle arrest is accompanied by a decreased activity of
CDKs and Rb protein, leading to inhibition of cell cycle progression. Also cyclin G2, a negative

Chapter 1
32
regulator of cell cycle progression via binding with protein phosphatase 2A in certain cell types,
is induced by hypoxia through HIF-1 activation [149, 150]. Hypoxia-induced S phase-dependent
arrest is mediated by a rapid shutdown of DNA synthesis through a block to replicon initiation
[151]. This block persists as long as the cells are held hypoxic, and is signaled through the ATR
kinase [152, 153].
1.11 Apoptosis and hypoxia
1.11.1 Apoptotic pathways
Cells can activate an intracellular death program and “commit suicide” in a controlled
way, a process known as apoptosis. Programmed cell death (apoptosis) was first described in
1972 by Currie and colleagues [154]. Apoptotic cell death is important for the maintenance of
tissue homeostasis under physiological conditions as well as for pathogenesis during disease
states including myocardial infarct, neurodegenerative disorders, autoimmune diseases, and
cancer [155, 156]. Alternately, cells can die by an uncontrolled process known as necrosis.
Apoptosis can be induced by a variety of factors, including ligand activation of death receptors,
growth factor deprivation and hypoxia. Characteristics of apoptosis include chromatin
condensation, membrane blebbing, phosphatidylserine exposure, cytoplasmic shrinkage,
formation of apoptotic bodies, and DNA fragmentation. The apoptosis pathway is dependent
upon caspase activation. Caspases comprise an expanding family of cysteine proteases that exist
as inactive pro-enzymes in viable cells [157]. Activated caspases acquire the ability to cleave key
intracellular substrates as well as activate other caspases, resulting in the induction of a protease
cascade that can kill the cell. Caspase activation is an ATP dependent process and is sufficient to
induce all of the morphological features of apoptosis. In contrast, necrosis does not involve the

Chapter 1
33
activation of caspases and is not an energy dependent process [158]. Characteristics of necrosis
include organelle swelling and cell bursting, leading to an inflammatory response. This
inflammatory response does not occur under apoptotic conditions since apoptotic cells display
phagocytosis markers and are engulfed by neighboring cells [159].
There are two possible mechanisms of apoptosis - intrinsic and extrinsic [160]. The
critical regulators of the intrinsic pathway are the Bcl-2 family members [161]. The family can
be divided into three different groups based on Bcl-2 homology (BH) domains and function. The
anti-apoptotic members, such as Bcl-2 and Bcl-XL, typically have BH1 through BH4 domains.
The pro-apoptotic members can be divided into two groups. The first group consists of proteins
such as Bax and Bak that contain BH1, BH2 and BH3 domains. The second group consists of
proteins such as Bad and Bim that contain only BH3 domains. The BH domains have functional
and structural significance. Many members of this family, such as Bcl-2 and Bcl-XL, are
predominantly localized to the outer membrane of mitochondria, while others interact with
mitochondria indirectly. In response to a variety of apoptotic stimuli, pro-apoptotic Bcl-2 family
members (such as Bax or Bak) initiate the mitochondrial dependent apoptotic pathway by
causing a loss of outer mitochondrial membrane integrity [162]. This releases apoptogenic
proteins located in the intermembrane space of mitochondria, such as cytochrome c,
Smac/Diablo, and apoptosis inducing factor (AIF) into the cytosol [163, 164]. Cytochrome c, an
electron carrier within the respiratory chain, interacts directly with Apaf-1 in the cytoplasm
leading to the ATP dependent formation of a macromolecular complex known as the apoptosome
[163, 164]. This complex recruits and activates the aspartyl directed protease caspase-9.
Activated caspase-9 can activate additional caspase-9 molecules, as well as the downstream
caspases such as caspase-3 or -7, resulting in morphological features of apoptosis.

Chapter 1
34
Smac/DIABLO, another mitochondrial protein released into the cytosol in response to apoptotic
stimuli, promotes caspase activation by eliminating inhibitory of apoptosis protein (IAP)
function [165]. AIF induces a caspase independent cell death and is critical for developmental
apoptosis [166]. Anti-apoptotic members Bcl-2 and Bcl-XL inhibit mitochondrial dependent
apoptosis by preventing Bax or Bak from disrupting the integrity of the outer mitochondrial
membrane. Previous studies have shown that DNA damaging agents, serum deprivation, and
endoplasmic reticulum stress agents trigger apoptosis through the mitochondrial dependent
pathway. Fibroblasts from embryos of mice lacking either Bax and Bak genes or cells that over
express BcL-XL or Bcl-2 are resistant to these apoptotic agents [167]. The mechanisms by which
these apoptotic stimuli converge on Bax or Bak to activate mitochondrial dependent apoptosis
remain unknown.
The extrinsic pathway is initiated when a death ligand, such as FasL or TNF , interacts
with its cell surface receptor, Fas (CD95) or TNF receptor (TNFR1/2) [168]. This results in the
formation of a death-inducing signaling complex (DISC). The formation of DISC involves
adaptor proteins such as FADD (Fas-associating protein with death domain) or TRADD (TNF
receptor associating death domain) [169, 170]. These proteins are involved in the recruitment of
pro-caspase-8 and its subsequent proteolytic activation. A variety of cell types undergoing
apoptosis through this pathway show strong activation of caspase-8 and direct activation of
caspase-3 [171]. In contrast, other cell types initially display a weak activation of caspase-8,
which subsequently employs the mitochondria for amplification of the death signal. This process
occurs by the caspase-8 dependent cleavage of Bid, a pro-apoptotic factor [172, 173]. A
truncated Bid requires either Bax or Bak to induce the loss of outer mitochondrial membrane

Chapter 1
35
integrity leading to cytochrome c release and caspase-9 activation [174]. Thus, there is cross talk
between the extrinsic and intrinsic pathways through truncated Bid.
Several studies indicate that oxygen deprivation can induce apoptosis in a variety of cell
types. As long as cells have an adequate supply of ATP during oxygen deprivation, apoptosis can
be executed [175]. However, if cells are deprived of oxygen and glucose then cells undergo
necrosis. The requirement for ATP to execute apoptosis during oxygen deprivation is attributed
to energy dependent activation of caspases. Cells over-expressing the anti-apoptotic proteins Bcl-
2 or BcL-XL have been shown to prevent oxygen deprivation induced apoptosis by inhibiting the
release of cytochrome c from the mitochondria [176-178]. Fibroblasts from mice lacking both
Bax and Bak genes are resistant to oxygen deprivation induced apoptosis [175]. Furthermore, the
pro-apoptotic protein Bax translocates from the cytosol to the mitochondria during oxygen
deprivation [179]. Cytochrome c is released and caspase-9 is activated in oxygen-deprived cells
undergoing apoptosis. Cytochrome c is released independent of caspase activation since
cytochrome c is still released in the presence of the caspase inhibitor zVAD. Fibroblasts from
caspase-9 or Apaf-1 deficient mice transformed with c-Myc and H-ras are resistant to cell death
during oxygen deprivation [180]. Consistent with this, Bid null fibroblasts are able to undergo
apoptosis in response to oxygen deprivation indicating that the extrinsic pathway does not
contribute to oxygen deprivation induced apoptosis [181]. In Jurkat cell lines, hypoxia-induced
apoptosis was not affected by lack of caspase-8 or FADD, whereas overexpression of Bcl-2 or
expression of dominant-negative caspase-9 mutant rendered the cells resistant to hypoxia-
induced apoptosis [182]. Together, these results suggest that hypoxia-induced apoptosis mainly
relies on intrinsic, mitochondrial pathways.

Chapter 1
36
The mitochondria are the central organelle
in the intrinsic pathway. In some
circumstances, however, the endoplasmic reticulum (ER) or sarcoplasmic reticulum in muscle
cells plays an important role in the hypoxia-induced mitochondrial death pathway, as well as
mediating cell death independently of mitochondria. Although the mechanisms by which the ER
brings about cell death are poorly understood, increases in intracellular Ca
2+ appear
to be central.
ER Ca2+
stores are thought to be increased by Bax and Bak, which are located at ER, as well as
mitochondrial membranes [183, 184]. Increased ER Ca
2+ facilitates a more robust release of Ca
2+
into the cytoplasm on delivery of an apoptotic stimulus, and may activate several apoptotic
mechanisms. First, mitochondrial Ca
2+ overload can trigger mitochondrial permeability transition
pore (MPTP) opening and cytochrome c release [185]. Cytochrome
c binds the inositol 1,4,5-
trisphosphate (IP3) receptor, one of the ER Ca
2+ release channels, to further stimulate Ca
2+
release [186]. Second, increased intracellular Ca
2+ can activate calpain. Calpain can cleave Bid,
providing another mechanism for cytochrome c release. Calpain activation also causes cleavage
of procaspase-12 [187]. Caspase-12 has been shown in knockout mice to be required for
apoptosis induced specifically by ER stress [188]. Cleaved caspase-12 translocates to the
cytoplasm and activates caspase-9 independently of apoptosome formation [189, 190]. These
events provide a mitochondria-independent mechanism for ER-mediated apoptosis. Some signals
that activate the ER death pathways originate within this organelle itself, where a complex array
of pathways mediate the unfolded protein and other ER stress responses [191]. In addition,
given
their roles in carrying upstream apoptotic stimuli to Bax and Bak at the mitochondria, BH3-only
proteins would be anticipated to perform an analogous function in the ER pathway.
BH3-only
proteins Bik (Bcl-2–interacting killer) and Puma have been implicated in the ER death
pathway
[192]. It remains unclear, however, whether these proteins function to relay signals from the

Chapter 1
37
periphery to the ER and/or from the ER to mitochondria. However, upstream signals originating
in the extrinsic pathway are known to be linked with the ER by Bap31 (B-cell receptor–
associated protein 31), an integral ER membrane protein that is cleaved by caspase-8 resulting in
ER Ca2+
release [193].
The apoptotic pathways described above have been schematically represented below.
Figure 1.6 Pathways of apoptosis.
Source: Gupta S et al. (2006) Lessons learned from apoptosis.

Chapter 1
38
1.11.2 Regulation of apoptosis during hypoxia
Both pro-and anti-apoptotic genes have been shown to be regulated by hypoxia. The
molecular pathways triggering the apoptotic response to hypoxia are far from completely
understood. Both p53 and Bcl-2 family members are involved in hypoxic activation of apoptosis.
The PI-3 kinase pathway plays an important role during oxygen deprivation induced cell death.
Electron transport inhibition also regulates hypoxia induced apoptosis.
1.11.2.1 Role of p53 in hypoxia-induced apoptosis
The transcription factor p53 has been implicated in regulating oxygen-deprivation
induced apoptosis. p53 can induce the expression of apoptotic genes such as Bax, NOXA,
PUMA and PERP [194]. Oxygen deprivation leads to p53 protein stabilization [148]. Hypoxia
causes p53 interaction with transcriptional repressor mSin3A but not with the transcriptional
activator p300 [128]. Also hypoxia causes localization of p53 to the surface of the mitochondria
[195]. In addition, severe hypoxia causes p53 accumulation by down-regulating its negative
regulator mdm2 and activation by post-translational modifications [196]. Hansson and
colleagues demonstrated that the DNA-binding domain of p53 binds two specific motifs adjacent
to and within the ODD domain of HIF-1 , irrespective of HIF-1 hydroxylation status [197].
Moreover, HIF-1 null cells accumulate more p53 protein than wild-type cells at low oxygen
concentrations, suggesting the expression of HIF-1 to cause p53 protein accumulation in
hypoxic cells, and thus induce apoptosis through p53 activation [198]. The hypoxia-dependent
post-transcriptional phosphorylation of p53 is by the ATR kinase, presumably due to replication
arrest that occurs under hypoxia. Reoxygenation and the consequent DNA damage can then
activate the ATM kinase which maintains p53 phosphorylation [152]. Hypoxic stress results in

Chapter 1
39
the association of p53 with transcriptional co-repressors and not co-activators capable of
repressing anti-apoptotic molecules such as stathmin [128].
1.11.2.2 Role of Bcl-2 family proteins in hypoxia-induced apoptosis
Pro- and anti-apoptotic members of the Bcl-2 family play a role in hypoxia-induced
apoptosis [175, 181]. BH3-only proapoptotic proteins, PUMA and Noxa, and BNIP3 and
BNIP3L have emerged as potential initiators of apoptosis by low oxygen concentrations [199-
202]. HIF-1 has been shown to induce the expression of BNIP3 (formerly called Nip3), a pro-
apoptotic member of the Bcl-2 family. BNIP3 heterodimerizes with Bcl-2/BcL-XL at
both the mitochondrial and non-mitochondrial sites [202]. Removal of the BH3 domain does not
inhibit apoptotic activity of BNIP3; instead, the transmembrane domain is critical for its
function/activity.
A direct role for HIF-1 in regulating sensitivity to oxygen deprivation induced apoptosis
come from genetic studies using embryonic stem cells with HIF-1 deleted. HIF-1 null cells
show a decrease in apoptosis compared to wild-type cells during oxygen deprivation [203].
Wild-type cells exhibit a decrease in Bcl-2 protein levels and an increase in p53 levels. In
contrast, HIF-1 null cells display no changes in p53 or Bcl-2 protein levels during oxygen
deprivation. Also, pancreatic cancer cells with constitutive expression of HIF-1 are resistant to
apoptosis induced by oxygen deprivation when compared to cells without constitutive expression
of HIF-1 [204]. Murine hepatoma cell lines without a functional HIF-1 display no difference
in sensitivity to oxygen deprivation induced apoptosis. Thus, HIF-1 can have various effects on
oxygen deprivation induced apoptosis depending on the cell type.
Other anti-apoptotic proteins regulated by hypoxia include (i) ORP150, an ER associated
heat shock protein, whose overexpression has been shown to prevent the release of cytochrome c

Chapter 1
40
and cell death in neurons deprived of oxygen. The precise mechanism by which ORP-150
inhibits cytochrome c release remains unknown. Presumably, ORP-150 prevents activation of
pro-apoptotic Bcl-2 family members [205]; (ii) IAP-2, which inhibits caspase activity IAP-2 is
induced in response to oxygen deprivation in a HIF-1 independent mechanism [206, 207] and
(iii) RTP801, a recently identified and cloned HIF-1 target gene. Hypoxia induces RTP801 in a
HIF-1 dependent manner. Over expression of RTP801 under normal oxygen conditions is toxic
in neuron-like PC12 cells while it is protective against oxygen deprivation induced cell death in
dividing PC12 cells and MCF-7 cells [208].
1.11.2.3 Role of PI3-kinase pathway in hypoxia-induced apoptosis
The phosphoinositide-3 kinase (PI3K)/Akt pathway is a potent mediator of cell survival
signals [209]. Activated PI3K phosphorylates inositol phospholipids to phosphatidylinositol
(3,4,5)-triphosphate (PIP-3). The increase in PIP-3 at the plasma membrane recruits Akt via its
pleckstrin homology (PH) domain. Akt, activated upon phosphorylation, in turn, can
phosphorylate and inactivate several substrates including the pro-apoptotic Bcl-2 family member
Bad, the forkhead family transcription factor FKHRL1 and caspase-9 [210-212]. Akt can also
mediate cell survival through hexokinase, an enzyme involved in the first committed step in
glycolysis [213]. Glycolysis utilizes glucose in the anaerobic production of ATP, which is
necessary for cell survival. Both hexokinase II and the pro-apoptotic protein Bax can bind to
mitochondria at the site of voltage dependent anion channel (VDAC). Binding of hexokinase to
the VDAC can inhibit or block Bax binding, thereby preventing cytochrome c release and
subsequent activation of apoptosis [214]. The tumor suppressor PTEN is involved in the negative
regulation of the PI3K/Akt pathway [215]. PTEN is a dual specificity phosphatase, which is
capable of dephosphorylating inositol phospholipids. Thus, PTEN activation results in decreased

Chapter 1
41
levels of PIP-3, leading to decreased Akt activity and increased apoptosis. PTEN null mouse
embryonic fibroblasts exhibit constitutively elevated activity of Akt and display decreased
sensitivity to cell death in response to a number of apoptotic stimuli, including UV irradiation
[216].
In cardiac myocytes adenoviral gene transfer of activated Akt protects against oxygen
deprivation induced apoptosis in vitro [217]. In contrast, over expression of activated Akt in
Rat1a fibroblasts did not protect cells from oxygen deprivation induced apoptosis [175]. Other
studies have shown that oxygen deprivation leads to Akt activation in PTEN null glioblastoma
cell lines [218]. Expression of wild-type PTEN in these cell lines prevented Akt activation in
response to oxygen deprivation. However, expression of PTEN at highly elevated levels did not
alter sensitivity to oxygen deprivation induced apoptosis in PTEN null glioblastoma cell lines.
Thus, the ability of Akt to prevent cell death during oxygen deprivation might be restricted to
cell type.
1.11.2.4 Role of electron transport inhibition in hypoxia-induced apoptosis
Electron transfer through the respiratory chain is coupled to the directional movement of
protons across the inner mitochondrial membrane. This movement across the membrane
establishes an electrochemical potential that provides the thermodynamic driving force for the
F1F0-ATP synthase to generate ATP in the matrix. Hypoxia leads to an inhibition of the electron
transport chain at cytochrome c oxidase, resulting in a decrease in inner mitochondrial membrane
potential. This initial decrease in inner mitochondrial membrane potential due to electron
transport inhibition during oxygen deprivation is the trigger for Bax or Bak activation [179].
Furthermore, mitochondrial membrane potential decreases in response to hypoxia prior to
cytochrome c release [175]. Cells devoid of mitochondrial DNA (o cells) do not undergo cell

Chapter 1
42
death in response to oxygen deprivation. Mitochondrial DNA encodes 13 polypeptides, including
the three catalytic subunits of cytochrome c oxidase, whereas nuclear DNA encodes the pro-
apoptotic protein cytochrome c. Therefore, o cells do not have a functional electron transport
chain and must rely only on ATP derived from anaerobic glycolysis for survival and growth. The
mitochondrial dependent cell death pathway is intact in o cells, as shown by their ability to
undergo death in response to a variety of apoptotic stimuli such as doxorubicin, growth factor
withdrawal, and staurosporine treatment [219, 220]. The inability of o cells to inhibit the
electron transport chain during oxygen deprivation is one explanation as to why o cells are
resistant to oxygen deprivation induced cell death. An alternate explanation is that o cells have
adapted to glycolysis. The loss of mitochondrial generated ATP due to electron transport
inhibition during oxygen deprivation could lead to activation of Bax or Bak. Since o cells have
adapted to glycolysis and show no acute changes in mitochondrial ATP levels during oxygen
deprivation, these cells might be resistant to hypoxia induced cell death. Presently, it remains
unresolved whether adaptation to glycolysis or electron transport inhibition is sufficient to
prevent hypoxia induced apoptosis.
1.12 Oxygen sensing mechanisms
Cells generally respond to prolonged hypoxia by reducing energy consumption and up
regulating ATP producing pathways [221]. The universal existence of these homeostatic
processes implies that all cells have the ability to sense changes in oxygen concentration and
their persistence in all mammalian species attests to their importance in determining survival
[222, 223]. The specific tissue of the carotid body is comprised of groups of glomus cells,
enveloped by glial-type sustentacular cells, and innervated by sensory nerve fibers. These units

Chapter 1
43
sense arterial pO2 and respond to hypoxia by initiating a variety of responses, which include the
arterial chemoreflex, i.e., increasing firing activity in the carotid sinus nerve. Despite extensive
work to identify the “oxygen sensor” in tissues whose specific role is to regulate the response to
changes in oxygen supply such as the glomus cells of the carotid body, the molecular
mechanism(s) involved have yet to be identified. It is likely that there are multiple O2 sensors
that respond to various pO2 levels, are differentially distributed and subserve different cellular
processes [222]. Current hypotheses centre around a number of biomolecules that can bind to O2,
either as a reversible ligand, producing allosteric shifts of the sensor, as a substrate, capable of
direct oxidation of the sensor or enzymatically converted to reactive oxygen species (ROS)
which, in turn, mediate the action on the effector molecules. Accordingly, the following
candidates for the mechanism of oxygen sensing have been proposed.
1.12.1 Evidence of heme as an oxygen sensor
This ligand model is based on the observation that heme proteins, such as hemoglobin
and cytochrome c-oxidase, bind O2 reversibly and the resulting configurational changes are
involved in the O2-dependent regulation of ion transporters and enzyme activity [224]. A heme
based O2 sensor has been proposed in erythropoeitin secreting cells because their response to
hypoxia is reversed by carbon monoxide (CO) which binds with greater affinity to and displaces
Figure 1.7 Heme sensor model.
Source: Lopez-Barneo J (2001) Cellular mechanism of oxygen sensing.

Chapter 1
44
oxygen from heme groups and is mimicked by incubation of the cells with iron chelators or
cobalt, which interfere with heme synthesis or render heme unable to bind O2 [225]. The heme-
sensor model, however, lacks direct experimental support. Moreover, it is now known that CO
can interact directly with HIF-1 , preventing its dimerization, and that iron and cobalt have
opposing effects on the interaction between pVHL and HIF-1 providing alternate explanations
for the observations upon which the hypothesis is based. Although HIF-1 has a PAS domain
that could bind a heme group, no direct interaction of HIF-1 with O2 has been demonstrated
[226].
The enzymatic production of reactive oxygen species (ROS) is sensitive to oxygen
availability and, hence, is a potential signaling pathway for transmission of the hypoxic stimulus
[227]. Although ROS can be produced at numerous cell sites and organelles, two systems have
been investigated as potential O2 sensors are NADPH oxidases and the mitochondrial electron
transport chain.
1.12.2 NAD(P)H oxidases
This plasma membrane-associated, phagocytic oxidase (NOX2) system is a multisubunit
assembly consisting of a membrane-bound catalytic complex of gp91phox
and p22phox
subunits,
which together form a flavo-cytochrome b558, and a cytosolic regulatory component consisting
of p47phox
, p67phox
, as well as other regulatory units including the GTPases Rac-1 and Rac-2
[228]. In NOX1 and 3 other isoforms substitute for gp91phox
and possibly other sub-units but are
mechanistically similar to NOX2; however NOX4 apparently does not require the cytosolic sub-
units for activation [229].

Chapter 1
45
This “membrane model” proposes that NAD(P)H-derived electrons are shuttled to O2 by
NAD(P)H oxidase at a rapid rate during normoxia, causing superoxide production. Under
hypoxic conditions, limited oxygen supply decreases superoxide generation. Reduced H2O2
production and a shift of cytosolic redox pairs to the reduced state ensues [230]. In pulmonary
vascular smooth muscle, this has been proposed as the mechanism underlying hypoxic
pulmonary vasoconstriction. According to this model, hypoxia inactivates redox-dependent
membrane K+ channel, results in membrane depolarization, opening of voltage-dependent Ca
2+
channels, entry of Ca2+
, and vasoconstriction [231, 232]. The findings that O2-sensitive K+
currents are potentiated by exogenous H2O2 and by activation of the oxidase with phorbol esters,
and that regulation of K+ channels by O2 is abolished in the transgenic oxidase-deficient mouse
with a null gp91phox
alleles provide experimental support for this proposal [233, 234].
Figure 1.8 Structure of NAD(P)H oxidase
Source: Tracy A. (2006) Chronic granulomatous disease, our understanding.

Chapter 1
46
There is strong evidence that NOX2 and a reduction in ROS underlies the response to
hypoxia in neuroepithelial bodies, with consequent inhibition of K+ channels and depolarization,
an important component of this evidence being loss of O2 sensing in gp91phox
-deficient mice
[235-237]. In contrast, O2 sensing was retained in glomus cells, adrenomedullary chromaffin
cells and lung from mice lacking gp91phox
, effectively ruling out any role for NOX2 in these
tissues [238-241]. Although knockout of p47phox
did not abolish O2 sensing in either lung or
glomus cells, in the former it caused inhibition of a rapid transient phase of HPV, whilst in
glomus cells it enhanced O2 sensitivity and abolished the hypoxia-induced elevation in ROS
[233, 241]. It has been suggested that the latter represents an important modulatory role for a
non-phagocytic NOX in glomus cells [234]. NOX4 has been shown to confer O2 sensitivity upon
TASK-1 channels in a model cell system, and TASK-1 has been implicated in O2 sensing for
both PASMCs and glomus cells [242-244]. Thus, although viable as an O2 sensor for specific
cellular functions in select cell types, the persistence of robust hypoxic pulmonary
vasoconstriction in the gp91phox
knockout mouse argues against a universal role [235, 238, 239,
245, 246].
Figure 1.9 NAD(P)H oxidase as oxygen sensor.
Source: Lopez-Barneo J (2001) Cellular mechanism of oxygen sensing.

Chapter 1
47
1.12.3 Mitochondria
Mitochondria, the largest consumers of oxygen, play a vital role in determining the
cytosolic pO2 and the O2 gradient between alveoli and cytosol. They are also recognized as
important signaling organelles [247]. To generate ATP by oxidative phosphorylation,
mitochondria use oxygen as the final electron acceptor. Accordingly, the mitochondria are well
positioned as the loci of cellular oxygen sensing [247]. The electron transport chain (ETC) is a
multi-step redox process that occurs in the inner mitochondrial membrane.
Figure 1.10 Mitochondrial Electron Transport Chain.
Source: Fig. 21.30, Biochemistry, 2nd
edition, R. Garrett and C. Grisham, Saunders Publishing

Chapter 1
48
The Kreb's cycle and -oxidation of fatty acids generate reduced nicotinamide adenosine
dinucleotide (NADH) and flavin adenine dinucleotide (FADH2) which are oxidised by the
electron transport chain (ETC) in the mitochondrial inner membrane. The components of the
ETC are outlined in Figure 1.10. Briefly, oxidation of NADH in complex I and FADH2 in
complex II leads to transfer of 2 electrons to ubiquinone to form ubiquinol. This is reoxidized by
complex III (cytochrome bc1) in two stages. One electron is first removed by the Fe–S group
leaving ubisemiquinone, and transferred via cytochromes c1 and c to complex IV (cytochrome c
oxidase, COX). The ubisemiquinone left behind is reoxidised to ubiquinone by cytochrome bL,
which passes the remaining electron to cytochrome bH. This reduces ubiquinone first to
ubisemiquinone and then back to ubiquinol, which re-enters complex III. Oxidation of one
molecule of ubiquinol back to ubiquinone thus takes 2 cycles of complex III, with the sequential
transfer of its 2 electrons to cytochrome c. These electrons are finally and sequentially
transferred by cytochromes a and a3 in complex IV to O2 to form water. The operation of
complexes I, III and IV cause extrusion of protons thus generating the mitochondrial membrane
potential ( m) and proton gradient ( pH) which drive the F0F1 ATP synthetase (reviewed in
[248]) . The mechanisms of the ETC are such that at various points single electrons can be lost to
molecular O2 to form reactive O2 species (ROS) in the form of superoxide, primarily from
reduced flavins in complex I and ubisemiquinone in both Qo (intermembrane space) and Qi
(matrix) sides of complex III; as much as 3% of electron flux through the ETC may be
constitutively lost in this way [249]. Superoxide is rapidly dismuted to peroxide by cytosolic and
mitochondrial superoxide dismutase (CuZnSOD and MnSOD respectively).
There is a wide consensus that inhibitors of oxidative phosphorylation or procedures that
modify mitochondrial function strongly affect O2 sensing in PASMCs, glomus cells and

Chapter 1
49
adrenomedullary cells though not in neuroepithelial bodies [250-254]. Significant controversy
exists, however, concerning the signalling mechanisms that link mitochondrial function to the
effectors, and there are currently three main hypotheses of mitochondrial O2 sensing, involving
cytosolic redox state, reactive O2 species (ROS) and energy state respectively. Under normal
physiological conditions, the ETC is a significant source of reactive oxygen species (ROS) [249].
Increased ROS generation occurs under hypoxic condition, when limited oxygen availability
decreases the Vmax of cytochrome oxidase, causing iron to remain in the ferric (Fe3+
) state,
thereby inhibiting prolyl hydroxylase activity HIF- stabilization and transactivation [255].
ROS generation and hypoxia-responsive gene expression occur simultaneously in
cardiomyocytes and Hep3B cells incubated under hypoxic conditions and these effects are
abolished in mitochondria-deficient cells. Others report that hypoxic responses can be blocked
by proximal ETC inhibition and addition of exogenous scavengers of ROS [86]. Similarly,
overexpression of enzymes that reduce ROS levels such as catalase or glutathione peroxidase
inhibit hypoxic pulmonary vasoconstriction (HPV) and the hypoxia-induced elevation in
intracellular [Ca2+
] and reverses hypoxia-induced HIF activation [256, 257]. However, the exact
correlation between pO2 and ROS production, the downstream targets of ROS, and how ROS
regulate these targets at the molecular level remain to be established.

Chapter 1
50
1.13 Thesis objective
The pulmonary and systemic circulations have evolved to preserve blood and oxygen
supply to the tissues, and this is vital for survival in physiological as well as pathological
conditions. By contraction and relaxation, VSMCs alter the luminal diameter, which enables
blood vessels to maintain an appropriate blood pressure. VSMCs are also important in vessel
remodeling in hypoxia induced disease states, such as arteriosclerosis and pulmonary
hypertension. In these cases, hypoxia regulates both cell proliferation and/or cell survival to alter
the structure of the vessels. Thus VSMCs are suited not only for short-term regulation of the
vessel diameter, but also for long-term adaptation, via structural remodeling by changing cell
number.
The function of VSMCs, and their responses to hypoxia, the basis for several
cardiopulmonary disorders, has been mostly studied in relation to the function of their adjacent
structures – in particular to the neighboring endothelial cells and fibroblasts. The direct response
of VSMCs in either the systemic or the pulmonary circulation to varying oxygen concentrations
remains largely unknown. Besides, these VSMCs experience a broad range of oxygen tensions
across the vessel wall, with an oxygen concentration of about 11.2% at the lumen to about 2.2%
at a depth of 150 . Previous studies have shown hypoxia to act as a mitogen, or, in some other
studies to induce growth arrest and cell death. Lack of consistency thus precludes a unifying
hypothesis.
There are several structural and physiological differences between the systemic and
pulmonary circulations. The bioenergetic processes that maintain cellular integrity depend on a
continuous supply of oxygen and substrates. To achieve this function, vascular smooth muscle
cells (VSMCs), in both the circulations, have adapted to tolerate relatively prolonged periods of

Chapter 1
51
hypoxia whilst maintaining appropriate distribution and delivery of essential substrates to other
tissues. However, there is a contrast in their basic response to hypoxia. Whereas in the systemic
circulation vasodilatation to hypoxia (hypoxic systemic vasodilatation, HSV) improves blood
supply and substrate delivery to hypoxic tissue, in the lung hypoxic pulmonary artery
vasoconstriction (HPV) maintains ventilation/perfusion matching and arterial oxygenation.
These could lead to differences in the proliferative and survival response of VSMCs from the
systemic and pulmonary circulations.
Chapter 2 reports the responses of human aortic smooth muscle cells to varying degrees
of hypoxia and the oxygen regulation of their proliferation and survival. Chapter 3 studies human
pulmonary artery smooth muscle cells – their proliferative and survival response/s compared
under normoxic and hypoxic conditions. Finally, based on the responses of aortic and pulmonary
artery smooth muscle cells to varying oxygen concentrations, we propose a possible molecular
mechanism that accounts for the divergent responses of the two cell types to hypoxia.

Chapter 1
52
1.14 Aims and hypotheses
Aims:
Determine if hypoxia has different effects depending on degree to which cellular energy
status is compromised in HASMCs and HPASMCs.
Identify oxygen sensitive cell-cycle regulatory genes and potential regulatory pathways
through gene expression profiling.
Establish the relevance of the above in vitro findings to systemic vascular remodeling
during hypoxia in vivo.
Hypothesis 1:
HASMC proliferation is enhanced or inhibited depending on the severity of hypoxia.
Hypothesis 2:
Proliferation and survival of PASMCs under hypoxic conditions are determined by their
capacity to maintain cellular ATP levels and that differences between these cells and
those from the systemic circulation reflect this parameter.

Chapter 2
53
Chapter 2
Oxygen regulation of systemic arterial smooth muscle cell proliferation and survival

Chapter 2
54
2.1 Introduction
Arterial smooth muscle cells are exposed to a broad range of oxygen concentrations. In
the aortic wall O2 concentrations from 11.2% at the lumen to 2.2% at a depth of 150 m[5, 6]
have been recorded and longitudinal gradients of similar magnitude occur in the normal
microcirculation[40]. Regions of severe hypoxia ( 1%O2) exist subjacent to atherosclerotic
plaques[7] and in arteries of hypertensive[8], and diabetic[9] rodents. Smooth muscle cell
proliferation and survival are modulated by hypoxia [203, 258] leading to speculation about its
role in vasculogenesis [11], vascular remodeling [10] and atherosclerosis [54, 203, 258, 259].
The effects of hypoxic incubation on vascular smooth muscle cells in culture, however, have
been inconsistent; with both enhanced proliferation [258, 260, 261] and growth arrest and
apoptosis [142, 262-264] have been reported. More importantly, the effect of levels of
hypoxemia relevant to human cardiopulmonary disease on systemic arterial smooth muscle cell
turnover, in vivo, is unknown.
Inconsistencies notwithstanding, the experimental evidence supports an important role for
oxygen in regulating vascular smooth muscle cell growth and survival which, given their
physiological and clinical relevance, requires clarification. Since cell replication is highly
energy dependent [265] it is intuitive, though unproven, that hypoxia may have different effects
depending on the degree to which cellular energy status is compromised. Furthermore, although
a number of cell cycle regulatory genes are oxygen sensitive, discrepant results have prevented
the development of a unifying hypothesis that accounts for the divergent effects observed. This
study was carried out to determine if different responses are elicited in human aortic smooth
muscle cells subjected to hypoxic incubation under conditions which do or do not result in
cellular ATP depletion, whether these effects are relevant to vascular remodeling during hypoxia

Chapter 2
55
in vivo and to identify potential regulatory pathways using gene expression profiling in cells
exposed to conditions that elicit discordant responses.

Chapter 2
56
2.2 Materials and Methods
Antibodies and Reagents:
FITC (fluorescein isothiocyanate) -conjugated Ki67 antibody was obtained from Dako
(Glostrup, Denmark), Hypoxia Inducible Factor 1- alpha (HIF-1 ) antibody from Novus
Biologicals (Littleton, CO, USA) and Cell division cycle 6 (CDC6) antibody from Lab Vision
(Fremont, CA, USA). Mini chromosome maintenance 2 (MCM2) and p21 antibodies were from
BD Pharmingen (San Diego, CA, USA). p53 antibody was from Cell Signaling Technology
(Danvers, MA,USA) and Telomerase Reverse Transcriptase (TERT) antibody from Calbiochem
(San Diego, CA,USA). CaspACE FITC-VAD-fmk in situ marker and TUNEL kits were both
from Promega (Madison, WI, USA). JC-1 labeling kit, ATP bioluminescence assay kit and TO-
PRO-3 dye were purchased from Molecular Probes (Carlsbad, CA, USA). All other reagents
were from Sigma (St. Louis, MO, USA).
Cell Culture Studies:
Human aortic smooth muscle cells (HASMC, Cambrex Bio Science Walkersville, MD,
USA), were propagated to passage 6 in SMGM-2 medium (Cambrex) consisting of SmBM
medium supplemented with single aliquots of 0.1% insulin, 0.2% hFGF-B, 0.1% GA-1000
(Gentamicin and Amphotericin B) and 5% v/v FBS, 0.1% hEGF. Cells exposed to hypoxia were
placed in a humidified Plexiglas chamber (Billups Rothberg, San Diego, CA, USA) maintained
at 37°C and continuously flushed with gas mixtures containing 10%, 5%, 3% or 1% O2, 5% CO2,
balance N2. By convention, the term normoxic is applied to cells exposed to air/5% CO2 (culture
media O2 concentration = 20.5%) under otherwise identical conditions. Upon reaching 70%
confluence the media was changed and cells were incubated for a further 16 or 48 hrs under

Chapter 2
57
either normoxic or hypoxic conditions. Experiments were repeated three times using cells from
at least 2 human donors with 6 replicates per observation.
Cell Counting: After exposure to normoxia or hypoxia (10%, 5%, 3% or 1% O2) for 16 or
48 hours, cells were washed twice with HBSS and detached with 0.25% trypsin and 0.02%
EDTA. Cell number was determined by cell counting using a standard hemacytometer
(American Optical, Buffalo, NY, USA) and cell viability was assessed by Trypan Blue
exclusion. Initial cell counting studies indicate that the effects of 3% and 1% O2 differ
qualitatively (Figure 1A), therefore, further studies compared normoxic cells with cells incubated
at these O2 concentrations. The concentrations of dissolved O2 in the culture medium, measured
using the ISO2 dissolved oxygen meter (World Precision Instruments, Sarasota, FL, USA) were
20.5 ± 0.6%, 3.1 ± 0.4% O2 and 1.2 ± 0.3%O2, respectively under the three conditions. Steady
state oxygen concentrations were achieved within 30 minutes.
The effect of hypoxia on the response to platelet derived growth factor (PDGF) was
assessed in HASMCs incubated under normoxia for 48 h following which, the cell culture
medium was replaced with medium containing 0.5% FBS. 48 hours later, 10nM PDGF-BB
(R&D Systems, Minneapolis, MA, USA) or the same volume of diluent (100 l SmBM-0.5%
FBS) was added to the medium, and the cells were allowed to proliferate under either normoxic
or hypoxic (1% or 3% O2) conditions for 48 hours.
[3H]-Thymidine incorporation: HASMCs, at passage 6, were seeded at a density of 2x10
4
cells / well in Corning 24 well plates, and grown for 24 hours. The culture medium was then
removed and cells were incubated in 1% FBS in SMGM-2 media for another 24 hours. 1
microcurie of [3H]-Thymidine (specific activity 3.22TBq/mmol; Amersham) was added to each

Chapter 2
58
well and the cells were exposed to air, 1% O2 or 3% O2 for 16, 24, 48 or 72 hours. Following
each exposure, the cells were washed twice with phosphate buffered saline (PBS), and fixed with
ice-cold 10% (w/v) trichloroacetic acid (TCA) for 20 minutes. The resulting precipitate was
solubilized in 0.1 N NaOH (0.5 ml/well) at 37°C. Solubilized DNA was transferred into
scintillation vials and [3H]-Thymidine incorporation was quantified by scintillation counting
(Liquid Scintillation System, Beckman Instruments).
Ki67 protein: The presence of Ki67 was detected in cells grown under normoxic or hypoxic
(1% or 3% O2) conditions for 16 or 48 hours. Detached cells were centrifuged at 1500 rpm for
10 minutes at 20°C. The supernatant was removed, the pellet suspended in 200 l of membrane
shredding solution (99.5% v/v Ca2+
and Mg2+
free Dulbecco’s PBS, 0.5% v/v NP-40, 0.5 mM
Sodium-EDTA, 0.5% w/v BSA, 20μg/ml protease inhibitior, 0.2 mg/ml RNAse) and kept at
room temperature for 15 minutes. Samples were incubated with 10 l of antibody in the dark for
30 minutes and analyzed by flow cytometry (Model Epics Altra, Beckman Coulter, Fullerton,
CA, USA). A minimum of 10,000 events, per sample, was recorded and cell debris was excluded
by adjusting the forward light scatter threshold setting. The number of cells positive for Ki67
was calculated using CELLQuest software (Becton
Dickinson, St. Louis, MO, USA).
Annexin V/Propidium Iodide labeling: The Roche Annexin V–FLUOS staining kit was
used to detect phosphatidylserine externalization (a marker of apoptosis) in HASMC, exposed to
normoxia or hypoxia (3% or 1% O2) for 16 or 48 hrs. The cell suspension was centrifuged at
1500 rpm for 10 minutes at 4° C. The pellet was resuspended in 5 ml of cold PBS and
centrifuged again. The supernatant was removed and the pellet suspended in 100 l of Annexin
V- FLUOS labeling solution (20μl Annexin V-Fluos labeling reagent and 20μl Propidium Iodide

Chapter 2
59
(PI) solution per ml of incubation buffer) at 37° C. Labeled cells were analyzed by flow
cytometry and the numbers of cells positive for either Annexin-V, or PI, or both, were
calculated.
Caspase activation: Caspase activation was detected in HASMCs exposed to normoxia or
hypoxia (3% or 1% O2) for 16 or 48 hours. CaspACE FITC-VAD-fmk is a FITC conjugate of
the cell permeable inhibitor of caspases. This structure allows delivery of the inhibitor into the
cell where binding to activated caspase, serves as an in situ marker for apoptosis. About 2 106
cells were incubated with 100 M FITC-VAD-FMK at room temperature in the dark for 20 min.
Cells were then washed, resuspended in PBS and the percentage of cells positive for activated
caspase quantified by flow cytometry.
Terminal deoxynucleotidyl transferase-mediated dUTP nick-end-labeling (TUNEL): HASMCs
exposed to normoxia or hypoxia (3% or 1% O2) for 16 or 48 hours were centrifuged at 1500 rpm
for 10 minutes at 4° C. The supernatant was removed and the cells fixed in 1% w/v iced
paraformaldehyde for an hour. The cells were washed with PBS and 70% ethanol. DNA labeling
solution (TdT enzyme and FITC-dUTP, DeadEndTM
Fluorometric TUNEL System, Roche,
Basel, Switzerland) was added and samples kept at 37oC for an hour, after which they were
analyzed for DNA breaks by flow cytometry.
DNA Content/Cell Cycle Analysis: HASMCs exposed to normoxia or hypoxia (3% or 1% O2)
for 16 or 48 hours were trypsinized, pelleted, resuspended, and washed once in cold PBS. The
cells were fixed with 70% ethanol and maintained at 4°C for 60 min. Ethanol was washed out
and cells were resuspended in 1ml of PBS and 10 l RNAse, and incubated for 45 min at room
temperature. PI (10 l) was added and cells were incubated in dark at room temperature for 30

Chapter 2
60
min prior to analysis by flow cytometry. In each experiment, 10,000 cells were counted. The
amplitude of the fluorescent signal was analyzed to quantify DNA content in order to determine
the fraction of the cell population in each phase of the cell cycle (G0/G1, S, and G2/M).
Mitochondrial membrane potential: Depolarization of the mitochondrial membrane was
detected by a cytofluorometric method using the potential-sensitive probe 5,5', 6,6'-tetrachloro-
1,1',3,3'-tetraethyl-benzimidazolylcarbocyanine iodide (JC-1). The JC-1 monomer enters the
mitochondria at physiological membrane potentials [266] where, as a result of aggregation, its
emitted wavelength changes from 530 nm (green) to 590 nm (orange) when excited at 490 nm.
Disaggregation to the monomeric form during mitochondrial membrane depolarization is
detected as an increase in green emission. HASMCs exposed to normoxia or hypoxia (3% or 1%
O2) for 16 or 48 hours were incubated with JC-1 (10 g/ml) for 20 minutes in the dark, washed
and resuspended in 1 ml PBS. The percentage of cells positive for JC-1 monomers was
quantified by flow cytometry.
Intracellular ATP Concentration: HASMCs exposed to normoxia or hypoxia (3% or 1% O2)
for 16 or 48 hours were washed twice with ice-cold PBS and lysed by the addition of equal
volumes of 3.6% perchloric acid. Samples were centrifuged, and ATP concentrations in the
supernatants were
determined using an ATP bioluminescence assay (Molecular Probes),
according to the instructions provided by the manufacturer.
The photometer was set for a 5-s
delay period and a 5-s integration period. ATP levels were calculated using standard reference
solutions corrected for background luminescence.
Western blotting: Western analysis was used to quantify levels of the hypoxia-inducible
transcription factor HIF-1 , markers of cell division - CDC6[267] and MCM2[268], cell cycle

Chapter 2
61
regulatory proteins p21, p53 and telomerase subunit TERT in nuclear extracts from HASMCs
exposed to normoxia or hypoxia (3% or 1% O2) for 16 or 48 hours. Cells were lysed in buffer A
(10 mM HEPES [pH 7.8], 10 mM KCl, 0.1 Mm EDTA, 1 mM dithiothreitol [DTT], 0.1%
Nonidet P-40 [NP-40]) with protease inhibitors (5 μg of aprotinin per ml, 5 μg of pepstatin per
ml, 5 μg of leupeptin per ml, 0.5 mM Pefabloc, 1 mM phenylmethylsulfonyl fluoride) and
phosphatase inhibitors (10 mM sodium fluoride, 1mM sodium orthovanadate, and 20 mM -
glycerophosphate). Nuclear proteins were then extracted with buffer B (50 mM HEPES [pH 7.8],
420 mM KCl, 0.1 mM EDTA, 1 mM DTT, 5 mM MgCl2, 20% glycerol) containing both
protease and phosphatase inhibitors. Equal amounts of protein extracted from HASMCs,
incubated under normoxic and hypoxic (3% and 1% O2) conditions for 16 and 48 hrs were
loaded on 4-12% Tris-Glycine gels, separated by electrophoresis and transferred to
nitrocellulose. Membranes were blocked with 5% milk overnight, and probed with anti-CDC6
(1: 2000), anti-MCM2 (1: 2000), anti-HIF-1 (1:500), anti-p21 (1: 3000), anti-p53 (1: 1000) and
anti-TERT (1: 200). In all cases, protein concentration was determined by the Bradford assay
and appropriate volumes of extraction buffer to produce constant protein loading in each lane
were mixed with SDS loading buffer. Equality of protein loading and transfer efficiency were
corroborated by full-lane densitometry of the Ponceau red-stained membranes. Immunoblots
were probed with horseradish peroxidase (HRP)-donkey anti-rabbit IgG (1:1000 in blocking
buffer) and visualized by enhanced chemiluminescence (ECL Plus kit, Amersham Biosciences,
Buckinghamshire, UK). Band intensity was quantified by densitometry (Bio-Rad Laboratories,
Mississauga, ON, Canada).
Microarray analysis using Affymetrix Gene Chip hybridization: In three separate experiments
total RNA was isolated from HASMCs exposed to normoxia, 3% O2 and 1% O2 for 16 and 48

Chapter 2
62
hours using Trizol Reagent (GIBCO/BRL). The quality of RNA was assessed using an Agilent
2100 Bioanalyzer (version A.02.01S1232, Agilent Technologies). Hybridizations were
performed on the HG-U133A GeneChip Set with a total of 22,280 genes (Affymetrix, Santa
Clara, CA, USA). Samples were prepared for hybridization (6 hybridizations per experiment)
according to standard Affymetrix instructions and performed at the Toronto Genomic Core
Centre at the Hospital for Sick Children. Experimental design, gene lists, hierarchical trees, chip
hybridizations and statistical analyses were in compliance with the Minimum Information About
a Microarray Experiment (MIAME) guidelines[269]. Data obtained from the GCOS (GeneChip
Operating Software) analyses of the individual arrays were normalized using the RMA (Robust
Multi-chips Analysis) method. After filtering, 2 way-ANOVA (non equal variance) was
performed and differentially regulated genes were clustered using GeneSpring 7.0
(http://www.agilent.com). For details see the supplementary data (GEO Accession # GSE 4725).
Animal studies:
All protocols were in compliance with standards set by the Canadian Council of Animal
Care and were approved by the institutional animal care committee. Male Sprague-Dawley rats
(175–200g) were placed in a Plexiglas chamber into which the flow of air and nitrogen was
controlled independently. In preliminary experiments, the arterial pO2 in rats, breathing a gas
mixture containing 10% O2, averaged 38 Torr (range 35–42 Torr)[270]. Rats exposed to hypoxia
breathed a gas mixture containing 10% O2 for 48 hours. Normoxic control animals breathed
room air under otherwise identical conditions. Data from each animal were averaged to serve as
a single value for statistical analysis.

Chapter 2
63
Detection of Nonviable Aortic and Mesenteric Artery Smooth Muscle Cells: Nonviable
cells were detected by their failure to exclude propidium iodide. As a positive control
Lipopolysachharide (LPS) from Escherichia coli 055:B5 (0.1mg/kg body weight) was injected
into the right jugular vein 72 hours prior to sacrifice, to induce apoptosis. At the end of the
exposure period normoxic, LPS treated, and hypoxia exposed rats were anesthetized by
intramuscular injection of 0.08ml/kg xylazine (20mg/ml) plus 0.72ml/kg
ketamine (100mg/ml)
followed by intravenous injections of 5 mol/kg propidium iodide. After 15 minutes, an incision
was made at the left atrial appendage of the heart and flushed thoroughly with 300 ml PBS. En
face sections of aorta and mesenteric artery were perfusion-fixed with 3.7% paraformaldehyde
for 1 hour, washed with PBS and permeabilised with 0.2% Triton X-100. TO-PRO-3 was used
for nuclear counterstaining. Sections were then mounted on glass slides with glycerol/phosphate-
buffered saline, and viewed under a laser-scanning confocal microscope (BioRad Radiance,
Hercules, CA, USA). Cells
that did not exclude propidium iodide, as indicated by
nuclear
fluorescence, were considered nonviable.
Detection of apoptotic cells: DNA fragmentation in aortic and mesenteric artery sections
was detected by TUNEL (DeadEndTM
Fluorometric TUNEL System, Roche). Slides containing
paraffin-embedded sections (normoxic and hypoxic rat aorta and mesenteric artery) were
dewaxed, rehydrated, permeabilized with Proteinase K, preincubated with equilibration buffer
and incubated with labeling solution (rTDT and nucleotide mix with fluorescein labeled dUTP)
for 1hour at 37oC. The reaction was terminated by incubating samples in a stopping buffer for 30
minutes. After PBS washes and counterstaining with TO-PRO-3, the samples were mounted and
examined by laser confocal microscopy.

Chapter 2
64
Detection of proliferating cells: Bromodeoxyuridine (BrdU) was infused subcutaneously
using osmotic pumps (Model 2ML-2, Alza Corp, Palo Alto, CA). Pumps containing 0.32 g of
BrdU in 2 ml vehicle (0.4%DMSO) were implanted intrascapularly in normoxic and hypoxia-
exposed rats 48 hours prior to sacrifice. The rats received approximately 0.4mg BrdU/hour
delivered continuously. At the end of the labeling period thoracic aorta and mesenteric artery
segments were excised, fixed with paraformaldehyde, washed with PBS, dehydrated in graded
ethanol (70-100%), cleared in xylene, and embedded in paraffin. 5μm thick sections were cut on
an oscillating blade microtome (Leica, Wetzlar,
Germany) and placed on coated glass
microscope slides (Fisher Scientific, Pittsburgh, PA, USA). Dewaxed and rehydrated slides were
incubated with 2M HCl for 1hour at 37oC. The acid was neutralized by 0.1M borate buffer, pH
8.5. Following PBS washes, the slides were incubated with fluorescein labeled anti-BrdU
antibody (Roche) for 1hour at room temperature, protected from light. Slides were then washed
with PBS and mounted for microscopy.
Quantitative analysis: The number of TUNEL positive, BrdU and TO-PRO-3 labeled
cells were determined in 3 aortic and mesenteric artery sections from each of 6 animals from
each experimental group. Four to six randomly selected microscopic fields ranging from 90–300
cells per field were counted for each section and the number of TUNEL- or BrdU-positive nuclei
expressed as a percentage of the total number of nuclei. Nuclear density was measured was
determined using Image J analysis software (NIH 2002, http://rsb.info.nih.gov/ij) and expressed
as the number of nuclei per μm2 x 10
-4. Data from each animal in each group were averaged to
serve as a single value for statistical analysis. Apoptotic index was evaluated for PI and TUNEL
staining.

Chapter 2
65
Smooth muscle -actin staining: Aorta and mesenteric artery sections from normoxic and
hypoxic rats were embedded (OCT compound; Miles Scientific; Naperville, IL) and quickly
frozen in liquid nitrogen. Cryostat sections (100 thick) were stained overnight at
4°C with Cy3
conjugated monoclonal anti smooth muscle -actin (Sigma, St. Louis, MO, USA). Sections were
counterstained with TO-PRO-3, washed with PBS and viewed under the confocal microscope.
Data analysis: Data are presented as mean ± standard error of the mean of n observations
with P < 0.05 considered significant. The
significance of differences between individual means
was determined by two-tailed Student’s t test. Differences among multiple means were evaluated
by analysis of variance corrected for multiple measures where appropriate and, when overall
differences were detected, differences between individual means were evaluated post-hoc using
the Student Neuman - Keuls procedure.

Chapter 2
66
2.3 Results
The proliferative response of HASMCs during normoxic and hypoxic incubation
was evaluated by cell counting (Figure 2.1), [3H]-thymidine incorporation (Figure 2.2) and
nuclear levels of S phase proteins (Figure 2.3). As shown in figure 2.1A cell number is increased
after incubation at 5% O2 for 48 hours and after incubation at 3% O2 for 16 hours and 48 hours.
Incubation at 1% O2 for either 16 or 48 hours reduced the total cell number. Similarly, in rat
A7R5 smooth muscle cells, cell number increased 22.8± 6.5% and 31.4±7.3% after incubation at
3% O2 for 16 and 48hrs, respectively (p <0.05 vs. normoxic control, for both) and decreased by
38.8±5.9% and 49.7±8.6% after incubation at 1% O2 for 16 and 48hrs, respectively (p < 0.05 vs.
normoxic control, for both). Trypan blue was excluded (cells are viable) in 97.1±0.9% of
HASMCs after normoxic incubation and in 94±0.4% after 16hrs and 92.2±0.6% after 48 hrs of
incubation at 1% O2 (p < 0.05 vs. normoxic control values for both). HASMC viability did not
differ between normoxic cells and cells incubated at 3% O2.
HASMC (synchronized by prior incubation with 0.5% FBS) cell numbers were decreased
by incubation at 1% O2 in the absence and in the presence of PDGF after 16 (18.5±4.6% and
19.7±3.8% decrease from normoxic control values, respectively) and 48 hrs (24.4±4.5% and
26.7±2.9% decrease from normoxic control values, respectively, Figure 2.1B). Incubation of
HASMCs at 3% O2, either in the absence or presence of PDGF caused an increase in cell number
at both 16 (20.3±4.5% and 23.3±4.8% increase from normoxic control values, respectively) and
48 hrs (35.6±3.7% and 36.7±4.8% increase from normoxic control values, respectively, Figure
2.1C).

Chapter 2
67
Figure 2.1 (A) Effects of hypoxia on human aortic smooth muscle (HASMC) cell
numbers after incubation for 16 and 48 hours * p <0.05 vs. corresponding normoxic
control values, #,p <0.05 vs. corresponding 3% O2 values.

Chapter 2
68
Figure 2.1 Effects of hypoxia on the proliferative response of HASMC cell numbers to
10nM PDGF-BB after incubation at 1% O2 (B) and 3% O2 (C) for 16 and 48 hours. n=6 per
condition. * p<0.05 vs. corresponding normoxic control values.

Chapter 2
69
The effect of hypoxic incubation for up to 72 hours on [3H]-thymidine incorporation, in
HASMCs, is illustrated in Figure 2.2. Incubation at 1% O2 decreased (Figure 2.2A) whereas 3%
O2 increased (Figure 2.2B) the rate of [3H]-thymidine incorporation reflecting the effects of these
conditions on the rate of DNA synthesis.
The effects of hypoxia on other markers of cell proliferation, Ki67 (nuclear proliferation
marker), CDC6[267] and MCM2[268] (both form the prereplication complex at the initiation site
for DNA synthesis), were also studied (Figures 2.3 and 2.4). The percentage of cells staining
positive for Ki67 decreased after incubation at 1% O2, whereas 3% O2 had the opposite effect
(Figure 2.3 A and B). Similarly, CDC6 protein was decreased and increased in cells incubated at
1% and 3% O2, respectively (Figure 2.4, A and B) and MCM2 protein was reduced after
incubation at 1% O2 (Figure 2.4, C and D).

Chapter 2
70
Figure 2.2 (A) (3H)-Thymidine incorporation (counts per minute), in human aortic
smooth muscle cells is decreased after incubation at 1% O2 and (B) increased after
incubation at 3% O2 compared with the normoxic cells. n=6, * p <0.05 vs.
corresponding normoxic control values.

Chapter 2
71
Figure 2.3 The percentage of cells positive for the Ki67 antigen is decreased after
incubation at 1% O2 (A) and increased after incubation at 3% O
2 (B). * p <0.05 vs.
corresponding normoxic control values.

Chapter 2
72
Figure 2.4 CDC6 (A and B) and MCM2 (C and D) protein levels after normoxic and
hypoxic (1% O2 and 3% O2) incubation. 1% O2 decreased CDC6 protein level while CDC6
protein is increased in cells exposed to 3% O2. 1% O2 decreased MCM2 protein level with no
change in cells exposed to 3% O2. * p <0.05 vs. corresponding normoxic control values.

Chapter 2
73
To determine whether hypoxia alters HASMC proliferation through a general effect on
cell cycle progression or through mechanisms specific to a particular cell cycle phase or
checkpoint, DNA content was quantified by PI staining (Figure 2.5). After incubation at 1% O2
there is accumulation of G0/G1 phase cells and depletion of cells in S and G2/M phases (Figure
2.5A) indicating a delay in G1/S transition. Conversely, incubation at 3% O2 results in a decrease
in the percentage of cells in G0/G1 phase, an increase in S phase cells and a corresponding
increase in the percentage of cells undergoing mitosis (Figure 2.5B) suggesting acceleration of
progression through the G1/S interphase. 94±0.8% of cells remained viable (did not stain for
either Annexin V or PI) after normoxic incubation compared with 91.8±0.7%, and 83.7±0.8%
following incubation at 1% O2 for 16 and 48 hours, respectively (p < 0.05 vs. corresponding
normoxic control values for both). After incubation at 3% O2 the percentage of viable cells did
not differ from the normoxic control value.

Chapter 2
74
% cells
G0/G1 S G2/M
1% O2 48hrs 91.8* 5.1
* 3.1
1% O2 16hrs 85.1* 11.1
* 3.8
21% O2 80.2 14.8 5.0
% cells
G0/G1 S G2/M
3% O2 48hrs 67.6* 22.9
* 9.5
3% O2 16hrs 75.3* 16.9
* 7.8
21% O2 81.1 13.6 5.3
Figure 2.5 Flow cytometric analysis of propidium iodide stained cells incubated to 70%
confluence under normoxia, then incubated for a further 48 hours under normoxia or hypoxia (1%
or 3% O2) or for 32 hours under normoxia and 16 hours under hypoxia (1% or 3% O2).
(A) Incubation at 1% O2 increases the percentage of cells at the G0/G1 interphase compared with
the normoxic cells, whereas (B) incubation at 3% O2 increases the percentage of cells in G2/M at
16 and 48 hours, compared with the normoxic cells. n=6, * p<0.05 vs. corresponding normoxic
control values.
% cells in cell cycle stage
% cells in cell cycle stage

Chapter 2
75
Since differences in cell number may reflect changes in the rate of cell death as well as
proliferation, the prevalence of smooth muscle cell apoptosis after normoxic and hypoxic
incubation was assessed in HASMCs by Annexin V / PI staining and TUNEL (Figure 2.6). The
percentage of cells that stained with Annexin V-FITC only (early apoptotic cells) increased after
incubation at 1% O2 and decreased at 3% O2 compared to the normoxic cells (Figure 2.6A).
Similarly, caspase activity and the percentage of TUNEL positive cells are increased after
incubation at 1% O2 (Figure 2.6B and Figure 2.6C respectively).
Figure 2.6 (A) Annexin V/PI staining indicate that apoptosis increased after
incubation at 1% O2 and decreased at 3% O2. * p<0.05 vs. corresponding normoxic
control values.

Chapter 2
76
Figure 2.6 (B) Caspase activity and (C) TUNEL indicate that apoptosis is increased
after incubation at 1% O2. * p<0.05 vs. corresponding normoxic control values.

Chapter 2
77
Depolarization of the mitochondrial membrane both results from and contributes to
impairment of cellular ATP synthesis and is an early event in apoptotic cell death. Figure 2.7
illustrates the effect of hypoxic incubation on the percentage of cells positive for JC-1 monomers
(an index of mitochondrial membrane depolarization). In cells incubated at 1% O2 for 16 hours
there is an increase in the percentage of cells positive for JC-1, indicating mitochondrial
membrane depolarization, and a further increase after 48 hours (Figure 2.7 A). There was no
change in the percentage of JC-1 monomer-positive cells after incubation at 3% O2 (Figure 2.7
B).
As shown in Figure 2.8 A, there is a decrease in cellular ATP concentration in HASMCs
incubated for 16 hours at 1% O2 and a further decrease after 48 hours. Incubation at 3% O2 did
not alter cellular ATP concentration (Figure 2.8, B).

Chapter 2
78
Figure 2.7 Increased JC-1 monomer formation indicates mitochondrial membrane
depolarization after incubation at 1% O2 (A) but not at 3% O2 (B). * p<0.05 vs. corresponding
normoxic control values.

Chapter 2
79
Figure 2.8 Cellular ATP concentration is decreased after incubation at 1% O2 (A) but
not 3% O2 (B). * p <0.05 vs. corresponding normoxic control values.
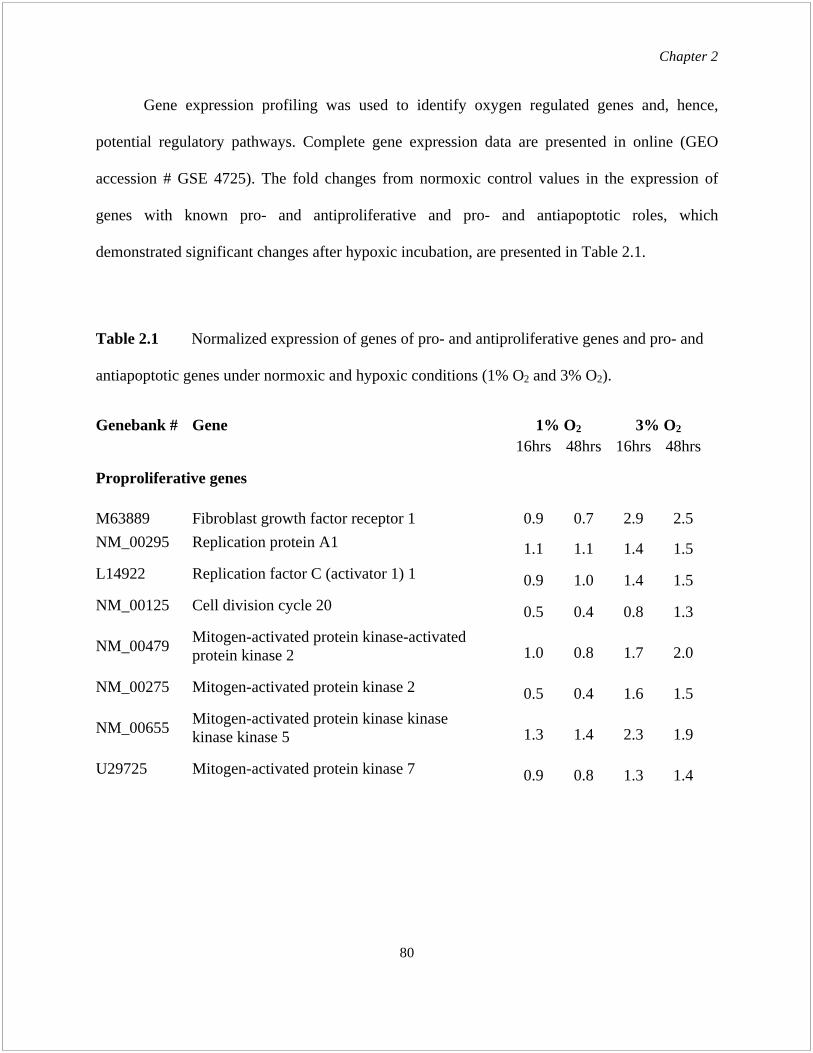
Chapter 2
80
Gene expression profiling was used to identify oxygen regulated genes and, hence,
potential regulatory pathways. Complete gene expression data are presented in online (GEO
accession # GSE 4725). The fold changes from normoxic control values in the expression of
genes with known pro- and antiproliferative and pro- and antiapoptotic roles, which
demonstrated significant changes after hypoxic incubation, are presented in Table 2.1.
Table 2.1 Normalized expression of genes of pro- and antiproliferative genes and pro- and
antiapoptotic genes under normoxic and hypoxic conditions (1% O2 and 3% O2).
Genebank # Gene 1% O2 3% O2
16hrs 48hrs 16hrs 48hrs
Proproliferative genes
M63889 Fibroblast growth factor receptor 1 0.9 0.7 2.9 2.5
NM_00295
Replication protein A1
1.1 1.1 1.4 1.5
L14922
Replication factor C (activator 1) 1
0.9 1.0 1.4 1.5
NM_00125
Cell division cycle 20
0.5 0.4 0.8 1.3
NM_00479
Mitogen-activated protein kinase-activated
protein kinase 2
1.0 0.8 1.7 2.0
NM_00275
Mitogen-activated protein kinase 2
0.5 0.4 1.6 1.5
NM_00655
Mitogen-activated protein kinase kinase
kinase kinase 5
1.3 1.4 2.3 1.9
U29725
Mitogen-activated protein kinase 7
0.9 0.8 1.3 1.4

Chapter 2
81
Table 2.1 Normalized expression of genes of pro- and antiproliferative genes and pro- and
antiapoptotic genes under normoxic and hypoxic conditions (1% O2 and 3% O2) contd.
Genebank # Gene 1% O2 3% O2
16hrs 48hrs 16hrs 48hrs
Antiproliferative genes
NM_00039
Cyclin-dependent kinase inhibitor 1A, p21
1.4 2.6 0.9 0.7
NM_00561
Retinoblastoma-like 2 (p130)
1.5 1.7 1.0 1.0
NM_00154
Inhibitor of growth family, member 1-like 3.0 2.8 1.0 1.2
AA583044
Bone morphogenetic protein 2 2.9 3.4 0.9 0.8
NM_00447
Dual specificity phosphatase 1 1.7 1.6 1.1 1.0
U16996
Dual specificity phosphatase 5 1.5 1.6 1.0 0.9
AF013168 Tuberous sclerosis 1 1.3 1.3 0.7 0.4
Proapoptotic genes
AF307851
Tumor protein p53 3.3 4.0 0.8 0.8
NM_00436
Caspase 3 1.3 1.3 0.8 0.8
AB037736
Caspase 8 associated protein 2 1.9 2.1 1.3 1.3
AF310105
Caspase recruitment domain protein 7 1.5 1.4 0.9 0.9
NM_004760
Serine/threonine kinase 17a 1.3 1.3 0.9 0.9
NM_004226
Serine/threonine kinase 17b 1.5 1.4 1.1 1.1
NM_013229
Apoptotic protease activating factor 1.2 1.2 1.0 1.0
Antiapoptotic genes
AF041461
CASP8 and FADD-like apoptosis regulator 0.6 0.6 1.5 1.5
U72398
BCL2-antagonist of cell death 0.9 0.6 1.8 1.9

Chapter 2
82
Figure 8 presents the effects of hypoxic incubation on nuclear levels of HIF-1 , p21 and
p53. HIF-1 levels are increased to a similar extent after incubation at 1% and 3% O2. Levels
of p21 and p53 proteins, inhibitory regulators of cell cycle progression, are increased after
incubation at 1% O2 with no change after incubation at 3% O2. Levels of TERT protein, a
component of the telomerase complex, that increaseed and enhanced HASMC survival following
longer hypoxic epochs (>20 days), [271, 272] did not differ from the normoxic control values
after 16 and 48 hours of incubation at 1% and 3% O2 (data not shown).
Figure 2.9 (A) Nuclear levels of HIF-1 protein after incubation of HASMCs under
normoxic and hypoxic (1% or 3% O2) conditions. Solid bars represent protein levels after
normoxic incubation, open bars after incubation at 1% O2 and hatched bars after incubation at
3% O2. * p<0.05 vs. corresponding normoxic control values.

Chapter 2
83
Figure 2.9 Nuclear levels of p21 (B) and p53 (C) proteins after incubation of HASMCs
under normoxic and hypoxic (1% or 3% O2) conditions. Solid bars represent protein levels
after normoxic incubation, open bars after incubation at 1% O2 and hatched bars after
incubation at 3% O2. * p<0.05 vs. corresponding normoxic control values.

Chapter 2
84
As shown in Figure 2.10, exposure to hypoxia increased the number of propidium iodide
staining cells (Figure 2.10 A) with a corresponding increase in the number of TUNEL positive
nuclei (Figure 2.10 B) in both aortic and mesenteric artery sections.
Mes
ente
ric
arte
ry
Ao
rta
Normoxic Hypoxic
Ao
rta
M
esen
teri
c ar
tery
Figure 2.10 (A) Propidium iodide staining of en face sections in paraffin embedded
sections of normoxic and hypoxic (48hrs) rat aorta and mesenteric artery (40X
magnification).

Chapter 2
85
B
Figure 2.10 (B) TUNEL in paraffin embedded sections of normoxic and hypoxic
(48hrs) rat aorta and mesenteric artery (40X magnification). (C) Quantitative analysis
confirms increased cell death and apoptosis after hypoxic exposure.
Mes
ente
ric
arte
ry
Ao
rta
Normoxic Hypoxic
Ao
rta
M
esen
teri
c ar
tery
C
Aorta Mesenteric artery

Chapter 2
86
Figure 2.11 (panel A) shows that, in aortic and mesenteric artery sections from hypoxia
exposed rats, there is an increase in the number of BrdU labeled cells compared with the
normoxic control group. Compared to normoxic animals, aortic and mesenteric artery sections
from hypoxia-exposed rats also demonstrate increased medial nuclear density (Figure 2.11, panel
B). Smooth muscle -actin staining (Figure 2.11, Panel C) confirms that the increase in
cellularity reflects an increase in medial smooth muscle.

Chapter 2
87
Figure 2.11 (A) Immunohistochemical staining of incorporated BrdU in paraffin embedded
sections of aorta and mesenteric artery from normoxic and hypoxia exposed (48hrs) rats (20X
magnification). (B) Double staining with TO-PRO-3 and (C) -Smooth Muscle Actin in
paraffin embedded sections of normoxic and hypoxic (48hrs) rat aorta and mesenteric artery
shows increased cellularity and medial smooth muscle cell density after hypoxia (40X
magnification).
Aorta Mesenteric artery
Normoxic Normoxic Hypoxic Hypoxic
A
B
C

Chapter 2
88
Figure 2.11 (D) Quantitative analysis of incorporated BrdU and TO-PRO-3 staining
confirms increased proliferation (top) and nuclear density (bottom).
Nu
cle
ar
de
nsity
(Nu
mb
er
of
nu
cle
i p
er μ
m2 x
10
-4)

Chapter 2
89
2.4 Discussion
We found that in HASMCs in culture: 1) incubation at 3% O2 enhances, whereas 1% O2
inhibits DNA synthesis and the time-dependent increase in cell number; 2) incubation at 1% O2
is associated with accumulation of cells in G1 phase of the cell cycle whereas 3% O2 increased
the percentage of cells in S and G2/M; 3) the prevalence of apoptosis is increased after
incubation at 1% O2; 4) cellular ATP levels are reduced and the mitochondrial membrane is
depolarized after exposure to 1% but not 3% O2; and 5) pro-and antiproliferative and pro- and
antiapoptotic gene expression are tightly coordinated to effect directionally opposed responses
within a narrow range of oxygen concentrations. In aorta and mesenteric arteries of rats
breathing 10% O2 (arterial PO2 40 mmHg) both smooth muscle cell proliferation and apoptosis
are increased.
Hypoxia has been reported to enhance proliferation in pulmonary artery and aortic
smooth muscle cells [10, 258, 260, 261, 273-276]. In apparent contradiction, others have
observed that hypoxic stress inhibits growth of these same cells [142, 147, 263]. The results of
the current study show that cell numbers, [3H]-Thymidine incorporation, biochemical markers of
proliferation (Ki67[277], CDC6[267] and MCM2[268] protein levels) and the response to
PDGF-BB are increased and decreased after incubation at 3% O2 and 1% O2, respectively. We
conclude that hypoxia may either enhance or inhibit HASMC proliferation depending on its
severity. Rather than being due to experimental error or differences in cell origin, the
discrepancy in previous observations, therefore, reflects fundamental differences in the nature of
the cellular response elicited by varying degrees of hypoxic stress. The effect persists during and
is additive to the effects of extrinsic stimulation with PDGF, suggesting that the responses are
Chapter 2
90
mediated by nonconvergent pathways. Total cell number, however, reflects effects on both
proliferation and cell death, and differential modulation of these processes by hypoxia and/or
PDGF could account for these findings without inferring independent signaling mechanisms.
Following incubation at 1% O2 we found that the percentage of cells in G1 phase of the
cell cycle is increased, with a corresponding depletion of cells in G2/M and S phases indicating a
delay in progression through the G1/S interphase. In contrast, incubation at 3% O2 results in a
decrease in the number of cells in G1 phase, an increase DNA synthesis and in the percentage of
mitotic cells, consistent with acceleration of the G1/S transition. The most frequently reported
effect of hypoxia is delayed entry into S phase [142, 147, 148, 262-264, 278] as we observed in
cells incubated at 1% O2. Our finding that enhanced proliferation in cells incubated at 3% O2 is
also associated with an alteration in the rate of G1/S transition, albeit opposite in direction, is
novel. It suggests that the bidirectional effects of hypoxia are integrated by events occurring at
this checkpoint.
During transition from G1 to S phase cyclin-dependent kinases (cdks) phosphorylate the
retinoblastoma protein (Rb) displacing the E2F-1 transcription factor and activating expression
of S phase genes required for DNA synthesis [145]. Activity of the cdks is dependent on
association with their respective cyclins and regulated by endogenous cdk inhibitors (eg. p21 and
p27). As shown in Table 2.1, genes whose products act at the G1/S transition are differentially
regulated under the conditions studied. Both p53 and its transcriptional activation target p21,
which inhibit G1/S transition, are increased after incubation at 1% O2 and unchanged at 3% O2.
Moreover, genes with known roles in modulating p53/p21 activity demonstrate patterns
consistent with their expected functional effects: Expression levels of replication protein A1,
which binds p53 preventing activation of p21 transcription [279]; components of the

Chapter 2
91
extracellular signal regulated kinase cascade, which stimulate assembly of the cyclinD–CDK4/6
complex promoting G1/S progression and p27 degradation [280]; are enhanced after incubation
at 3% O2 and inhibited following incubation 1% O2. Replication factor C (activator 1) 1[281],
CDC6 [267] and MCM2 [268] are similarly affected. Conversely, expression of antiproliferative
genes, Inhibitor of Growth Family, member 1 like, which binds and enhances p53 activity [282],
Bone Marrow Morphogenetic Protein 2, which induces SMAD-mediated expression of p21 and
p27 [283] and down regulates antiapoptotic Bcl-xL expression [284], and the dual specificity
phosphatases 1 and 5, which deactivate ERKs [285], show the opposite pattern. Corresponding
changes in Tuberous Sclerosis Complex-1, a negative regulator of mRNA translation [286]
(Table 2.1), suggest a mechanism by which the effects of hypoxia on protein and DNA
replication may be coordinated.
The results of three independent assays (Annexin V/PI, TUNEL and mitochondrial
membrane depolarization) and the changes in pro- and antiapoptotic gene expression (Table 2.1)
in the present study indicate that the rate of apoptosis is increased in HASMCs incubated at 1%
O2. The reduced cell number observed under this condition therefore reflects, in part, an
enhanced rate of cell death. In fibroblasts and tumour cells, hypoxia of sufficient severity to
cause ATP depletion impairs DNA repair and the increase in apoptosis in this setting is
considered a protective mechanism to prevent the accumulation of hypoxia-induced mutations
[201, 203, 287]. The increased rate of smooth muscle cell apoptosis during hypoxic epochs
associated with reduced [ATP] i in the current study may serve a similar adaptive purpose. That
hypoxia induces apoptosis at oxygen concentrations recorded in arteries affected by aneurismal
dilatation and atherosclerotic plaques, [288] and that hypoxemia, in vivo, increases smooth
muscle apoptosis in the walls of systemic arteries supports the suggestion that it may play a
Chapter 2
92
pathogenic role in arterial smooth muscle cell dysfunction [270] and loss in patients with
cardiopulmonary disease and shock.
Apoptosis may be triggered in response to stimuli extrinsic or intrinsic to the affected
cell. Ligand binding to the TNF receptor superfamily such as Fas, through their association with
the Fas associated death domain (FADD) protein, results in assembly of the death inducing
signaling complex (DISC) which recruits and activates caspase-8. The intrinsic pathway is
activated when mitochondrial membrane depolarization releases cytochrome C into the
cytoplasm where it binds apoptotic protease activating factor-1 (Apaf-1) allowing it to activate
pro-caspase-9. In the final common pathway caspase-9 (intrinsic) and caspase-8 (extrinsic)
cleave and activate the effector protease, caspase-3[289]. p53, through interactions with Apaf-1
[180] and protective Bcl proteins, directly activates caspase-3 [290] and enhances permeability
of the outer mitochondrial membrane [291]. Complementary regulation by death inhibitors and
the balance between prosurvival and proapoptotic Bcl-2 family members[292] superimposes an
additional level of control. Our finding (Table 1) that the expression of components of both the
extrinsic (Caspase-8 associated protein 2, Casp8 and FADD-like apoptosis regulator) and
intrinsic (caspase recruitment domain protein 7, apoptosis-inducing serine/threonine kinase 17a
and b, BMP2, Apaf-1, Bcl2l1 (BCL2-antagonist of cell death) and p53 [148]) pathways as well
as Caspase-3 are oxygen regulated, therefore, indicates that stimuli originating within the cellular
microenvironment as well as the intrinsic response are important in hypoxic activation of the
apoptotic program.
Resistance to apoptosis has been reported in lung fibroblasts, A7r5 cells, rat kidney
proximal tubular cells and rat pheochromocytoma PC12 cells during hypoxic incubation [207,

Chapter 2
93
293, 294]. In the current study the percentage of cells staining positive for Annexin V was
decreased and the expression of antiapoptotic genes (CASP8 and FADD-like apoptosis regulator
[295] and Bcl2l1, Bcl2–antagonist of cell death [296]) was increased following incubation at 3%
O2. Consistent with previous results in other cell types, therefore, hypoxia, at levels above those
causing outright cytotoxicity, enhances smooth muscle cell survival. In the systemic circulation,
protection from apoptotic cell death may be important in neovasoformation in response to
oxygen delivery/requirement imbalance during development and in ischemic tissues where
investiture of new endothelial networks by regulatory smooth muscle cells must occur under
conditions of relative oxygen deficiency.
The mitochondria are the site of oxidative phosphorylation, however, they must
themselves consume ATP [297] to maintain the trans-mitochondrial membrane potential on
which electron transport coupling depends [298]. Failure of efficient ATP synthesis and,
consequently, ion-motive ATPase activity ultimately results in depolarization of the membrane,
further ATP depletion, Ca2+
influx, phospholipase and protease activation and the release of
apoptotic factors [299-301]. Little information is available concerning the degree of hypoxia
required to initiate programmed cell death and it may vary among cell types [302]. Our present
results show that incubation of HASMCs at 1% but not 3% O2 causes mitochondrial membrane
depolarization, therefore, the threshold between normal physiological functioning and cell
destruction is exceptionally narrow in these cells, particularly when compared to the range of
oxygen concentrations to which they are normally exposed [303]. Conflicts among previous
reports are undoubtedly attributable, at least in part, to the lack of appreciation of this and the
experimental rigor needed to separate these responses.

Chapter 2
94
Nuclear levels of HIF-1 were elevated to a similar extent in HASMCs incubated at 3%
and 1% O2 whereas the effects on HASMC proliferation were directionally opposed. This
suggests that HIF-1 independent regulatory mechanisms predominate. It would be unusual,
however, if the primary oxygen sensing mechanism in mammalian cells were not involved in
such an important response. Moreover, many cell cycle associated genes contain functional
hypoxia regulatory elements and HIF-1-regulated pathways that both enhance cell survival [304,
305] and, conversely, increase apoptotic cell death [147, 306] have been identified. A more
complex role than can be accounted for by changes in HIF-1 levels must therefore be proposed
in order to reconcile these observations. Differences between mRNA expression of the HIF-1
regulated genes [87, 307] represented on the Affymetrix HG-U133A array in cells incubated
under the two conditions (see supplemental data, GEO Accession # GSE 4725) support this
notion. This is not surprising since HIF-1 is subject to extensive post-translational
modification prior to nuclear translocation [56] and interacts with a multitude of coregulatory
factors [147, 306, 308] offering many sites at which its function may be differentially affected by
the two conditions.
During the prenatal period, the systemic circulation undergoes continuous restructuring in
response to the changing requirements of the developing tissues. In the mature circulation,
hypoxemia, due to cardiopulmonary disease, elicits responses which redistribute blood flow and
enhance the capacity for oxygen extraction [309-311]. As the duration of hypoxia increases,
however, systemic vascular smooth muscle and endothelial cell function are impaired [270, 312],
limiting the efficacy of the acute responses. Concurrent structural remodeling thus plays an
increasing role in maintaining the balance between oxygen delivery and metabolic demand[311].
Our current results indicate that this is facilitated by increases in the rates of both smooth muscle

Chapter 2
95
cell proliferation and death, a paradoxical state that will markedly enhance cell turnover. During
remodeling, vascular cell replication and removal must be tightly controlled to ensure a degree of
plasticity sufficient to achieve the required structural change while avoiding the accumulation of
mutations and malignant transformation or the formation of abnormal structures that exacerbate
circulatory dysfunction. The results of the present study indicate that the difference between
oxygen concentrations that enhance smooth muscle cell proliferation and those that impair
cellular energy status and trigger cell destruction is correspondingly small and well within the
transmural and longitudinal gradients known to exist in the systemic circulation.
Although both proliferation and apoptosis are enhanced in aortae and mesenteric arteries
from hypoxia-exposed rats, the net effect is an increase in medial smooth muscle. Prolonged
hypoxia of this severity results in a progressive loss of systemic arterial and arteriolar
contractility [270, 313] with consequent impairment of the sympathetically-mediated reflexes
that regulate blood flow distribution [314]. In this context, increased muscularity of the arterial
wall can be viewed as a compensatory adaptation that preserves the capacity to regulate the
systemic circulation. Vital organ function is highly intolerant of oxygen deprivation.
Accordingly, mechanisms linking vascular cell turnover and the capacity for rapid structural
change directly to oxygen concentration are required to avoid delays inherent in second
messenger signaling. Our results indicate that pro- and antiproliferative and pro- and
antiapoptotic gene expression are tightly coordinated to produce directionally opposed responses
effected at the level of G1/S transition and involvement of both intrinsic and extrinsic apoptotic
pathways. Further definition of the individual roles of these regulatory mechanisms will be
valuable in identifying therapeutic targets in conditions in which enhanced plasticity of the

Chapter 2
96
vasculature may be exploited to alleviate tissue oxygen deficiency or in which over exuberant
remodeling interferes with normal cardiovascular function.

Chapter 3
97
Chapter 3
Oxygen regulation of pulmonary artery smooth muscle cell
proliferation and survival

Chapter 3
98
3.1 Introduction
Hypoxic pulmonary arterial hypertension (HPAH) contributes to morbidity and
premature mortality in patients with cardiopulmonary diseases and responds poorly to treatment.
[315-319]. Increased smooth muscle in the pulmonary arterial wall is a hallmark of this
condition and contributes to the increase in resistance to blood flow [315, 316, 320-323]. The
factors determining SMC proliferation and survival in the pulmonary circulation and, hence,
susceptibility to and severity of HPAH are poorly understood. Studies to determine the
mechanisms regulating these processes are, therefore, of high priority.
Smooth muscle cells of diverse origin proliferate in response to moderate levels of
hypoxia (2-3% O2) [258, 323]. Proliferation and viability of systemic arterial SMCs are reduced,
however, when hypoxia is sufficiently severe that the capacity to maintain intracellular ATP
levels is impaired [323]. Pulmonary artery smooth muscle cells (PASMCs) differ from those in
systemic arteries in several important respects. In addition to differences in their contractile
responses to hypoxia (contraction in PASMCs vs. relaxation in systemic vascular SMCs), and
vasoactive factors which may reflect differences in membrane ion channel expression [14, 324,
325], PASMCs are metabolically distinct. Mitochondria from these cells are relatively
depolarized, display lower expression of proximal ETC components and a greater propensity to
generate ROS at reduced oxygen tensions [326]. This could affect the response to hypoxic stress
and would be particularly apparent in highly energy dependent responses such as proliferation.
In vivo, hypoxia causes initial PASMC proliferation in rodents followed by a return to
quiescence with continued hypoxic exposure under the combined influences of endothelium-
derived mediators, circulating neurohumoral factors, and the direct effects of the hypoxic
microenvironment [327-330]. In cultured PASMCs from various species proliferation has been

Chapter 3
99
reported to be enhanced [276, 329, 331-338], inhibited [10, 276, 329, 331, 339-341] or unaltered
[331, 335, 340, 341] during exposure to hypoxia of varying severity and duration (Table 3.1).
This lack of consistency in experimental design among earlier studies has precluded the
development of consensus regarding the direct role of ambient oxygen concentration. It has been
equally difficult, for similar reasons, to establish the threshold at which hypoxia triggers cell
death in PASMCs and whether this differs from that in SMCs derived from other tissues,
although mechanisms that might confer protection from apoptosis in PASMCs have been
proposed [284, 342-345]. The current study was, therefore, carried out to determine if: 1) the
effects of hypoxic incubation on human PASMC proliferation and survival differ from those in
SMCs from the systemic circulation; 2) these responses differ under conditions which do or do
not result in cellular ATP depletion; and 3) these effects are relevant to pulmonary vascular
remodeling during hypoxia in vivo.

Chapter 3
100
Table 3.1 Influence of hypoxia on PASMC proliferation.
First author
(Reference) Species O2 %
Duration of
hypoxia
(days)
Proliferation PASMC
location
Seeding
density
(cells/cm2)
FBS %
Yang (329)
Human
(bronchial
carcinoma)
0 2, 4, 6 Distal PA 10000 10
Eddahibi (339) Rat 0 1 Proximal PA 25000 0.2
Hassoun (340) 0 Proximal PA 5000 10
3,10 Proximal PA 5000 10
Cooper (276) Human 0 4 Not specified 5000 2
5 5000 1, 2, 5
Rose (10) Human,
rabbit
1 1 Not specified 4000 Serum free
Stotz (338) Rat 1 2 Microvascular 4000 5
Lu (336) Rat 2 1,2 Not specified 2500 5
Frid (331) Cow 3 2 Lower media, outer
media rounded
epitheloid cells
~ 10000 10
3 2 All medial cells ~ 10000 0.1
3 2 Middle media, outer
media spindle shaped
cells
~ 10000 10
Lanner (335) Pig 3 2, 3, 4 Main branch of PA 5200 5
3 Main branch of PA 5000 0.1
Tamm (350) Human
(peripheral
lung cancer)
3 Not specified 5
Preston (337) Rat 3 3-10 Lobar PA 2000-4000 10, 0.1
Dempsey (273) Cow 3 2, 3, 4 Not specified 25,000-
50000
0.1
Stiebellehner Cow 3 4 Distal PA 25000 10
(341) 3 Distal PA 25000 0.1
Ambalavalan
(332)
Pig 1, 2, 3, 5, 7, 10 3
(1, 3, 5, 7)
Not specified 10000 10
Benitz (333) Cow 3,6, 9 10 Not specified 2500 10
PASMC: Pulmonary artery smooth muscle cell, FBS: Foetal bovine serum (concentration in cell culture media),
: Increase in PASMC proliferation, : Decrease in PASMC proliferation, : No change in PASMC proliferation.
Chapter 3
101
3.2 Materials and methods
Antibodies and Reagents
Hypoxia inducible factor 1- (HIF-1 ) antibody was purchased from Novus Biologicals
(Littleton, CO), p21 antibody from BD Pharmingen (San Diego, CA) and p53 antibody from Cell
Signaling Technology (Danvers, MA). CaspACE FITC-VAD-fmk in situ marker and TUNEL
kits were both from Promega (Madison, WI). 5,5’,6,6’-Tetrachloro-1,1’,3,3’-tetraethyl-
benzimidazolylcarbocyanine iodide (JC-1) labeling kit, ATP bioluminescence assay kit, and TO-
PRO-3 dye were purchased from Molecular Probes (Carlsbad, CA). All other reagents were
from Sigma (St. Louis, MO).
Cell Culture Studies:
Human pulmonary artery smooth muscle cells (HPASMCs, Cambrex Bio Science
Walkersville, MD, USA) were propagated to passage 6 in SMGM-2 medium (Cambrex)
consisting of SmBM medium supplemented with single aliquots of 0.1% insulin, 0.2% hFGF-B,
0.1% GA-1000 (Gentamicin and Amphotericin B) and 5% v/v FBS, 0.1% hEGF. Upon reaching
70% confluence the media was changed and cells were incubated for a further 16 or 48 hrs under
either normoxic or hypoxic conditions. Cells exposed to hypoxia were placed in a humidified
Plexiglas chamber (Billups Rothberg, San Diego, CA, USA) maintained at 37°C and
continuously flushed with gas mixtures containing 10%, 5%, 3%, 1% or 0% O2, 5% CO2,
balance N2. Normoxic cells were exposed to air/5% CO2 under otherwise identical conditions.
The concentrations of dissolved O2 in the culture medium, measured using the ISO2 dissolved
oxygen meter (World Precision Instruments, Sarasota, FL, USA) were 20.5 ± 0.6%, 3.1 ± 0.4%
O2, 1.2 ± 0.3% O2 and 0.3±0.2% O2 when the chamber was flushed with air/5% CO2, 3% O2, 1%
O2 and 0% O2 gas mixtures, respectively. Steady state oxygen concentrations were achieved

Chapter 3
102
within 40 minutes in each case. Experiments were repeated three times using cells from at least 3
human donors with 6 replicates per observation.
Cell Counting: After exposure to normoxia or hypoxia (10%, 5%, 3%, 1% or 0% O2) for
16 or 48 hours, cells were washed twice with HBSS and detached with 0.25% trypsin and 0.02%
EDTA and cell number was determined using a Coulter counter (Beckman Coulter, Inc,
Fullerton, CA). Cell viability was assessed by Trypan Blue exclusion.
BrdU incorporation/Cell cycle analysis: Bromodeoxyuridine (BrdU), an analog of the DNA
precursor thymidine is incorporated into newly synthesized DNA. Propidium iodide (PI) staining
was simultaneously done to measure total DNA. Cells were pulse-labeled by the addition of
BrdU to the culture medium to a final concentration of 10 μM during the last 16hrs or 48 hrs of
normoxic or hypoxic incubation. At the end of the incubation period, cells were harvested and
fixed for an hour in 70% ethanol followed by denaturation of DNA with 0.1 M HCl and
neutralization with 0.1M borate buffer. Cells were then incubated for 45 min in a solution of PI
(2.5 μg/ml) and RNase A (50 μg/ml) and with a fluorescein isothiocyanate-conjugated
monoclonal anti-BrdU antibody (diluted 1:1000, Pharmingen, San Diego, CA). The percentage
of cells staining positive for BrdU uptake was determined by flow cytometry (BD FACScan flow
cytometer, BD Biosciences, NJ) using CellQuest Software.
Annexin V-Propidium Iodide labeling: To assess the effect of hypoxic incubation on
apoptosis, the Roche (Basel, Switzerland) annexin V-fluorescence (Fluos) staining kit was used
to detect phosphatidylserine externalization (an early event in apoptosis), and PI uptake (a
marker of cell death) in HPASMC exposed to normoxia or hypoxia (3%, 1% or 0% O2) for 16 or
48 h. Cell suspension was centrifuged at 1,500 rpm for 10 min at 4°C. The pellet was
resuspended in 5 ml of cold PBS and centrifuged again. The supernatant was removed and the

Chapter 3
103
pellet suspended in 100 l of annexin V-Fluos labeling solution (20 l annexin V-Fluos labeling
reagent and 20 l Propidium Iodide (PI) solution per milliliter of incubation buffer) at 37°C.
Labeled cells were analyzed using flow cytometry, and the number of cells positive for Annexin
V, PI, or both were calculated.
Caspase activation: Caspase activation was detected in HPASMCs exposed to normoxia or
hypoxia (3%, 1% or 0% O2) for 16 or 48 hours. CaspACE FITC-VAD-fmk is a FITC conjugate
of the cell permeable inhibitor of caspases. This structure allows delivery of the inhibitor into the
cell where binding to activated caspase, serves as an in situ marker for apoptosis. About 2 106
cells were incubated with 100 μM FITC-VAD-FMK at room temperature in the dark for 20 min.
Cells were then washed, resuspended in PBS and the percentage of cells positive for activated
caspase quantified by flow cytometry.
Mitochondrial membrane potential: Depolarization of the mitochondrial membrane, was
detected using the potential-sensitive probe JC-1. JC-1 monomers enter the mitochondria at
physiological membrane potentials (62), where, as a result of aggregation, the emitted
wavelength changes from 530 nm (green) to 590 nm (orange) when excited at 490 nm.
Disaggregation to the monomeric form during mitochondrial membrane depolarization is
detected as an increase in green emission. HPASMCs exposed to normoxia or hypoxia (3%, 1%
or 0% O2) for 16 or 48 h were incubated with JC-1 (10 g/ml) for 20 min in the dark, washed,
and resuspended in 1 ml PBS. The % cells positive for JC-1 monomer was assessed by flow
cytometry.
Intracellular ATP concentration: HPASMCs exposed to normoxia or hypoxia (3%, 1% or
0% O2) for 16 or 48 h were washed twice with ice-cold PBS and lysed by adding equal volumes
of 3.6% perchloric acid. Samples were centrifuged, and ATP concentrations in the supernatants

Chapter 3
104
were determined by using an ATP bioluminescence assay (Molecular Probes), according to the
instructions provided by the manufacturer. The photometer (Multiskan EX Microplate
Photometer, Thermo Labsystems, Philadelphia, PA) was set for a 5-s delay period and a 5-s
integration period. ATP levels were calculated by using standard reference solutions corrected
for background luminescence.
Western blot analysis: Western blot analysis was used to quantify levels of HIF-1 and
the cell-cycle regulatory proteins p21 and p53 in nuclear extracts from HPASMCs exposed to
normoxia or hypoxia (3%, 1% or 0% O2) for 16 or 48 h. Cells were lysed in buffer A [10 mM
HEPES (pH 7.8), 10 mM KCl, 0.1 mM EDTA, 1mM dithiothreitol (DTT), and 0.1% Nonidet P-
40 (NP-40)] with protease inhibitors (5 g/ml aprotinin, 5 g/ml pepstatin, 5 g/ml leupeptin, 0.5
mM Pefabloc, and 1 mM phenylmethylsulfonyl fluoride) and phosphatase inhibitors (10 mM
sodium fluoride, 1 mM sodium orthovanadate, and 20 mM glycerophosphate). Nuclear proteins
were then extracted with buffer B [50 mM HEPES (pH 7.8), 420 mM KCl, 0.1 mM EDTA, 1
mM DTT, 5 mM MgCl2, and 20% glycerol], containing both protease and phosphatase
inhibitors. Equal amounts of protein extracted from HPASMCs, incubated under normoxic and
hypoxic (3%, 1% and 0% O2) conditions for 16 and 48 h, were loaded on 4–12% Tris-glycine
gels, separated by electrophoresis and transferred to nitrocellulose. Membranes were blocked
with 5% milk overnight and probed with anti-HIF-1 (1:500), anti-p21 (1:3,000), anti-p53
(1:1,000). In all cases, protein concentration was determined by the Bradford assay, and
appropriate volumes of extraction buffer to produce constant protein loading in each lane were
mixed with SDS loading buffer. Equality of protein loading and transfer efficiency were
corroborated by full-lane densitometry of the Ponceau red-stained membranes. Immunoblots
were probed with horseradish peroxidase-donkey anti-rabbit IgG (1:1,000 in blocking buffer)

Chapter 3
105
and visualized by enhanced chemiluminescence (ECL Plus kit, Amersham Biosciences). Band
intensity was quantified by densitometry (Bio-Rad Laboratories, Mississauga, ON, Canada).
Animal Studies:
The effects of hypoxic exposure on pulmonary vascular smooth muscle cell proliferation and
apoptosis in vivo were assessed in male Sprague-Dawley rats (175–200 g). All protocols were in
compliance with standards set by the Canadian Council of Animal Care, and were approved by
the Institutional Animal Care Committee. Rats were placed in a Plexiglas chamber into which
the flow of air and nitrogen was controlled independently. Rats exposed to hypoxia breathed a
gas mixture containing 10% O2 for 2 days, 7 days and 14 days. Normoxic control animals
breathed room air under otherwise identical conditions. In preliminary experiments, the arterial
PO2 in rats breathing 10% O2 averaged 38 Torr (range, 35–42 Torr). At the end of the exposure
period right and left main and first branch pulmonary arteries were excised immediately after
decapitation, rinsed with PBS, fixed with paraformaldehyde, dehydrated in graded ethanol (70–
100% ), cleared in xylene, and embedded in paraffin. Sections (5 m thick) were cut on an
oscillating blade microtome (Leica, Wetzlar, Germany) and placed on coated glass microscope
slides (Fisher Scientific, Pittsburgh, PA).
Detection of apoptotic cells: DNA fragmentation was detected by TUNEL (DeadEnd
Fluorometric TUNEL System, Roche). Slides containing paraffin-embedded sections were
dewaxed, rehydrated, permeabilized with proteinase K, preincubated with equilibration buffer,
and incubated with labeling solution (rTdT and nucleotide mixed with fluorescein-labeled dUTP)
for 1 h at 37°C. The reaction was terminated by incubating samples in a stopping buffer for 30
min. After PBS washes and counterstaining with TO-PRO-3, the samples were mounted and
examined by laser confocal microscopy.

Chapter 3
106
Detection of proliferating cells: To assess the effects of hypoxia on pulmonary artery
smooth muscle cell proliferation in vivo, bromodeoxyuridine (BrdU) uptake by these cells was
assessed as a marker of de novo DNA synthesis. BrdU was infused subcutaneously using
osmotic pumps (model no. 2ML-2; Alza Corp, Palo Alto, CA). Pumps containing 0.32 g of BrdU
in 2 ml vehicle (0.4% DMSO) were implanted intrascapularly in normoxic and hypoxia-exposed
rats 2 days, 7 days and 14 days before euthanasia. The rats received 0.4 mg BrdU/h delivered
continuously. At the end of the labeling period, the right and left main and first branch
pulmonary arteries were excised, fixed and embedded in paraffin. Dewaxed and rehydrated
slides were incubated with 2 M HCl for 1 h at 37°C. The acid was neutralized by 0.1 M borate
buffer, pH 8.5. Following PBS washes, the slides were incubated with fluorescein-labeled anti-
BrdU antibody (Roche) for 1 h at room temperature, protected from light. Slides were then
washed with PBS and mounted for confocal microscopy.
Smooth muscle -actin staining: Immunohistochemical staining using anti alpha-smooth
muscle actin antibody was carried out on the same slides to confirm localization of TUNEL and
BrdU uptake to smooth muscle. Following TUNEL or BrdU labeling, sections were covered with
blocking buffer (5% goat serum with PBS containing 1% BSA) for 30 minutes, following which
they were stained with Cy3-conjugated monoclonal anti-smooth muscle -actin (1:200 in
blocking buffer, Sigma) for 2 hours. Sections were counterstained with TO-PRO-3, washed with
PBS, and viewed with a confocal microscope.
Quantitative analysis: The number of TUNEL-positive, BrdU- and TO-PRO-3-labeled
cells was determined in three sections from each of six animals from each experimental group.
Four to six randomly selected microscopic fields ranging from 90–300 cells per field were
counted for each section, and the number of TUNEL or BrdU-positive nuclei was expressed as a

Chapter 3
107
percentage of the total number of nuclei. The diameter of a vessel (distance between external
lamina) and the thickness of the tunica media (distance between the internal and external elastic
lamina) were measured in main and first branch pulmonary artery sections stained for smooth
muscle -actin, from digitized images using Image J analysis software (NIH 2002,
http://rsb.info.nih.gov/ij). Thickness was measured at equally spaced 10 points around the vessel
wall and the percentage of medial wall thickness expressed as:
% medial wall thickness = ([medial thickness x 2]/external diameter) x 100
Data from each animal in each group were averaged to serve as a single value for statistical
analysis.
Data Analysis: Data are presented as means ± SEM of n observations with P< 0.05
considered significant. The significance of differences between individual means was determined
by two-tailed Student’s t-test. Differences among multiple means were evaluated by analysis of
variance (ANOVA) corrected for multiple measures, where appropriate, and, when overall
differences were detected, differences between individual means were evaluated post hoc using
the Student-Newman-Keuls procedure.

Chapter 3
108
3.3 Results
Figure 3.1A illustrates the effect of normoxic and hypoxic incubation on human
pulmonary artery smooth muscle cell (HPASMC) number. After incubation at 5% O2 for 16 or
48 hours, there was a trend toward increased cell numbers which did not reach statistical
significance. After incubation at 3% O2 for 16 or 48 hours, cell number was significantly
increased, compared to the normoxic control condition. After incubation at 1% O2 for 16 hours
cell number was increased compared to the normoxic control value, whereas after 48hrs cell
number was reduced. Incubation at 0% O2 inhibited the increase in cell number at both 16 and
48hr. time points. As shown in Figure 3.1B, HPASMC viability (Trypan Blue exclusion) was
not significantly affected by incubation at 10, 5, 3 or 1% O2. Viability was decreased after
incubation at 0% O2 for 16 and 48 hours.

Chapter 3
109
Figure 3.1 (A) Effects of hypoxia on human pulmonary artery smooth muscle cell
(HPASMC) numbers after incubation for 16 and 48 h. n= 6 per condition. *P <0.05 vs.
corresponding normoxic control values.

Chapter 3
110
Figure 3.1 (B) Effects of hypoxia on human pulmonary artery smooth muscle cell
(HPASMC) viability after incubation for 16 and 48 h. n= 6 per condition. *P <0.05 vs.
corresponding normoxic control values.

Chapter 3
111
To confirm that PASMC proliferation was altered by hypoxic incubation the percentage
of cells that incorporated BrdU after incubation at 3%, 1% and 0% O2 for 16 and 48 hrs was
assessed. As shown in Figure 3.2, the percentage of BrdU positive cells is increased after
incubation at 3% O2 for both 16 and 48 hours and at 1% O2 for 16 hours. BrdU incorporation is
decreased after incubation at 1% O2 for 48 hours and at 0% O2 for both16 and 48 hours.
Figure 3.2 The % BrdU incorporated cells increased after incubation at 3% O2
for 16 and
48 h, and after incubation at 1% O2 for 16 h. BrdU incorporation decreased after incubation at
1% O2 for 48 h and after incubation at 0% O2
for 16 and 48 h. n= 6 per condition. *P <0.05
vs. corresponding normoxic control values.

Chapter 3
112
Since the effects of hypoxic incubation on PASMC cell numbers may also reflect
changes in the rate of cell death, the percentage of PASMCs staining positive for Annexin V,
Propidium iodide, activated caspases and JC-1 monomers was recorded after normoxic and
hypoxic incubation and are presented in Figures 3.3 A-E respectively. The percentage of viable
cells (staining negative for both Annexin V and PI) was unaffected by incubation at 3% and 1%
O2 but decreased significantly after incubation at 0% O2. Similarly, the percentage of cells
positive for activated caspases and for JC-1 monomers are unchanged after incubation at 3% or
1% O2 but increased after incubation at 0% O2 for 16 h and increased further after 48h.

Chapter 3
113
Pro
pid
ium
io
did
e
Pro
pid
ium
io
did
e
0% O2, 16hrs
Annexin V
Figure 3.3 (A) Representative flow cytometric plots for Annexin V/PI staining after
incubation at 0% O2 , 16 and 48 h, compared with the normoxic cells; n= 6. *P<0.05 vs.
corresponding normoxic control values.
21% O2, 16hrs
21% O2, 48hrs 0% O2, 48hrs

Chapter 3
114
Figure 3.3 (B) Bar graphs representing reduced number of Annexin V and PI negative cells
(live cells) after incubation at 3%, 1% and 0% O2 , 16 and 48 hours, compared with the normoxic
cells (open bars); n= 6. *P<0.05 vs. corresponding normoxic control values.

Chapter 3
115
Figure 3.3 (C) Representative flow cytometric plots for increased caspase activity after
incubation at 0% O2 , 16 and 48 hours, compared with the normoxic cells (open bars); n= 6.
*P<0.05 vs. corresponding normoxic control values.
0% O2, 16hrs
FITC-Caspase
21% O2, 16hrs
21% O2, 48hrs 0% O2, 48hrs
Counts

Chapter 3
116
D
E
Figure 3.3 (D) Increased caspase activity and (E) increased 5,5’,6,6’-tetrachloro-
1,1’,3,3’-tetraethyl-benzimidazolylcarbocyanine iodide (JC-1) monomer formation
(indicating mitochondrial membrane depolarization) after incubation at 0% O2 compared
with the normoxic cells (open bars); n=6. * P<0.05 vs. corresponding normoxic control
values.

Chapter 3
117
To determine if hypoxia exerts a general effect on cell cycle progression or affects a
specific cell cycle phase, DNA content was quantified by PI staining to assess the percentage of
cells in G0/G1, S and G2/M phases. As illustrated in figure 3.4, incubation of HPASMCs at 3%
O2 (16 and 48hrs) decreased the percentage of cells in G0/G1 phase and increased the percentage
of S-phase cells with a corresponding increase in the percentage of cells undergoing mitosis.
This suggests acceleration of progression through the G1/S interphase. A similar distribution is
observed after incubation at 1% O2 for 16 hrs. After incubation at 1% O2 for 48hrs and at 0% O2
for 16 and 48hrs, however, there is accumulation of G0/G1phase cells and depletion of cells in S
and G2/M phases, indicating a delay in transition through the G1/S interphase.

Chapter 3
118
Figure 3.4 Flow cytometric analysis of propidium iodide stained normoxic (N) and
hypoxic (3%, 1% or 0% O2) cells. Incubation at 3% O2 16 and 48 h and 1% O2
16 h
increases the percentage of cells in G2/M, whereas incubation at 1% O2 48 h and 0% O
2 16
and 48 h increases the percentage of cells at the G0/G1 interphase. n = 6, * P<0.05 vs.
corresponding normoxic control values.

Chapter 3
119
p53 and its transcriptional target p21 are inhibitory regulators of cell cycle progression
and are involved in hypoxia induced growth arrest in cancer cells [144]. Expression of these
nuclear proteins were therefore, used as biochemical indices of the proliferative response. HIF-
1 nuclear translocation reflects activation of the cellular response to hypoxia and its nuclear
levels were measured to confirm that the cells were responding, at, a molecular level, to the
hypoxic stimulus. Levels of both p21 (Figure 5A) and p53 (Figure 5B) are increased after
incubation at 0% O2 but did not differ significantly from the normoxic control values after
incubation at 3% O2 or 1% O2. Nuclear HIF-1 levels (Figure 5C) increased from the normoxic
values after incubation at 3%, 1% and 0% O2.

Chapter 3
120
Figure 3.5 (A) Nuclear levels of p21 protein after incubation of HPASMCs under
normoxic and hypoxic (3, 1 or 0% O2) conditions. n= 6. *P <0.05 vs. corresponding
normoxic control values.
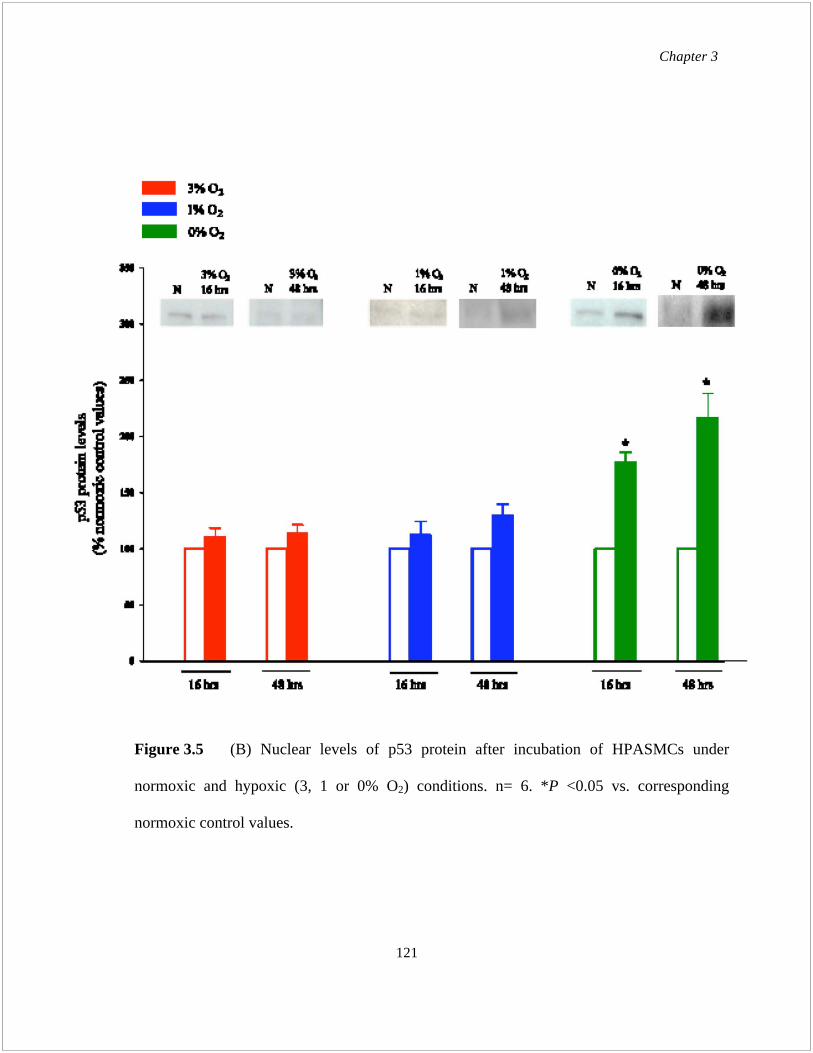
Chapter 3
121
Figure 3.5 (B) Nuclear levels of p53 protein after incubation of HPASMCs under
normoxic and hypoxic (3, 1 or 0% O2) conditions. n= 6. *P <0.05 vs. corresponding
normoxic control values.

Chapter 3
122
Figure 3.5 (C) Nuclear levels of HIF-1 protein after incubation of HPASMCs under
normoxic and hypoxic (3, 1 or 0% O2) conditions. n= 6. *P <0.05 vs. corresponding
normoxic control values.

Chapter 3
123
As shown in Figure 3.6, intracellular ATP concentration remained unchanged in human
pulmonary artery smooth muscle cells incubated at 3% O2. After 48 hours of incubation at 1%
O2, ATP levels decreased (7.6 ± 2.8 % decrease from normoxic control value), however this
change did not reach statistical significance (p = 0.096). In cells incubated at 0% O2 cellular
ATP concentration was reduced after 16 h and decreased further after 48 h (17.38 ± 4.5% and
22.5 ± 3.8% decrease vs. corresponding normoxic control values, respectively, p < 0.05 for
both).
Figure 3.6 Cellular ATP concentration is decreased after incubation at 0% O2
compared with the normoxic cells (open bars). n= 6. *P<0.05 vs. corresponding normoxic
control values.

Chapter 3
124
The effects of hypoxic exposure on pulmonary artery smooth muscle cell apoptosis and
proliferation in rats was assessed to evaluate the effects of physiologically relevant levels of
hypoxia on the pulmonary vasculature in vivo. TUNEL staining of pulmonary artery sections
(Figure 3.7, A and B) was carried out after 2, 7 and 14 days of hypoxic exposure (10% FiO2). In
the main pulmonary artery and first branch pulmonary artery the apoptotic index was
significantly increased after 7 days of hypoxic exposure and returned to normoxic control values
after 14 days. Figure 3.8, A and B illustrate the effects of in vivo hypoxia for 2, 7 and 14 days on
thickness of the pulmonary artery smooth muscle layer and BrdU incorporation. There is
maximum BrdU incorporation after 7 days with a subsequent decrease in the number of BrdU
staining cells to normoxic levels after 14 days, mirroring the effects of apoptosis. As illustrated
in Table 3.2, medial wall thickness was increased after 7 days and remained at this level after 14
days of continuous hypoxic exposure.

Chapter 3
125
Normoxic Hypoxic
Figure 3.7 (A) Representative images of TUNEL in paraffin-embedded sections of
normoxic and hypoxic (2 days, 7 days, 14 days) rat pulmonary artery and pulmonary artery
branch (x40 magnification).
Pu
lmo
nar
y a
rter
y
(Mai
n)
Pu
lmo
nar
y a
rter
y
bra
nch
2 days 7 days 14 days

Chapter 3
126
Figure 3.7 (B) Quantitative analysis of TUNEL positive cells; n=6 rats per group. *P<0.05
vs. corresponding normoxic control values.

Chapter 3
127
Normoxic Hypoxic
Figure 3.8 (A) Representative images of immunohistochemical staining of incorporated
BrdU (green) and -smooth muscle actin (red) in paraffin-embedded sections of pulmonary
artery and pulmonary artery branch from normoxic and hypoxia (2 days, 7 days, 14 days)
exposed rats (x40 magnification).
2 days 7 days 14 days
Pu
lmo
nar
y a
rter
y
(Mai
n)
Pu
lmo
nar
y a
rter
y
bra
nch

Chapter 3
128
Table 3.1 Medial wall thickness (% ) of pulmonary artery and pulmonary artery branch
from normoxic and hypoxia (2 days, 7 days, 14 days) exposed rats; n=6 rats per group. *P<0.05
vs. corresponding normoxic control values.
Main Pulmonary artery Branch pulmonary artery
Normoxic 5.8±0.04 4.9±0.03
2 day hypoxic 6.1±0.03 5.1±0.06
7 day hypoxic 10.4±0.9* 9.4±0.8*
14 day hypoxic 11.1±0.1* 9.9±0.5*
Figure 3.8 (B) Quantitative analysis of BrdU positive cells; n=6 rats per group. *P<0.05
vs. corresponding normoxic control values.

Chapter 3
129
3.4 Discussion
The main findings of this study are that: in HPASMCs in culture 1) incubation at 3% O2
for 16 and 48hrs and at 1% O2 for 16hrs increases cell number DNA synthesis and the
percentage of cells in S and G2/M phases of the cell cycle; 2) proliferation and DNA synthesis
are inhibited after incubation at 1% O2 for 48hrs and at 0% O2 for 16 and 48hrs with a
corresponding accumulation of cells in G1 phase; 3) the prevalence of apoptosis and nuclear
levels of the antiproliferative, proapoptotic factors p21 and p53 are unaffected by incubation at
3% and 1% O2 but are increased after incubation at 0% O2; and 4) cellular ATP levels are
reduced, and the mitochondrial membrane is depolarized after incubation at 0% O2. In the
pulmonary artery of rats breathing 10% O2 (arterial pO2 40 Torr), smooth muscle cell
proliferation and apoptosis are increased during the first seven days of hypoxic exposure with the
net effect being accumulation of smooth muscle in the vessel wall.
A hallmark of hypoxic pulmonary hypertension is medial thickening in larger pulmonary
arteries and muscularization of distal arteries not normally invested with smooth muscle [346,
347]. Hypoxia has long been known to stimulate PASMC proliferation in vivo although in most
models, including that used in the current study, this is a transient effect being maximal after 7
days and then subsiding [348]. The mechanisms, by which the proliferative response is activated
and, subsequently, regulated, are unresolved [349].
Hypoxia affects PASMC proliferation even in the absence of other cell types; therefore,
although mitogens and cytokines from surrounding cells may modulate the response in vivo, both
the sensory and effector mechanisms that underlie these effects are localized to the smooth
muscle cell [323]. Studies of the influence of hypoxia on PASMC proliferation in vitro have
yielded contradictory results [273, 276, 329, 331-338, 340, 341, 350]. Consequently, it remains

Chapter 3
130
unclear whether hypoxia has a direct mitogenic effect on PASMCs or acts as a comitogen acting
in concert with hypoxia-induced release of proproliferative factors from adjacent endothelial
cells or fibroblasts. Studies in which a positive correlation between acute hypoxia and PASMC
proliferation was observed tended to use moderate levels of hypoxia (3–5% O2) [276, 332-334,
336, 338, 350], whereas studies in which hypoxia caused a decrease in PASMC proliferation
were carried out under conditions of severe hypoxia or anoxia (< 2% O2) [329, 339, 340]. For
example, Ambalavan et al. showed
that swine proximal PASMC proliferated at oxygen
concentrations of
5–10% [273, 332], whereas, Stotz et al.
showed a 5–10% increase in
proliferation rates of rat pulmonary microvascular SMC at 1% O2 [338, 341]. Our current
findings reconcile these discrepancies since they demonstrate that, rather than being due to
variations in experimental conditions or species, hypoxia of differing severity may exert
opposing effects depending on the capacity of these cells to maintain cellular energy status under
the specific conditions studied.
Previous studies have shown hypoxia induced G1 arrest in cell cycle of HPASMCs to be
mediated by CDK inhibitor p21. In contrast, others have reported that cell cycle arrest at late G1
is caused by p27 expression under severe hypoxia [142, 351-353]. Li et al found that the oxygen-
dependent checkpoint of the cell cycle is controlled by p27 expression, and that cAMP signaling
also interferes with the cell cycle and p27 expression [354]. However, the precise mechanisms
and interactions between the pathways activated by hypoxia, as well as the antiproliferative
effects of p27 or p21 during hypoxic exposure in HPASMCs remain uncertain [355]. Our finding
that HPASMC incubation at 1% O2 for 48hrs and 0% O2 for 16 and 48hrs, causes G1/S arrest is
in line with those of others [258]. In addition, we also show that the directionally opposed effects
of hypoxia on HPASMCs, proliferation or growth arrest, are integrated by events at G1/S.
Chapter 3
131
Proliferation of HPASMCs requires these normally quiescent cells to enter the cell cycle. The
most important molecular process for cell cycle progression is retinoblastoma protein
phosphorylation by cyclin-dependent kinase (CDK)-cyclin complexes, and CDK activities are
mainly regulated by CDK inhibitors such as p21 and p27 [356].
In HPASMCs, both p53 and its transcriptional activation target p21, which inhibits G1/S
transition, are increased after incubation at 1% O2 48hrs and at 0% O2, but remain unchanged at
3% O2 and at 1% O2 16hrs. HIF levels are also increased in HPASMCs post incubation at 3, 1
and 0% O2, although the cell number increased at 1% O2 16 hrs and cell number decreased at 1%
O2 48hrs. This indicates HIF-1 -independent regulatory mechanisms causing the directionally
opposed proliferative responses of hypoxia. HIF-1 is the major transcription factor induced
under hypoxia, and is known to regulate pathways that both enhance cell survival as well as
induce cell death. Many cell cycle-associated genes containing functional hypoxia regulatory
elements have been identified [304-306]. Considering these, it is unlikely that there is no HIF-1
involvement at all in affecting the proliferative responses of HASMC or HPASMC. Further
studies are needed to understand the possible interaction of HIF-1 with other coregulatory
molecules.
Apoptosis plays an important role in cell number control in various tissues
and organs by
balancing cell growth and multiplication. The remodeling in pulmonary vascular structure is
mainly caused by imbalanced proliferation and apoptosis in pulmonary artery smooth muscle
cells [357-359]. An increase in PASMC proliferation and a decrease in PASMC apoptosis could
concurrently mediate thickening of the pulmonary vasculature, which subsequently reduces the
lumen diameter of pulmonary arteries, increasing pulmonary vascular resistance. It has been
demonstrated that increased PASMC proliferation and/or inhibited PASMC apoptosis both

Chapter 3
132
contribute to induce pulmonary vascular medial thickening [360, 361], and this acquisition of
resistance to apoptosis along with increased rates of VSMC proliferation appear to be necessary
for neointima formation [362-365]. The role of p53 in mediating VSMC apoptosis has been
proposed [366-368], though p53 alone does not induce apoptosis in either normal human or rat
VSMCs in vitro or in vivo unless the cells are primed to die [369-371], or massive expression is
induced via adenovirus vectors [372]. The precise mechanisms
involved in the regulation of
PASMC proliferation and apoptosis in PAH are still incompletely understood.
The precise level
of hypoxia that induces apoptosis in HPASMCs, has also not been defined.
The results of our apoptosis assays (Figure 3.3 A-E) show hypoxia induced cell death in
HPASMCs only after incubation at 0% O2. Viability is maintained at 3% O2 and at 1% O2.
Although the cell number is reduced in HPASMCs after incubation at 1% O2 48hrs, there is no
change in apoptosis compared to normoxic condition. Together these results suggest that hypoxia
in HPASMCs enhances smooth muscle cell survival, at levels above those that cause
cytotoxicity. In the pulmonary circulation, this protection from apoptotic cell death and enhanced
smooth muscle cell proliferation at moderate levels of hypoxia may be important in
neovasoformation during development and in ischemic tissues, where growth of new endothelial
networks by regulatory smooth muscle cells must occur under conditions of relative oxygen
deficiency. Depolarization of the mitochondrial membrane only at 0% O2 where apoptosis is
increased suggests the involvement of the mitochondria mediated intrinsic pathway of apoptosis.
Besides, the enhanced expression of p53 (at 0% O2) could also play a role in inducing PASMC
apoptosis.
When the ratio of energy supply to energy demand decreases, as during severe hypoxia,
homeostatic mechanisms attempt to match ATP production to ATP utilization [373, 374]. The

Chapter 3
133
hypothesis that changes in energy state signal pulmonary vasomotor responses to hypoxia has
been considered by many investigators, but the role of energy state in these responses remains
unclear
[375]. In fibroblasts and tumor cells, severe hypoxia causes ATP depletion thus
impairing DNA repair, but the role of intracellular ATP concentration ([ATP]i) in determining
the hypoxic response of HAPSMCs has not been studied earlier [376, 377]. [ATP]i in HPASMCs
is maintained at normoxic levels after incubation at 3 and 1% O2 and reduced after incubation at
0% O2. ATP depletion is concurrent with reduced cell number and enhanced apoptosis and
depolarization of the membrane potential suggesting that under hypoxia, HPASMCs continue to
proliferate and/or survive as long as the [ATP]i is maintained. However, if the level of hypoxia is
sufficient to cause depletion in intracellular ATP, the HPASMCs can no longer maintain the
mitochondrial membrane potential, and the cells apoptose.
As the duration of hypoxia is prolonged permanent structural remodeling occurs in the
vasculature. This reflects changes in structure and biochemical phenotype of all of the cells that
compose the pulmonary arteries. Universally observed is medial thickening and the appearance
of SMC- like (based on -actin staining) cells in previously nonmuscularized vessels. Our in vivo
data supports previous findings. In the current study, proliferation and apoptosis are both
enhanced in the main and branch pulmonary artery after 2 days and 7 days of hypoxia and
decreases after 14 days. This concurrent increase in cell proliferation as well as programmed cell
death confers plasticity to the vessel wall, whereby required structural change is enabled while
avoiding accumulation of mutations or abnormal vascular structure formation.

Chapter 4
134
Chapter 4
General Discussion and Conclusions

Chapter 4
135
VSMC proliferation has been recognized as
central to the pathology of several
cardiovascular diseases, such as atherosclerosis and hypertension. Hypoxia is an important
regulator of physiologic processes, including erythropoiesis, angiogenesis, and glycolysis. In the
vasculature, chronic hypoxia has been shown to cause proliferation of VSMCs, leading to vessel
wall
remodeling, a key pathophysiologic component of pulmonary hypertension. The
mechanisms by which hypoxia regulates VSMC growth include direct cell cycle-specific effects,
as well as indirect effects, via the regulation of VSMC mitogen production by neighboring
endothelial cells. Hypoxia triggers a cellular adaptive response that
is primarily mediated by the
transcription factor hypoxia-inducible factor 1 (HIF-1). Expression of HIF-1 target genes serves
to maintain cellular homeostasis. Transcriptional activation of
hypoxia-responsive genes
represents one major component of the vascular cell hypoxic response; however, the mechanisms
regulating VSMC proliferation and survival in the vessel wall – systemic or pulmonary, under
hypoxia, remain to be elucidated.
The normoxic pulmonary circulation is vasodilated and accommodates the entire cardiac
output at much lower pressures than the systemic circulation. During hypoxia, the pulmonary
arteries constrict, whereas systemic arteries, such as the aorta dilate. The mechanism of this
opposing control of tone between the two vascular beds is unknown. Although the response of
each bed to hypoxia is significantly modulated by the endothelium, the mechanism for the
opposing responses to hypoxia appear to lie within the VSMCs. Hypoxia increases intracellular
Ca2+
and contracts PASMCs; in contrast, SMCs from systemic arteries display decreased
intracellular Ca2+
and relax in response to hypoxia. The present series of investigations compares
the oxygen regulation of HASMC and HPASMC proliferation and survival.

Chapter 4
136
In both HASMCs and HPASMCs, incubation at various oxygen concentrations caused
directionally opposite responses – proliferation and growth arrest along with or without
apoptosis, depending upon the ability of these cells to maintain intracellular ATP concentration.
3% O2 incubation in both HPASMCs and HASMCs trigger a proliferative response without any
change in viability compared to normoxic cells. 0% O2 incubation diminishes cell numbers and
enhances apoptosis in both HPASMCs and HASMCs. However, the difference in the hypoxic
response of these two cell types is in the response at 1% O2 incubation: (i) In HASMCs cell
number is reduced after 16hrs and even more after 48hrs, while in HPASMCs, cell number
increases after 16hrs and decreases only after 48hrs; (ii) Incubation at 1% O2 in HASMCs, at
both 16 and 48hrs, reduces cell viability, increases apoptosis, depolarizes the mitochondrial
membrane potential and depletes intracellular ATP concentration. But in HPAMCs even though
the number of cells was reduced at 1% O2 for 48hrs, the viability along with mitochondrial
membrane potential and intracellular ATP concentration is maintained. Our study has shown that
hypoxia can increase or decrease cell number within the same cell type (systemic or pulmonary
smooth muscle cells), and the fundamental differences in response depend on the severity of
hypoxia that the cell is exposed to. The above responses also suggest that HPASMCs are better
adapted to reduced oxygen concentrations than their systemic counterpart.
In HASMCs an oxygen concentration of 1% O2 16hrs was sufficient to cause a delay in
cell cycle progression, with increased cells in G1/S phase. In HPASMCs, incubation at 1% O2 for
16 hrs caused an opposite effect – there is enhanced progression of cell cycle, with increased
cells in G2/M and S phases. But even in HPASMCs, incubation at 1% O2 for 48 hrs causes a
delay in cell cycle progression, with increased cells in G1/S phase. Together the data suggest that

Chapter 4
137
in both HASMCs and in HPAMCs, the bidirectional effects of hypoxia are integrated by events
occurring at the G1/S checkpoint, though the mechanism/s remain unclear.
In HASMCs at levels where hypoxia causes a decrease in cell number (1% and 0% O2)
our results have shown apoptosis to be a contributing factor towards the decrease. However, in
HPASMCs, at 1% O2 for 48hrs, no apoptosis is observed though there is a decrease in cell
number at this point. These results along with viability studies in HPASMCs, suggest that
oxygen concentrations which are capable of inducing apoptosis in systemic arterial smooth
muscle cells are not “sufficiently hypoxic” to induce cell death in pulmonary SMCs. In both the
pulmonary and the systemic circulation, protection from apoptotic cell death and enhanced
smooth muscle cell proliferation at moderate levels of hypoxia may be important in
neovasoformation during development and in ischemic tissues, where investiture of new
endothelial networks by regulatory smooth muscle cells must occur under conditions of relative
oxygen deficiency. Possibly since pulmonary circulation carries deoxygenated blood, the smooth
muscle cells of this region are genetically primed to survive under oxygen concentrations that are
otherwise toxic to the systemic smooth muscle cells. Reduced sensitivity of pulmonary smooth
muscle cells to hypoxia induced cell death provides the pulmonary vasculature an added
advantage. Dead cells are generally replaced by fibrous or connective tissue, which would have
otherwise impaired gas exchange and caused an early onset of pulmonary hypertension.
Enhanced apoptosis in both HASMCs and HPASMCs under severe hypoxia is also an adaptive
response that helps remove replication errors and prevents accumulation of hypoxia-induced
mutations.

Chapter 4
138
Conclusions
Systemic vascular smooth muscle cells experience a broad range of oxygen tensions
under physiological (90 mmHg in aortic lumen; 20 mmHg at 150 m depth; 24 mmHg in
terminal arterioles) and pathological (atherosclerosis, <7 mmHg) conditions. In earlier studies
hypoxia has had an inconsistent effect on smooth muscle cell proliferation and survival. This
lack of consistency has prevented the development of a unifying hypothesis regarding oxygen
regulation of these processes in diseases in which arterial remodeling plays a significant
pathophysiological role. Since cell replication is highly energy dependent it is intuitive, though
unproven, that hypoxia may have different effects depending on the degree to which cellular
energy status is compromised. On the other hand, many cell cycle associated genes are known to
be induced at levels of hypoxia at which inhibition of ATP synthesis would not be predicted and
a regulatory role beyond mere cytotoxicity merits consideration.
This study was carried out to determine if different proliferative and apoptotic responses
are elicited in human aortic smooth muscle cells (HASMCs) and human pulmonary artery
smooth muscle cells (HPASMCs) subjected to hypoxic incubation under conditions which do or
do not result in cellular ATP depletion, whether these effects are relevant to vascular remodeling
during hypoxia in vivo and to identify potential regulatory pathways using gene expression
profiling in cells exposed to conditions that elicit discordant responses.
The novel findings of our study in HASMCs, presented in Chapter 2, are:
1. Hypoxia may enhance or inhibit HASMC proliferation and differences in the cellular
response are elicited by varying degrees of hypoxic stress.

Chapter 4
139
2. The difference between O2 concentrations that enhance SMC proliferation and those that
impair cellular energy status and trigger cell destruction is small.
3. Pro- and antiproliferative and pro- and antiapoptotic gene expression are tightly
coordinated in HASMCs during hypoxic incubation to produce directionally opposed
responses, effected at the level of G1/S transition.
4. Our in vivo studies show increases in both SMC proliferation and death. This enhanced
cell turnover confers plasticity sufficient to enable the required structural change while
avoiding accumulation of mutations or abnormal vascular structure formation.
5. The net effect is an increased muscularity of the arterial wall, which is possibly a
compensatory adaptation that preserves the capacity to regulate the systemic circulation.
Hypoxic pulmonary arterial hypertension occurs in many cardiopulmonary diseases.
Increased smooth muscle cell proliferation in the pulmonary arterial wall is a hallmark of this
condition. The mechanism/s regulating these processes are yet unknown. The novel findings of
our study in HPASMCs, presented in Chapter 3, are:
1. HPASMCs proliferated at O2 concentrations which inhibited cell growth in HASMCs.
2. HPASMCs did not undergo apoptosis, maintained intracellular ATP concentration and
mitochondrial membrane potential at O2 concentrations which were cytotoxic to
HASMCs.
Together, our data suggest that the response to hypoxia, in either HASMCs or
HPASMCs, depends on whether the hypoxic stress is sufficient to impair cellular energy status.
In HPASMCs, ATP is preserved at a lower O2 concentration and this permits the cells to
maintain viability and proliferation at more severe levels of hypoxia than are tolerated by
HASMCs. The differences in the hypoxic response could be a result of adaptation to exposure to

Chapter 4
140
the deoxygenated blood that the pulmonary circulation carries or due to differences in the
embryonic origins of the cells that comprise the two circulations.
In vivo, hypoxia induces a state of enhanced cell turnover and, hence, plasticity. Vital
organ function is highly intolerant of oxygen deprivation. Accordingly, mechanisms linking
vascular cell turnover and the capacity for rapid structural change directly to oxygen
concentration are required to avoid delays inherent in second messenger signaling.
Our in vitro studies show that systemic and pulmonary artery smooth muscle cells
respond differently to hypoxia. HPASMCs are able to proliferate and remain viable at oxygen
concentrations that induce growth arrest and/or apoptosis and in HASMCs. However, under
reduced oxygen concentrations in both the cell types, systemic or pulmonary, cell viability is
maintained until intracellular ATP levels are depleted. Our data do not address the
mechanism(s) by which information about the site of origin of SMCs from systemic and
pulmonary circulations is preserved from generation to generation (passage to passage) in in
vitro cultures. A possible explanation for the different responses to hypoxia of the SMC when
coming from two different sources (systemic vs. pulmonary) could be attributed to their diverse
embryological origin. Arteries cranial to the heart are mostly products of the paired aortic arches,
which course axially within the branchial arches, thus interconnecting the ventral aorta with
paired dorsal aortas. The fourth pair of embryonic aortic arches becomes the aortic arch in the
adult while the fifth pair forms the pulmonary arteries and ductus arteriosus. The dorsal aortas
fuse into the single descending aorta [378].
During development of multicellular eukaryotic organisms, differences in genetic
programming cause the cells to differentiate into different types, which perform different
functions, and respond differently to the environmental stimuli. Thus, genes are silenced or

Chapter 4
141
activated in an epigenetically heritable fashion, giving cells a "memory" which determines their
phenotype over subsequent cell divisions. This implies that in order to grow and maintain a
specific, lineage-restricted state, such gene expression configurations need to be transmitted to
daughter cells, without mutations of the DNA. Two types of epigenetic modifications can
regulate chromatin conformation, thereby also regulating the transcriptional activity or silencing
of specific genomic regions. These include (1) DNA methylation at cytosine residues of CpG
dinucleotides in gene promoters, transposons, and imprinting control regions. In most cases,
DNA methylation is associated with gene repression; and (2) histone modifications in the
chromatin organization, such as methylation and acetylation, affecting the N-terminal tail of
histones [379].
Studies to define which mechanisms are active in distinguishing the responses of
PASMCs from SMCs derived from the systemic circulation are now indicated. Insight into the
molecular mechanisms underlying these responses would aid in the development of
pharmacological tools to modulate vascular remodeling in disease states.

Chapter 5
142
Chapter 5
Future directions

Chapter 5
143
Our studies in HASMCs (chapter 2) and HPASMCs (chapter 3) have shown that (i)
incubation of these cells at varying oxygen concentrations cause divergent responses – cell
proliferation and enhanced cell survival on one hand and growth arrest and/or apoptosis at
further reduced oxygen concentrations; (ii) cell viability under hypoxia remains unaffected as
long as the cells are able to maintain their intracellular ATP concentration. Oxygen
concentrations, at which intracellular ATP levels are diminished, cause the cells to undergo cell
cycle growth arrest (at the G1/S interphase) and cell apoptosis; (iii) HPASMCs proliferated at
oxygen concentrations which inhibited cell growth in HASMCs and (iv) HPASMCs did not
undergo apoptosis and maintained their intracellular ATP levels and mitochondrial membrane
potential at oxygen concentrations that are sufficient to deplete ATP and induce apoptosis in
HASMCs. Based on these, it could be proposed that in HPASMCs, ATP is preserved at a lower
O2 concentration to enable the cells to maintain their viability, compared to HASMCs. In other
words this difference/s in energetics in HASMCs and HPASMCs may play a key role in
determining oxygen regulation of their proliferation and survival.
The pulmonary circulation is adapted to function at a lower oxygen concentration
compared to the systemic circulation. There is greater heterogeneity in the phenotype of
pulmonary vascular SMCs compared to the systemic SMCs [325]. This varies with the size and
location of the pulmonary artery (Table 5.1). K+ channels are differentially distributed and there
are cell-specific differences in the endothelin-1 (ET-1) system [380]. The vasoconstrictor
response to ET-1 is mediated by ETA receptors in large pulmonary arteries but by ETB-like
receptors in smaller muscular pulmonary arteries [381].

Chapter 5
144
Table 5.1 Phenotypic heterogeneity in pulmonary vascular smooth muscle cells.
Feature Main Pulmonary artery smooth muscle cells Distal Pulmonary artery
smooth muscle cells
Location
Subendothelial Middle
Media
Outer
media
3000μ 1500μ 100-
150μ
L1 L2 L3 L4 L3 L4
Morphology Round, small,
irregularly
shaped ,
interspersed in
fragmented
elastin
Elongated,
spindle shaped,
oriented
circumferent-
ially between
well developed
and continuous
elastic lamellae
Large, spindle
shaped cells,
arranged in
compact cell
clusters, oriented
longitudinally
within vessel
wall devoid of
elastic lamellae
Small, spindle
shaped cells,
oriented
circumferent-
ially in
intersitial
areas between
L3 large cell
clusters
Same as Main
Pulmonary
Artery
-SMA
Calponin
- + + - + - + +
SM-MHC - + + - + - + +
Metavinculin
Desmin
- + + - + - + +
Caldesmon - + + - + - ND ND
Hypoxia ++ - - ++ - - - -
SMA: Smooth muscle actin, MHC: Myosin heavy chain,
+: Positive, -: Negative, ND: Not detected, ++: Increase in proliferation.

Chapter 5
145
Significant mitochondrial diversity exists between pulmonary and systemic arteries, with
direct imaging of rat vascular SMCs showing that PASMC mitochondria are more depolarized
than ASMC mitochondria. Compared to systemic arteries, pulmonary artery mitochondria have
higher rates of superoxide anion and H2O2 production, lower expression of proximal electron
transport chain components and higher expression of mitochondrial superoxide dismutase [326].
A deficiency in oxidative metabolism under hypoxic conditions will cause a cell to resort to
glycolytic ATP production. Increased activity of rate-limiting glycolytic enzymes has been found
in fibroblast, endothelial and kidney cell lines cultured under hypoxia.
Considering these, a relevant question to address in future would be whether metabolic
differences between systemic and pulmonary artery smooth muscle cells determine the
differences in oxygen regulation of their proliferation and survival. It is possible that HPASMCs
possess a greater aerobic capacity and/or an enhanced anaerobic capacity under hypoxia that
allows these cells to maintain the intracellular ATP concentration and survive at levels of
hypoxia that are cytotoxic to HASMCs.
Preliminary studies were conducted to assess both the aerobic and anaerobic capacities of
HASMCs and HPASMCs (Supplement). Real-time PCR was performed on DNA extracted from
normoxic and hypoxic HASMCs and HPASMCs for three nuclear-specific genes in the promoter
region, eNOS (endothelial nitric oxide synthase) promoter, iNOS (inducible nitric oxide
synthase) promoter, VCAM1 (vascular cell adhesion molecule 1) promoter, and three
mitochondrial-specific genes, mtTRNL1 (mitochondrially encoded tRNA leucine 1), CO2
(cytochrome c oxidase II), and Dloop (non-coding region in mtDNA controlling DNA
replication). Mitochondrial copy number was assessed as an index of oxidative phosphorylative
capacity in these cells (Supplementary Figure 1). To measure anaerobic glycolysis, protein

Chapter 5
146
levels of two key glycolytic enzymes namely Enolase and Phosphoglycerate kinase (PGK)
(Supplementary Figure 2 A-D) and lactate concentration (Supplementary Figure 2 E and F) have
been compared in normoxic and hypoxic HPASMCs and HASMCs.
The effect of hypoxic incubation on mitochondrial DNA levels is illustrated in
Supplementary Figure 1. In both HPASMCs and HASMCs, mitochondrial DNA levels decrease
after hypoxic incubation. The decline correlates with the severity of the hypoxic exposure and is
similar in the two cell types. Copy number values generated from standard curves (using
plasmid DNA and genomic DNA) were also compared and similar results were obtained.
Each human cell contains several hundreds to thousands of mitochondria
and each
mitochondrion has 2 to 10 copies of mitochondrial DNA (mtDNA). The copy number of mtDNA
may reflect the abundance of mitochondria in a human cell [382]. Mitochondrial biogenesis is a
highly regulated process and occurs on a regular basis in healthy cells, where it is controlled
by
the nuclear genome. Alteration of mitochondrial biogenesis and increased expression of nuclear
genes encoding mitochondrial proteins are responses triggered by mitochondrial dysfunction
or
high energy demands found in pathophysiological conditions [383, 384]. The decrease in
mtDNA copy number has been observed in lung cancer, hepatocellular carcinoma and gastric
cancers [385, 386]. Rapidly increased neuronal mitochondrial biogenesis has been observed after
hypoxic-ischemic brain injury [387]. Mitochondrial biogenesis has not been studied earlier in
HASMCs or HPAMSCs after incubation under various oxygen concentrations. Our results show
that in both HASMCs and HPASMCs, there is a decrease in mitochondria. Since oxygen serves
as a substrate in aerobic ATP production, it is quite obvious that under limited oxygen supply
both the cell types would choose to reduce their aerobic capacity, and possibly switch their
energy supply from aerobic metabolism to anaerobic glycolysis. The characteristics, including

Chapter 5
147
intron-less, without binding to histones, and inefficient mtDNA proof-reading and DNA repair
system, render mtDNA more susceptible to oxidative damage than nuclear DNA [388]. Reduced
mitochondria number could also be an adaptive response in both the cell types to prevent
accumulation of mutations.
ATP is the immediate source of metabolic energy whose hydrolysis causes protein
synthesis, muscle contraction and ion transport across cell membrane. In the outer mitochondrial
membrane, ATP phosphorylates creatine (Cr) by the creatine kinase (CPK) reaction:
[ATP] + [Cr] [PCr] + [ADP] + [H+]
The phosphocreatine (PCr) shuttle carries the high energy bonds from the mitochondria to the
sites of utilization where the CPK reaction is reversed (Lohman reaction) forming ATP and Cr
[389]. Future studies should assess the ratios of PCr ([PCr]) or inorganic phosphate ([Pi])
concentration to [ATP] or creatine ([Cr]) concentration
([PCr]/[ATP], [Pi]/[ATP], and
[PCr]/[Cr]), phosphorylation potential
( = [ATP]/[ADP][Pi], where [ADP] is ADP
concentration). It is possible that HPASMCs have a greater potential to maintain its ATP through
the Lohman reaction as above.
Hypoxia is known to up regulate expression of several glycolytic enzymes to enhance
anaerobic ATP production. Protein levels of glycolytic enzymes, PGK1 and enolase are
increased after hypoxic incubation, in both HPASMCs (Suppl Fig 2 A and C) and HASMCs
(Suppl Fig 2 B and D), suggesting enhanced glycolytic ATP production under
hypoxic
conditions in both cell types. Glycolysis in the cytoplasm produces the intermediate metabolite
pyruvate. Under aerobic conditions, pyruvate is converted to acetyl CoA to enter the Kreb’s
cycle. Under anaerobic conditions, pyruvate is converted by lactate dehydrogenase to lactic acid.
In aqueous solutions, lactic acid dissociates to lactate and H+. These H
+ can be used in the

Chapter 5
148
production of ATP by oxidative phosphorylation. Impairment of oxidative pathways, however,
during lactate production results in a net gain of H+ and acidosis occurs [390].
The lactate levels reflect the balance between lactate production and clearance. The
normal plasma lactate concentration is 0.3–1.3 mmol litre-1
, while concentrations >5 mmol litre-1
are considered high enough to cause acidosis. In vascular smooth muscle, changes in intracellular
pH (pHi) can alter membrane potential, calcium homeostasis, and myosin light chain kinase
activity [391-393]. Altered pHi has been shown to change vasomotor tone in both systemic and
pulmonary arteries and responses to hypoxia in isolated lungs [394-400]. Lactate concentrations
are increased under hypoxia in both HASMCs and HPASMCs. Incubation at 1% O2 causes
lactate to accumulate more (>5 mmol litre-1
) in HASMCs than HPASMCs. A possible
explanation could be that HPASMCs possess a better ability to prevent lactate accumulation and
thereby acidosis under hypoxic conditions. Likely, this excess lactate accumulation, beginning at
higher oxygen concentrations in HASMCs (1% O2) compared to that in HPASMCs (0% O2) that
make the aortic cells more vulnerable to acidosis induced cell apoptosis than the pulmonary
cells. Future studies will include determining the lactate/pyruvate ratio and rate of extracellular
acidification in both HASMCs and HPASMCs.
Factors other than enhanced lactic acid production might contribute to the fall of arterial
pHi during hypoxia. Decreased mitochondrial electron transport and proton
pumping could lead
directly to cytoplasmic acidification [401]. Na
+-H
+ exchange, an important component of pHi
regulation in vascular smooth muscle, depends on activity of the Na
+-K
+ pump, which requires
energy for operation [391, 402, 403]. Thus under hypoxia when ATP concentrations are
depleted, Na+-K
+-ATPase activity could be limited, which would reduce the transmembrane
sodium gradient, and decrease acid extrusion via Na
+-H
+ exchange. In HPASMCs, [ATP]i is

Chapter 5
149
maintained at oxygen concentrations that are sufficient to deplete ATP levels in HASMCs.
Hence in HPASMCs, Na+-H
+ exchange is maintained under hypoxia and onset of acidosis
delayed compared to HASMCs.
Alternatively, HPASMCs could genetically possess a greater ability to down regulate
ATP utilization in the face of hypoxia or a cytochrome oxidase of greater
oxygen affinity [404].
The two cell types might also differ in their glucose uptake. Role of glucose transporters and
metabolic sensitivity to various modulators of glycolytic enzymes need to be assessed. Further
investigation will determine which of these (or other) explanations is
correct. Insight into these
mechanisms could lead to the development of pharmacological tools for use in the treatment of
diseases associated with hypoxia.

Supplement
150
Supplement
Materials and Methods
Antibodies and Reagents
Phosphoglycerate kinase (PGK) and Enolase antibodies were purchased from Santa Cruz
Biotechnology, Inc (Santa Cruz, CA). Lactate assay kit was obtained from BioVision (Mountain
View, CA). All other reagents were from Sigma (St. Louis, MO).
Mitochondrial DNA content: Mitochondrial DNA (normalized for nuclear DNA) was quantified
as a marker of mitochondria number. HASMCs and HPASMCs were exposed to 48 hours of
normoxic or hypoxic (3%, 1%, and 0% O2) incubation. Cells were harvested with 1ml of lysis
buffer per plate (1M Tris (pH 8.0), 0.5M EDTA (pH 8.0), 10mg/ml RNase A, 10% SDS).
Samples were incubated at 37°C for 2 hours, proteinase K (20mg/ml) was added and the lysate
incubated at 50°C overnight. DNA was extracted using phenol/chloroform extraction and
ethanol-precipitated overnight. DNA was pelleted instead of spooled to ensure a maximum yield
including both nuclear and mitochondrial DNA, and resuspended in 30-80μl TE buffer.
Real-time Polymerase Chain Reaction (PCR): Primer pairs specific for three Human
mitochondrial genes and three nuclear chromosome genes were chosen for PCR, and cloned into
the pCR®
II plasmid using the TA Cloning®
Kit Dual Promoter (Invitrogen; Carlsbad, CA). The
three mitochondrial genes chosen were: tRNA leucine 1 (mtTRNL1: sense mt3212F 5’-
CACCCAAGAACAGGGTTTGT-3’; antisense mt3319R 5’-TGGCCATGGGTATGTTGTTAA-
3’); cytochrome c oxidase II (CO2: sense CO2F 5’-CCCCACATTAGGCTTAAAAACAGAT-
3’; antisense CO2R 5’-TATACCCCCGGTCGTGTAGCGGT-3’); and non-coding region in
tDNA controlling DNA replication (Dloop: sense DloopF 5’-

Supplement
151
TATCTTTTGGCGGTATGCACTTTTAACAGT-3’; antisense DloopR 5’-
TGATGAGATTAGTAGTATGGGAGTGG-3’). Primers for the three nuclear genes were
chosen to amplify genomic sequences in their promoter regions The three nuclear genes chosen
were inducible nitric oxide synthase (iNOS: sense hiNOStaqman 5’-
TGAAGAGGCACCACACAGAGT-3; antisense hiNOStaqman3’-
TGGTTTCCAAAGGGAGTGTCC-5’), endothelial nitric oxide synthase (eNOS: sense
heNOStaqman 5’- GTGGAGCTGAGGCTTTAGAGC-3’; antisense heNOStaqman 3’-
TTTCCTTAGGAAGAGGGAGGG-5’) and vascular cell adhesion molecule 1 (VCAM1: sense
5’- ACTTGGCTGGGTGTCTGTTA -3’; antisense VCAM 3’-
GCGGAGTGAAATAGAAAGTC -5’). The cloned plasmid sequences were verified by DNA
sequencing (The Centre for Applied Genomics; Toronto, ON), amplified by maxiprep and used
as plasmid standards for real-time PCR.
DNA concentrations were quantified and diluted to a concentration of approximately 500
copies of nuclear DNA per μl. Real-time PCR was performed on the DNA samples in triplicate.
Real-time PCR settings were 95°C for 10mins (Step I); 95°C for 15s, 60°C for 1 min (Step II x
40 cycles); 95°C for 15s, 60°C for 15s, 95°C for 15s (Step III). SYBR®
Green I dye (Applied
Biosystems; Foster City, CA) was used to detect the PCR products, and the specificities of the
amplicons were verified by comparing the Tm for each amplicon, which were consistent across
the different experiments. The number of copies of target sequence was determined by
comparison with standard curves generated by both plasmid DNA and genomic DNA serial
dilutions. Copy number values from mitochondrial genes were divided by that of nuclear genes
to normalize the amount of mtDNA to the total number of cells, for each cell type under each
condition. The amount of mtDNA for each hypoxic condition was divided by the amount of

Supplement
152
mtDNA in the normoxic control cells to determine the average fold change of mtDNA levels.
Lactate assay: Lactate is oxidized by lactate oxidase to generate a product, which interacts with
the lactate probe (provided by manufacturer) to produce fluorescence (at Exitation/Emission =
535/590 nm). Samples were prepared in50 μl/well with Lactate Assay Buffer in a 96-well plate.
A standard reference curve was used, corrected for background fluorescence for calculating
lactate concentrations, according to the instructions provided by the manufacturer.
Western blot analysis: Western blot analysis was used to quantify levels of glycolytic enzymes
Phosphoglycerate kinase and Enolase in cytoplasmic extracts from HPASMCs and HASMCs
exposed to normoxia or hypoxia (3%, 1% or 0% O2) for 16 or 48 h. Cells were lysed in buffer A
[10 mM HEPES (pH 7.8), 10 mM KCl, 0.1 mM EDTA, 1mM dithiothreitol (DTT), and 0.1%
Nonidet P-40 (NP-40)] with protease inhibitors (5 g/ml aprotinin, 5 g/ml pepstatin, 5 g/ml
leupeptin, 0.5 mM Pefabloc, and 1 mM phenylmethylsulfonyl fluoride) and phosphatase
inhibitors (10 mM sodium fluoride, 1 mM sodium orthovanadate, and 20 mM glycerophosphate).
Nuclear proteins were then extracted with buffer B [50 mM HEPES (pH 7.8), 420 mM KCl, 0.1
mM EDTA, 1 mM DTT, 5 mM MgCl2, and 20% glycerol], containing both protease and
phosphatase inhibitors. Equal amounts of protein extracted from HPASMCs and HASMCs,
incubated under normoxic and hypoxic (3%, 1% and 0% O2) conditions for 16 and 48 h, were
loaded on 4–12% Tris-glycine gels, separated by electrophoresis and transferred to
nitrocellulose. Membranes were blocked with 5% milk overnight and probed with anti-
Phosphoglycerate kinase (1:1000) and anti-Enolase (1:500). In all cases, protein concentration
was determined by the Bradford assay, and appropriate volumes of extraction buffer to produce
constant protein loading in each lane were mixed with SDS loading buffer. Equality of protein
loading and transfer efficiency were corroborated by full-lane densitometry of the Ponceau red-

Supplement
153
stained membranes. Immunoblots were probed with horseradish peroxidase-donkey anti-rabbit
IgG (1:1,000 in blocking buffer) and visualized by enhanced chemiluminescence (ECL Plus kit,
Amersham Biosciences). Band intensity was quantified by densitometry (Bio-Rad Laboratories,
Mississauga, ON, Canada).

Supplement
154
Figure S1 Average fold change of mtDNA levels in two cell types (HASMC and
HPASMC) under different hypoxic conditions (3%, 1%, and 0% O2). Primer pairs specific
for three human mitochondrial genes (tRNA leucine 1, cytochrome oxidase II, Dloop) and
three nuclear chromosome genes (iNOS, eNOS, VCAM1) were chosen for PCR, and cloned
into the pCR®
II plasmid. Copy number determined using plasmid DNA as standards.
Results were averaged from 3 independent experiments.
O2 concentration O2 concentration
HPASMC
HASMC

Supplement
155
HPASMC A.
B. HASMC
Figure S2 Cytoplasmic levels of Phosphoglycerate kinase protein in HPASMCs (A)
and HASMCs (B) after incubation under normoxic and hypoxic (3, 1 or 0% O2) conditions.
n= 6. *P <0.05 vs. corresponding normoxic control values.

Supplement
156
C. HPASMC
D. HASMC
Figure S2 Cytoplasmic levels of Enolase protein in HPASMCs (C) and HASMCs (D)
after incubation under normoxic and hypoxic (3, 1 or 0% O2) conditions. n= 6. *P <0.05 vs.
corresponding normoxic control values.

Supplement
157
Figure S2 Lactate concentration (mmol / L) after incubation of HPASMCs (E) and
HASMCs (F) under normoxic and hypoxic (3, 1 or 0% O2) conditions. n= 6. *P <0.05 vs.
corresponding normoxic control values.
E. HPASMCs
F. HASMCs
Lac
tate
co
nce
ntr
atio
n
(mm
ol
/L)
Lac
tate
co
nce
ntr
atio
n
(mm
ol
/L)

References
158
REFERENCES
1. Bell, E.L., B.M. Emerling, and N.S. Chandel, Mitochondrial regulation of oxygen
sensing. Mitochondrion, 2005. 5(5): p. 322-32.
2. Shibahara, S., et al., Hypoxia and heme oxygenases: oxygen sensing and regulation of
expression. Antioxid Redox Signal, 2007. 9(12): p. 2209-25.
3. Kumar, P. and N. Prabhakar, Sensing hypoxia: carotid body mechanisms and reflexes in
health and disease. Respir Physiol Neurobiol, 2007. 157(1): p. 1-3.
4. Hockel, M. and P. Vaupel, Tumor hypoxia: definitions and current clinical, biologic, and
molecular aspects. J Natl Cancer Inst, 2001. 93(4): p. 266-76.
5. Bjornheden, T., M. Evaldsson, and O. Wiklund, A method for the assessment of hypoxia
in the arterial wall, with potential application in vivo. Arterioscler Thromb Vasc Biol,
1996. 16(1): p. 178-85.
6. Santilli, S.M., et al., Transarterial wall oxygen gradients at the dog carotid bifurcation.
Am J Physiol, 1995. 268(1 Pt 2): p. H155-61.
7. Bjornheden, T., et al., Evidence of hypoxic areas within the arterial wall in vivo.
Arterioscler Thromb Vasc Biol, 1999. 19(4): p. 870-6.
8. Crawford, D.W. and D.H. Blankenhorn, Arterial wall oxygenation, oxyradicals, and
atherosclerosis. Atherosclerosis, 1991. 89(2-3): p. 97-108.
9. Santilli, S.M., V.D. Fiegel, and D.R. Knighton, Alloxan diabetes alters the rabbit
transarterial wall oxygen gradient. J Vasc Surg, 1993. 18(2): p. 227-33.
10. Rose, F., et al., Hypoxic pulmonary artery fibroblasts trigger proliferation of vascular
smooth muscle cells: role of hypoxia-inducible transcription factors. FASEB J, 2002.
16(12): p. 1660-1.
11. Li, B., et al., VEGF and PlGF promote adult vasculogenesis by enhancing EPC
recruitment and vessel formation at the site of tumor neovascularization. Faseb J, 2006.
20(9): p. 1495-7.
12. Barer, G., et al., Endothelial control of the pulmonary circulation in normal and
chronically hypoxic rats. J Physiol, 1993. 463: p. 1-16.
13. MacLean, M.R., et al., 5-Hydroxytryptamine receptors mediating vasoconstriction in
pulmonary arteries from control and pulmonary hypertensive rats. Br J Pharmacol, 1996.
119(5): p. 917-30.
14. Weir, E.K. and S.L. Archer, The mechanism of acute hypoxic pulmonary
vasoconstriction: the tale of two channels. FASEB J, 1995. 9(2): p. 183-9.
15. Sommer, N., et al., Regulation of hypoxic pulmonary vasoconstriction: basic
mechanisms. Eur Respir J, 2008. 32(6): p. 1639-51.
16. Smirnov, S.V., et al., Chronic hypoxia is associated with reduced delayed rectifier K+
current in rat pulmonary artery muscle cells. Am J Physiol, 1994. 266(1 Pt 2): p. H365-
70.
17. Owens, G.K., Regulation of differentiation of vascular smooth muscle cells. Physiol Rev,
1995. 75(3): p. 487-517.
18. Kallmeier, R.C., C. Somasundaram, and P. Babij, A novel smooth muscle-specific
enhancer regulates transcription of the smooth muscle myosin heavy chain gene in
vascular smooth muscle cells. J Biol Chem, 1995. 270(52): p. 30949-57.

References
159
19. Kirby, M.L., T.F. Gale, and D.E. Stewart, Neural crest cells contribute to normal
aorticopulmonary septation. Science, 1983. 220(4601): p. 1059-61.
20. Millino, C., et al., Cardiac and smooth muscle cell contribution to the formation of the
murine pulmonary veins. Dev Dyn, 2000. 218(3): p. 414-25.
21. Mikawa, T. and R.G. Gourdie, Pericardial mesoderm generates a population of coronary
smooth muscle cells migrating into the heart along with ingrowth of the epicardial organ.
Dev Biol, 1996. 174(2): p. 221-32.
22. Jiang, X., et al., Fate of the mammalian cardiac neural crest. Development, 2000.
127(8): p. 1607-16.
23. Tevosian, S.G., et al., FOG-2, a cofactor for GATA transcription factors, is essential for
heart morphogenesis and development of coronary vessels from epicardium. Cell, 2000.
101(7): p. 729-39.
24. Yamashita, J., et al., Flk1-positive cells derived from embryonic stem cells serve as
vascular progenitors. Nature, 2000. 408(6808): p. 92-6.
25. Frid, M.G., V.A. Kale, and K.R. Stenmark, Mature vascular endothelium can give rise to
smooth muscle cells via endothelial-mesenchymal transdifferentiation: in vitro analysis.
Circ Res, 2002. 90(11): p. 1189-96.
26. Campbell, J.H., et al., Haemopoietic origin of myofibroblasts formed in the peritoneal
cavity in response to a foreign body. J Vasc Res, 2000. 37(5): p. 364-71.
27. Simper, D., et al., Smooth muscle progenitor cells in human blood. Circulation, 2002.
106(10): p. 1199-204.
28. Carmeliet, P., Mechanisms of angiogenesis and arteriogenesis. Nat Med, 2000. 6(4): p.
389-95.
29. Clowes, A.W., M.A. Reidy, and M.M. Clowes, Kinetics of cellular proliferation after
arterial injury. I. Smooth muscle growth in the absence of endothelium. Lab Invest, 1983.
49(3): p. 327-33.
30. Rudic, R.D., et al., Direct evidence for the importance of endothelium-derived nitric
oxide in vascular remodeling. J Clin Invest, 1998. 101(4): p. 731-6.
31. Mulvany, M.J., et al., Vascular remodeling. Hypertension, 1996. 28(3): p. 505-6.
32. Langille, B.L. and F. O'Donnell, Reductions in arterial diameter produced by chronic
decreases in blood flow are endothelium-dependent. Science, 1986. 231(4736): p. 405-7.
33. Owens, G.K., M.S. Kumar, and B.R. Wamhoff, Molecular regulation of vascular smooth
muscle cell differentiation in development and disease. Physiol Rev, 2004. 84(3): p. 767-
801.
34. Turley, E.A., Extracellular matrix remodeling: multiple paradigms in vascular disease.
Circ Res, 2001. 88(1): p. 2-4.
35. Galis, Z.S., et al., Increased expression of matrix metalloproteinases and matrix
degrading activity in vulnerable regions of human atherosclerotic plaques. J Clin Invest,
1994. 94(6): p. 2493-503.
36. Rong, J.X., et al., Lysophosphatidylcholine stimulates monocyte chemoattractant protein-
1 gene expression in rat aortic smooth muscle cells. Arterioscler Thromb Vasc Biol,
2002. 22(10): p. 1617-23.
37. Roque, M., et al., CCR2 deficiency decreases intimal hyperplasia after arterial injury.
Arterioscler Thromb Vasc Biol, 2002. 22(4): p. 554-9.

References
160
38. Kocher, O., et al., Phenotypic features of smooth muscle cells during the evolution of
experimental carotid artery intimal thickening. Biochemical and morphologic studies.
Lab Invest, 1991. 65(4): p. 459-70.
39. Ward, J.P., Oxygen sensors in context. Biochim Biophys Acta, 2008. 1777(1): p. 1-14.
40. Tsai, A.G., P.C. Johnson, and M. Intaglietta, Oxygen gradients in the microcirculation.
Physiol Rev, 2003. 83(3): p. 933-63.
41. Pittman, R.N., Oxygen transport and exchange in the microcirculation. Microcirculation,
2005. 12(1): p. 59-70.
42. Cain, S.M., Effects of time and vasoconstrictor tone on O2 extraction during hypoxic
hypoxia. J Appl Physiol, 1978. 45(2): p. 219-24.
43. Schlichtig, R., D.J. Kramer, and M.R. Pinsky, Flow redistribution during progressive
hemorrhage is a determinant of critical O2 delivery. J Appl Physiol, 1991. 70(1): p. 169-
78.
44. Vallet, B., Vascular reactivity and tissue oxygenation. Intensive Care Med, 1998. 24(1):
p. 3-11.
45. Sair, M., et al., Tissue oxygenation and perfusion in patients with systemic sepsis. Crit
Care Med, 2001. 29(7): p. 1343-9.
46. Tansey, E.A., Teaching the physiology of adaptation to hypoxic stress with the aid of a
classic paper on high altitude by Houston and Riley. Adv Physiol Educ, 2008. 32(1): p.
11-7.
47. Williams, S.E., et al., Hemoxygenase-2 is an oxygen sensor for a calcium-sensitive
potassium channel. Science, 2004. 306(5704): p. 2093-7.
48. Taylor, C.T., Mitochondria and cellular oxygen sensing in the HIF pathway. Biochem J,
2008. 409(1): p. 19-26.
49. Boutilier, R.G., Mechanisms of cell survival in hypoxia and hypothermia. J Exp Biol,
2001. 204(Pt 18): p. 3171-81.
50. Rolfe, D.F. and G.C. Brown, Cellular energy utilization and molecular origin of standard
metabolic rate in mammals. Physiol Rev, 1997. 77(3): p. 731-58.
51. Arsham, A.M., J.J. Howell, and M.C. Simon, A novel hypoxia-inducible factor-
independent hypoxic response regulating mammalian target of rapamycin and its targets.
J Biol Chem, 2003. 278(32): p. 29655-60.
52. Semenza, G.L., Oxygen-regulated transcription factors and their role in pulmonary
disease. Respir Res, 2000. 1(3): p. 159-62.
53. Semenza, G.L. and G.L. Wang, A nuclear factor induced by hypoxia via de novo protein
synthesis binds to the human erythropoietin gene enhancer at a site required for
transcriptional activation. Mol Cell Biol, 1992. 12(12): p. 5447-54.
54. Semenza, G.L., Targeting HIF-1 for cancer therapy. Nat Rev Cancer, 2003. 3(10): p.
721-32.
55. Jiang, B.H., et al., Dimerization, DNA binding, and transactivation properties of hypoxia-
inducible factor 1. J Biol Chem, 1996. 271(30): p. 17771-8.
56. Bardos, J.I. and M. Ashcroft, Negative and positive regulation of HIF-1: a complex
network. Biochim Biophys Acta, 2005. 1755(2): p. 107-20.
57. Ruas, J.L. and L. Poellinger, Hypoxia-dependent activation of HIF into a transcriptional
regulator. Semin Cell Dev Biol, 2005. 16(4-5): p. 514-22.
References
161
58. Jiang, B.H., et al., Transactivation and inhibitory domains of hypoxia-inducible factor
1alpha. Modulation of transcriptional activity by oxygen tension. J Biol Chem, 1997.
272(31): p. 19253-60.
59. Huang, L.E., et al., Regulation of hypoxia-inducible factor 1alpha is mediated by an O2-
dependent degradation domain via the ubiquitin-proteasome pathway. Proc Natl Acad
Sci U S A, 1998. 95(14): p. 7987-92.
60. Arany, Z., et al., An essential role for p300/CBP in the cellular response to hypoxia. Proc
Natl Acad Sci U S A, 1996. 93(23): p. 12969-73.
61. Ebert, B.L. and H.F. Bunn, Regulation of transcription by hypoxia requires a
multiprotein complex that includes hypoxia-inducible factor 1, an adjacent transcription
factor, and p300/CREB binding protein. Mol Cell Biol, 1998. 18(7): p. 4089-96.
62. Wenger, R.H., D.P. Stiehl, and G. Camenisch, Integration of oxygen signaling at the
consensus HRE. Sci STKE, 2005. 2005(306): p. re12.
63. Maynard, M.A., et al., Human HIF-3alpha4 is a dominant-negative regulator of HIF-1
and is down-regulated in renal cell carcinoma. FASEB J, 2005. 19(11): p. 1396-406.
64. Maynard, M.A., et al., Multiple splice variants of the human HIF-3 alpha locus are
targets of the von Hippel-Lindau E3 ubiquitin ligase complex. J Biol Chem, 2003.
278(13): p. 11032-40.
65. Compernolle, V., et al., Loss of HIF-2alpha and inhibition of VEGF impair fetal lung
maturation, whereas treatment with VEGF prevents fatal respiratory distress in
premature mice. Nat Med, 2002. 8(7): p. 702-10.
66. Kotch, L.E., et al., Defective vascularization of HIF-1alpha-null embryos is not
associated with VEGF deficiency but with mesenchymal cell death. Dev Biol, 1999.
209(2): p. 254-67.
67. Hu, C.J., et al., Differential regulation of the transcriptional activities of hypoxia-
inducible factor 1 alpha (HIF-1alpha) and HIF-2alpha in stem cells. Mol Cell Biol,
2006. 26(9): p. 3514-26.
68. Tian, H., et al., The hypoxia-responsive transcription factor EPAS1 is essential for
catecholamine homeostasis and protection against heart failure during embryonic
development. Genes Dev, 1998. 12(21): p. 3320-4.
69. Gu, Y.Z., et al., Molecular characterization and chromosomal localization of a third
alpha-class hypoxia inducible factor subunit, HIF3alpha. Gene Expr, 1998. 7(3): p. 205-
13.
70. Makino, Y., et al., Inhibitory PAS domain protein is a negative regulator of hypoxia-
inducible gene expression. Nature, 2001. 414(6863): p. 550-4.
71. Stroka, D.M., et al., HIF-1 is expressed in normoxic tissue and displays an organ-specific
regulation under systemic hypoxia. FASEB J, 2001. 15(13): p. 2445-53.
72. Dery, M.A., M.D. Michaud, and D.E. Richard, Hypoxia-inducible factor 1: regulation by
hypoxic and non-hypoxic activators. Int J Biochem Cell Biol, 2005. 37(3): p. 535-40.
73. Fandrey, J., T.A. Gorr, and M. Gassmann, Regulating cellular oxygen sensing by
hydroxylation. Cardiovasc Res, 2006. 71(4): p. 642-51.
74. Jaakkola, P., et al., Targeting of HIF-alpha to the von Hippel-Lindau ubiquitylation
complex by O2-regulated prolyl hydroxylation. Science, 2001. 292(5516): p. 468-72.
75. Ohh, M., et al., Ubiquitination of hypoxia-inducible factor requires direct binding to the
beta-domain of the von Hippel-Lindau protein. Nat Cell Biol, 2000. 2(7): p. 423-7.

References
162
76. Lando, D., et al., FIH-1 is an asparaginyl hydroxylase enzyme that regulates the
transcriptional activity of hypoxia-inducible factor. Genes Dev, 2002. 16(12): p. 1466-
71.
77. Mahon, P.C., K. Hirota, and G.L. Semenza, FIH-1: a novel protein that interacts with
HIF-1alpha and VHL to mediate repression of HIF-1 transcriptional activity. Genes Dev,
2001. 15(20): p. 2675-86.
78. Hewitson, K.S., et al., The role of iron and 2-oxoglutarate oxygenases in signalling.
Biochem Soc Trans, 2003. 31(Pt 3): p. 510-5.
79. Hewitson, K.S., et al., Hypoxia-inducible factor (HIF) asparagine hydroxylase is
identical to factor inhibiting HIF (FIH) and is related to the cupin structural family. J
Biol Chem, 2002. 277(29): p. 26351-5.
80. Hewitson, K.S., et al., The iron-sulfur center of biotin synthase: site-directed mutants. J
Biol Inorg Chem, 2002. 7(1-2): p. 83-93.
81. McNeill, L.A., et al., Hypoxia-inducible factor asparaginyl hydroxylase (FIH-1)
catalyses hydroxylation at the beta-carbon of asparagine-803. Biochem J, 2002. 367(Pt
3): p. 571-5.
82. Jeong, J.W., et al., Regulation and destabilization of HIF-1alpha by ARD1-mediated
acetylation. Cell, 2002. 111(5): p. 709-20.
83. Sandau, K.B., H.G. Faus, and B. Brune, Induction of hypoxia-inducible-factor 1 by nitric
oxide is mediated via the PI 3K pathway. Biochem Biophys Res Commun, 2000. 278(1):
p. 263-7.
84. Zhong, H., et al., Modulation of hypoxia-inducible factor 1alpha expression by the
epidermal growth factor/phosphatidylinositol 3-kinase/PTEN/AKT/FRAP pathway in
human prostate cancer cells: implications for tumor angiogenesis and therapeutics.
Cancer Res, 2000. 60(6): p. 1541-5.
85. Richard, D.E., et al., p42/p44 mitogen-activated protein kinases phosphorylate hypoxia-
inducible factor 1alpha (HIF-1alpha) and enhance the transcriptional activity of HIF-1. J
Biol Chem, 1999. 274(46): p. 32631-7.
86. Chandel, N.S., et al., Reactive oxygen species generated at mitochondrial complex III
stabilize hypoxia-inducible factor-1alpha during hypoxia: a mechanism of O2 sensing. J
Biol Chem, 2000. 275(33): p. 25130-8.
87. Wenger, R.H., Cellular adaptation to hypoxia: O2-sensing protein hydroxylases,
hypoxia-inducible transcription factors, and O2-regulated gene expression. Faseb J,
2002. 16(10): p. 1151-62.
88. Tacchini, L., et al., Transferrin receptor induction by hypoxia. HIF-1-mediated
transcriptional activation and cell-specific post-transcriptional regulation. J Biol Chem,
1999. 274(34): p. 24142-6.
89. Rolfs, A., et al., Oxygen-regulated transferrin expression is mediated by hypoxia-
inducible factor-1. J Biol Chem, 1997. 272(32): p. 20055-62.
90. Forsythe, J.A., et al., Activation of vascular endothelial growth factor gene transcription
by hypoxia-inducible factor 1. Mol Cell Biol, 1996. 16(9): p. 4604-13.
91. Shweiki, D., et al., Vascular endothelial growth factor induced by hypoxia may mediate
hypoxia-initiated angiogenesis. Nature, 1992. 359(6398): p. 843-5.
92. Gerber, H.P., et al., Differential transcriptional regulation of the two vascular endothelial
growth factor receptor genes. Flt-1, but not Flk-1/KDR, is up-regulated by hypoxia. J
Biol Chem, 1997. 272(38): p. 23659-67.

References
163
93. Elvert, G., et al., Cooperative interaction of hypoxia-inducible factor-2alpha (HIF-
2alpha ) and Ets-1 in the transcriptional activation of vascular endothelial growth factor
receptor-2 (Flk-1). J Biol Chem, 2003. 278(9): p. 7520-30.
94. Kourembanas, S., et al., Hypoxia induces endothelin gene expression and secretion in
cultured human endothelium. J Clin Invest, 1991. 88(3): p. 1054-7.
95. Melillo, G., et al., A hypoxia-responsive element mediates a novel pathway of activation
of the inducible nitric oxide synthase promoter. J Exp Med, 1995. 182(6): p. 1683-93.
96. Lee, P.J., et al., Hypoxia-inducible factor-1 mediates transcriptional activation of the
heme oxygenase-1 gene in response to hypoxia. J Biol Chem, 1997. 272(9): p. 5375-81.
97. Kulshreshtha, R., et al., A microRNA signature of hypoxia. Mol Cell Biol, 2007. 27(5): p.
1859-67.
98. Ivan, M., et al., Hypoxia response and microRNAs: no longer two separate worlds. J Cell
Mol Med, 2008. 12(5A): p. 1426-31.
99. Fasanaro, P., et al., MicroRNA-210 modulates endothelial cell response to hypoxia and
inhibits the receptor tyrosine kinase ligand Ephrin-A3. J Biol Chem, 2008. 283(23): p.
15878-83.
100. Hua, Z., et al., MiRNA-directed regulation of VEGF and other angiogenic factors under
hypoxia. PLoS One, 2006. 1: p. e116.
101. Jiang, B.H., et al., Phosphatidylinositol 3-kinase signaling mediates angiogenesis and
expression of vascular endothelial growth factor in endothelial cells. Proc Natl Acad Sci
U S A, 2000. 97(4): p. 1749-53.
102. Yan, S.F., et al., Hypoxia-associated induction of early growth response-1 gene
expression. J Biol Chem, 1999. 274(21): p. 15030-40.
103. Rupec, R.A. and P.A. Baeuerle, The genomic response of tumor cells to hypoxia and
reoxygenation. Differential activation of transcription factors AP-1 and NF-kappa B. Eur
J Biochem, 1995. 234(2): p. 632-40.
104. Koong, A.C., E.Y. Chen, and A.J. Giaccia, Hypoxia causes the activation of nuclear
factor kappa B through the phosphorylation of I kappa B alpha on tyrosine residues.
Cancer Res, 1994. 54(6): p. 1425-30.
105. Imbert, V., et al., Tyrosine phosphorylation of I kappa B-alpha activates NF-kappa B
without proteolytic degradation of I kappa B-alpha. Cell, 1996. 86(5): p. 787-98.
106. Schmedtje, J.F., Jr., et al., Hypoxia induces cyclooxygenase-2 via the NF-kappaB p65
transcription factor in human vascular endothelial cells. J Biol Chem, 1997. 272(1): p.
601-8.
107. Ausserer, W.A., et al., Regulation of c-jun expression during hypoxic and low-glucose
stress. Mol Cell Biol, 1994. 14(8): p. 5032-42.
108. Damert, A., E. Ikeda, and W. Risau, Activator-protein-1 binding potentiates the hypoxia-
induciblefactor-1-mediated hypoxia-induced transcriptional activation of vascular-
endothelial growth factor expression in C6 glioma cells. Biochem J, 1997. 327 ( Pt 2): p.
419-23.
109. Norris, M.L. and D.E. Millhorn, Hypoxia-induced protein binding to O2-responsive
sequences on the tyrosine hydroxylase gene. J Biol Chem, 1995. 270(40): p. 23774-9.
110. Bandyopadhyay, R.S., M. Phelan, and D.V. Faller, Hypoxia induces AP-1-regulated
genes and AP-1 transcription factor binding in human endothelial and other cell types.
Biochim Biophys Acta, 1995. 1264(1): p. 72-8.

References
164
111. Yamashita, K., et al., Molecular regulation of the endothelin-1 gene by hypoxia.
Contributions of hypoxia-inducible factor-1, activator protein-1, GATA-2, AND
p300/CBP. J Biol Chem, 2001. 276(16): p. 12645-53.
112. Alfranca, A., et al., c-Jun and hypoxia-inducible factor 1 functionally cooperate in
hypoxia-induced gene transcription. Mol Cell Biol, 2002. 22(1): p. 12-22.
113. Laderoute, K.R., et al., The response of c-jun/AP-1 to chronic hypoxia is hypoxia-
inducible factor 1 alpha dependent. Mol Cell Biol, 2002. 22(8): p. 2515-23.
114. Spicher, A., et al., Highly conserved RNA sequences that are sensors of environmental
stress. Mol Cell Biol, 1998. 18(12): p. 7371-82.
115. Paulding, W.R. and M.F. Czyzyk-Krzeska, Hypoxia-induced regulation of mRNA
stability. Adv Exp Med Biol, 2000. 475: p. 111-21.
116. Mukhopadhyay, D. and K. Datta, Multiple regulatory pathways of vascular permeability
factor/vascular endothelial growth factor (VPF/VEGF) expression in tumors. Semin
Cancer Biol, 2004. 14(2): p. 123-30.
117. Shih, S.C. and K.P. Claffey, Regulation of human vascular endothelial growth factor
mRNA stability in hypoxia by heterogeneous nuclear ribonucleoprotein L. J Biol Chem,
1999. 274(3): p. 1359-65.
118. Goldberg-Cohen, I., H. Furneauxb, and A.P. Levy, A 40-bp RNA element that mediates
stabilization of vascular endothelial growth factor mRNA by HuR. J Biol Chem, 2002.
277(16): p. 13635-40.
119. Czyzyk-Krzeska, M.F., et al., Hypoxia stimulates binding of a cytoplasmic protein to a
pyrimidine-rich sequence in the 3'-untranslated region of rat tyrosine hydroxylase
mRNA. J Biol Chem, 1994. 269(13): p. 9940-5.
120. Kamada, K., et al., Crystal structure of negative cofactor 2 recognizing the TBP-DNA
transcription complex. Cell, 2001. 106(1): p. 71-81.
121. Denko, N., et al., Hypoxia actively represses transcription by inducing negative cofactor
2 (Dr1/DrAP1) and blocking preinitiation complex assembly. J Biol Chem, 2003. 278(8):
p. 5744-9.
122. St-Pierre, B., et al., Stra13 homodimers repress transcription through class B E-box
elements. J Biol Chem, 2002. 277(48): p. 46544-51.
123. Helczynska, K., et al., Hypoxia promotes a dedifferentiated phenotype in ductal breast
carcinoma in situ. Cancer Res, 2003. 63(7): p. 1441-4.
124. Jogi, A., et al., Hypoxia-induced dedifferentiation in neuroblastoma cells. Cancer Lett,
2003. 197(1-2): p. 145-50.
125. Yun, Z., et al., Inhibition of PPAR gamma 2 gene expression by the HIF-1-regulated
gene DEC1/Stra13: a mechanism for regulation of adipogenesis by hypoxia. Dev Cell,
2002. 2(3): p. 331-41.
126. Kim, M.S., et al., Histone deacetylases induce angiogenesis by negative regulation of
tumor suppressor genes. Nat Med, 2001. 7(4): p. 437-43.
127. Denko, N.C., et al., p53 checkpoint-defective cells are sensitive to X rays, but not
hypoxia. Exp Cell Res, 2000. 258(1): p. 82-91.
128. Koumenis, C., et al., Regulation of p53 by hypoxia: dissociation of transcriptional
repression and apoptosis from p53-dependent transactivation. Mol Cell Biol, 2001.
21(4): p. 1297-310.

References
165
129. Murphy, M., et al., Transcriptional repression by wild-type p53 utilizes histone
deacetylases, mediated by interaction with mSin3a. Genes Dev, 1999. 13(19): p. 2490-
501.
130. Johnsen, J.I., et al., p53-mediated negative regulation of stathmin/Op18 expression is
associated with G(2)/M cell-cycle arrest. Int J Cancer, 2000. 88(5): p. 685-91.
131. Hori, O., et al., Transmission of cell stress from endoplasmic reticulum to mitochondria:
enhanced expression of Lon protease. J Cell Biol, 2002. 157(7): p. 1151-60.
132. Koumenis, C., et al., Regulation of protein synthesis by hypoxia via activation of the
endoplasmic reticulum kinase PERK and phosphorylation of the translation initiation
factor eIF2alpha. Mol Cell Biol, 2002. 22(21): p. 7405-16.
133. Nelson, D.M., et al., Coupling of DNA synthesis and histone synthesis in S phase
independent of cyclin/cdk2 activity. Mol Cell Biol, 2002. 22(21): p. 7459-72.
134. Pardee, A.B., A restriction point for control of normal animal cell proliferation. Proc
Natl Acad Sci U S A, 1974. 71(4): p. 1286-90.
135. Sherr, C.J. and J.M. Roberts, CDK inhibitors: positive and negative regulators of G1-
phase progression. Genes Dev, 1999. 13(12): p. 1501-12.
136. Cheng, M., et al., The p21(Cip1) and p27(Kip1) CDK 'inhibitors' are essential activators
of cyclin D-dependent kinases in murine fibroblasts. EMBO J, 1999. 18(6): p. 1571-83.
137. Sugimoto, M., et al., Activation of cyclin D1-kinase in murine fibroblasts lacking both
p21(Cip1) and p27(Kip1). Oncogene, 2002. 21(53): p. 8067-74.
138. Stein, G.S., et al., An architectural perspective of cell-cycle control at the G1/S phase
cell-cycle transition. J Cell Physiol, 2006. 209(3): p. 706-10.
139. Soria, G., et al., p21 differentially regulates DNA replication and DNA-repair-associated
processes after UV irradiation. J Cell Sci, 2008. 121(Pt 19): p. 3271-82.
140. Gervais, J.L., P. Seth, and H. Zhang, Cleavage of CDK inhibitor p21(Cip1/Waf1) by
caspases is an early event during DNA damage-induced apoptosis. J Biol Chem, 1998.
273(30): p. 19207-12.
141. Kruse, J.P. and W. Gu, Modes of p53 regulation. Cell, 2009. 137(4): p. 609-22.
142. Gardner, L.B., et al., Hypoxia inhibits G1/S transition through regulation of p27
expression. J Biol Chem, 2001. 276(11): p. 7919-26.
143. Hammer, S., et al., Hypoxic suppression of the cell cycle gene CDC25A in tumor cells.
Cell Cycle, 2007. 6(15): p. 1919-26.
144. Waldman, T., K.W. Kinzler, and B. Vogelstein, p21 is necessary for the p53-mediated
G1 arrest in human cancer cells. Cancer Res, 1995. 55(22): p. 5187-90.
145. Krtolica, A., N.A. Krucher, and J.W. Ludlow, Hypoxia-induced pRB
hypophosphorylation results from downregulation of CDK and upregulation of PP1
activities. Oncogene, 1998. 17(18): p. 2295-304.
146. Adachi, S., et al., Cyclin A/cdk2 activation is involved in hypoxia-induced apoptosis in
cardiomyocytes. Circ Res, 2001. 88(4): p. 408-14.
147. Goda, N., S.J. Dozier, and R.S. Johnson, HIF-1 in cell cycle regulation, apoptosis, and
tumor progression. Antioxid Redox Signal, 2003. 5(4): p. 467-73.
148. Graeber, T.G., et al., Hypoxia induces accumulation of p53 protein, but activation of a
G1-phase checkpoint by low-oxygen conditions is independent of p53 status. Mol Cell
Biol, 1994. 14(9): p. 6264-77.

References
166
149. Bennin, D.A., et al., Cyclin G2 associates with protein phosphatase 2A catalytic and
regulatory B' subunits in active complexes and induces nuclear aberrations and a G1/S
phase cell cycle arrest. J Biol Chem, 2002. 277(30): p. 27449-67.
150. Truttmann, A.C., et al., Effect of hypoxia on protein phosphatase 2A activity, subcellular
distribution and expression in cerebral cortex of newborn piglets. Neuroscience, 2004.
127(2): p. 355-63.
151. Probst, G., et al., Fast control of DNA replication in response to hypoxia and to inhibited
protein synthesis in CCRF-CEM and HeLa cells. Biol Chem, 1999. 380(12): p. 1371-82.
152. Hammond, E.M., M.J. Dorie, and A.J. Giaccia, ATR/ATM targets are phosphorylated by
ATR in response to hypoxia and ATM in response to reoxygenation. J Biol Chem, 2003.
278(14): p. 12207-13.
153. Hammond, E.M., S.L. Green, and A.J. Giaccia, Comparison of hypoxia-induced
replication arrest with hydroxyurea and aphidicolin-induced arrest. Mutat Res, 2003.
532(1-2): p. 205-13.
154. Kerr, J.F., A.H. Wyllie, and A.R. Currie, Apoptosis: a basic biological phenomenon with
wide-ranging implications in tissue kinetics. Br J Cancer, 1972. 26(4): p. 239-57.
155. Thompson, C.B., Apoptosis in the pathogenesis and treatment of disease. Science, 1995.
267(5203): p. 1456-62.
156. Gupta, S., et al., A paradox of immunodeficiency and inflammation in human aging:
lessons learned from apoptosis. Immun Ageing, 2006. 3: p. 5.
157. Thornberry, N.A. and Y. Lazebnik, Caspases: enemies within. Science, 1998. 281(5381):
p. 1312-6.
158. Nicotera, P., M. Leist, and E. Ferrando-May, Intracellular ATP, a switch in the decision
between apoptosis and necrosis. Toxicol Lett, 1998. 102-103: p. 139-42.
159. Savill, J. and V. Fadok, Corpse clearance defines the meaning of cell death. Nature,
2000. 407(6805): p. 784-8.
160. Strasser, A., et al., Bcl-2 and Fas/APO-1 regulate distinct pathways to lymphocyte
apoptosis. EMBO J, 1995. 14(24): p. 6136-47.
161. Vander Heiden, M.G. and C.B. Thompson, Bcl-2 proteins: regulators of apoptosis or of
mitochondrial homeostasis? Nat Cell Biol, 1999. 1(8): p. E209-16.
162. Huang, D.C. and A. Strasser, BH3-Only proteins-essential initiators of apoptotic cell
death. Cell, 2000. 103(6): p. 839-42.
163. Li, P., et al., Cytochrome c and dATP-dependent formation of Apaf-1/caspase-9 complex
initiates an apoptotic protease cascade. Cell, 1997. 91(4): p. 479-89.
164. Wang, X., The expanding role of mitochondria in apoptosis. Genes Dev, 2001. 15(22): p.
2922-33.
165. Chai, J., et al., Structural and biochemical basis of apoptotic activation by
Smac/DIABLO. Nature, 2000. 406(6798): p. 855-62.
166. Joza, N., et al., Essential role of the mitochondrial apoptosis-inducing factor in
programmed cell death. Nature, 2001. 410(6828): p. 549-54.
167. Lindsten, T., et al., The combined functions of proapoptotic Bcl-2 family members bak
and bax are essential for normal development of multiple tissues. Mol Cell, 2000. 6(6): p.
1389-99.
168. Peter, M.E. and P.H. Krammer, Mechanisms of CD95 (APO-1/Fas)-mediated apoptosis.
Curr Opin Immunol, 1998. 10(5): p. 545-51.

References
167
169. Chinnaiyan, A.M., et al., FADD, a novel death domain-containing protein, interacts with
the death domain of Fas and initiates apoptosis. Cell, 1995. 81(4): p. 505-12.
170. Hsu, H., J. Xiong, and D.V. Goeddel, The TNF receptor 1-associated protein TRADD
signals cell death and NF-kappa B activation. Cell, 1995. 81(4): p. 495-504.
171. Algeciras-Schimnich, A., et al., Molecular ordering of the initial signaling events of
CD95. Mol Cell Biol, 2002. 22(1): p. 207-20.
172. Li, H., et al., Cleavage of BID by caspase 8 mediates the mitochondrial damage in the
Fas pathway of apoptosis. Cell, 1998. 94(4): p. 491-501.
173. Luo, X., et al., Bid, a Bcl2 interacting protein, mediates cytochrome c release from
mitochondria in response to activation of cell surface death receptors. Cell, 1998. 94(4):
p. 481-90.
174. Wei, M.C., et al., Proapoptotic BAX and BAK: a requisite gateway to mitochondrial
dysfunction and death. Science, 2001. 292(5517): p. 727-30.
175. McClintock, D.S., et al., Bcl-2 family members and functional electron transport chain
regulate oxygen deprivation-induced cell death. Mol Cell Biol, 2002. 22(1): p. 94-104.
176. Graeber, T.G., et al., Hypoxia-mediated selection of cells with diminished apoptotic
potential in solid tumours. Nature, 1996. 379(6560): p. 88-91.
177. Parsadanian, A.S., et al., Bcl-xL is an antiapoptotic regulator for postnatal CNS neurons.
J Neurosci, 1998. 18(3): p. 1009-19.
178. Shimizu, S., et al., Prevention of hypoxia-induced cell death by Bcl-2 and Bcl-xL. Nature,
1995. 374(6525): p. 811-3.
179. Saikumar, P., et al., Role of hypoxia-induced Bax translocation and cytochrome c release
in reoxygenation injury. Oncogene, 1998. 17(26): p. 3401-15.
180. Soengas, M.S., et al., Apaf-1 and caspase-9 in p53-dependent apoptosis and tumor
inhibition. Science, 1999. 284(5411): p. 156-9.
181. Brunelle, J.K., et al., c-Myc sensitization to oxygen deprivation-induced cell death is
dependent on Bax/Bak, but is independent of p53 and hypoxia-inducible factor-1. J Biol
Chem, 2004. 279(6): p. 4305-12.
182. Weinmann, M., et al., Molecular ordering of hypoxia-induced apoptosis: critical
involvement of the mitochondrial death pathway in a FADD/caspase-8 independent
manner. Oncogene, 2004. 23(21): p. 3757-69.
183. Scorrano, L., et al., BAX and BAK regulation of endoplasmic reticulum Ca2+: a control
point for apoptosis. Science, 2003. 300(5616): p. 135-9.
184. Zong, W.X., et al., Bax and Bak can localize to the endoplasmic reticulum to initiate
apoptosis. J Cell Biol, 2003. 162(1): p. 59-69.
185. Halestrap, A.P., G.P. McStay, and S.J. Clarke, The permeability transition pore complex:
another view. Biochimie, 2002. 84(2-3): p. 153-66.
186. Boehning, D., et al., Cytochrome c binds to inositol (1,4,5) trisphosphate receptors,
amplifying calcium-dependent apoptosis. Nat Cell Biol, 2003. 5(12): p. 1051-61.
187. Nakagawa, T. and J. Yuan, Cross-talk between two cysteine protease families. Activation
of caspase-12 by calpain in apoptosis. J Cell Biol, 2000. 150(4): p. 887-94.
188. Nakagawa, T., et al., Caspase-12 mediates endoplasmic-reticulum-specific apoptosis and
cytotoxicity by amyloid-beta. Nature, 2000. 403(6765): p. 98-103.
189. Morishima, N., et al., An endoplasmic reticulum stress-specific caspase cascade in
apoptosis. Cytochrome c-independent activation of caspase-9 by caspase-12. J Biol
Chem, 2002. 277(37): p. 34287-94.

References
168
190. Rao, R.V., et al., Coupling endoplasmic reticulum stress to the cell death program. An
Apaf-1-independent intrinsic pathway. J Biol Chem, 2002. 277(24): p. 21836-42.
191. Rao, R.V., H.M. Ellerby, and D.E. Bredesen, Coupling endoplasmic reticulum stress to
the cell death program. Cell Death Differ, 2004. 11(4): p. 372-80.
192. Germain, M., J.P. Mathai, and G.C. Shore, BH-3-only BIK functions at the endoplasmic
reticulum to stimulate cytochrome c release from mitochondria. J Biol Chem, 2002.
277(20): p. 18053-60.
193. Breckenridge, D.G., et al., Caspase cleavage product of BAP31 induces mitochondrial
fission through endoplasmic reticulum calcium signals, enhancing cytochrome c release
to the cytosol. J Cell Biol, 2003. 160(7): p. 1115-27.
194. Schuler, M. and D.R. Green, Mechanisms of p53-dependent apoptosis. Biochem Soc
Trans, 2001. 29(Pt 6): p. 684-8.
195. Sansome, C., et al., Hypoxia death stimulus induces translocation of p53 protein to
mitochondria. Detection by immunofluorescence on whole cells. FEBS Lett, 2001.
488(3): p. 110-5.
196. Alarcon, R., et al., Hypoxia induces p53 accumulation through MDM2 down-regulation
and inhibition of E6-mediated degradation. Cancer Res, 1999. 59(24): p. 6046-51.
197. Hansson, L.O., et al., Two sequence motifs from HIF-1alpha bind to the DNA-binding
site of p53. Proc Natl Acad Sci U S A, 2002. 99(16): p. 10305-9.
198. An, W.G., et al., Stabilization of wild-type p53 by hypoxia-inducible factor 1alpha.
Nature, 1998. 392(6674): p. 405-8.
199. Yu, J., et al., PUMA mediates the apoptotic response to p53 in colorectal cancer cells.
Proc Natl Acad Sci U S A, 2003. 100(4): p. 1931-6.
200. Kim, J.Y., et al., BH3-only protein Noxa is a mediator of hypoxic cell death induced by
hypoxia-inducible factor 1alpha. J Exp Med, 2004. 199(1): p. 113-24.
201. Bruick, R.K., Expression of the gene encoding the proapoptotic Nip3 protein is induced
by hypoxia. Proc Natl Acad Sci U S A, 2000. 97(16): p. 9082-7.
202. Ray, R., et al., BNIP3 heterodimerizes with Bcl-2/Bcl-X(L) and induces cell death
independent of a Bcl-2 homology 3 (BH3) domain at both mitochondrial and
nonmitochondrial sites. J Biol Chem, 2000. 275(2): p. 1439-48.
203. Carmeliet, P., et al., Role of HIF-1alpha in hypoxia-mediated apoptosis, cell proliferation
and tumour angiogenesis. Nature, 1998. 394(6692): p. 485-90.
204. Akakura, N., et al., Constitutive expression of hypoxia-inducible factor-1alpha renders
pancreatic cancer cells resistant to apoptosis induced by hypoxia and nutrient
deprivation. Cancer Res, 2001. 61(17): p. 6548-54.
205. Ozawa, K., et al., 150-kDa oxygen-regulated protein (ORP150) suppresses hypoxia-
induced apoptotic cell death. J Biol Chem, 1999. 274(10): p. 6397-404.
206. Salvesen, G.S. and C.S. Duckett, IAP proteins: blocking the road to death's door. Nat
Rev Mol Cell Biol, 2002. 3(6): p. 401-10.
207. Dong, Z., et al., Up-regulation of apoptosis inhibitory protein IAP-2 by hypoxia. Hif-1-
independent mechanisms. J Biol Chem, 2001. 276(22): p. 18702-9.
208. Shoshani, T., et al., Identification of a novel hypoxia-inducible factor 1-responsive gene,
RTP801, involved in apoptosis. Mol Cell Biol, 2002. 22(7): p. 2283-93.
209. Kennedy, S.G., et al., The PI 3-kinase/Akt signaling pathway delivers an anti-apoptotic
signal. Genes Dev, 1997. 11(6): p. 701-13.

References
169
210. Brunet, A., et al., Akt promotes cell survival by phosphorylating and inhibiting a
Forkhead transcription factor. Cell, 1999. 96(6): p. 857-68.
211. Cardone, M.H., et al., Regulation of cell death protease caspase-9 by phosphorylation.
Science, 1998. 282(5392): p. 1318-21.
212. del Peso, L., et al., Interleukin-3-induced phosphorylation of BAD through the protein
kinase Akt. Science, 1997. 278(5338): p. 687-9.
213. Gottlob, K., et al., Inhibition of early apoptotic events by Akt/PKB is dependent on the
first committed step of glycolysis and mitochondrial hexokinase. Genes Dev, 2001.
15(11): p. 1406-18.
214. Pastorino, J.G., N. Shulga, and J.B. Hoek, Mitochondrial binding of hexokinase II
inhibits Bax-induced cytochrome c release and apoptosis. J Biol Chem, 2002. 277(9): p.
7610-8.
215. Di Cristofano, A. and P.P. Pandolfi, The multiple roles of PTEN in tumor suppression.
Cell, 2000. 100(4): p. 387-90.
216. Stambolic, V., et al., Negative regulation of PKB/Akt-dependent cell survival by the
tumor suppressor PTEN. Cell, 1998. 95(1): p. 29-39.
217. Matsui, T., et al., Adenoviral gene transfer of activated phosphatidylinositol 3'-kinase
and Akt inhibits apoptosis of hypoxic cardiomyocytes in vitro. Circulation, 1999. 100(23):
p. 2373-9.
218. Zundel, W., et al., Loss of PTEN facilitates HIF-1-mediated gene expression. Genes Dev,
2000. 14(4): p. 391-6.
219. Marchetti, P., et al., Apoptosis-associated derangement of mitochondrial function in cells
lacking mitochondrial DNA. Cancer Res, 1996. 56(9): p. 2033-8.
220. Wang, J., et al., Increased in vivo apoptosis in cells lacking mitochondrial DNA gene
expression. Proc Natl Acad Sci U S A, 2001. 98(7): p. 4038-43.
221. Liu, L. and M.C. Simon, Regulation of transcription and translation by hypoxia. Cancer
Biol Ther, 2004. 3(6): p. 492-7.
222. Lopez-Barneo, J., R. Pardal, and P. Ortega-Saenz, Cellular mechanism of oxygen sensing.
Annu Rev Physiol, 2001. 63: p. 259-87.
223. Baysal, B.E., A phenotypic perspective on Mammalian oxygen sensor candidates. Ann N
Y Acad Sci, 2006. 1073: p. 221-33.
224. Liebl, U., et al., Ultrafast ligand rebinding in the heme domain of the oxygen sensors
FixL and Dos: general regulatory implications for heme-based sensors. Proc Natl Acad
Sci U S A, 2002. 99(20): p. 12771-6.
225. Goldberg, M.A., S.P. Dunning, and H.F. Bunn, Regulation of the erythropoietin gene:
evidence that the oxygen sensor is a heme protein. Science, 1988. 242(4884): p. 1412-5.
226. Overholt, J.L., et al., HERG-Like potassium current regulates the resting membrane
potential in glomus cells of the rabbit carotid body. J Neurophysiol, 2000. 83(3): p. 1150-
7.
227. Acker, T. and H. Acker, Cellular oxygen sensing need in CNS function: physiological
and pathological implications. J Exp Biol, 2004. 207(Pt 18): p. 3171-88.
228. Segal, A.W., Absence of both cytochrome b-245 subunits from neutrophils in X-linked
chronic granulomatous disease. Nature, 1987. 326(6108): p. 88-91.
229. Bedard, K. and K.H. Krause, The NOX family of ROS-generating NADPH oxidases:
physiology and pathophysiology. Physiol Rev, 2007. 87(1): p. 245-313.

References
170
230. Wolin, M.S., M. Ahmad, and S.A. Gupte, Oxidant and redox signaling in vascular
oxygen sensing mechanisms: basic concepts, current controversies, and potential
importance of cytosolic NADPH. Am J Physiol Lung Cell Mol Physiol, 2005. 289(2): p.
L159-73.
231. Marshall, C., et al., Pulmonary artery NADPH-oxidase is activated in hypoxic pulmonary
vasoconstriction. Am J Respir Cell Mol Biol, 1996. 15(5): p. 633-44.
232. Gupte, S.A., et al., Role of pentose phosphate pathway-derived NADPH in hypoxic
pulmonary vasoconstriction. Pulm Pharmacol Ther, 2006. 19(4): p. 303-9.
233. He, L., et al., Effect of p47phox gene deletion on ROS production and oxygen sensing in
mouse carotid body chemoreceptor cells. Am J Physiol Lung Cell Mol Physiol, 2005.
289(6): p. L916-24.
234. Dinger, B., et al., The role of NADPH oxidase in carotid body arterial chemoreceptors.
Respir Physiol Neurobiol, 2007. 157(1): p. 45-54.
235. Fu, X.W., et al., NADPH oxidase is an O2 sensor in airway chemoreceptors: evidence
from K+ current modulation in wild-type and oxidase-deficient mice. Proc Natl Acad Sci
U S A, 2000. 97(8): p. 4374-9.
236. Searle, G.J., et al., Lack of contribution of mitochondrial electron transport to acute O(2)
sensing in model airway chemoreceptors. Biochem Biophys Res Commun, 2002. 291(2):
p. 332-7.
237. Youngson, C., et al., Immunocytochemical localization on O2-sensing protein (NADPH
oxidase) in chemoreceptor cells. Microsc Res Tech, 1997. 37(1): p. 101-6.
238. Archer, S.L., et al., O2 sensing is preserved in mice lacking the gp91 phox subunit of
NADPH oxidase. Proc Natl Acad Sci U S A, 1999. 96(14): p. 7944-9.
239. Roy, A., et al., Mice lacking in gp91 phox subunit of NAD(P)H oxidase showed glomus
cell [Ca(2+)](i) and respiratory responses to hypoxia. Brain Res, 2000. 872(1-2): p. 188-
93.
240. Thompson, R.J., et al., Developmental regulation of O(2) sensing in neonatal adrenal
chromaffin cells from wild-type and NADPH-oxidase-deficient mice. Pflugers Arch,
2002. 444(4): p. 539-48.
241. Weissmann, N., et al., Impact of mitochondria and NADPH oxidases on acute and
sustained hypoxic pulmonary vasoconstriction. Am J Respir Cell Mol Biol, 2006. 34(4):
p. 505-13.
242. Buckler, K.J., B.A. Williams, and E. Honore, An oxygen-, acid- and anaesthetic-sensitive
TASK-like background potassium channel in rat arterial chemoreceptor cells. J Physiol,
2000. 525 Pt 1: p. 135-42.
243. Lee, Y.M., et al., NOX4 as an oxygen sensor to regulate TASK-1 activity. Cell Signal,
2006. 18(4): p. 499-507.
244. Olschewski, A., et al., Impact of TASK-1 in human pulmonary artery smooth muscle
cells. Circ Res, 2006. 98(8): p. 1072-80.
245. Wang, D., et al., NADPH-oxidase and a hydrogen peroxide-sensitive K+ channel may
function as an oxygen sensor complex in airway chemoreceptors and small cell lung
carcinoma cell lines. Proc Natl Acad Sci U S A, 1996. 93(23): p. 13182-7.
246. O'Kelly, I., et al., O(2) sensing by airway chemoreceptor-derived cells. Protein kinase c
activation reveals functional evidence for involvement of NADPH oxidase. J Biol Chem,
2000. 275(11): p. 7684-92.

References
171
247. Duchen, M.R., Contributions of mitochondria to animal physiology: from homeostatic
sensor to calcium signalling and cell death. J Physiol, 1999. 516 ( Pt 1): p. 1-17.
248. Rich, P.R., The molecular machinery of Keilin's respiratory chain. Biochem Soc Trans,
2003. 31(Pt 6): p. 1095-105.
249. Turrens, J.F., Mitochondrial formation of reactive oxygen species. J Physiol, 2003.
552(Pt 2): p. 335-44.
250. Thompson, R.J., et al., A rotenone-sensitive site and H2O2 are key components of
hypoxia-sensing in neonatal rat adrenomedullary chromaffin cells. Neuroscience, 2007.
145(1): p. 130-41.
251. Ward, J.P., V.A. Snetkov, and P.I. Aaronson, Calcium, mitochondria and oxygen sensing
in the pulmonary circulation. Cell Calcium, 2004. 36(3-4): p. 209-20.
252. Waypa, G.B., N.S. Chandel, and P.T. Schumacker, Model for hypoxic pulmonary
vasoconstriction involving mitochondrial oxygen sensing. Circ Res, 2001. 88(12): p.
1259-66.
253. Wyatt, C.N. and K.J. Buckler, The effect of mitochondrial inhibitors on membrane
currents in isolated neonatal rat carotid body type I cells. J Physiol, 2004. 556(Pt 1): p.
175-91.
254. Kemp, P.J., et al., Airway chemotransduction: from oxygen sensor to cellular effector.
Am J Respir Crit Care Med, 2002. 166(12 Pt 2): p. S17-24.
255. Chandel, N.S., et al., Mitochondrial reactive oxygen species trigger hypoxia-induced
transcription. Proc Natl Acad Sci U S A, 1998. 95(20): p. 11715-20.
256. Wang, Q.S., et al., Role of mitochondrial reactive oxygen species in hypoxia-dependent
increase in intracellular calcium in pulmonary artery myocytes. Free Radic Biol Med,
2007. 42(5): p. 642-53.
257. Waypa, G.B., et al., Increases in mitochondrial reactive oxygen species trigger hypoxia-
induced calcium responses in pulmonary artery smooth muscle cells. Circ Res, 2006.
99(9): p. 970-8.
258. Cogo, A., et al., Effects of hypoxia on rat airway smooth muscle cell proliferation. J Appl
Physiol, 2003. 94(4): p. 1403-9.
259. Semenza, G.L., Hypoxia-inducible factor 1: oxygen homeostasis and disease
pathophysiology. Trends Mol Med, 2001. 7(8): p. 345-50.
260. Schultz, K., B.L. Fanburg, and D. Beasley, Hypoxia and hypoxia-inducible factor-1alpha
promote growth factor-induced proliferation of human vascular smooth muscle cells. Am
J Physiol Heart Circ Physiol, 2006. 290(6): p. H2528-34.
261. Growcott, E.J., K.H. Banner, and J. Wharton, Hypoxia amplifies the proliferative
capacity of distal human pulmonary artery smooth-muscle cells. Chest, 2005. 128(6
Suppl): p. 600S-601S.
262. Goda, N., et al., Hypoxia-inducible factor 1alpha is essential for cell cycle arrest during
hypoxia. Mol Cell Biol, 2003. 23(1): p. 359-69.
263. Green, S.L., R.A. Freiberg, and A.J. Giaccia, p21(Cip1) and p27(Kip1) regulate cell
cycle reentry after hypoxic stress but are not necessary for hypoxia-induced arrest. Mol
Cell Biol, 2001. 21(4): p. 1196-206.
264. Schipani, E., et al., Hypoxia in cartilage: HIF-1alpha is essential for chondrocyte growth
arrest and survival. Genes Dev, 2001. 15(21): p. 2865-76.

References
172
265. Wieser, W. and G. Krumschnabel, Hierarchies of ATP-consuming processes: direct
compared with indirect measurements, and comparative aspects. Biochem J, 2001.
355(Pt 2): p. 389-95.
266. Skarka, L. and B. Ostadal, Mitochondrial membrane potential in cardiac myocytes.
Physiol Res, 2002. 51(5): p. 425-34.
267. Lau, E., et al., The functional role of Cdc6 in S-G2/M in mammalian cells. EMBO Rep,
2006.
268. Lei, M., The MCM complex: its role in DNA replication and implications for cancer
therapy. Curr Cancer Drug Targets, 2005. 5(5): p. 365-80.
269. Brazma, A., et al., Minimum information about a microarray experiment (MIAME)-
toward standards for microarray data. Nat Genet, 2001. 29(4): p. 365-71.
270. Auer, G. and M.E. Ward, Impaired reactivity of rat aorta to phenylephrine and KCl after
prolonged hypoxia: role of the endothelium. J Appl Physiol, 1998. 85(2): p. 411-7.
271. Minamino, T. and S. Kourembanas, Mechanisms of telomerase induction during vascular
smooth muscle cell proliferation. Circ Res, 2001. 89(3): p. 237-43.
272. Minamino, T., S.A. Mitsialis, and S. Kourembanas, Hypoxia extends the life span of
vascular smooth muscle cells through telomerase activation. Mol Cell Biol, 2001. 21(10):
p. 3336-42.
273. Dempsey, E.C., I.F. McMurtry, and R.F. O'Brien, Protein kinase C activation allows
pulmonary artery smooth muscle cells to proliferate to hypoxia. Am J Physiol, 1991.
260(2 Pt 1): p. L136-45.
274. Michiels, C., Physiological and pathological responses to hypoxia. Am J Pathol, 2004.
164(6): p. 1875-82.
275. Michiels, C., et al., Hypoxia stimulates human endothelial cells to release smooth muscle
cell mitogens: role of prostaglandins and bFGF. Exp Cell Res, 1994. 213(1): p. 43-54.
276. Cooper, A.L. and D. Beasley, Hypoxia stimulates proliferation and interleukin-1alpha
production in human vascular smooth muscle cells. Am J Physiol, 1999. 277(4 Pt 2): p.
H1326-37.
277. Scholzen, T. and J. Gerdes, The Ki-67 protein: from the known and the unknown. J Cell
Physiol, 2000. 182(3): p. 311-22.
278. Koshiji, M., et al., HIF-1alpha induces cell cycle arrest by functionally counteracting
Myc. Embo J, 2004. 23(9): p. 1949-56.
279. Nuss, J.E., et al., DNA damage induced hyperphosphorylation of replication protein A. 1.
Identification of novel sites of phosphorylation in response to DNA damage.
Biochemistry, 2005. 44(23): p. 8428-37.
280. Wilkinson, M.G. and J.B. Millar, Control of the eukaryotic cell cycle by MAP kinase
signaling pathways. Faseb J, 2000. 14(14): p. 2147-57.
281. van der Kuip, H., et al., The DNA-binding subunit p140 of replication factor C is
upregulated in cycling cells and associates with G1 phase cell cycle regulatory proteins.
J Mol Med, 1999. 77(4): p. 386-92.
282. Tsang, F.C., et al., ING1b decreases cell proliferation through p53-dependent and -
independent mechanisms. FEBS Lett, 2003. 553(3): p. 277-85.
283. Wong, G.A., et al., BMP-2 inhibits proliferation of human aortic smooth muscle cells via
p21Cip1/Waf1. Am J Physiol Endocrinol Metab, 2003. 284(5): p. E972-9.

References
173
284. Zhang, S., et al., Bone morphogenetic proteins induce apoptosis in human pulmonary
vascular smooth muscle cells. Am J Physiol Lung Cell Mol Physiol, 2003. 285(3): p.
L740-54.
285. Li, M., et al., The phosphatase MKP1 is a transcriptional target of p53 involved in cell
cycle regulation. J Biol Chem, 2003. 278(42): p. 41059-68.
286. Liu, L., et al., Hypoxia-induced energy stress regulates mRNA translation and cell
growth. Mol Cell, 2006. 21(4): p. 521-31.
287. Li, J., et al., Intracellular superoxide induces apoptosis in VSMCs: role of mitochondrial
membrane potential, cytochrome C and caspases. Apoptosis, 2002. 7(6): p. 511-7.
288. Newby, A.C. and A.B. Zaltsman, Fibrous cap formation or destruction--the critical
importance of vascular smooth muscle cell proliferation, migration and matrix formation.
Cardiovasc Res, 1999. 41(2): p. 345-60.
289. Reed, J.C., Mechanisms of apoptosis. Am J Pathol, 2000. 157(5): p. 1415-30.
290. Ding, H.F., et al., Essential role for caspase-8 in transcription-independent apoptosis
triggered by p53. J Biol Chem, 2000. 275(49): p. 38905-11.
291. Mihara, M., et al., p53 has a direct apoptogenic role at the mitochondria. Mol Cell, 2003.
11(3): p. 577-90.
292. Adams, J.M. and S. Cory, The Bcl-2 protein family: arbiters of cell survival. Science,
1998. 281(5381): p. 1322-6.
293. Alvarez-Tejado, M., et al., Hypoxia induces the activation of the phosphatidylinositol 3-
kinase/Akt cell survival pathway in PC12 cells: protective role in apoptosis. J Biol Chem,
2001. 276(25): p. 22368-74.
294. Li, B., et al., A novel conditional Akt 'survival switch' reversibly protects cells from
apoptosis. Gene Ther, 2002. 9(4): p. 233-44.
295. Irmler, M., et al., Inhibition of death receptor signals by cellular FLIP. Nature, 1997.
388(6638): p. 190-5.
296. Myers, K.M., et al., Bcl-2 protects neural cells from cyanide/aglycemia-induced lipid
oxidation, mitochondrial injury, and loss of viability. J Neurochem, 1995. 65(6): p. 2432-
40.
297. St-Pierre, J., M.D. Brand, and R.G. Boutilier, Mitochondria as ATP consumers: cellular
treason in anoxia. Proc Natl Acad Sci U S A, 2000. 97(15): p. 8670-4.
298. Mitchell, P., Coupling of phosphorylation to electron and hydrogen transfer by a chemi-
osmotic type of mechanism. Nature, 1961. 191: p. 144-8.
299. Clarke, M.C., et al., Apoptosis of vascular smooth muscle cells induces features of plaque
vulnerability in atherosclerosis. Nat Med, 2006.
300. Isner, J.M., et al., Apoptosis in human atherosclerosis and restenosis. Circulation, 1995.
91(11): p. 2703-11.
301. Naoi, M., et al., Oxidative stress in mitochondria: decision to survival and death of
neurons in neurodegenerative disorders. Mol Neurobiol, 2005. 31(1-3): p. 81-93.
302. Chan, P.H., Mitochondrial dysfunction and oxidative stress as determinants of cell
death/survival in stroke. Ann N Y Acad Sci, 2005. 1042: p. 203-9.
303. Lieberthal, W., S.A. Menza, and J.S. Levine, Graded ATP depletion can cause necrosis
or apoptosis of cultured mouse proximal tubular cells. Am J Physiol, 1998. 274(2 Pt 2):
p. F315-27.
304. Yu, E.Z., et al., Antiapoptotic action of hypoxia-inducible factor-1 alpha in human
endothelial cells. Lab Invest, 2004. 84(5): p. 553-61.
References
174
305. Tanaka, T., et al., Hypoxia-inducible factor modulates tubular cell survival in cisplatin
nephrotoxicity. Am J Physiol Renal Physiol, 2005. 289(5): p. F1123-33.
306. Greijer, A.E. and E. van der Wall, The role of hypoxia inducible factor 1 (HIF-1) in
hypoxia induced apoptosis. J Clin Pathol, 2004. 57(10): p. 1009-14.
307. Ke, Q. and M. Costa, Hypoxia-inducible factor-1 (HIF-1). Mol Pharmacol, 2006. 70(5):
p. 1469-80.
308. Koshiji, M. and L.E. Huang, Dynamic balancing of the dual nature of HIF-1alpha for
cell survival. Cell Cycle, 2004. 3(7): p. 853-4.
309. Cain, S.M. and C.K. Chapler, Circulatory adjustments to anemic hypoxia. Adv Exp Med
Biol, 1988. 227: p. 103-15.
310. Kubes, P., C.K. Chapler, and S.M. Cain, Regulation of canine skeletal muscle and
hindlimb blood flow in acute anemia. Can J Physiol Pharmacol, 1988. 66(2): p. 101-5.
311. Kuwahira, I., et al., Changes in regional blood flow distribution and oxygen supply
during hypoxia in conscious rats. J Appl Physiol, 1993. 74(1): p. 211-4.
312. Toporsian, M., et al., Downregulation of endothelial nitric oxide synthase in rat aorta
after prolonged hypoxia in vivo. Circ Res, 2000. 86(6): p. 671-5.
313. Toporsian, M. and M.E. Ward, Hyporeactivity of rat diaphragmatic arterioles after
exposure to hypoxia in vivo. Role of the endothelium. Am J Respir Crit Care Med, 1997.
156(5): p. 1572-8.
314. Heistad, D.D., R.C. Wheeler, and V.S. Aoki, Reflex cardiovascular responses after 36 hr
of hypoxia. Am J Physiol, 1971. 220(6): p. 1673-6.
315. Said, S.I., Mediators and modulators of pulmonary arterial hypertension. Am J Physiol
Lung Cell Mol Physiol, 2006. 291(4): p. L547-58.
316. Chaouat, A., et al., Severe pulmonary hypertension and chronic obstructive pulmonary
disease. Am J Respir Crit Care Med, 2005. 172(2): p. 189-94.
317. Sime, F., et al., Pulmonary hypertension in children born and living at high altitudes. Am
J Cardiol, 1963. 11: p. 143-9.
318. Penaloza, D., et al., The influence of high altitudes on the electrical activity of the heart.
Electrocardiographic and vactorcardiographic observations in adolescence and
adulthood. Am Heart J, 1961. 61: p. 101-15.
319. Morrell, N.W. and M.R. Wilkins, Genetic and molecular mechanisms of pulmonary
hypertension. Clin Med, 2001. 1(2): p. 138-45.
320. Rabinovitch, M., et al., Age and sex influence on pulmonary hypertension of chronic
hypoxia and on recovery. Am J Physiol, 1981. 240(1): p. H62-72.
321. Belknap, J.K., et al., Hypoxia increases bromodeoxyuridine labeling indices in bovine
neonatal pulmonary arteries. Am J Respir Cell Mol Biol, 1997. 16(4): p. 366-71.
322. Hales, C.A., et al., Impairment of hypoxic pulmonary artery remodeling by heparin in
mice. Am Rev Respir Dis, 1983. 128(4): p. 747-51.
323. Ray, J.B., et al., Oxygen regulation of arterial smooth muscle cell proliferation and
survival. Am J Physiol Heart Circ Physiol, 2008. 294(2): p. H839-52.
324. MacLean, M.R., et al., 5-hydroxytryptamine and the pulmonary circulation: receptors,
transporters and relevance to pulmonary arterial hypertension. Br J Pharmacol, 2000.
131(2): p. 161-8.
325. Frid, M.G., E.P. Moiseeva, and K.R. Stenmark, Multiple phenotypically distinct smooth
muscle cell populations exist in the adult and developing bovine pulmonary arterial
media in vivo. Circ Res, 1994. 75(4): p. 669-81.

References
175
326. Michelakis, E.D., et al., Diversity in mitochondrial function explains differences in
vascular oxygen sensing. Circ Res, 2002. 90(12): p. 1307-15.
327. Whitman, E.M., et al., Endothelin-1 mediates hypoxia-induced inhibition of voltage-
gated K+ channel expression in pulmonary arterial myocytes. Am J Physiol Lung Cell
Mol Physiol, 2008. 294(2): p. L309-18.
328. Knock, G.A., et al., Modulation of PGF2alpha- and hypoxia-induced contraction of rat
intrapulmonary artery by p38 MAPK inhibition: a nitric oxide-dependent mechanism.
Am J Physiol Lung Cell Mol Physiol, 2005. 289(6): p. L1039-48.
329. Yang, X., et al., Hypoxic induction of cox-2 regulates proliferation of human pulmonary
artery smooth muscle cells. Am J Respir Cell Mol Biol, 2002. 27(6): p. 688-96.
330. Hinton, M., A. Gutsol, and S. Dakshinamurti, Thromboxane hypersensitivity in hypoxic
pulmonary artery myocytes: altered TP receptor localization and kinetics. Am J Physiol
Lung Cell Mol Physiol, 2007. 292(3): p. L654-63.
331. Frid, M.G., et al., Smooth muscle cells isolated from discrete compartments of the mature
vascular media exhibit unique phenotypes and distinct growth capabilities. Circ Res,
1997. 81(6): p. 940-52.
332. Ambalavanan, N., et al., Role of nitric oxide in regulating neonatal porcine pulmonary
artery smooth muscle cell proliferation. Biol Neonate, 1999. 76(5): p. 291-300.
333. Benitz, W.E., et al., Hypoxia inhibits proliferation of fetal pulmonary arterial smooth
muscle cells in vitro. Pediatr Res, 1986. 20(10): p. 966-72.
334. Frank, D.B., et al., Bone morphogenetic protein 4 promotes pulmonary vascular
remodeling in hypoxic pulmonary hypertension. Circ Res, 2005. 97(5): p. 496-504.
335. Lanner, M.C., et al., Heterotrimeric G proteins and the platelet-derived growth factor
receptor-beta contribute to hypoxic proliferation of smooth muscle cells. Am J Respir
Cell Mol Biol, 2005. 33(4): p. 412-9.
336. Lu, S.Y., et al., Inhibition of hypoxia-induced proliferation and collagen synthesis by
vasonatrin peptide in cultured rat pulmonary artery smooth muscle cells. Life Sci, 2005.
77(1): p. 28-38.
337. Preston, I.R., et al., Role of 12-lipoxygenase in hypoxia-induced rat pulmonary artery
smooth muscle cell proliferation. Am J Physiol Lung Cell Mol Physiol, 2006. 290(2): p.
L367-74.
338. Stotz, W.H., D. Li, and R.A. Johns, Exogenous nitric oxide upregulates p21(waf1/cip1)
in pulmonary microvascular smooth muscle cells. J Vasc Res, 2004. 41(3): p. 211-9.
339. Eddahibi, S., et al., Induction of serotonin transporter by hypoxia in pulmonary vascular
smooth muscle cells. Relationship with the mitogenic action of serotonin. Circ Res, 1999.
84(3): p. 329-36.
340. Hassoun, P.M., et al., Hypoxia stimulates the release by bovine pulmonary artery
endothelial cells of an inhibitor of pulmonary artery smooth muscle cell growth. Am J
Respir Cell Mol Biol, 1989. 1(5): p. 377-84.
341. Stiebellehner, L., et al., Bovine distal pulmonary arterial media is composed of a uniform
population of well-differentiated smooth muscle cells with low proliferative capabilities.
Am J Physiol Lung Cell Mol Physiol, 2003. 285(4): p. L819-28.
342. Michelakis, E.D., et al., Dichloroacetate, a metabolic modulator, prevents and reverses
chronic hypoxic pulmonary hypertension in rats: role of increased expression and
activity of voltage-gated potassium channels. Circulation, 2002. 105(2): p. 244-50.

References
176
343. Morrell, N.W., et al., Altered growth responses of pulmonary artery smooth muscle cells
from patients with primary pulmonary hypertension to transforming growth factor-
beta(1) and bone morphogenetic proteins. Circulation, 2001. 104(7): p. 790-5.
344. Remillard, C.V. and J.X. Yuan, Activation of K+ channels: an essential pathway in
programmed cell death. Am J Physiol Lung Cell Mol Physiol, 2004. 286(1): p. L49-67.
345. Yuan, X.J., et al., Attenuated K+ channel gene transcription in primary pulmonary
hypertension. Lancet, 1998. 351(9104): p. 726-7.
346. Reid, L.M., Structure and function in pulmonary hypertension. New perceptions. Chest,
1986. 89(2): p. 279-88.
347. Meyrick, B., Structure function correlates in the pulmonary vasculature during acute
lung injury and chronic pulmonary hypertension. Toxicol Pathol, 1991. 19(4 Pt 1): p.
447-57.
348. Thompson, B.T., et al., Acute and chronic hypoxic pulmonary hypertension in guinea
pigs. J Appl Physiol, 1989. 66(2): p. 920-8.
349. Stenmark, K.R., et al., Hypoxia induces cell-specific changes in gene expression in
vascular wall cells: implications for pulmonary hypertension. Adv Exp Med Biol, 1999.
474: p. 231-58.
350. Tamm, M., et al., Hypoxia-induced interleukin-6 and interleukin-8 production is
mediated by platelet-activating factor and platelet-derived growth factor in primary
human lung cells. Am J Respir Cell Mol Biol, 1998. 19(4): p. 653-61.
351. Graff, P., et al., The role of p27 in controlling the oxygen-dependent checkpoint of
mammalian cells in late G1. Anticancer Res, 2005. 25(3B): p. 2259-67.
352. Wang, G., et al., Cyclin dependent kinase inhibitor p27(Kip1) is upregulated by hypoxia
via an ARNT dependent pathway. J Cell Biochem, 2003. 90(3): p. 548-60.
353. Yu, L., et al., Cyclin-dependent kinase inhibitor p27Kip1, but not p21WAF1/Cip1, is
required for inhibition of hypoxia-induced pulmonary hypertension and remodeling by
heparin in mice. Circ Res, 2005. 97(9): p. 937-45.
354. Ii, M., et al., Beraprost sodium regulates cell cycle in vascular smooth muscle cells
through cAMP signaling by preventing down-regulation of p27(Kip1). Cardiovasc Res,
2001. 52(3): p. 500-8.
355. Tanner, F.C., et al., Differential effects of the cyclin-dependent kinase inhibitors
p27(Kip1), p21(Cip1), and p16(Ink4) on vascular smooth muscle cell proliferation.
Circulation, 2000. 101(17): p. 2022-5.
356. Weinberg, R.A., The retinoblastoma protein and cell cycle control. Cell, 1995. 81(3): p.
323-30.
357. Archer, S. and S. Rich, Primary pulmonary hypertension: a vascular biology and
translational research "Work in progress". Circulation, 2000. 102(22): p. 2781-91.
358. De Caestecker, M. and B. Meyrick, Bone morphogenetic proteins, genetics and the
pathophysiology of primary pulmonary hypertension. Respir Res, 2001. 2(4): p. 193-7.
359. Stenmark, K.R. and R.P. Mecham, Cellular and molecular mechanisms of pulmonary
vascular remodeling. Annu Rev Physiol, 1997. 59: p. 89-144.
360. Cowan, K.N., P.L. Jones, and M. Rabinovitch, Regression of hypertrophied rat
pulmonary arteries in organ culture is associated with suppression of proteolytic activity,
inhibition of tenascin-C, and smooth muscle cell apoptosis. Circ Res, 1999. 84(10): p.
1223-33.

References
177
361. Cowan, K.N., et al., Complete reversal of fatal pulmonary hypertension in rats by a
serine elastase inhibitor. Nat Med, 2000. 6(6): p. 698-702.
362. Diez, J., et al., Altered regulation of smooth muscle cell proliferation and apoptosis in
small arteries of spontaneously hypertensive rats. Eur Heart J, 1998. 19 Suppl G: p.
G29-33.
363. Guevara, N.V., et al., The absence of p53 accelerates atherosclerosis by increasing cell
proliferation in vivo. Nat Med, 1999. 5(3): p. 335-9.
364. Malik, N., et al., Apoptosis and cell proliferation after porcine coronary angioplasty.
Circulation, 1998. 98(16): p. 1657-65.
365. Pollman, M.J., et al., Inhibition of neointimal cell bcl-x expression induces apoptosis and
regression of vascular disease. Nat Med, 1998. 4(2): p. 222-7.
366. Bennett, M.R., et al., Cooperative interactions between RB and p53 regulate cell
proliferation, cell senescence, and apoptosis in human vascular smooth muscle cells from
atherosclerotic plaques. Circ Res, 1998. 82(6): p. 704-12.
367. Lopez-Candales, A., et al., Decreased vascular smooth muscle cell density in medial
degeneration of human abdominal aortic aneurysms. Am J Pathol, 1997. 150(3): p. 993-
1007.
368. Bennett, M., et al., Cell surface trafficking of Fas: a rapid mechanism of p53-mediated
apoptosis. Science, 1998. 282(5387): p. 290-3.
369. Bennett, M.R., et al., Increased sensitivity of human vascular smooth muscle cells from
atherosclerotic plaques to p53-mediated apoptosis. Circ Res, 1997. 81(4): p. 591-9.
370. Yonemitsu, Y., et al., Transfer of wild-type p53 gene effectively inhibits vascular smooth
muscle cell proliferation in vitro and in vivo. Circ Res, 1998. 82(2): p. 147-56.
371. Scheinman, M., et al., p53 gene transfer to the injured rat carotid artery decreases
neointimal formation. J Vasc Surg, 1999. 29(2): p. 360-9.
372. Katayose, D., et al., Consequences of p53 gene expression by adenovirus vector on cell
cycle arrest and apoptosis in human aortic vascular smooth muscle cells. Biochem
Biophys Res Commun, 1995. 215(2): p. 446-51.
373. Brown, G.C., Control of respiration and ATP synthesis in mammalian mitochondria and
cells. Biochem J, 1992. 284 ( Pt 1): p. 1-13.
374. Erecinska, M. and D.F. Wilson, Regulation of cellular energy metabolism. J Membr Biol,
1982. 70(1): p. 1-14.
375. Buescher, P.C., et al., Energy state and vasomotor tone in hypoxic pig lungs. J Appl
Physiol, 1991. 70(4): p. 1874-81.
376. Podgorska, M., et al., Reduced ability to release adenosine by diabetic rat cardiac
fibroblasts due to altered expression of nucleoside transporters. J Physiol, 2006. 576(Pt
1): p. 179-89.
377. Xu, R.H., et al., Inhibition of glycolysis in cancer cells: a novel strategy to overcome
drug resistance associated with mitochondrial respiratory defect and hypoxia. Cancer
Res, 2005. 65(2): p. 613-21.
378. Cornillie, P., W. Van Den Broeck, and P. Simoens, Three-dimensional reconstruction of
the remodeling of the systemic vasculature in early pig embryos. Microsc Res Tech,
2008. 71(2): p. 105-11.
379. Delcuve, G.P., M. Rastegar, and J.R. Davie, Epigenetic control. J Cell Physiol, 2009.
219(2): p. 243-50.

References
178
380. Michelakis, E.D., et al., Potassium channel diversity in vascular smooth muscle cells.
Can J Physiol Pharmacol, 1997. 75(7): p. 889-97.
381. Tchekneva, E., M.L. Lawrence, and B. Meyrick, Cell-specific differences in ET-1 system
in adjacent layers of main pulmonary artery. A new source of ET-1. Am J Physiol Lung
Cell Mol Physiol, 2000. 278(4): p. L813-21.
382. Lee, H.C. and Y.H. Wei, Oxidative stress, mitochondrial DNA mutation, and apoptosis in
aging. Exp Biol Med (Maywood), 2007. 232(5): p. 592-606.
383. Fiskum, G., Mitochondrial participation in ischemic and traumatic neural cell death. J
Neurotrauma, 2000. 17(10): p. 843-55.
384. St-Pierre, J., et al., Suppression of reactive oxygen species and neurodegeneration by the
PGC-1 transcriptional coactivators. Cell, 2006. 127(2): p. 397-408.
385. Lee, H.C., et al., Mitochondrial genome instability and mtDNA depletion in human
cancers. Ann N Y Acad Sci, 2005. 1042: p. 109-22.
386. Lin, C.S., et al., Low copy number and low oxidative damage of mitochondrial DNA are
associated with tumor progression in lung cancer tissues after neoadjuvant
chemotherapy. Interact Cardiovasc Thorac Surg, 2008. 7(6): p. 954-8.
387. Yin, W., et al., Rapidly increased neuronal mitochondrial biogenesis after hypoxic-
ischemic brain injury. Stroke, 2008. 39(11): p. 3057-63.
388. Yakes, F.M. and B. Van Houten, Mitochondrial DNA damage is more extensive and
persists longer than nuclear DNA damage in human cells following oxidative stress. Proc
Natl Acad Sci U S A, 1997. 94(2): p. 514-9.
389. Clark, J.F., The creatine kinase system in smooth muscle. Mol Cell Biochem, 1994. 133-
134: p. 221-32.
390. Krisanda, J.M. and R.J. Paul, Phosphagen and metabolite content during contraction in
porcine carotid artery. Am J Physiol, 1983. 244(5): p. C385-90.
391. Aickin, C.C., Regulation of intracellular pH in smooth muscle cells of the guinea-pig
femoral artery. J Physiol, 1994. 479 ( Pt 2): p. 331-40.
392. Hellstrand, P. and H.J. Vogel, Phosphagens and intracellular pH in intact rabbit smooth
muscle studied by 31P-NMR. Am J Physiol, 1985. 248(3 Pt 1): p. C320-9.
393. Krampetz, I.K. and R.A. Rhoades, Intracellular pH: effect on pulmonary arterial smooth
muscle. Am J Physiol, 1991. 260(6 Pt 1): p. L516-21.
394. Austin, C. and S. Wray, A quantitative study of the relation between intracellular pH and
force in rat mesenteric vascular smooth muscle. Pflugers Arch, 1994. 427(3-4): p. 270-6.
395. Gordon, J.B., et al., Differing effects of acute and prolonged alkalosis on hypoxic
pulmonary vasoconstriction. Am Rev Respir Dis, 1993. 148(6 Pt 1): p. 1651-6.
396. Raffestin, B. and I.F. McMurtry, Effects of intracellular pH on hypoxic vasoconstriction
in rat lungs. J Appl Physiol, 1987. 63(6): p. 2524-31.
397. Shimoda, L.A., et al., HIF-1 regulates hypoxic induction of NHE1 expression and
alkalinization of intracellular pH in pulmonary arterial myocytes. Am J Physiol Lung
Cell Mol Physiol, 2006. 291(5): p. L941-9.
398. Madden, J.A., et al., Ion exchange activity in pulmonary artery smooth muscle cells: the
response to hypoxia. Am J Physiol Lung Cell Mol Physiol, 2001. 280(2): p. L264-71.
399. Shimizu, S., et al., Effects of hypoxia on isometric force, intracellular Ca(2+), pH, and
energetics in porcine coronary artery. Circ Res, 2000. 86(8): p. 862-70.

References
179
400. Rios, E.J., et al., Chronic hypoxia elevates intracellular pH and activates Na+/H+
exchange in pulmonary arterial smooth muscle cells. Am J Physiol Lung Cell Mol
Physiol, 2005. 289(5): p. L867-74.
401. Giesen, J. and H. Kammermeier, Relationship of phosphorylation potential and oxygen
consumption in isolated perfused rat hearts. J Mol Cell Cardiol, 1980. 12(9): p. 891-907.
402. Quinn, D.A., et al., Contribution of Na+/H+ exchange to pH regulation in pulmonary
artery smooth muscle cells. Am J Respir Cell Mol Biol, 1991. 5(6): p. 586-91.
403. Wray, S., Smooth muscle intracellular pH: measurement, regulation, and function. Am J
Physiol, 1988. 254(2 Pt 1): p. C213-25.
404. Chandel, N.S., G.R. Budinger, and P.T. Schumacker, Molecular oxygen modulates
cytochrome c oxidase function. J Biol Chem, 1996. 271(31): p. 18672-7.