Oxygen concentration control of dopamine-induced · PDF fileOxygen concentration control of...
23
Oxygen concentration control of dopamine-induced high uniformity surface coating chemistry Hyo Won Kim, †,‡ Bryan D. McCloskey, §,‡ Tae Hwan Choi, † Changho Lee, ∥ Min-Joung Kim, ∥ Benny D. Freeman, ⊥ and Ho Bum Park *,† † WCU Department of Energy Engineering Hanyang University Seoul 133-791, Republic of Korea § IBM Almaden Research Center, San Jose, Califonia 95120, United Stated ∥ LG Electronics, Advanced Research Institute, 16 Woomyeon-dong, Seocho-gu, Seoul 137-724, Republic of Korea ⊥ University of Texas at Austin, Department of Chemical Engineering Center for Energy and Environmental Resources, 10100 Burnet Road, Building 133, Austin, TX 78758, United Stated *To whom correspondence should be addressed. E-mail: [email protected] ‡ These authors contributed equally to this work
Transcript of Oxygen concentration control of dopamine-induced · PDF fileOxygen concentration control of...
Oxygen concentration control of dopamine-induced high uniformity
surface coating chemistry
Hyo Won Kim,†,‡ Bryan D. McCloskey,§,‡ Tae Hwan Choi,† Changho Lee,∥ Min-Joung Kim,∥
Benny D. Freeman,⊥
and Ho Bum Park*,†
†WCU Department of Energy Engineering Hanyang University Seoul 133-791, Republic of Korea
§IBM Almaden Research Center, San Jose, Califonia 95120, United Stated
∥LG Electronics, Advanced Research Institute, 16 Woomyeon-dong, Seocho-gu, Seoul 137-724,
Republic of Korea
⊥University of Texas at Austin, Department of Chemical Engineering Center for Energy and
Environmental Resources, 10100 Burnet Road, Building 133, Austin, TX 78758, United Stated
*To whom correspondence should be addressed. E-mail: [email protected] ‡ These authors contributed equally to this work
Experimental
1. Materials
Dopamine hydrochloride, resorcinol, catechol, and hydroquinone (Sigma Aldrich,
Milwaukee, WI, USA) were used to modify Si wafer (Hissan, Kogyo, Japan), chlorinated
poly(vinyl chloride) (CPVC) (0.45 µm, Pure Envi-Tech, Korea), polytetrafluoroethylene
(PTFE) (1.0µm, Core-Tex, Paper Mill Road Newark, DE, USA), polyethersulfone (PES,
PES-5 (MWCO: 6k PEG) and PES-20 (MWCO: 20k PEG)) and polysulfone (PSF, PS-20
(MWCO: 20k PEG)) (Sepro membrane, Oceanside, CA, USA) membrane surfaces. Trizma
hydrochloride (Sigma Aldrich, St. Louis, MO, USA) and NaOH (Duksan, Kyungkido, Korea)
were used to prepare the tris buffer solution. Ultrapure water was obtained from a Direct-Q 3
ultrapure water system (Millipore, Concord Road, Billerica, MA, USA).
2. Preparation of Dopamine Coated Silicon Wafer (Si)
The dopamine solution was prepared by dissolving a desired amount of dopamine
HCl in 15 mM tris buffer solution (pH 8.5). The Si was then dipped in the prepared
dopamine solution for 30 min, followed by a thorough deionized water rinsing and air drying.
Of note is the ratio of dissolved O2 to dopamine concentration in the reaction
solution. Henry’s Law constant for O2 in pure water at 25 °C is 1.3 x 10⁻³
mol L-1
atm-1
. The
dissolved oxygen in pure water will be very similar to that of a 15 mM tris buffer solution.
Given the O2 partial pressures used in this study (0.2 atm and ~1 atm), the dissolved O2 molar
concentration is approximately 50 and 10 times lower than the dissolved dopamine molar
concentration (0.013 M for a 2g/L solution) used in our studies.
3. Preparation of Modified Membranes
A dopamine-induced hydrophilic coating was applied to various commercial
microporous membranes, including CPVC, PTFE, PES, and PSF. All microporous
membranes were prepared by immersion in isopropyl alcohol (IPA) for 30 min and then
washed with deionized water for 60 min. The microporous membranes were attached to one
side of a glass plate using laboratory tape. 2.0 g/L dopamine was dissolved in Tris-HCl (pH =
8.5) buffer solution at 25 oC for most experiments (any exceptions are noted in the text).
1 The
microporous membranes were immersed in the stirred dopamine solution. When studying
deposition under pure oxygen, oxygen was purged into the reactor vessel (the reactor volume:
1 L, and the amount of solution: 0.5 L) at various flow rates, otherwise the reaction was
allowed to proceed under ambient environment. For Figure S2, a mixture of dopamine (1.0
g/L) and other catechols, such as resorcinol, catechol, and hydroquinone (1.0 g/L), were used
in place of a 2.0 g/L dopamine solution as listed Table S3. After the reaction was terminated,
the surface-modified microporous membranes were removed from the solution and
thoroughly washed with deionized water.
The experimental set-up to prepare the hydrophilic PTFE and PSF membranes
studied in Figure 4 and S9-10 is shown in Figure S3. A membrane coupon was mounted on a
membrane filtration cell. Using a peristaltic pump, the dopamine solution was circulated
through the microporous membranes for various amounts of time. This procedure ensured
that both the membrane surface and its pore walls were modified. After the modification, the
membrane was removed from the filtration cell and sufficiently washed with deionized water.
4. Materials Characterizations
Attenuated total reflectance Fourier transform infrared (ATR-FTIR) spectra of
modified and unmodified PTFE membranes were measured using a FTLA 2000-104 (ABB
Miracle, Quebec, Canada) in the range 4000-1000 cm-1
. XPS spectra were performed with an
Omicron ESCALAB (Omicron, Taunusstein, Germany) with a monochromatic Al Kα (1486.8
eV) 300- W X-ray source, a flood gun to counter charging effects, and ultra-high vacuum

(~10-9
torr). High-resolution scans were acquired to calculate the chemical compositions of
the modified surface. The contact angle of a water droplet was measured with a Phoeaix 300
contact angle analyzer (Surface Electro Optics (SEO), Suwon, Korea) using the sessile drop
method. UV/vis absorbance spectra were investigated by a SPECORD 200 (Analytic Jena AG,
Jena, Germany) in the wavelength range of 250-500 nm. Surface morphologies of the pristine
and the modified porous membranes were measured using a JSM-7600F field emission-
scanning electron microscope (FE-SEM) instrument (JEOL, Tokyo, Japan). An AK 559
sputter coater (Emitech, UK) was used to coat the outer surface of the sample with palladium,
and sputtering was performed for 1.0 min. Surface roughness and morphologies of the
pristine and the modified membranes were obtained using (Veeco, Plainview, NY, USA)
atomic force microscopy (AFM).
5. Water Flux Measurement
Water flux in the pristine and the modified CPVC and PTFE membranes were
measured using dead-end filtration (Millipore, Billerica, MA, USA; effective membrane area
= 13.4 cm2). The pressure vessel (5 L) was used to continuously feed water to the stirred cell
at a fixed pressure. The unmodified PTFE membrane was immersed in an IPA solution for 10
min and in deionized water for 30 min prior to the filtration experiment. During pretreatment,
the microporous PTFE membrane was well wetted. The water flux in the modified PTFE
(PDOPA (PTFE)) membranes was also measured without any pre-wetting to check the
wettability of the modified PTFE membranes. The water flux data was obtained under
conditions of applied pressure at 0.3 bar and 25 oC. The water flux (Jw, Lm
-2h
-1bar
-1) was
calculated as follows:
w
mJ
A t Pρ
∆=
∆ ∆ (1)
where Δm is the permeate weight during filtration time Δt, ρ is the density of water at the
test condition, A is the membrane area (13.4 cm2), and ΔP is the applied pressure (0.3 bar).
Organic rejection was calculated using the following equation:
%100)1( ×−=f
p
C
CR (2)
where R is rejection, Cp is the organic concentration in the permeate, and Cf is organic
concentration in the feed. Cp and Cf were measured using a Total Organic Carbon Analyzer
(TOC multi N/C 3100, Analytik JENA, Germany).
6. Oxygen consumption calculation (Figure 2a)
Oxygen consumption was measured using a pressure decay measurement similar to
those described elsewhere2, 3
. 4 mg of dopamine was placed in a custom-built glass reaction
vessel (Adams and Chittenden Scientific Glass, Berkeley, CA), which seals using a glass-to-
stainless steel KF flange. 2 40 mil diameter capillaries and a septa-sealed injection port were
silver soldered into the stainless steel flange used to seal the vessel. The 2 capillaries were
attached to a gas line and Ar was allowed to flow through the vessel. 2 mL of deoxygenated
tris buffer (15 mM, 8.5 pH) was injected into the reaction vessel and the dopamine/tris buffer
mixture were stirred vigorously using a magnetic stir bar. After ~10 min, during which no
apparent dopamine oxidation reaction was visible, pure O2 (~850 torr) or air (~730 torr) was
purged through the reaction vessel. The inlet and outlet capillaries were sealed off and
pressure decay in the reaction vessel was monitored using a high accuracy in-line pressure
transducer (Omega Engineering, Inc.). Ambient temperature near the reaction vessel was also
monitored using a thermocouple. After the completion of the reaction, Ar was purged back
into the system and a leak test was performed. No apparent leak was detected (i.e., no
pressure drop occurred for 1 hr) at an Ar pressure of 850 torr. The volume of the vessel was

calibrated via a volume expansion measurement and was 7.40 mL. The number of moles of
oxygen in the vessel at any given time was calculated using the ideal gas law.
7. Dopamine Consumption Rate Constant Calculation (Figure 2b)
Dopamine concentrations were measured by UV/vis spectroscopy with different
concentrations (20, 10, 5, and 0 mg/L). For UV/vis spectroscopy measurements, solutions
were diluted 1:1,000 vol:vol with H2O. The UV intensity at 280 nm4 is proportional to the
dopamine concentration so the UV intensity was calibrated as a function of dopamine
concentration. The dopamine solutions with different reaction time (10, 30, and 60 min) were
selected to calculate the dopamine concentration. The rate constant was calculated using the
power law model as follows:
0
0[ ]
A
A A
dCr k C
dt
α− = = (3)
where Ar is dopamine consumption rate, k is dopamine consumption rate constant, 0A
C is
the dopamine concentration, and α is reaction order. To simplify the calculation, it was
assumed that the only reactant was dopamine.

Table S1. Solubility of PDOPA particles in aqueous and common organic solvents5
Solvent Dispersibility
1 Solubility
Parameter
(δt)2
Solvent Dispersibility1 Solubility
Parameter
(δt)2
DMF + 24.8 Water + 47.8
NMP + 22.9 Benzene - 18.6
DMAc + 22.7 THF - 19.4
DMSO + 26.7 Acetone - 20.0
Methanol + 26.5 Hexane - 14.9
Ethanol + 29.6 Toluene - 18.2
Iso-Propanol + 23.5 MC - 20.3
1) +: Dispersion, -: Poor dispersion,
2) δt: (Mpa)1/2
DMF: Dimethylformamide, NMP: N-Methylpryrrolidone, DMAc: N,N-Dimethylacetamide, DMSO: Dimethyl
Sulfoxide, THF: Tetrahydrofuran, MC: Methylene Chloride

Table S2. Sample codes of modified porous membranes.
Sample code Substrate Oxygen
bubbling
Reaction
time (min)
Dopamine
concentration (g/L)
a-PDOPA (Si) Silicon Wafer × 30 2.0
o-PDOPA (Si) Silicon Wafer ○ 30 2.0
a-PDOPA (PSF) PSF × 30 2.0
o-PDOPA (PSF) PSF ○ 30 2.0
a-PDOPA (CPVC) CPVC × 30 2.0
o-PDOPA (CPVC) CPVC ○ 30 2.0
a-PDOPA (PES) PES ○ 30 2.0
o-PDOPA (PES) PES ○ 30 2.0
a-IPDOPA (PTFE) PTFE × 30 2.0
o-IPDOPA (PTFE) PTFE ○ 30 2.0

Figure S1. Images of the dopamine oxidation reaction using different conditions: (a) under
ambient air, (b) deoxygenated environment by means of nitrogen bubbling. (the left-hand
images were taken at the immediately following dopamine solution preparation, the right-
hand images were taken after a 30 min. reaction time, temperature: 25 oC, pH: 8.5)
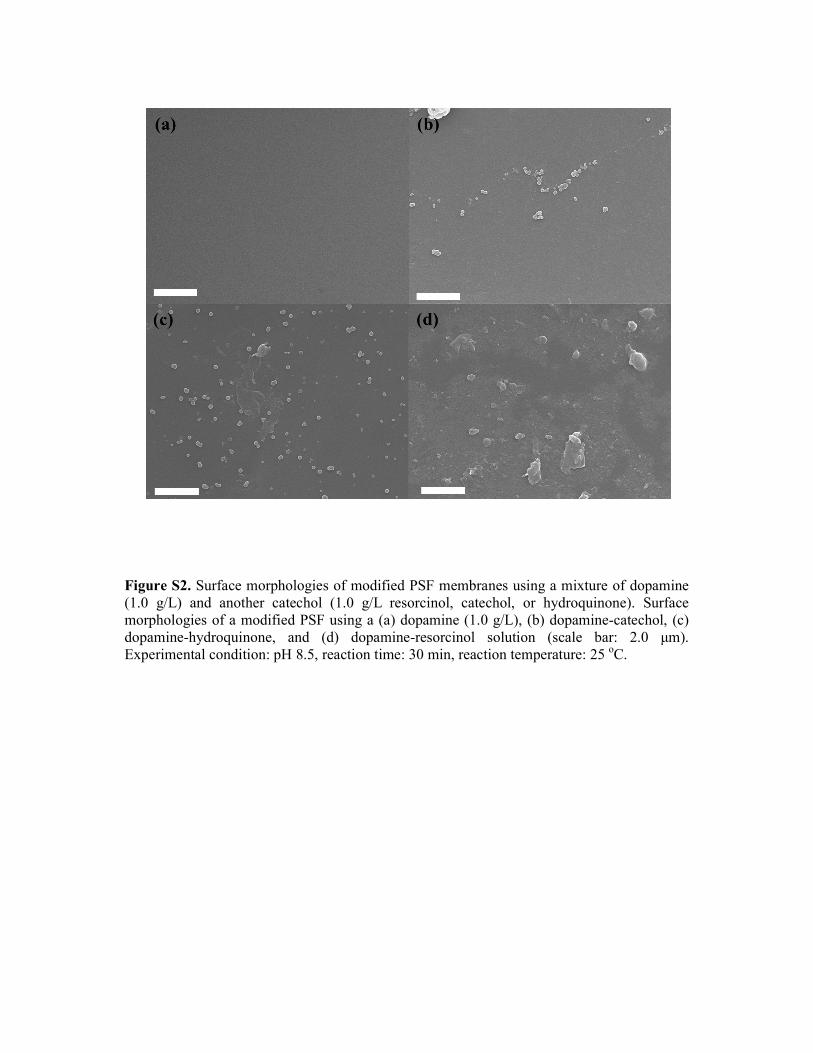
Figure S2. Surface morphologies of modified PSF membranes using a mixture of dopamine
(1.0 g/L) and another catechol (1.0 g/L resorcinol, catechol, or hydroquinone). Surface
morphologies of a modified PSF using a (a) dopamine (1.0 g/L), (b) dopamine-catechol, (c)
dopamine-hydroquinone, and (d) dopamine-resorcinol solution (scale bar: 2.0 µm).
Experimental condition: pH 8.5, reaction time: 30 min, reaction temperature: 25 oC.
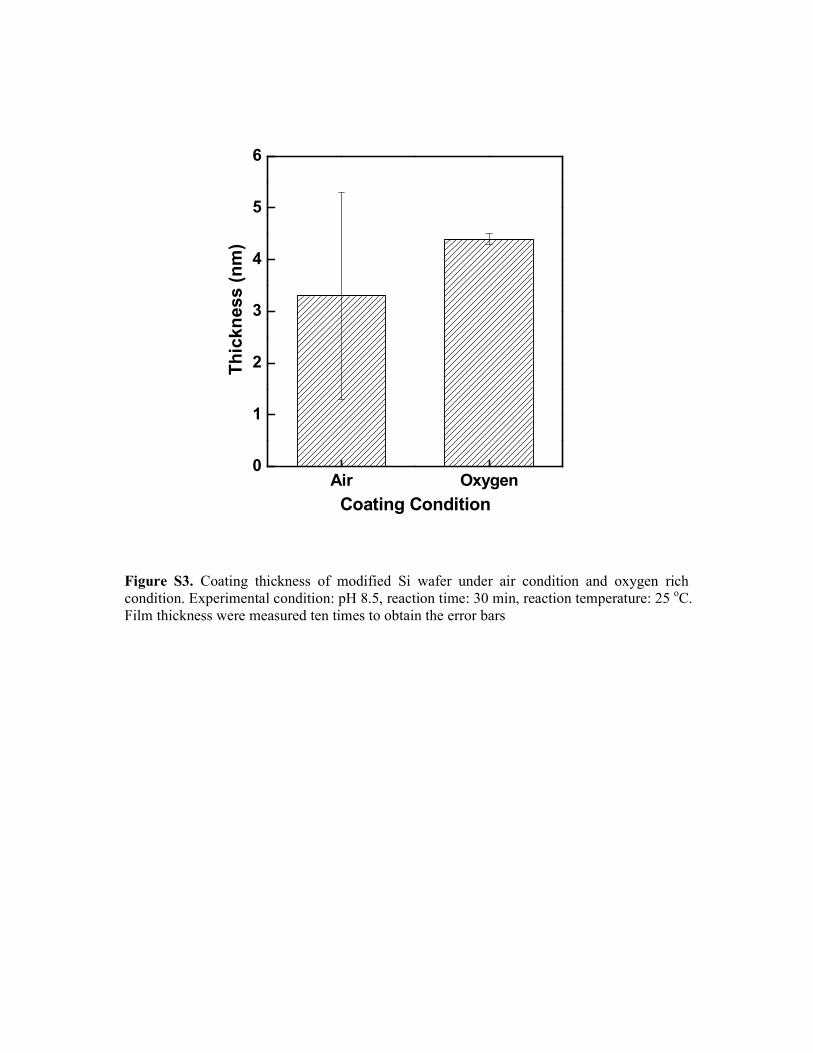
Air Oxygen0
1
2
3
4
5
6
Thickness (nm)
Coating Condition
Figure S3. Coating thickness of modified Si wafer under air condition and oxygen rich
condition. Experimental condition: pH 8.5, reaction time: 30 min, reaction temperature: 25 oC.
Film thickness were measured ten times to obtain the error bars

Table S3. Mixed Dopamine/catechols solution composition
Sample Mixed solution concentration (g/L)
Dopamine Catechol Hydroquinone Resorcinol
(A) 1.0 - - -
(B) 1.0 1.0 - -
(C) 1.0 - 1.0 -
(D) 1.0 - - 1.0

Figure S4. Scheme of the modification apparatus used to modify microfiltration (MF)
membranes, such as CPVC and PTFE materials.
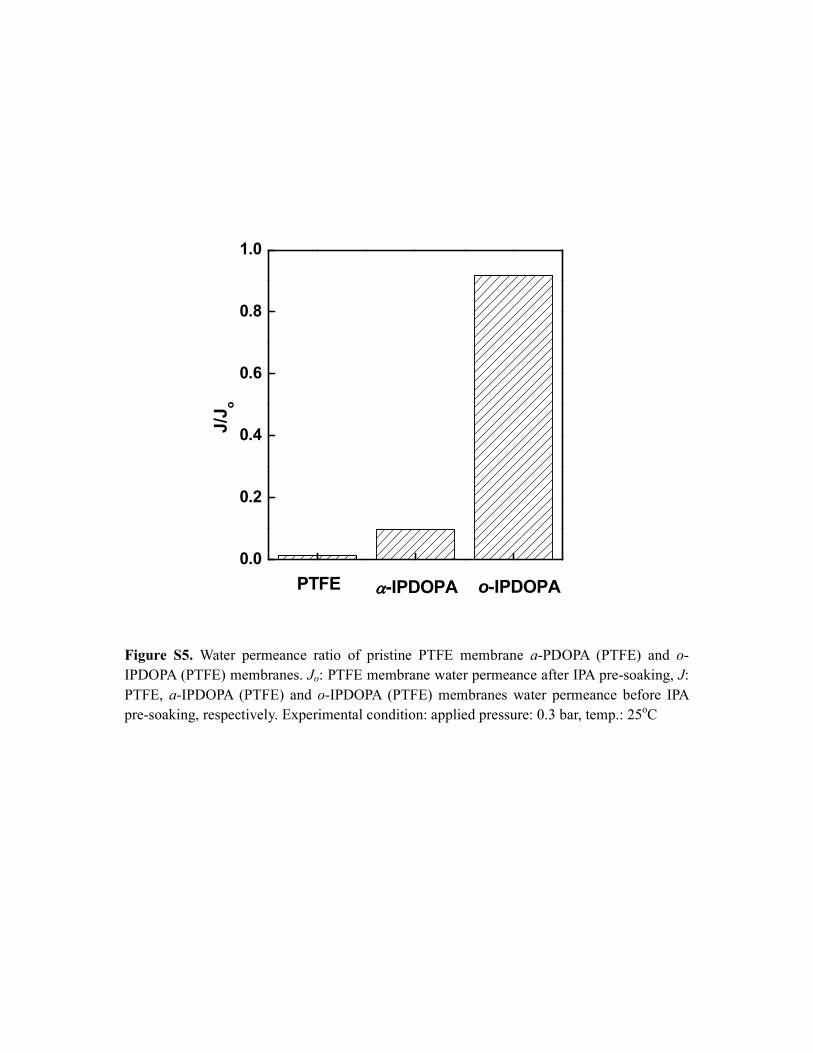
0.0
0.2
0.4
0.6
0.8
1.0
o-IPDOPAαααα-IPDOPA
J/J
o
PTFE
Figure S5. Water permeance ratio of pristine PTFE membrane a-PDOPA (PTFE) and o-
IPDOPA (PTFE) membranes. Jo: PTFE membrane water permeance after IPA pre-soaking, J:
PTFE, a-IPDOPA (PTFE) and o-IPDOPA (PTFE) membranes water permeance before IPA
pre-soaking, respectively. Experimental condition: applied pressure: 0.3 bar, temp.: 25oC

0 5 10 15 20 25 300
20
40
60
80
100
120
Contact angle (o)
H2O Contact Time
Pristine (PTFE)
a-IPDOPA(PTFE)
o-IPDOPA(PTFE)
Modification Time: 30 min
Dopamine Concentration: 2.0 g/L
Figure S6. Water contact angles of pristine PTFE, a-PDOPA (PTFE) and o-PDOPA (PTFE)
as a function of exposure time. In the case of the o-IPDOPA (PTFE) membrane, the water
contact angle dramatically decreased with increasing water contact time, indicating that water
can easily wet the membrane surface and pores. In the case of the PTFE and a-IPDOPA
(PTFE) membranes, the water contact angle only slightly decreased with increasing water
contact time, meaning that water did not easily wet these membranes. The large discrepancy
in contact angle at high H2O contact times between the a-IPODA and o-IPDOPA membranes
can be attributed to the low modification time used for these membranes coupled with the
fact that the oxygen-rich modification proceeds much faster than the ambient modification.

3600 3300 3000 1800 1500
Transmittance (%)
Wavenumber (cm-1)
aromatic C=C vibration
and N-H bending vibration
aromatic C-H vibration
and bonded C-H peak
PDOPA (PTFE)
PTFE
OH band
Figure S7. ATR-FTIR spectra of pristine and dopamine modified PTFE membranes. In the
PDOPA (PTFE) membrane spectra, there are characteristic absorption bands corresponding to
O-H/N-H stretching vibrations at 3000~3500 cm-1
, and the weak and broad absorption bands
at 1595 – 1495 cm-1
were attributed to the overlap of the C=C resonance vibration in aromatic
rings. The N-H bending vibration in aromatic rings at 1595-1495 cm-1
was due to the
dopamine molecules. The absorption band of C-H stretching at around 2950 cm-1
appeared.6
Based on these results, polydopamine was well coated on the PTFE membrane surface.

800 600 400 200
PDOPA (PTFE)
C 1s
C 1sN 1s
O 1sF 1s
Binding Energy (eV)
F 1s
Pristine PTFE
Figure S8. XPS spectra of pristine PTFE and PDOPA (PTFE) membranes. XPS was
performed to study the surface chemical composition of pristine PTFE and PDOPA (PTFE)
membranes. The peak intensity at 290 eV attributed to CF2 was reduced in comparison with
the pristine PTFE membrane, and the new peaks at 400 eV and at 533 eV were assigned to C-
N, and C-O-C, respectively.
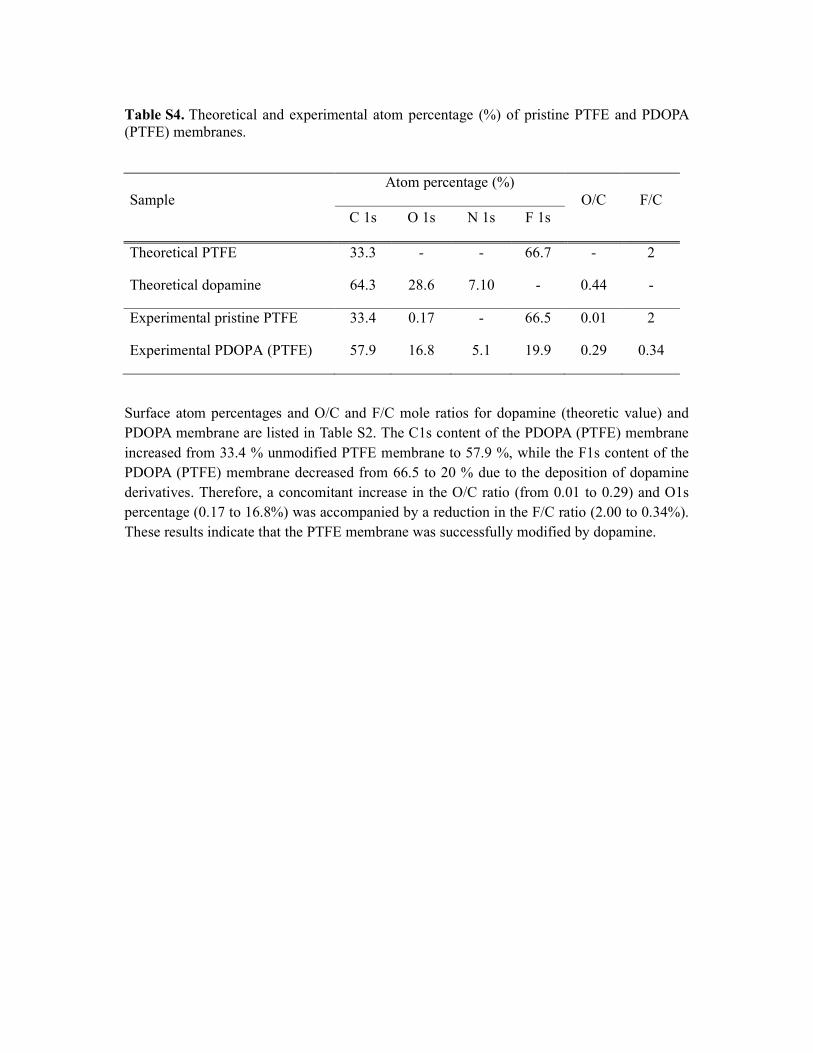
Table S4. Theoretical and experimental atom percentage (%) of pristine PTFE and PDOPA
(PTFE) membranes.
Sample
Atom percentage (%)
O/C F/C
C 1s O 1s N 1s F 1s
Theoretical PTFE 33.3 - - 66.7 - 2
Theoretical dopamine 64.3 28.6 7.10 - 0.44 -
Experimental pristine PTFE 33.4 0.17 - 66.5 0.01 2
Experimental PDOPA (PTFE) 57.9 16.8 5.1 19.9 0.29 0.34
Surface atom percentages and O/C and F/C mole ratios for dopamine (theoretic value) and
PDOPA membrane are listed in Table S2. The C1s content of the PDOPA (PTFE) membrane
increased from 33.4 % unmodified PTFE membrane to 57.9 %, while the F1s content of the
PDOPA (PTFE) membrane decreased from 66.5 to 20 % due to the deposition of dopamine
derivatives. Therefore, a concomitant increase in the O/C ratio (from 0.01 to 0.29) and O1s
percentage (0.17 to 16.8%) was accompanied by a reduction in the F/C ratio (2.00 to 0.34%).
These results indicate that the PTFE membrane was successfully modified by dopamine.

Figure S9. SEM images of the surface morphology of PDOPA (Si) (a): a-PDOPA (Si) and
(b): o-PDOPA (Si). Scale bar (1 µm). Experimental condition: Dopamine concentration: 2.0
g/L, pH 8.5, reaction time: 30 min, reaction temperature: 25 oC.

Figure S10. SEM images of the surface morphology of PDOPA (PES) membrane (a): a-
PDOPA (PES) and (b): o-PDOPA (PES). (Scale bar: 1 µm) Experimental condition:
Dopamine concentration: 2.0 g/L, pH 8.5, reaction time: 30 min, reaction temperature: 25 oC.

Figure S11. SEM images of the surface morphology of PDOPA (PTFE) membranes (a): a-
PDOPA (PTFE) and (b): o-PDOPA (PTFE). Scale bar (1.0 µm). Experimental condition:
Dopamine concentration: 2.0 g/L, pH 8.5, reaction time: 30 min, reaction temperature: 25 oC.
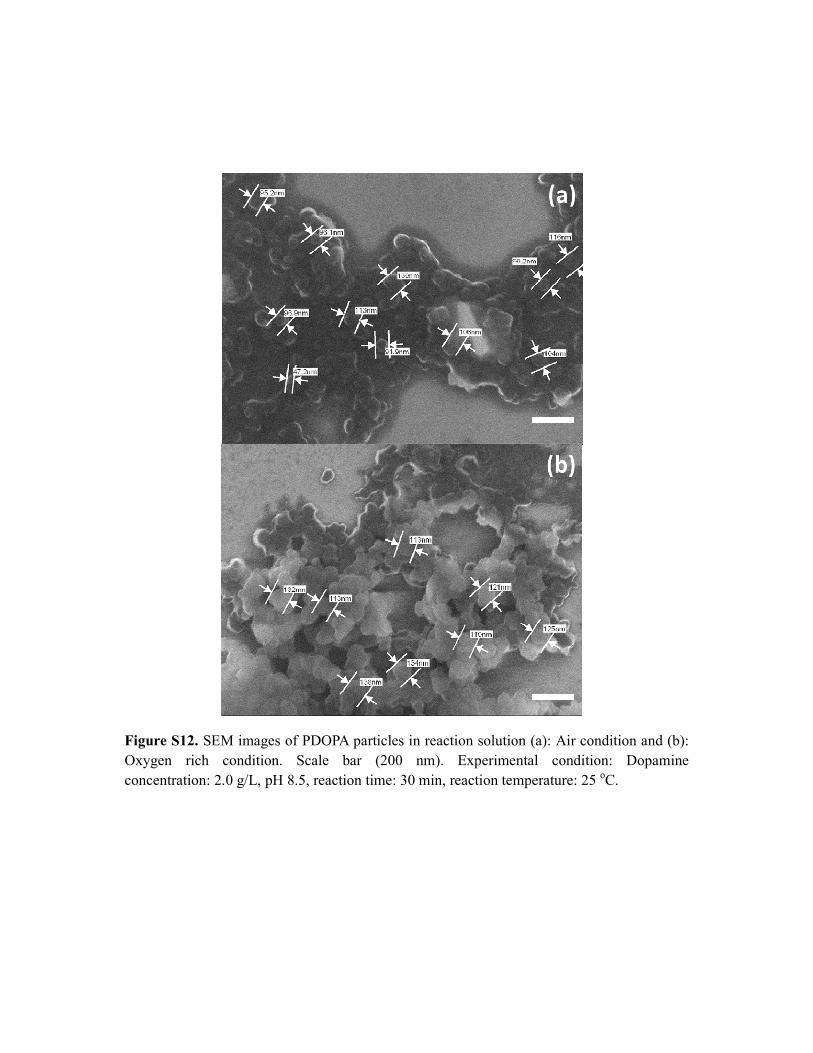
Figure S12. SEM images of PDOPA particles in reaction solution (a): Air condition and (b):
Oxygen rich condition. Scale bar (200 nm). Experimental condition: Dopamine
concentration: 2.0 g/L, pH 8.5, reaction time: 30 min, reaction temperature: 25 oC.
REFFERENCES
1. McCloskey, B. D. et al. Polymer 2010, 51, 3472-3485
2. McCloskey, B. D. et al. J. Phys. Chem. Let. 2011, 2, 1161-1166.
3. McCloskey, B. D. et al. J. Am. Chem. Soc. 2011, 133, 18038-18041.
4. Li, L. & Lubman, D. M. Anal. Chem. 1987, 59, 2538-2541. 5. Allan F. M. B., Handbook of solubility parameters, CRC Press, 1983, 153-157. 6. Jiang, J. et al. Langmuir 2011, 27, 14180-14187.