Oxidative damage and chemokine production dominate days before ...
11
RESEARCH Open Access Oxidative damage and chemokine production dominate days before immune cell infiltration and EAE disease debut Henrik Hasseldam * , Rune Skovgaard Rasmussen and Flemming Fryd Johansen Abstract Background: Multiple sclerosis is widely accepted as an inflammatory disease. However, studies indicate that degenerative processes in the CNS occur prior to inflammation. In the widely used animal model experimental autoimmune encephalomyelitis (EAE), we investigated the significance of degenerative processes from mitochondrial membrane potentials, reactive oxidative species, cell death markers, chemokines, and inflammatory cell types in brain, spinal cord, and optic nerve tissue during the effector phase of the disease, before clinical disease was evident. Methods: Sixty-two rats were placed in eight groups, n = 6 to 10. Four groups were immunized with spinal cord homogenate emulsified in complete Freund’s adjuvant (one served as EAE group), three groups were immunized with complete Freund’s adjuvant only, and a control group was injected with phosphate buffered saline only. Groups were sacrificed 3, 5, 7, or 12–13 days after the intervention and analyzed for early signs of CNS degeneration. Results: Loss of mitochondrial membrane potential and oxidative changes was observed days before clinical disease debut at day 9.75 ± 0.89. The early mitochondrial changes were not associated with cytochrome C release, cleavage of caspases 9 (38/40 kDa) and 3 (17/19 kDa), and cleavage of PARP (89 kDa) or spectrin (120/150 kDa), and apoptosis was not initiated. Axonal degeneration was only present at disease onset. Increases in a range of cytokines and chemokines were observed systemically as a consequence of immunization with complete Freund’s adjuvant, whereas the encephalitogenic emulsion induced an upregulation of the chemokines Ccl2, Ccl20, and Cxcl1, specifically in brain tissue, 7 days after immunization. Conclusion: Five to seven days after immunization, subtle decreases in the mitochondrial membrane potential and an increased reactive oxygen species burden in brain tissue were observed. No cell death was detected at these time-points, but a specific expression pattern of chemokines indicates activity in the CNS, several days before clinical disease debut. Keywords: Experimental autoimmune encephalomyelitis, Neuronal degeneration, Chemokines, Reactive oxygen species, CNS inflammation * Correspondence: [email protected] Department of Biomedical Sciences, Faculty of Health, University of Copenhagen, Ole Maaloes vej 5, DK-2200 Copenhagen, Denmark © 2016 The Author(s). Open Access This article is distributed under the terms of the Creative Commons Attribution 4.0 International License (http://creativecommons.org/licenses/by/4.0/), which permits unrestricted use, distribution, and reproduction in any medium, provided you give appropriate credit to the original author(s) and the source, provide a link to the Creative Commons license, and indicate if changes were made. The Creative Commons Public Domain Dedication waiver (http://creativecommons.org/publicdomain/zero/1.0/) applies to the data made available in this article, unless otherwise stated. Hasseldam et al. Journal of Neuroinflammation (2016) 13:246 DOI 10.1186/s12974-016-0707-3
Transcript of Oxidative damage and chemokine production dominate days before ...

RESEARCH Open Access
Oxidative damage and chemokineproduction dominate days before immunecell infiltration and EAE disease debutHenrik Hasseldam*, Rune Skovgaard Rasmussen and Flemming Fryd Johansen
Abstract
Background: Multiple sclerosis is widely accepted as an inflammatory disease. However, studies indicate thatdegenerative processes in the CNS occur prior to inflammation. In the widely used animal modelexperimental autoimmune encephalomyelitis (EAE), we investigated the significance of degenerative processesfrom mitochondrial membrane potentials, reactive oxidative species, cell death markers, chemokines, andinflammatory cell types in brain, spinal cord, and optic nerve tissue during the effector phase of the disease,before clinical disease was evident.
Methods: Sixty-two rats were placed in eight groups, n = 6 to 10. Four groups were immunized with spinalcord homogenate emulsified in complete Freund’s adjuvant (one served as EAE group), three groups wereimmunized with complete Freund’s adjuvant only, and a control group was injected with phosphate bufferedsaline only. Groups were sacrificed 3, 5, 7, or 12–13 days after the intervention and analyzed for early signs of CNSdegeneration.
Results: Loss of mitochondrial membrane potential and oxidative changes was observed days before clinical diseasedebut at day 9.75 ± 0.89. The early mitochondrial changes were not associated with cytochrome C release, cleavage ofcaspases 9 (38/40 kDa) and 3 (17/19 kDa), and cleavage of PARP (89 kDa) or spectrin (120/150 kDa), and apoptosis wasnot initiated. Axonal degeneration was only present at disease onset. Increases in a range of cytokines and chemokineswere observed systemically as a consequence of immunization with complete Freund’s adjuvant, whereas theencephalitogenic emulsion induced an upregulation of the chemokines Ccl2, Ccl20, and Cxcl1, specifically in braintissue, 7 days after immunization.
Conclusion: Five to seven days after immunization, subtle decreases in the mitochondrial membrane potentialand an increased reactive oxygen species burden in brain tissue were observed. No cell death was detected atthese time-points, but a specific expression pattern of chemokines indicates activity in the CNS, several daysbefore clinical disease debut.
Keywords: Experimental autoimmune encephalomyelitis, Neuronal degeneration, Chemokines, Reactive oxygenspecies, CNS inflammation
* Correspondence: [email protected] of Biomedical Sciences, Faculty of Health, University ofCopenhagen, Ole Maaloes vej 5, DK-2200 Copenhagen, Denmark
© 2016 The Author(s). Open Access This article is distributed under the terms of the Creative Commons Attribution 4.0International License (http://creativecommons.org/licenses/by/4.0/), which permits unrestricted use, distribution, andreproduction in any medium, provided you give appropriate credit to the original author(s) and the source, provide a link tothe Creative Commons license, and indicate if changes were made. The Creative Commons Public Domain Dedication waiver(http://creativecommons.org/publicdomain/zero/1.0/) applies to the data made available in this article, unless otherwise stated.
Hasseldam et al. Journal of Neuroinflammation (2016) 13:246 DOI 10.1186/s12974-016-0707-3

BackgroundMultiple sclerosis (MS) is widely accepted as an inflam-matory disease with a primary autoimmune component.The immune system plays a central role in the patho-genesis of the disease but the etiology remains unknown[1]. In the clinic and according to the Revised McDonaldCriteria, a diagnosis of MS may be supported by opticalcoherence tomography to detect early optic neuritis,magnetic resonance imaging for observation of multiplecentral nervous system (CNS) areas with neuronal dam-age, a cerebrospinal fluid analysis to investigate presenceof non-specific inflammation markers, and visual evokedpotentials to examine brain processing speed, althoughultimately the diagnosis is a clinical diagnosis [2]. Highdoses of intravenous corticosteroids like methylpredniso-lone may be used for short-term treatment of symptoms,while long-term treatment include interferon (beta-1bor 1a), glatiramer acetate, natalizumab, and newer ther-apeutics like dimethylfumarate, teriflunomide, and fin-golimod [3]. Common to these long-term treatmentregimens is that the earlier they are administered tothe patients, the more effective they are. Thus, earlydiagnosis is paramount in order to provide optimaltreatment, thereby implicating a need to establish reli-able translational experimental models for MS diseaseinduction.Although experimental autoimmune encephalomyelitis
(EAE) is the most frequently used model for MS, EAEhas several caveats compared to MS. One major differ-ence is that EAE is induced by active immunization withCNS antigens, whereas the reason behind MS seems tobe an interplay between genetic and environmental factors[4]. In addition, plaque composition and inflammatory celltypes also differ between EAE and MS. Whereas EAE isdriven primarily by CD4+ T cells, MS infiltrates alsocontain a high number of CD8+ T cells [5]. Investigatorsshould be cautious of assuming a direct parallel whencomparing EAE and MS.Because EAE is an active immunization with myelin an-
tigens, the general dogma is that disease induction re-quires the presence of activated encephalitogenic T cells inthe CNS. Thus, it is puzzling that several studies haveshown neural degeneration and death at stages in diseasedevelopment where no inflammatory cells are present inthe CNS. Investigators have found apoptosis in retinalganglion cells as early as 5 days after immunization [6],whereas others report that mitochondria-derived oxidativestress 3 days after immunization results in oligodendrocy-tic and neuronal apoptosis [7]. Furthermore, administra-tion of the anti-oxidant SOD2 has been shown to reducetissue damage significantly, suggesting a causal relation-ship between oxidative stress and neural cell death [8]. Inaddition, axonal degeneration and loss has been shown tooccur 7 days post-immunization, several days prior to
inflammatory infiltration, myelin destruction, and clinicaldisease debut [9, 10]. Taken together, these papers indicatethat axonal loss in EAE may precede inflammation anddemyelination, partially mediated by oxidative stress. Pro-viding further light to the etiology of multiple sclerosis, re-cent findings indicate that blood-brain barrier disruptionmay be one of the earliest symptoms leading to MS, wherefibrinogen enters the CNS and leads to formation of in-soluble fibrin, increased thrombin activity, activation of in-nate immunity, and inflammatory demyelination [11–13].In order to further investigate and systematically
characterize events prior to inflammation and demye-lination, we induced EAE in the Dark Agouti rat strainusing spinal cord homogenate emulsified in completeFreund’s adjuvant (CFA) resulting in 100 % disease inci-dence. The brain, spinal cord, cerebrospinal fluid, andperipheral blood were isolated after immunization andanalyzed for early signs of degeneration in the form ofoxidative damage, neuronal and glial apoptosis and ne-crosis, and cytokine and chemokine production, as wellas inflammatory infiltration.
MethodsAnimalsFemale Dark Agouti rats (10–12 weeks old, Harlan,Boxmeer, The Netherlands) were housed three per cagein conventional cages with free access to food and wateron 12-h light/dark cyclus. All animal procedures wereconducted in accordance with the guidelines of the DanishAnimal Experiments Committee (#2012-DY-2934-00001)and the Department of Experimental Medicine, Universityof Copenhagen.
EAE inductionIn order to induce EAE, the animals were immunized bysubcutaneously injecting 150 μl emulsification consistingof spinal cord homogenate in phosphate buffered saline(PBS) (1:2; v/w) and CFA (1:1; v/v), at the tail root. Pre-vious studies have shown that this immunization regi-men results in 100 % disease induction [14, 15]. CFAcontrols were immunized with the same amount ofemulsion without the spinal cord homogenate, whereasthe PBS animals were injected with PBS only. Duringthis procedure, the animals were anesthetized using 3 %isoflurane in a mixture of O2 and N2O (2:1). Immuniza-tions were conducted completely randomized in orderto minimize cage, experimental, and seasonal variability.
Experimental groupsA total of eight experimental groups were included inthe study. One PBS group (n = 6) sacrificed 5 dayspost-injection; three CFA groups sacrificed 3 (CFA 3,n = 6), 5 (CFA 5, n = 8), and 7 (CFA 7, n = 8) days post-immunization (DPI); three spinal cord homogenate +
Hasseldam et al. Journal of Neuroinflammation (2016) 13:246 Page 2 of 11

CFA groups sacrificed 3 (3 DPI, n = 8), 5 (5 DPI, n = 10), 7(7 DPI, n = 10), and 12–13 (EAE, n = 6) DPI. EAE animalswere scored on a daily basis for clinical disease symptomsaccording to the EAE clinical scoring system (0: no clinicalsymptoms to 6: moribund or dead) devised by the DanishAnimal Experiments Inspectorate. When the scoresreached 2, animals were provided with food and water-gelat the bottom of the cage. If the animals reached a scoreabove 4, or if weight loss exceeded 20 %, the animals wereeuthanized.
Tissue preparationAfter the animal was removed from the stereotaxicframe, still under anesthesia, the femoral vein was ex-posed and a catheter inserted. Blood was withdrawninto heparinized micro-centrifuge tubes, centrifuged at400×g for 8 min, and the aspirated plasma layer storedat −80 °C for later analysis. The cell pellet was resus-pended in red blood cell lysis buffer (Biolegend, California,USA), incubated on ice for 5 min, centrifuged (400×g,8 min), and frozen. The animals were perfused with100 ml ice-cold PBS, pH = 7.2, and decapitated underdeep isoflurane anesthesia.One random brain hemisphere was frozen in isopen-
tane and stored at −80 °C and the other processed formitochondrial isolation (see below).Pieces of tissue from the cervical, thoracic, and lumbar/
sacral regions of the spinal cord were frozen in isopentaneand stored at −80 °C, processed for mitochondrial isola-tion, or frozen in isopentane at −80 °C, and embedded inTissue-Tek® O.C.T. compound (Sakura Finetek, AlphenAan Den Rijn, The Netherlands) for cutting. The rightliver lobe was frozen in isopentane and stored at −80 °C.The optic nerve was frozen in isopentane at −80 °C andembedded in Tissue-Tek® O.C.T. compound (Sakura Fine-tek) for sectioning.
Quantification of mitochondrial membrane potentialNo more than 1 h after isolation, the brain and spinalcord were processed for mitochondrial isolation andanalysis. In a Dounce homogenizer, the cells were gentlyhomogenized in DMEM (Thermo Fisher Scientific,Massachusetts, USA) and the mitochondria were iso-lated with differential centrifugation before resuspensionin respiration buffer (according to the manufacturer’s in-structions, Mitochondria isolation kit, Sigma-Aldrich). Themitochondrial suspension was processed immediately forquantification of membrane potential or stored at −80 °Cfor later analysis. The membrane potential in the suspen-sion was quantified with the lipophilic cationic fluorescentdye JC-1 (Sigma-Aldrich). The dye accumulates in themitochondrial matrix as a function of the electrochemicalgradient across the inner mitochondrial membrane. Whenexcited at 490 nm, the emission spectrum is dependent on
the concentration of JC-1. At higher concentrations, ag-gregates will form and the fluorophore will emit at590 nm, whereas dilute solutions will result in emission at527 nm. After addition of JC-1, the samples were incu-bated 10 min before measuring fluorescent intensity every5 min for 60 min on a Fluostar Optima (BMG Labtech,Offenburg, Germany). The 590:525 nm ratio was used toassess the mitochondrial membrane potential where a de-crease indicates mitochondrial depolarization. Controlruns were always performed to test the specificity of theassay, by the addition of valinomycin, a K+-specific trans-porter which results in complete dissipation of the mem-brane potential (Sigma-Aldrich).
ImmunohistochemistryThe embedded spinal cord and optic nerve were cut into10-μm sections on a Leica CM 3000 cryostat (LeicaMicrosystems, Wetzlar, Germany). For detection of 8-hydroxydeoxyguanosine (8-OHdG), a modified base gen-erated due to reactions with hydroxyl radicals, the tissuesections were fixed in acetone for 2 × 10 min. This wasfollowed by incubation in 2 M HCl for 10 min to denaturethe double-stranded helix and then proteinase K treat-ment (10 μg/ml) for 8 min to remove DNA-associatedproteins. After blocking in 5 % goat serum, the sectionswere incubated with the anti-8-OHdG antibody (1:300,Abcam, Cambridge, UK) overnight at 4 °C. Following in-cubation with chromeo 546-conjugated goat anti-mouseantibody (1:600) for 1 h, the sections were mounted withVectashield mounting medium with DAPI (Vector Labs,Burlingame, California, USA). Positive “spots” in two rep-resentative areas each from the white and gray matter inthe spinal cord, as well as the entire optic nerve cross sec-tion were identified. They were given a score from 1 to 3according to size, and the total sum is given for eachgroup. Only spots coinciding with DAPI staining (about90 %) were included in the quantification. The countingwas performed blinded using the Axiovert 200M LSM520 and the software LSM 510 META (Carl Zeiss,Oberkochen, Germany). Spinal cord cross sections werefurthermore stained with Luxol fast blue and cresyl vio-let in order to detect demyelination. Briefly, 16 sectionsfrom each of the PBS, CFA 7, 3 dpi, 7 dpi, and EAE ani-mals were stained overnight at 57 °C in 0.1 % Luxol fastblue. After washing, the staining was differentiated in0.05 % lithium carbonate for 30 s, followed by washingand staining in 0.1 % cresyl violet for 10 min. After dif-ferentiation in 95 % ethanol, the sections were mountedin CC/Mount (Sigma-Aldrich) and the staining was an-alyzed using a Leica DMRBE microscope (Leica Micro-systems). In addition, 16 sections from each of thesame groups as mentioned above were stained withanti-CD3 antibody (1:100, Abcam). Briefly, the sectionswere blocked with 5 % goat serum for 30 min, followed
Hasseldam et al. Journal of Neuroinflammation (2016) 13:246 Page 3 of 11
by incubation overnight with the primary antibody. Afterwashing, the sections were incubated with biotinylated goatanti-rabbit antibody (1:500, Dako, Glostrup, Denmark) for1 h, followed by washing and incubation with ABC com-plex (avidin/biotin-peroxidase, Vectorlabs, California, USA)according to the manufacturer’s instructions. After thor-ough washing, incubation with DAB for 5 min was followedby mounting in CC/Mount (Sigma-Aldrich). Identificationof CD3+ cells was performed blinded on a Leica DMRBEmicroscope (Leica Microsystems).
Semi-quantitative determination of reactive oxygen/nitrogen species-induced degenerationFor western blotting, the brain, spinal cord, and liverwere homogenized in RIPA buffer (200 mg tissue/mlbuffer: 25 mM Tris HCl, pH 7.6; 150 mM NaCl; 1 %NP-40; 1 % sodium deoxycholate; 0.1 % SDS) includinga cocktail of protease inhibitors (Complete mini, Roche,Penzberg, Germany) using a Dounce homogenizer. Aftercentrifugation (2 × 12.000×g, 20 min), total proteindetermination (660 nm protein assay, Thermo FisherScientific, Massachusetts, USA) was performed followedby polyacrylamide gel electrophoresis and transfer ontoPVDF (Thermo Fisher Scientific) membranes. Afterblocking, the membranes were probed with antibodiesagainst carbonylated amino acid side chains (Oxyblotdetection kit, Millipore, Massachusetts, USA), nitratedtyrosine residues (1:1000, Abcam), cleaved caspase 3(17/19 kDa, 1:1000, Cell Signaling Technology (CST),Massachusetts, USA), cleaved caspase 9 (38/40 kDa,1:1000, CST), cleaved PARP (89 kDa, 1:1000, CST),calpain-1 large subunit (75/80 kDa, CST), cleavedalpha-II spectrin (150/120 kDa, 1:1000, CST), non-phosphorylated Neurofilament Heavy (NF-H, 200/180 kDa,1:1000, Abcam), and α-tubulin (1:2500, Abcam). Primaryantibody incubations were followed by HRP-coupled anti-IgG antibody (anti-mouse and anti-rabbit, 1:20,000, JacksonImmunoresearch, Pennsylvania, USA) incubation, ECL(Thermo Fisher Scientific) incubation, and develop-ment on CL-XPosure films (Thermo Fisher Scientific).Band or whole lane intensity was quantified using thesoftware ImageJ, and data normalized to α-tubulin.
Quantification of cytochrome C, neurofilament-H, andchemokine/cytokine productionDetermination of cytochrome C in cytoplasmic andmitochondrial fractions was performed after mitochon-drial isolation from the brain and spinal cord accordingto the manufacturer’s instructions (Profiling ELISA kit,Abcam).Determination of NF-H levels in the plasma was per-
formed using ELISA (USBio, Massachusetts, USA), ac-cording to the manufacturer’s instructions.
Determination of chemokine/cytokine levels in theplasma and brain was done using the Bioplex multiplexsystem (Biorad, California, USA) according to the manu-facturer’s instructions.
Statistical analyses590:520 nm ratios are given as mean values and com-pared using the Kruskal-Wallis test followed by Dunn’smultiple comparison test. Data obtained from the semi-quantitative determinations of whole lane or specificband intensity in western blots are given as mean ± SEMand compared using one-way ANOVA followed byBonferroni’s multiple comparisons test. 8-OHdG in-tensity in nuclei in optic nerve cross sections are givenas mean ± SEM and compared using Kruskal-Wallisfollowed by Dunn’s multiple comparisons test. Cytokine/chemokine, NF-H, and cytochrome C concentrations aregiven as mean ± SEM and compared using one-wayANOVA followed by Bonferroni’s multiple comparisonstest. A number of T cells and neutrophil granulocytes inthe peripheral blood and brain are compared using one-way ANOVA followed by Bonferroni’s multiple compari-sons test. p < 0.05 was considered statistically significant.
ResultsDisease characteristicsEarlier studies in our group have shown 100 % diseaseincidence following immunization with spinal cordhomogenate emulsified in CFA [16, 17]. In this study,we also observed 100 % disease induction in the EAEgroup (mean day of disease debut 9.75 ± 0.89; mean re-lapse peak 12.50 ± 0.76; mean clinical score 3.50 ± 0.75,Fig. 1a).
Mitochondrial degenerationIt is firmly established that irreversible demise of neuralcells, following exposure to various insults, is linked to adecrease in the potential across the inner mitochondrialmembrane (Δψ
m) [7, 18, 19]. This typically coincideswith the release of cytochrome C from the mitochon-drial intramembrane space to the cytoplasm resulting inapoptosome formation, activation of caspase 9, and in-duction of apoptosis [20]. Therefore, we quantified Δψ
m
and cytochrome C in brain and spinal cord tissue fromthe animals (Fig. 1b–e).No differences in Δψ
m were found between PBS, CFA 5,and the 3 DPI animals, whereas a significant decrease—15–19 % reduction in area under the curve—was observed inthe brain at days 5 and 7 post-immunization (Fig. 1b) andin the spinal cord at 7 days after immunization (Fig. 1c).This depolarization across the inner membrane could indi-cate that the electron transport chain is compromised orthat the outer membrane is leaky, causing proton loss.Thus, we furthermore monitored cytochrome C release to
Hasseldam et al. Journal of Neuroinflammation (2016) 13:246 Page 4 of 11

the cytoplasm (Fig. 1d, e). Significant loss of cytochrome Cfrom the mitochondria was only evident after disease debutin the EAE animals, although we observed a tendency atdays 5 and 7 after immunization.
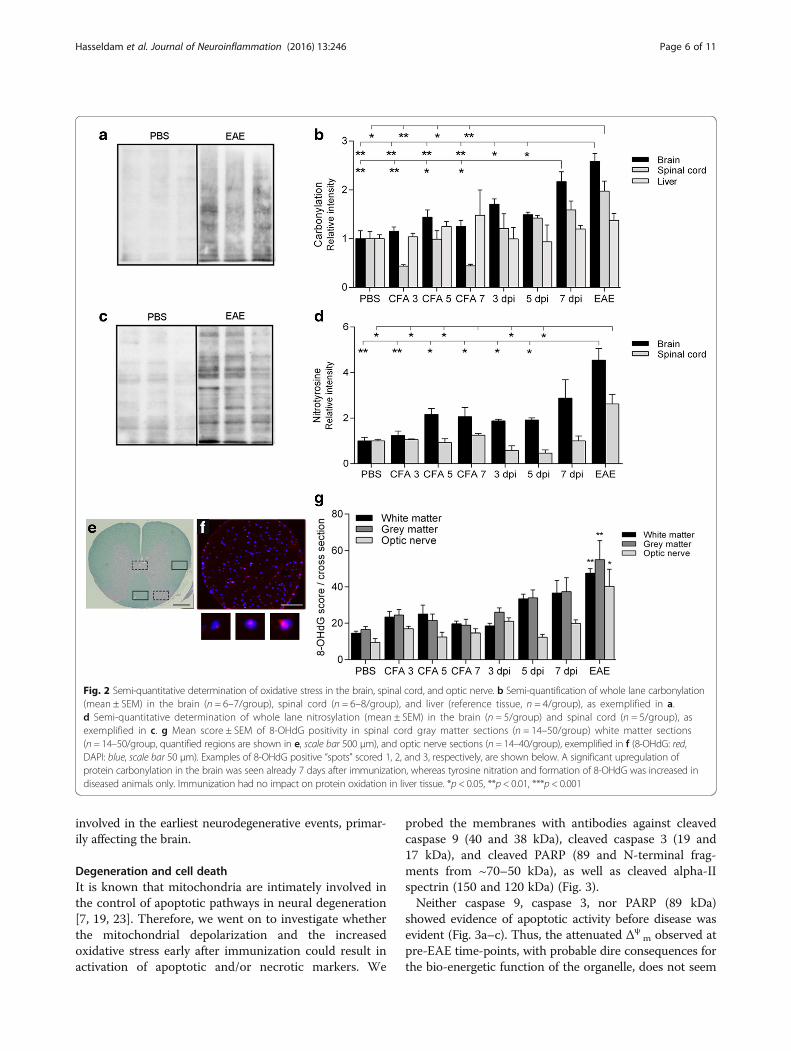
Oxidative changes in the brain, spinal cord, and optic nerveIt is known that disturbances in Δψ
m are intimately in-volved in redox homeostasis within the cell [21].Therefore, we next monitored the level of oxidation insnap-frozen homogenates from the brain and spinalcord as well as cryosectioned optic nerves. We did thatby estimating the amount of protein carbonylation as amarker for reactive oxygen species-induced modifica-tions of amino acid side chains, nitrotyrosine as amarker for peroxynitrite-mediated nitration, and 8-OHdG as a marker for oxidative DNA damage (Fig. 2).
A significant increase in the amount of carbonylatedproteins was seen in brain tissue from 7 days afterimmunization (2.2-fold) and EAE animals (2.6-fold)(Fig. 2b). This coincides with the early decrease in Δψ
m,probably reflecting reactive oxygen species-induced dam-age to components of the electron transport chain [22]. Incontrast, the nitration of tyrosine residues was increasedin EAE animals only (4.6-fold, Fig. 2d).Noteworthy amounts of 8-OHdG, a modified base that
serves as a marker for oxidative modifications in DNA in-duced by the hydroxyl radical (•OH), were seen in allgroups, probably owing to atmospheric exposure (Fig. 2g).A tendency towards an increase was seen in the spinalcord from the 7 DPI animals (p < 0.078), whereas signifi-cant increases were seen in both the spinal cord and opticnerve in EAE (~2.6-fold upregulation compared to theCFA 7 animals). Thus, oxidative stress seems to be
Fig. 1 Disease curve of the EAE animals and determination of Δψm and cytochrome C release in the brain and spinal cord. The EAE animals
were sacrificed between days 11 and 13, all with a clinical score ≥3 (a). The mitochondrial membrane potential was monitored continuouslyevery 3 min, for 60 min, in the brain (b) and spinal cord (c) isolates. The ratio was significantly higher in the PBS and the CFA 5 groups comparedto the 5 and 7 DPI groups in both the brain and spinal cord (mean ± SEM, (p < 0.01). Loss of cytochrome C from the mitochondrial to the cytoplasmicfraction in the brain (d) and spinal cord (e) was only significant in the EAE group, whereas the 7 dpi group showed a tendency (p < 0.059) towardsdecreased amounts in the mitochondrial fraction, compared to the CFA 7 group. n = 5 in each group in d and e (data are presented as mean ± SEM,*p < 0.05, **p < 0.01)
Hasseldam et al. Journal of Neuroinflammation (2016) 13:246 Page 5 of 11
involved in the earliest neurodegenerative events, primar-ily affecting the brain.
Degeneration and cell deathIt is known that mitochondria are intimately involved inthe control of apoptotic pathways in neural degeneration[7, 19, 23]. Therefore, we went on to investigate whetherthe mitochondrial depolarization and the increasedoxidative stress early after immunization could result inactivation of apoptotic and/or necrotic markers. We
probed the membranes with antibodies against cleavedcaspase 9 (40 and 38 kDa), cleaved caspase 3 (19 and17 kDa), and cleaved PARP (89 and N-terminal frag-ments from ~70–50 kDa), as well as cleaved alpha-IIspectrin (150 and 120 kDa) (Fig. 3).Neither caspase 9, caspase 3, nor PARP (89 kDa)
showed evidence of apoptotic activity before disease wasevident (Fig. 3a–c). Thus, the attenuated Δψ
m observed atpre-EAE time-points, with probable dire consequences forthe bio-energetic function of the organelle, does not seem
Fig. 2 Semi-quantitative determination of oxidative stress in the brain, spinal cord, and optic nerve. b Semi-quantification of whole lane carbonylation(mean ± SEM) in the brain (n = 6–7/group), spinal cord (n = 6–8/group), and liver (reference tissue, n = 4/group), as exemplified in a.d Semi-quantitative determination of whole lane nitrosylation (mean ± SEM) in the brain (n = 5/group) and spinal cord (n = 5/group), asexemplified in c. g Mean score ± SEM of 8-OHdG positivity in spinal cord gray matter sections (n = 14–50/group) white matter sections(n = 14–50/group, quantified regions are shown in e, scale bar 500 μm), and optic nerve sections (n = 14–40/group), exemplified in f (8-OHdG: red,DAPI: blue, scale bar 50 μm). Examples of 8-OHdG positive “spots” scored 1, 2, and 3, respectively, are shown below. A significant upregulation ofprotein carbonylation in the brain was seen already 7 days after immunization, whereas tyrosine nitration and formation of 8-OHdG was increased indiseased animals only. Immunization had no impact on protein oxidation in liver tissue. *p < 0.05, **p < 0.01, ***p < 0.001
Hasseldam et al. Journal of Neuroinflammation (2016) 13:246 Page 6 of 11

to be related to cytochrome C release with activation ofcaspases 9 and 3 and subsequent 89 kDa PARP fragmenta-tion. In EAE animals, the apoptotic machinery is activatedboth in the brain and spinal cord due to both neural andleukocytic death. However, cleavage of PARP into severalalternative fragments at around 55, 64, and 68 kDa oc-curred in the 7 DPI animals as well as the EAE animals(Fig. 3c). Proteases other than caspase 3 are known tocleave PARP into fragments of various sizes, and the pat-tern observed here could indicate calpain-1 activity [24].This, together with the fact that a decrease in Δψ
m isknown to be associated with necrotic cell death as well[25], prompted us to look at the cleavage pattern of thecalpain-1 substrate alpha-II spectrin. However, spectrincleavage into 120- and 150-kDa fragments, known to bepresent during apoptosis as well [26], was only observedin the diseased animals (Fig. 3d).
In order to clarify whether any neurodegenerative pro-cesses take place before inflammatory cell infiltration,we determined the levels of a dephosphorylated epitopein NF-H (Fig. 4a), shown to be associated with earlyaxonal degeneration [27]. In addition, we also testedwhether we could detect NF-H in the plasma as amarker of axonal destruction (Fig. 4b). However, degen-eration and cleavage of axons, with subsequent releaseof axonal components to plasma, were only detectablein the EAE animals.
Inflammatory responses in the brain and peripheral bloodNext we wanted to investigate whether an inflammatoryresponse in the CNS could be a causal factor behind thesubtle degenerations seen at day 7 post-immunization.Presence of T cells (Fig. 5a) and a panel of chemokines/cytokines (Fig. 5c, d) were analyzed at early time-points
Fig. 3 Semi-quantitative determination of cleaved caspase 9, cleaved caspase 3, cleaved PARP, and cleaved alpha-II spectrin in the brain andspinal cord. The apoptotic markers cleaved caspase 9 (a, n = 6/group), cleaved caspase 3 (b, n = 6/group), and cleaved PARP (89 kDa, c, n = 6/group) are increased in EAE animals only. The N-terminal PARP fragments (55 and 68 kDa, c) are upregulated in 7 DPI animals also. Cleavedalpha-II spectrin (d, n = 6/group) is increased in EAE animals only. α-Tubulin is included as loading control. Mean ± SEM. *p < 0.05, **p < 0.01,***p < 0.001 compared to CFA 7 animals
Hasseldam et al. Journal of Neuroinflammation (2016) 13:246 Page 7 of 11

after immunization. We furthermore stained for myelinin spinal cord cross sections (Fig. 5b) to determinewhether any early demyelination was occurring.We were not able to detect any CD3+ T cells in spinal
cord tissue before disease was evident clinically (Fig 5a).Furthermore, no demyelination was detected in pre-disease animals (Fig. 5b).Given that no significant CNS influx of immune cells
occurs at 7 dpi, the mitochondrial (Fig. 1b) and oxidative(Fig. 2b) alterations observed are probably caused by fac-tors unrelated to direct immune cell cytotoxicity.In the plasma, the concentration of several chemo-
kines/cytokines significantly increased as a consequenceof immunization with both CFA and with spinal cordhomogenate + CFA, compared to the PBS group (Fig. 5c).With regard to IFN-γ and IL-17, the increase was po-tentiated when spinal cord homogenate was present,pointing towards their role as effector cytokines inEAE. IFN-γ increased from 137 pg/ml in the CFA 7 an-imals to 1302 pg/ml in the 7 DPI animals and 890 pg/ml in the EAE animals. IL-17 went from 50 pg/ml inthe CFA 7 animals to 816 pg/ml in the 7 DPI animalsand 836 pg/ml in the EAE animals.
In the brain, a more tightly regulated response wasseen (Fig. 5d), especially with regard to the chemokinesCxcl1, Ccl2, and Ccl20, which were highly upregulatedalready in the 7 DPI animals, indicating that specifichoming to the CNS occurs after administration of an en-cephalitogenic emulsion. At this time-point, no or veryfew inflammatory cells have infiltrated the CNS, thussignifying that these chemoattractants are produced bynon-infiltrating immune cells very early during diseasedevelopment, as indicated by a previous study [28]. Fur-thermore, significantly increased levels of IFN-γ, IL-17,and GM-CSF were seen in the EAE group (Fig. 5d), asshown previously [23].
DiscussionThis study investigated the significance of a range of de-generative processes including changes in mitochondrialmembrane potentials, redox levels, and cell deathmarkers, as well as T cells and mediators in brain, spinalcord, and optic nerve tissue, in pre-disease stages ofEAE. We found subtle decreases in the mitochondrialmembrane potential, coupled with an increased reactiveoxygen species burden in brain tissue at 5–7 days afterimmunization. This was associated with a specific ex-pression pattern involving the chemokines Ccl2, Ccl20,and Cxcl1. Degenerative processes at late time-points in-cluded increased oxidative stress and PARP fragmenta-tion at day 7 after immunization, but these events didnot trigger caspase-mediated or necrotic cell death.Thus, neural degeneration and cell death are either ab-sent or below our threshold of detection, before diseaseactivity is present.Early degenerative changes specifically related to mito-
chondria in EAE have been reported, and this organelleis known to be involved in both early and late phases ofcell death [19, 25]. Already 3 days after immunization,investigators have observed reductions in Δψ
m and in-creases in both nitrative stress and apoptosis [7, 8].However, they used the cationic and lipophilic fluores-cent probe Mitotracker Red to monitor Δψ
m, which mayexhibit different properties compared to JC-1. Data indi-cate that Mitotracker Red is sensitive to Δψ
m in culturedneurons, but insensitive in astrocytes, and moreoverseems sensitive to reactive oxygen species burden [29].We did not detect differences in the levels of nitratedtyrosine residues before EAE onset, in mitochondrialisolates and whole tissue homogenates, in contrast toprevious results by other investigators [7]. However, theydetected very low levels of nitrotyrosine in the controlanimals, whereas we saw several nitrated bands in thePBS group (Figs. 1e and 2c). A possible explanation forthis discrepancy is that peroxynitrite formation and sub-sequent nitration spontaneously occurred during the iso-lation procedure in respiration buffer containing ATP
Fig. 4 Levels of non-phosphorylated NF-H (SMI-32) in the brain(n = 6–9/group) and spinal cord (n = 6–8/group) and NF-H in theplasma (n = 6–10/group). Non-phosphorylated NF-H (a) as well asNF-H in the plasma (b) are increased in EAE animals only. α-Tubulin isincluded as loading control. Mean ± SEM. *p < 0.05, **p < 0.01,compared to the CFA 7 group
Hasseldam et al. Journal of Neuroinflammation (2016) 13:246 Page 8 of 11

and succinate. Nitration of key mitochondrial proteinssuch as subunits of the mitochondrial respiratory chaincomplexes I and IV and mitochondrial heat shock pro-tein 70 were identified in the Qi study [7]. The nitrationand possible subsequent inactivation of these proteinscould be causally linked to the decreased mitochondrialmembrane potential we observed at 5 and 7 days post-immunization.Our finding, that significant loss of cytochrome C
from the mitochondria was evident only after disease de-but in the EAE animals, indicates that activation of theintrinsic apoptotic pathway, and thereby execution ofprogrammed cell death, occurs at a relatively late time-point where inflammatory cells have entered the CNSand disease activity is present.Several reports have shown that axonal degeneration
precedes inflammatory and demyelinating events inmyelin-immunized EAE animals [6, 7, 9, 10]. Two stud-ies by different investigators have shown axonal andneuronal loss at 5 and 7 days post-immunization, re-spectively [6, 10]. Both studies used manual counting ofretinal ganglion cells in the medial dorsal column. Thesedata differ from our findings, where cell death was non-detectable before EAE onset (Fig. 4). Instead of manualcounting for detection of neuronal/axonal loss, we inves-tigated whether caspase 9 or caspase 3 were activated,
and furthermore if NF-H could be detected in serum asa sign of axonal degeneration [30, 31]. These investiga-tions were negative in our model. Additionally, we didnot find changes in the levels of oxidative DNA modifi-cations in the optic nerve after immunization. Since theoptic nerve consists of axons, running from neuronalcell bodies located in the retina, and glial cells, the nu-clei present belong to non-neuronal cells and degenera-tive changes thus reflect glial cell damage.Initially and before commencing this study, we specu-
lated that early neural degenerations could be a conse-quence of cytokines being upregulated in the CNSfollowing immunization. Both MS and EAE show per-ipheral and central immune activation orchestrated bya plethora of mediators [32]. Administration of LPS(Toll-like receptor 4 (TLR4) ligand) or immunizationwith an emulsion containing CFA causes a systemic im-mune activation with production of cytokines and che-mokines. These mediators most likely interact withcells in the CNS, e.g., microglia, through the choroidplexus and/or by direct transport across the blood-brainbarrier [28, 33–35]. CFA exerts various effects throughstimulation of TLR2 by Mycobacterium tuberculosispresent in the adjuvant [36]. TLR2 activation results in theproduction of a variety of different inflammatory media-tors, possibly also in the circumventricular organs where
Fig. 5 Inflammatory response in CNS tissue and peripheral blood. No signs of CD3+ T cell infiltration or demyelination were seen in pre-diseasedanimals, whereas the EAE animals had massive T cell infiltrates (a, scale bar 500 μm) and noduli (a, insert, scale bar 50 μm) and areas of demyelination(b, indicated by two black rectangles, scale bar 500 μm). Concentrations of a wide variety of cytokines and chemokines in the plasma (c, n = 5–6/group)and brain (d, n = 6/group). In the plasma, a general upregulation was seen as a consequence of immunization with CFA, compared to PBS, whereasIFN-γ and IL-17 was increased further if spinal cord homogenate was present (7 dpi and EAE animals). In the brain, the chemokines Cxcl1, Ccl2, andCcl20 were all increased in the 7 dpi animals, whereas IFN-γ and IL-17 were increased in the EAE animals, compared to the CFA 7 group. Mean ± SEM.*p < 0.05, **p < 0.01, and ***p < 0.0001 indicates data significantly different from the CFA 7 animals
Hasseldam et al. Journal of Neuroinflammation (2016) 13:246 Page 9 of 11

TLR2+ microglia are present [34, 37]. CFA is furthermoreknown to compromise the integrity of the blood-brainbarrier [34]. Together, this results in significant increasesin the concentration of a variety of cytokines in CNS tis-sue. The presence of significant amounts of these solublemediators, could also explain the atrophy and degenera-tive changes observed distant from inflammatory infil-trates in MS and EAE [35, 36].As stated, we found increased expression of the che-
mokines Ccl2, Ccl20, and Cxcl1 in brain tissue, earlyafter disease induction. In 1995, Glabinsky et al. foundthat MCP-1 (Ccl2) was non-detectable if leukocyte infil-tration was absent, indicating that this chemokine mayenhance but never initiate inflammation [38]. This is incontrast to our current data and results from other re-cent investigations [13]. We have no solid explanationfor such different findings, although it should be notedthat Glabinsky et al. used a different model and mea-sured mRNA levels instead of proteins.In the choroid plexus, constitutive expression of Ccl20
has been shown to act as a gateway for T cells into unin-flamed CNS, and Th17 cells preferentially express CCR6,the receptor for Ccl20 [28]. Thus expression of Ccl20 in theCNS plays a critical role in the entry of pro-inflammatoryTh17 cells into the CNS. Cxcl1 is known to attract neutro-phils and has in other EAE studies been observed to peakat pre-clinical stages [39, 40]. Furthermore, systemic levelsof this chemokine correlate with clinical disease activityand lesion burden in MS patients [40].
ConclusionsSeveral days before clinical disease was present, subtledecreases in mitochondrial membrane potential and in-creases in reactive oxygen species was observed in braintissue. No cell death was detected at these time-points,but a specific chemokine expression pattern indicatesearly chemoattractant activity in the brain of immunizedanimals.
AbbreviationsCFA: Complete Freund’s adjuvant; EAE: Experimental autoimmuneencephalomyelitis; MS: Multiple sclerosis; PBS: Phosphate buffered saline;TLR: Toll-like receptor
AcknowledgementsNot applicable.
FundingThis work was kindly supported by the following foundations: The Memorialfoundation of Alice Brenaa, The Frode V Nyegaard and Wife Foundation,Emil C. Hertz and spouse Inger Hertz’ Foundation, the King Christian XFoundation (Kong Christian den Tiendes Fond), Aase og Ejnar Danielsen’sFoundation, Arvid Nilsson’s Foundation, Mrs. Asta Bilding’s Memorial Grant,Lykfeldt’s Grant, Ivan Nielsen’s Foundation, The Danish Council forIndependent Research, Medical Sciences (#271-05-0327), and LundbeckFoundation (#236/05).
Availability of data and materialsRaw data can be found at Figshare.com by searching for the title of thismanuscript.
Authors’ contributionsHH conceived the overall approach and question, performed most of theexperimental design and in vivo studies, and wrote the MS. RSR participatedin data analysis and writing the MS. FFJ participated in conceiving the overallapproach and question, and contributed to writing the MS including thedata analysis. All authors read and approved the final manuscript.
Competing interestsThe authors declare that they have no competing interests.
Consent for publicationNot applicable.
Ethics approval and consent to participateAll animal procedures were conducted in accordance with the guidelines ofthe Danish Animal Experiments Committee (#2012-DY-2934-00001) and theDepartment of Experimental Medicine, University of Copenhagen (#P13-041).
Received: 8 December 2015 Accepted: 27 August 2016
References1. Trapp BD, Nave KA. Multiple sclerosis: an immune or neurodegenerative
disorder? Annu Rev Neurosci. 2008;31:247–69.2. Polman CH, Reingold SC, Banwell B, Clanet M, Cohen JA, Filippi M, Fujihara K,
Havrdova E, Hutchinson M, Kappos L, et al. Diagnostic criteria for multiplesclerosis: 2010 revisions to the McDonald criteria. Ann Neurol. 2011;69:292–302.
3. Damal K, Stoker E, Foley JF. Optimizing therapeutics in the management ofpatients with multiple sclerosis: a review of drug efficacy, dosing, andmechanisms of action. Biologics. 2013;7:247–58.
4. Constantinescu CS, Farooqi N, O'Brien K, Gran B. Experimental autoimmuneencephalomyelitis (EAE) as a model for multiple sclerosis (MS). Br J Pharmacol.2011;164:1079–106.
5. Fletcher JM, Lalor SJ, Sweeney CM, Tubridy N, Mills KH. T cells in multiplesclerosis and experimental autoimmune encephalomyelitis. Clin ExpImmunol. 2010;162:1–11.
6. Hobom M, Storch MK, Weissert R, Maier K, Radhakrishnan A, Kramer B, Bahr M,Diem R. Mechanisms and time course of neuronal degeneration inexperimental autoimmune encephalomyelitis. Brain Pathol. 2004;14:148–57.
7. Qi X, Lewin AS, Sun L, Hauswirth WW, Guy J. Mitochondrial protein nitrationprimes neurodegeneration in experimental autoimmune encephalomyelitis.J Biol Chem. 2006;281:31950–62.
8. Qi X, Lewin AS, Sun L, Hauswirth WW, Guy J. Suppression of mitochondrialoxidative stress provides long-term neuroprotection in experimental opticneuritis. Invest Ophthalmol Vis Sci. 2007;48:681–91.
9. Zapryanova E, Sotnikov OS, Sergeeva SS, Deleva D, Filchev A, Sultanov B.Axon reactions precede demyelination in experimental models of multiplesclerosis. Neurosci Behav Physiol. 2004;34:337–42.
10. Jones MV, Nguyen TT, Deboy CA, Griffin JW, Whartenby KA, Kerr DA, CalabresiPA. Behavioral and pathological outcomes in MOG 35-55 experimentalautoimmune encephalomyelitis. J Neuroimmunol. 2008;199:83–93.
11. Davalos D, Baeten KM, Whitney MA, Mullins ES, Friedman B, Olson ES, RyuJK, Smirnoff DS, Petersen MA, Bedard C, et al. Early detection of thrombinactivity in neuroinflammatory disease. Ann Neurol. 2014;75:303–8.
12. Davalos D, Ryu JK, Merlini M, Baeten KM, Le Moan N, Petersen MA, DeerinckTJ, Smirnoff DS, Bedard C, Hakozaki H, et al. Fibrinogen-induced perivascularmicroglial clustering is required for the development of axonal damage inneuroinflammation. Nat Commun. 2012;3:1227.
13. Ryu JK, Petersen MA, Murray SG, Baeten KM, Meyer-Franke A, Chan JP,Vagena E, Bedard C, Machado MR, Rios Coronado PE, et al. Bloodcoagulation protein fibrinogen promotes autoimmunity and demyelinationvia chemokine release and antigen presentation. Nat Commun. 2015;6:8164.
14. Stosic-Grujicic S, Ramic Z, Bumbasirevic V, Harhaji L, Mostarica-Stojkovic M.Induction of experimental autoimmune encephalomyelitis in Dark Agoutirats without adjuvant. Clin Exp Immunol. 2004;136:49–55.
15. Falk K, Rotzschke O, Santambrogio L, Dorf ME, Brosnan C, Strominger JL.Induction and suppression of an autoimmune disease by oligomerized T
Hasseldam et al. Journal of Neuroinflammation (2016) 13:246 Page 10 of 11

cell epitopes: enhanced in vivo potency of encephalitogenic peptides.J Exp Med. 2000;191:717–30.
16. Hasseldam H, Johansen FF. Cannabinoid treatment renders neurons lessvulnerable than oligodendrocytes in Experimental AutoimmuneEncephalomyelitis. Int J Neurosci. 2011;121:510–20.
17. Hasseldam H, Johansen FF. Neuroprotection without immunomodulationis not sufficient to reduce first relapse severity in experimentalautoimmune encephalomyelitis. Neuroimmunomodulation. 2010;17:252–64.
18. Feng X, Xia Q, Yuan L, Yang X, Wang K. Impaired mitochondrial functionand oxidative stress in rat cortical neurons: implications for gadolinium-induced neurotoxicity. Neurotoxicology. 2010;31:391–8.
19. Haeberlein SL. Mitochondrial function in apoptotic neuronal cell death.Neurochem Res. 2004;29:521–30.
20. Bratton SB, Salvesen GS. Regulation of the Apaf-1-caspase-9 apoptosome.J Cell Sci. 2010;123:3209–14.
21. Zorov DB, Juhaszova M, Sollott SJ. Mitochondrial reactive oxygen species(ROS) and ROS-induced ROS release. Physiol Rev. 2014;94:909–50.
22. Park J, Lee J, Choi C. Mitochondrial network determines intracellular ROSdynamics and sensitivity to oxidative stress through switching inter-mitochondrial messengers. PLoS One. 2011;6, e23211.
23. Wigdal SS, Kirkland RA, Franklin JL, Haak-Frendscho M. Cytochrome c releaseprecedes mitochondrial membrane potential loss in cerebellar granuleneuron apoptosis: lack of mitochondrial swelling. J Neurochem. 2002;82:1029–38.
24. Buki KG, Bauer PI, Kun E. Isolation and identification of a proteinase fromcalf thymus that cleaves poly(ADP-ribose) polymerase and histone H1.Biochim Biophys Acta. 1997;1338:100–6.
25. Skulachev VP. Bioenergetic aspects of apoptosis, necrosis and mitoptosis.Apoptosis. 2006;11:473–85.
26. Yan XX, Jeromin A, Jeromin A. Spectrin Breakdown Products (SBDPs) aspotential biomarkers for neurodegenerative diseases. Curr Transl Geriatr ExpGerontol Rep. 2012;1:85–93.
27. Budde MD, Kim JH, Liang HF, Russell JH, Cross AH, Song SK. Axonal injurydetected by in vivo diffusion tensor imaging correlates with neurologicaldisability in a mouse model of multiple sclerosis. NMR Biomed. 2008;21:589–97.
28. Reboldi A, Coisne C, Baumjohann D, Benvenuto F, Bottinelli D, Lira S, UccelliA, Lanzavecchia A, Engelhardt B, Sallusto F. C-C chemokine receptor 6-regulated entry of TH-17 cells into the CNS through the choroid plexus isrequired for the initiation of EAE. Nat Immunol. 2009;10:514–23.
29. Buckman JF, Hernandez H, Kress GJ, Votyakova TV, Pal S, Reynolds IJ.MitoTracker labeling in primary neuronal and astrocytic cultures: influenceof mitochondrial membrane potential and oxidants. J Neurosci Methods.2001;104:165–76.
30. Gresle MM, Shaw G, Jarrott B, Alexandrou EN, Friedhuber A, Kilpatrick TJ,Butzkueven H. Validation of a novel biomarker for acute axonal injury inexperimental autoimmune encephalomyelitis. J Neurosci Res. 2008;86:3548–55.
31. Petzold A, Baker D, Pryce G, Keir G, Thompson EJ, Giovannoni G.Quantification of neurodegeneration by measurement of brain-specificproteins. JNeuroimmunol. 2003;138:45–8.
32. Imitola J, Chitnis T, Khoury SJ. Cytokines in multiple sclerosis: from bench tobedside. Pharmacol Ther. 2005;106:163–77.
33. Perry VH, Newman TA, Cunningham C. The impact of systemic infection onthe progression of neurodegenerative disease. Nat Rev Neurosci. 2003;4:103–12.
34. Raghavendra V, Tanga FY, DeLeo JA. Complete Freunds adjuvant-inducedperipheral inflammation evokes glial activation and proinflammatorycytokine expression in the CNS. Eur J Neurosci. 2004;20:467–73.
35. Jeong HK, Jou I, Joe EH. Systemic LPS administration induces braininflammation but not dopaminergic neuronal death in the substantia nigra.Exp Mol Med. 2010;42:823–32.
36. Means TK, Wang S, Lien E, Yoshimura A, Golenbock DT, Fenton MJ. Humantoll-like receptors mediate cellular activation by Mycobacteriumtuberculosis. J Immunol. 1999;163:3920–7.
37. Rivest S. Regulation of innate immune responses in the brain. Nat RevImmunol. 2009;9:429–39.
38. Glabinski AR, Tani M, Tuohy VK, Tuthill RJ, Ransohoff RM. Central nervoussystem chemokine mRNA accumulation follows initial leukocyte entry at theonset of acute murine experimental autoimmune encephalomyelitis. BrainBehav Immun. 1995;9:315–30.
39. Roy M, Richard JF, Dumas A, Vallieres L. CXCL1 can be regulated by IL-6 andpromotes granulocyte adhesion to brain capillaries during bacterial toxinexposure and encephalomyelitis. J Neuroinflammation. 2012;9:18.
40. Rumble JM, Huber AK, Krishnamoorthy G, Srinivasan A, Giles DA, Zhang X,Wang L, Segal BM. Neutrophil-related factors as biomarkers in EAE and MS.J Exp Med. 2015;212:23–35.
• We accept pre-submission inquiries
• Our selector tool helps you to find the most relevant journal
• We provide round the clock customer support
• Convenient online submission
• Thorough peer review
• Inclusion in PubMed and all major indexing services
• Maximum visibility for your research
Submit your manuscript atwww.biomedcentral.com/submit
Submit your next manuscript to BioMed Central and we will help you at every step:
Hasseldam et al. Journal of Neuroinflammation (2016) 13:246 Page 11 of 11