
Oxford Industries (OXM) Stock Pitch
19
GROUP MEMBERS: TIFFANY ARREDONDO AARON GERSHMAN QIUYU QIN Oxford Industries Inc. (OXM)
-
Upload
tiffany-arredondo -
Category
Documents
-
view
72 -
download
2
Transcript of Oxford Industries (OXM) Stock Pitch

GROUP MEMBERS:TIFFANY ARREDONDO
AARON GERSHMANQIUYU QIN
Oxford Industries Inc.(OXM)
Agenda
● Company Overview● Industry Analysis ● Competitor Analysis● EPS Forecast● WACC Estimation ● Model Valuation Analysis ● Restatement of Recommendation

Summary of Recommendation
● Based on our intrinsic value per share estimation analysis, our final recommendation is BUY

Overview of Oxford Industries
● Founded in 1942 by three brothers: Hicks, Sartain, and Thomas● Is a global apparel company that designs, sources, markets and distributes
products:○ company-owned labels ○ licensed and private labels
● Lifestyle brands:○ Tommy Bahama○ Lilly Pulitzer ○ Oxford Golf○ Lanier Clothes

Operating Income for Various Labels
Industry & Company
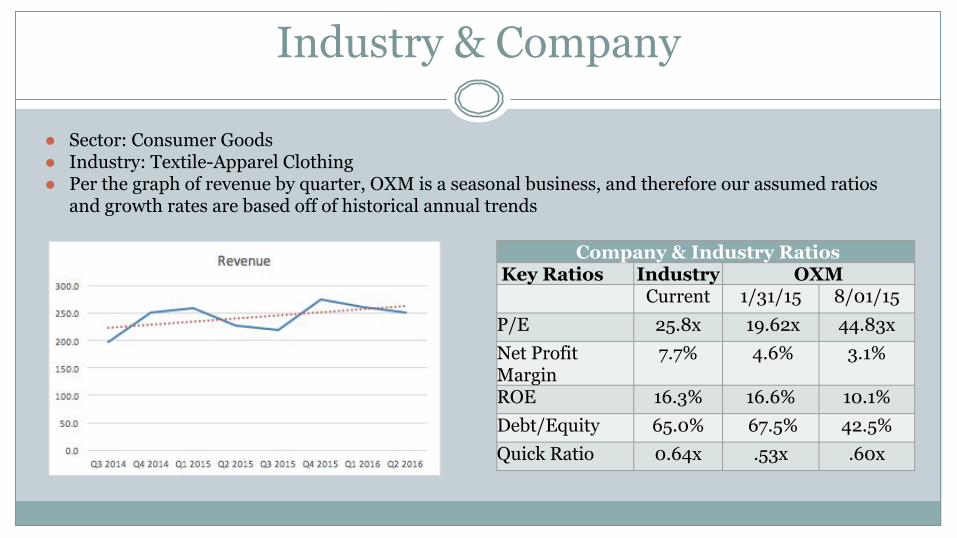
● Sector: Consumer Goods● Industry: Textile-Apparel Clothing ● Per the graph of revenue by quarter, OXM is a seasonal business, and therefore our assumed ratios
and growth rates are based off of historical annual trends
Company & Industry Ratios
Key Ratios Industry OXMCurrent 1/31/15 8/01/15
P/E 25.8x 19.62x 44.83xNet Profit Margin
7.7% 4.6% 3.1%
ROE 16.3% 16.6% 10.1%Debt/Equity 65.0% 67.5% 42.5%Quick Ratio 0.64x .53x .60x
Textiles, Apparel & Luxury Goods vs. S&P 500
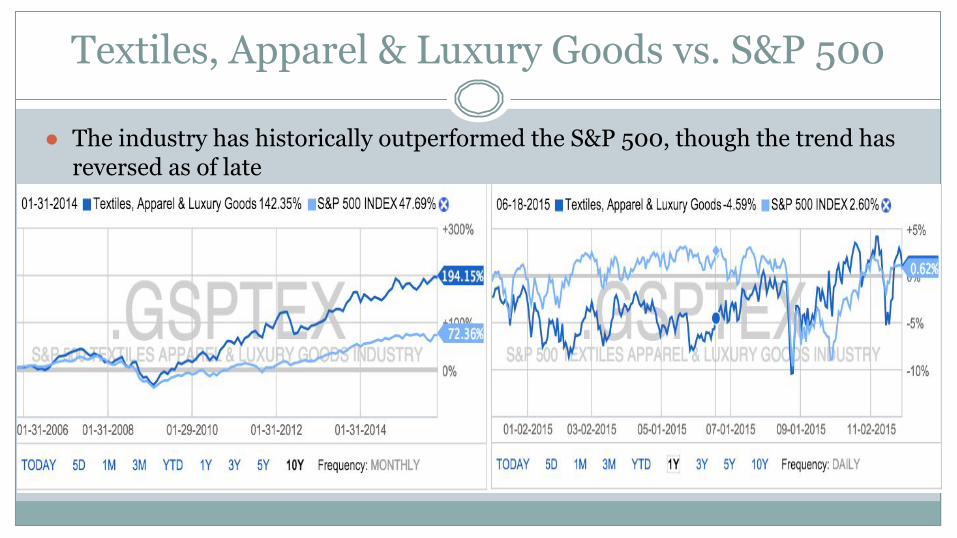
● The industry has historically outperformed the S&P 500, though the trend has reversed as of late

Competitors
● OXM= Oxford Industries● PVH = PVH Corp
● Includes Brands like:● Calvin Klein● Tommy Hilfiger
● PERY = Perry Ellis International Inc.● Includes Brands like:
● Original Penguin● Laundry
OXM PVH PERYMarket Cap 1.08B 7.39B 280.60MQuarterly
Revenue Growth0.10 -0.06 0.05
Revenue 1.04B 8.05B 908.84MGross Margin 0.56 0.53 0.34
EBITDA 128.71M 953.30M 41.58MOperating
Margin0.09 0.09 0.03
Net Income 51.78M 493.50M -35.20MEPS 1.87 5.92 -2.37P/E 34.81 15.14 N/A

OXM Financial Analysis

Analysts’ EPS Forecast
● Oxford Industries raised its 2016 EPS guidance following a strong second quarter● Led by stronger than expected performance from Lilly Pulitzer and solid
contributions from Tommy Bahama● Proceeds from the sale of Ben Sherman decreased the company’s overall debt
levels and should help the company moving forward
* = forecasted period
Jan 2014 Jan 2015 Jan 2016* Jan 2017*EPS Actuals & Estimates $2.75 $2.78 $3.66 $4.01

WACC Estimation
● The cost of equity was estimated using CAPM and the cost of debt was estimated using the weighted average rate of the revolving credit agreement● After-tax cost of debt: 1.08%● Cost of equity: 7.00%
● The weights of the capital structure were estimated through historical trend analysis● Weight of debt: 10.00%● Weight of equity: 90.00%
● These estimations and assumptions resulted in an estimated weighted average cost of capital of 6.41%

Model Valuation Analysis
● We assumed a 4.50% terminal growth rate for our model analyses● Assumed due to high growth potential of Lilly Pulitzer, strong recent
contributions from Tommy Bahama, and the potential for future additional lifestyle brand acquisitions
● Supported by Bloomberg (4.41%)● As OXM has consistently paid and grown dividends over time, we decided to
use an average of the three models to estimate the true intrinsic value per share● Model 1: Dividend Discount● Model 2: Operating Free Cash Flow● Model 3: Free Cash Flow to Equity

Model 1: Dividend Discount
● Estimated value per share: $61.28● Actual: $67.94
● Key assumptions:
● Sensitivity Analysis:

Model 2: Operating Free Cash Flow
● Estimated value per share: $82.91● Actual: $67.94
● Key assumptions:
● Sensitivity Analysis:

Model 3: Free Cash Flow to Equity
● Estimated value per share: $77.60● Actual: $67.94
● Key assumptions:
● Sensitivity Analysis:

Supporting the Buy Recommendation
● The average of the three models suggested a Buy recommendation
● This recommendation is echoed by analysts following the company Current Analyst Target Prices
Firm Target Prx Recommendation
Wunderlich 100 Buy
Suntrust Robinson 95 Buy
Sidoti 93 Buy
KeyBanc 92 OverweightStephens 90 Overweight
Value per ShareAverage of Models 1, 2, and 3 $73.93Current Price (as of closing on 11/30/15) $67.94

Trend in Price per Share since Q2 Release
● Since the release of OXM’s second quarter financial results in early Sept., the price per share has decreased substantially from $84.92● According to our analysis, this represented an overvaluation of the stock● However, this decline in prices has been an industry-wide trend, and thus we
do not believe it reflects a significant change in OXM’s fundamentals

Summary of Recommendation
● We recommend a buy based off our average estimated stock price of $73.93● Ample growth opportunities
● Significant growth opportunities for Lilly Pulitzer & Tommy Bahama● Modest growth opportunities for Lanier Clothes● Potential for lifestyle brand expansion● Licensing opportunities in product categories beyond the core business
● Q3 earnings announcement: December 8, 2015● Seasonality always deflates Q3 results, but analysts believe OXM could
still beat expectations

Questions?


![Untitled-3 [content.alfred.com] · 2017-10-03 · LESSON I Pitch 2 Pitch 3 Pitch 4 Pitch 5 Pitch 6 Pitch 7 Pitch 8 Pitch 10 Pit h 11 Pitch 12 Pitch 13 Pitch 14 Pitch 15 Pitch 16 Pitch](https://static.fdocuments.us/doc/165x107/5f1f182654507e355339a7ee/untitled-3-2017-10-03-lesson-i-pitch-2-pitch-3-pitch-4-pitch-5-pitch-6-pitch.jpg)