OWNER-OPERATORS / THE SUPPLY CHAIN
33
December 2021 Rebecca M. Brewster President and Chief Operating Officer American Transportation Research Institute Atlanta, GA 950 N. Glebe Road, Suite 210 Arlington, Virginia 22203 TruckingResearch.org OWNER-OPERATORS / INDEPENDENT CONTRACTORS IN THE SUPPLY CHAIN
Transcript of OWNER-OPERATORS / THE SUPPLY CHAIN
December 2021
Rebecca M. Brewster
President and Chief Operating Officer American Transportation Research Institute
Atlanta, GA
950 N. Glebe Road, Suite 210 Arlington, Virginia 22203
TruckingResearch.org
OWNER-OPERATORS / INDEPENDENT CONTRACTORS IN THE SUPPLY CHAIN
ATRI BOARD OF DIRECTORS
Judy McReynolds Chairman of the ATRI Board Chairman, President and Chief Executive Officer ArcBest Corporation Fort Smith, AR Andrew Boyle Co-President Boyle Transportation Billerica, MA Hugh Ekberg President and CEO CRST International, Inc. Cedar Rapids, IA Darren D. Hawkins Chief Executive Officer Yellow Overland Park, KS Derek Leathers President and CEO Werner Enterprises Omaha, NE Robert E. Low President and Founder Prime Inc. Springfield, MO Benjamin J. McLean Chief Executive Officer Ruan Transportation Management Systems Des Moines, IA
Dennis Nash Executive Chairman of the Board Kenan Advantage Group North Canton, OH Brenda Neville President and CEO Iowa Motor Truck Association Des Moines, IA Srikanth Padmanabhan President, Engine Business Cummins Inc. Columbus, IN James D. Reed President and CEO USA Truck Van Buren, AR Lou Rivieccio President, Corporate Transportation UPS Atlanta, GA John A. Smith President and CEO FedEx Ground Moon Township, PA Rebecca Brewster President and COO ATRI Atlanta, GA Chris Spear President and CEO American Trucking Associations Arlington, VA
ATRI RESEARCH ADVISORY COMMITTEE
Shawn R. Brown, RAC Chairman Vice President of Safety Cargo Transporters Michael Ahart VP, Regulatory Affairs Omnitracs LLC Ben Banks Vice President, Operations TCW, Inc. Hayden Cardiff CEO and Founder Idelic Joe Darby Director, Safety & Risk Control, Transportation & Logistics Practice Aon Bob Elkins Senior Vice President, Industry Vertical Operations Ruan Transportation Management Brett Fabbri Assistant Chief California Highway Patrol Gary Falldin Sr. Director of Industry Solutions Trimble Melanie Feeley Vice President, General Business Manager K-Limited Carrier, Ltd James P. Fields Chief Operating Officer Pitt-Ohio, LLC Rickey Fitzgerald Manager, Freight and Multimodal Operations Florida Department of Transportation
Steven Garrish Vice President of Safety and Compliance Old Dominion Freight Line Rob Haddock Group Director, Planning and Logistics Coca-Cola North America Glen Kedzie Vice President, Energy & Environmental Affairs Counsel American Trucking Associations Kevin Lhotak President Reliable Transportation Specialists Mike Ludwick Chief Administrative Officer Bison Transport Steve Olson President and Chief Underwriting Officer Great West Casualty Company Clay Porter Attorney Porter, Rennie, Woodard, Kendall, LLP Jeremy Reymer Founder and CEO DriverReach Rob Rhea Senior Vice President and General Counsel FedEx Freight Amanda Schuier Chief Operating Officer Quality Transport Joe Sculley President Motor Transport Association of Connecticut
Shelly Seaton Vice President of Loss Prevention Landstar Charles Simpson Vice President, Strategic Intelligence U.S. Xpress Russ Simpson America’s Road Team Captain Yellow Monique Stinson Computational Scientist Argonne National Laboratory Daniel Studdard Principal Planner, Transportation Access and Mobility Division Atlanta Regional Commission Randy Vernon Chief Executive Officer Big G Express Doug Voss Arkansas Highway Commission Endowed Chair University of Central Arkansas Tom Weakley Director of Operations Owner-Operator Independent Drivers Association Foundation John Whittington Vice President, Legislative Affairs Grammer Logistics Shawn Yadon Chief Executive Officer California Trucking Association
Owner-Operators / Independent Contractors in the Supply Chain 4
TABLE OF CONTENTS
ACRONYMS .............................................................................................................................. 6
INTRODUCTION ....................................................................................................................... 7
BACKGROUND ......................................................................................................................... 7
History of Employment Regulations ................................................................................ 7
Dynamex Operations West, Inc., V. The Superior Court of Los Angeles County ............ 9
California Assembly Bill 5 ............................................................................................... 9
California Trucking Association, Et Al., V. Attorney General Xavier Becerra, Et Al ........11
Activities in Other States ...............................................................................................11
OO/IC IN THE TRUCKING INDUSTRY ....................................................................................12
METHODOLOGY .....................................................................................................................12
DEMOGRAPHICS ....................................................................................................................13
FINDINGS .................................................................................................................................17
Motivating Factors and Level of Satisfaction ..................................................................17
Driver Compensation .....................................................................................................22
Impacts of Reclassification ............................................................................................25
CONCLUSION ..........................................................................................................................26
APPENDIX A ............................................................................................................................27
APPENDIX B ............................................................................................................................29
Owner-Operators / Independent Contractors in the Supply Chain 5
FIGURES AND TABLES
Figure 1: For-Hire Sector .......................................................................................................13
Table 1: Fleet Size ..................................................................................................................14
Figure 2: Average Length of Haul .........................................................................................14
Figure 3: Primary Vehicle Configuration ..............................................................................15
Table 2: Full-Time, Part-Time and Seasonal Work ...............................................................16
Table 3: Respondent Educational Attainment .....................................................................16
Figure 4: Motivating Factors and Level of Satisfaction for Company Drivers ...................18
Figure 5: Top Motivating Factors and Level of Satisfaction for Female Company Drivers .................................................................................................................................................19
Figure 6: Motivating Factors and Level of Satisfaction for OO/IC .......................................20
Figure 7: Top Motivating Factors and Level of Satisfaction for Female OO/IC...................21
Table 4: Top Motivating Factors Female vs Male .................................................................21
Figure 8: Driver Compensation Models ................................................................................22
Figure 9: Level of Satisfaction with Income by Compensation Model – Company Drivers .................................................................................................................................................23
Figure 10: Level of Satisfaction with Income by Compensation Model – OO/IC ...............23
Figure 11: Annual Income Comparison ................................................................................24
Table 5: Carrier Sponsored Programs Accessed by OO/IC Leased to a Motor Carrier.....25
Figure 12: OO/IC Expectations if Changed to Company Driver ...........................................25
Table A.1: Respondent Demographics ..................................................................................27
APPENDIX B. Additional Findings by Company Driver, OO/IC Leased to a Motor Carrier and OO/IC with Own Operating Authority .............................................................................29
Owner-Operators / Independent Contractors in the Supply Chain 6
ACRONYMS
ATA American Trucking Associations ATRI American Transportation Research Institute CTA California Trucking Association FAAAA Federal Aviation Administration Authorization Act FLSA Fair Labor Standards Act IC Independent Contractors IRS Internal Review Service IWC Industrial Welfare Commissions NRLA National Labor Relations Act NRLB National Labor Relations Board OO Owner-Operators RAC Research Advisory Committee
Owner-Operators / Independent Contractors in the Supply Chain 7
INTRODUCTION For decades, the trucking industry has relied on owner-operators (OO) and independent contractors (IC) to transport goods across the U.S. The utilization of OO/IC offers a solution to the fluctuating demand for freight transportation and provides an opportunity for drivers to have autonomy over the services they offer. In recent years, new legislation pertaining to employment status classification has been introduced in various states which threatens the eligibility of drivers to work as OO/IC. Based on these legislative actions, it is important to understand the role of OO/IC in the supply chain. In response to the prospect of new laws that govern the classification of OO/IC and their employment status, the American Transportation Research Institute (ATRI) Research Advisory Committee (RAC) prioritized a study that examines the role of OO/IC in the supply chain and identifies potential impacts should these laws be enacted and expanded.1 This ATRI research seeks to better understand the existing role of OO/IC in the supply chain and the impact that labor classification laws could ostensibly have on drivers. To achieve this objective, this research identifies the underlying motivations and concerns relating to driver classifications, in addition to providing background on the legal landscape that is redefining the eligibility standards for OO/IC. A key research task was a truck driver survey that identified motivating factors that lead drivers to become OO/ICs and how they perceive reclassification efforts. This, in turn, allowed the research to quantify the potential impacts that might result from reclassification efforts. BACKGROUND History of Employment Regulations The federal landscape surrounding work regulations in the United States can be traced back to two New Deal era acts: the National Labor Relations Act (NLRA) of 1935 and the Fair Labor Standards Act (FLSA) of 1938.2 These two acts worked in conjunction to establish regulations related to unions, minimum wages, and child labor. Most importantly, the NLRA established the National Labor Relations Board (NLRB), which was meant to determine the nature and scope of the NLRA. The NLRA, in its original form, did not define many key terms; most notably, the term “employee” was never defined.3 Furthermore, independent contractors were not expressly excluded from the NLRA. Later, the NLRB decided that, because independent workers were not employees, they would not be protected in a similar manner to employees. This lack of a stringent definition of employee, as well as the exclusion of independent contractors, led to further amendments to the NLRA and from Supreme Court rulings. The Supreme Court attempted to fill the gaps left by the NLRA and NLRB through United States v Silk. In this case, coal miners were found to be employees of a mining company, despite only
1 ATRI’s Research Advisory Committee is comprised of industry stakeholders representing motor carriers, trucking industry suppliers, federal government agencies, labor and driver groups, law enforcement, and academia. The RAC is charged with annually recommending a research agenda for the institute. 2 “A Brief History of Independent Contractor Classification”. Bunker. Available online: https://vault.buildbunker.com/2019/01/11/independent-contractor-history/ 3 Motomura, Hishi. “Employees and Independent Contractors under the National Labor Relations Act”. Industrial Relations Law Journal. 1977. Available online: http://www.jstor.com/stable/24049472
Owner-Operators / Independent Contractors in the Supply Chain 8
working occasionally and supplying some of their own tools. As the miners were integral to the mining company, they were therefore employees.4 This case confirmed the validity of what would come to be known as the “economic reality test.” In 1947, Congress passed an amendment to the NLRA known as the Taft-Hartley Act, meant to undermine striking employees by more stringently defining who was considered an “employee.”5 However, this act failed at properly defining employees as the NLRB stated different definitions of employees in different states, further leading to confusion on who was considered an employee. These issues led to the creation of multiple legal tests to determine the nature of the relationship between employer and worker. Tests were generated through common law principles to attempt to create a stringent definition of employee, and no singular legal test is used at the federal level to determine the nature of the employer-worker relationship. One test focuses predominately on the nature of an employer’s control over the worker, known as the “Right-of-Control” test.6 If the employer has control over both how the work is done and the outcomes of the work, the worker is defined as an employee.7 If a worker does not meet these requirements, they may be classified as an independent contractor, which meant that many of the reforms promulgated by the NLRB were not applicable. This created a profit incentive for firms to classify employees as independent contractors, and as a result, the Internal Review Service (IRS) began to aggressively enforce worker classification and continued to do so throughout the 20th Century. Enforcement of classification of independent contractors began to escalate, and in turn, criticism of the IRS increased as well.8 In response to this criticism, the Revenue Act of 1978 was passed. One of the more impactful sections of the Revenue Act of 1978 was Section 530. The purpose of Section 530 was to protect firms against retroactive reclassification of independent contractors to employees by the IRS, protecting them from legal repercussions of misclassified workers. Section 530 contains three particular qualifications for when a worker can be considered an independent contractor: consistent treatment of workers in question, as well as similarly situated workers, as independent contractors; the completion of Form 1099 for all claimed independent contractors; and a reasonable basis for classifying these workers as independent contractors.9 These classifications have since been updated, most notably in Section 1706 of the Tax Reform Act of 1986 and Section 1122 of the Small Business Protection Act of 1996.10 The Small Business Protection Act emphasizes three criteria important for identifying independent contractors: behavioral control; financial control; and relationship of the parties. At the national level, bills have attempted to render Section 530 obsolete, but none have been made into law.
4 Wood, Robert W. “Independent Contractors”. 5 Rivlin-Nader, Max. “Freelancing and Labor Law: A Short History”. The Freelancer. https://contently.net/2016/01/26/resources/tools/legal/freelancing-labor-law-short-history/ 6 Motomura, Hishi. “Employees and Independent Contractors under the National Labor Relations Act.” Industrial Relations Law Journal. 1977. Available online: http://www.jstor.com/stable/24049472 7 “Section 530: Its History and Application in Light of the Federal Definition of the Employer-Employee Relationship for Federal Tax Purposes”. National Association of Tax Reporting and Professional Management. Feb. 28, 2009. Available online: https://www.irs.gov/pub/irs-utl/irpac-br_530_relief_-_appendix_natrm_paper_09032009.pdf 8 Ibid. 9 Ibid. 10 “Worker Reclassification – Section 530 Relief”. Internal Revenue Service. Available online: https://www.irs.gov/government-entities/worker-reclassification-section-530-relief
Owner-Operators / Independent Contractors in the Supply Chain 9
Utilizing the categories identified in the Small Business Protection Act, trucking has a long history of employing independent contractors. As most companies who hire owner-operators and independent contractors only direct the end goal, the drivers themselves fall under the OO/IC designation. However, if a trucking firm were to provide on-the-job training and financial direction, their drivers may be considered employees. The classification of OO/IC at the federal level has been mired in controversy and lack of clarity. This lack of clarity has created an employment landscape where the classification of workers is dynamic, and was most recently brought to light in the Supreme Court case, Dynamex Operations West, Inc. v. Superior Court, hereafter referred to as “Dynamex.” Dynamex Operations West, Inc., V. The Superior Court of Los Angeles County11 This case has fundamentally shifted the conversation around ICs and paved the way for AB 5, a California Assembly Bill that extends employee classification status to gig workers.12 Dynamex is a nationwide same-day courier and delivery service that operates a number of business centers in California. In 2004, Dynamex converted all of its drivers to ICs. In April of 2005, a former independent contractor, who left Dynamex three months prior, filed a lawsuit against Dynamex that alleged misclassification of its drivers as ICs. The complaint alleged five causes of action arising from Dynamex’s misclassification of employees – two counts of unfair and unlawful business practices and three counts of Labor Code violations based on failure to pay overtime compensation, itemize wage statements, and compensate drivers for business expenses. The legal foundation for these violations rested on the contention that Dynamex misclassified employee status; therefore, the standard test that is applied when determining whether a worker should be considered an employee or an independent contract is relevant to the legal claim of this case. The trial court agreed with the plaintiff’s position, redefining the employment relationship under a claim of unpaid wages based off of the California Industrial Welfare Commission’s (IWC) definition. The Court’s decision has led to the current controversy over the use of OO/ICs in California. California Assembly Bill 5 As a result of the ruling in the Dynamex case, new legislation was introduced to establish if a worker is an independent contractor. Assembly Bill No. 5, commonly referred to as AB 5 or the “gig worker bill,” was signed into law by the California Governor in September of 2019, and went into effect in January of 2020.13 As stated in the bill, AB 5 “creates a presumption that a worker who performs services for a hirer is an employee for purposes of claims for wages and benefits...”14 With a few exceptions, the bill limits when workers can be considered ICs and will
11 SCOCAL, Dynamex Operations West, Inc. v. Superior Court, S222732 available at: (https://scocal.stanford.edu/opinion/dynamex-operations-west-inc-v-superior-court-34584). 12 A “gig worker” is an independent contractor who typically does short-term work for multiple clients. For more
information, see: https://www.uschamber.com/co/run/human-resources/what-is-a-gig-worker 13 September 30, 2019. “What is California’s New AB5 Law, and How Will it Affect Employees & Employers Within the Gig Economy?” Dordulian Law Group. https://www.dlawgroup.com/what-is-california-ab5-law/ 14 California Legislative Information. (September 19, 2019). “AB 5 Worker Status: Employees and Independent Contractors.” https://leginfo.legislature.ca.gov/faces/billTextClient.xhtml?bill_id=201920200AB5.
Owner-Operators / Independent Contractors in the Supply Chain 10
require companies that hire workers as ICs to reclassify them as employees if they do not pass an “ABC test.” 15,16 The burden of proof for classifying a worker as an independent contractor is placed on the hiring entity.17 The California law provides a new three-part test, commonly known as the ABC test to determine if a worker is an employee or independent contractor.18 The worker must comply with all three components of the ABC test to be classified as an independent contractor. The components of the ABC test are as follows:19
a) The worker is free from the control and direction of the hiring entity in connection with
the performance of the work, both under the contract for the performance of the work
and in fact.
b) The worker performs work that is outside the usual course of the hiring entity's business.
c) The worker is customarily engaged in an independently established trade, occupation, or
business of the same nature as the work performed.
The legislature’s decision to create AB 5 was founded on the premise that “the misclassification of workers as ICs has been a significant factor in the erosion of the middle class and the rise of income inequality.” The bill also notes a number of additional factors, including “harm to misclassified workers … unfairness to employers …, and the loss to the state of needed revenue.”20 Despite the stated intentions for passing the bill, a number of industries have contested AB 5 due to its restrictions on the use of OO/ICs. Professions that have been impacted include truck drivers, journalists, translators, and event planners.21 Two rideshare service companies, Uber and Lyft, were particularly active in lobbying against the bill, but were denied exemptions. Ultimately, Proposition 22 was approved by California voters in November 2020 to allow rideshare companies like Uber and Lyft to classify drivers as independent contractors. 22 Earlier in 2020, AB 2257 was signed into law which increased to roughly 75 professions or types of businesses that are exempt from the independent contracting
15 Schulz, John. (February 6, 2020). “Trucking Companies Breathing Sigh of Relief After Calif. Judge Issues Injunction on AB5.” Logistics Management. https://www.logisticsmgmt.com/article/trucking_companies_breathing_sigh_of_relief_after_calif._judge_issues_injun 16 Carosa, Chris. (February 27, 2020). “Will California’s AB5 Law Gag Your Gig Retirement?” Forbes. https://www.forbes.com/sites/chriscarosa/2020/02/27/will-californias-ab5-law-gag-your-gig-retirement/#3b542db06518 17 Dordulian Law Group “What is California’s New AB5 Law, and How Will it Affect Employees & Employers Within the Gig Economy?” September 30, 2019. https://www.dlawgroup.com/what-is-california-ab5-law/ 18 California Legislative Information. Ibid. 19 Murray, Jean. (September 20, 2019). “What is the ABC Test for Independent Contractors: The Dynamex Case and Independent Contractor Status.” https://www.thebalancesmb.com/what-is-the-abc-test-for-independent-contractors-4586615#:~:text=The%20ABC%20test%20is%20a,determine%20the%20status%20of%20workers. 20 California Legislative Information. Ibid. 21 Anderson, Karen. (January 24, 2020). “Another Voice: Assembly Bill 5 Harms Hundreds of Industries and Professions.” Sacramento Business Journal. https://www.bizjournals.com/sacramento/news/2020/01/24/another-voice-assembly-bill-5-harms-hundreds-of.html 22 Although they are not considered employees, the new law requires that specific labor and wage policies be put in
place for app-based drivers. However, the law has been ruled unconstitutional with the ruling being appealed.
Owner-Operators / Independent Contractors in the Supply Chain 11
test set out in AB 5, meaning employers are able to use the common law Borello test instead of the more restrictive ABC test to assess whether the workers are independent contractors.23 California Trucking Association, Et Al., V. Attorney General Xavier Becerra, Et Al. The California Trucking Association (CTA) filed a lawsuit challenging AB 5 in the U.S. Southern District Court. In January 2020, the District Court ruled in favor of CTA and issued a preliminary injunction which blocked the state from enforcing AB 5 against motor carriers. 24 CTA’s primary argument relied on the Federal Aviation Administration Authorization Act (FAAAA) preemption, which prohibits states from enforcing laws “related to a price, route, or service of any motor carrier.” The judge determined the state “encroached on Congress’ territory by eliminating motor carriers’ choice to use independent contractor drivers, a choice at the very heart of interstate trucking.” In April 2021, a three-judge panel of the Ninth Circuit Court of Appeals voted 2-1 to reverse the granting of the preliminary injunction. The panel ruled that “because AB 5 is a generally applicable labor law that affects a motor carrier’s relationship with its workforce and does not bind, compel, or otherwise freeze into place the prices, routes, or services of motor carriers, it is not preempted by the FAAAA.”25 The court denied a request for a rehearing in June, then granted a stay to keep trucking’s injunction in place until the case plays out in the U.S. Supreme Court. In August 2021, CTA filed a petition for a writ of certiorari before the United States Supreme Court. If the Supreme Court chooses to hear the case, the injunction will be stayed until the case is decided. If the Supreme Court declines to hear the case, the injunction will be lifted. Activities in Other States As noted earlier, although the ABC test is not currently used to determine employee status for purposes of federal labor and employment laws, legislation that would adopt the test for the NLRA has been introduced in Congress.26 In addition, 20 states and the District of Columbia use some type of ABC test for purposes of a state’s unemployment compensation program; a state’s wage and hour or other employment laws; and/or a specific industry’s employment standards (e.g., the construction industry). Variations of the test are found among states not only in terms of its application but also in how various elements are defined. While AB 5 applies only to California workers and businesses, the state is a barometer for legislative actions.27 Other states, including Washington, New Jersey, and New York, have proposed similar laws using AB 5 as an example. Given the legal uncertainty surrounding the
23 Rubin, Jennifer B., AB 5 “2.0” - California Tweaks its Independent Contractor Ban, Mintz, Levin, Cohn, Ferris, Glovsky and Popeo, P.C. https://www.mintz.com/insights-center/viewpoints/2226/2020-09-08-ab-5-20-california-tweaks-its-independent-contractor-ban 24 United States District Court Southern District Of California. Order Granting Preliminary Injunction. California Trucking Association, Et Al., Plaintiffs, V. Attorney General Xavier Becerra, Et Al., Case No.: 3:18-Cv-02458-Ben-Blm (January 16, 2020). 25 United States Court Of Appeals for the Ninth Circuit. California Trucking Association; Ravinder Singh; Thomas Odom, Plaintiffs-Appellees, V. Rob Bonta, et al. No. 20-55107 D.C. No. 3:18-Cv-02458-BEN-BLM 26 Congressional Research Service. Worker Classification: Employee Status Under the National Labor Relations Act, the Fair Labor Standards Act, and the ABC Test. R46765 (April 20, 2021). 27 Carosa, Chris. (February 27, 2020). “Will California’s AB5 Law Gag Your Gig Retirement?” Forbes. https://www.forbes.com/sites/chriscarosa/2020/02/27/will-californias-ab5-law-gag-your-gig-retirement/#3b542db06518
Owner-Operators / Independent Contractors in the Supply Chain 12
status of AB 5, states are closely monitoring the pending Supreme Court decision before considering whether to advance similar legislation. OO/IC IN THE TRUCKING INDUSTRY While the legal and regulatory landscape has been mired in controversy and lack of clarity, OO/IC drivers have and continue to play a key role in meeting the needs of the trucking industry. Within the industry, there are three primary approaches for working as a truck driver – hiring on as a company driver, running your own business as an OO/IC by leasing on to a motor carrier under their operating authority, or running your own business as an OO/IC under your own operating authority. These methods are described below. Company Driver – Company drivers are employees that tend to drive the truck provided to them by their motor carrier. The carrier is responsible for supplying items such as fuel, maintenance and tires. Company drivers tend to increase their earnings based on performance bonuses for items such as safe driving and good fuel economy or for longevity at a carrier. OO/IC leased on to a motor carrier – OO/IC drivers that lease on under a motor carrier’s operating authority tend to acquire their trucks through a carrier-sponsored program or may source their trucks on the open market. These drivers lease on to leverage a carrier’s freight and buying networks for things like insurance, fuel, maintenance and tires. These drivers are responsible for running their business by managing their revenue and expenses but tend to seek the support networks provided by a motor carrier. OO/IC with own operating authority – OO/IC drivers that have their own operating authority tend to make their own purchase decisions and may have one or more trucks. They are responsible for running their business by selling and managing their own customers, negotiating rates and collecting revenue, as well as paying all their vendors. They may use associations for discounts on items like fuel, tires, and insurance. METHODOLOGY Given the legal and regulatory uncertainties and differences in how OO/IC drivers are able to operate in the United States, ATRI undertook a study to gather perspectives from OO/IC drivers. First, ATRI reviewed multiple documents related to driver classification to better understand the legal and regulatory bases. While these documents tend to discuss the many pros and cons associated with various driver classifications, very little driver-specific data has been centralized in the industry marketplace. ATRI met with a variety of industry experts to discuss this document review, further identify what additional classification-related data may be available and to determine where specific data gaps exist. Based on these discussions, ATRI developed a survey instrument that focused on understanding how lifestyle considerations influence different driver classification choices. A scaling method was used to gauge the importance and satisfaction of several lifestyle factors, ranging from income to business/job growth to schedule/flexibility. Driver perceptions on how reclassification might affect compensation and job satisfaction were also explored. The online survey was posted on the ATRI website on August 18, 2021 and was available through September 17, 2021. ATRI issued a press release that was distributed to the organization’s email list-serve. In addition, a number of related organizations, including the American Trucking Associations, Owner-Operator Independent Drivers Association and the
Owner-Operators / Independent Contractors in the Supply Chain 13
network of State Trucking Associations, were asked to assist with the outreach effort. Through the combination of these efforts, more than 2,000 truck drivers responded and submitted completed surveys. DEMOGRAPHICS
A total of 2,097 drivers responded to ATRI’s survey. A majority of respondents were OO/IC
(66.2%) and the remainder (33.8%) were Company Drivers. Among the OO/IC, 49.2 percent
were OO/IC Leased to a Motor Carrier and 17.0 percent were OO/IC with their Own Operating
Authority.
The respondents were predominantly male (89.0%) but it is notable that over eight percent of
respondents were female, a higher percentage than the current population of female drivers
(6.7%).28 The majority of respondents (67.7%) were between the ages of 45 and 64 and over
57 percent of the respondents had 21 or more years of driving experience.
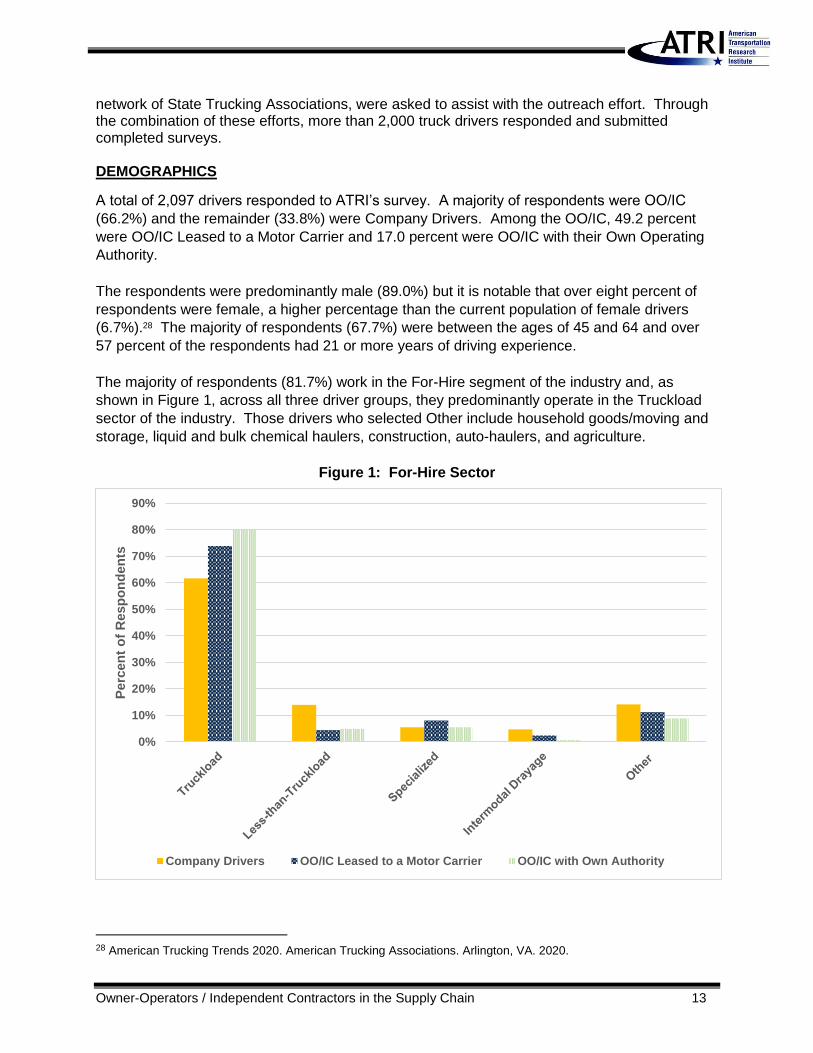
The majority of respondents (81.7%) work in the For-Hire segment of the industry and, as
shown in Figure 1, across all three driver groups, they predominantly operate in the Truckload
sector of the industry. Those drivers who selected Other include household goods/moving and
storage, liquid and bulk chemical haulers, construction, auto-haulers, and agriculture.
Figure 1: For-Hire Sector
28 American Trucking Trends 2020. American Trucking Associations. Arlington, VA. 2020.
0%
10%
20%
30%
40%
50%
60%
70%
80%
90%
Perc
en
t o
f R
esp
on
den
ts
Company Drivers OO/IC Leased to a Motor Carrier OO/IC with Own Authority
Owner-Operators / Independent Contractors in the Supply Chain 14
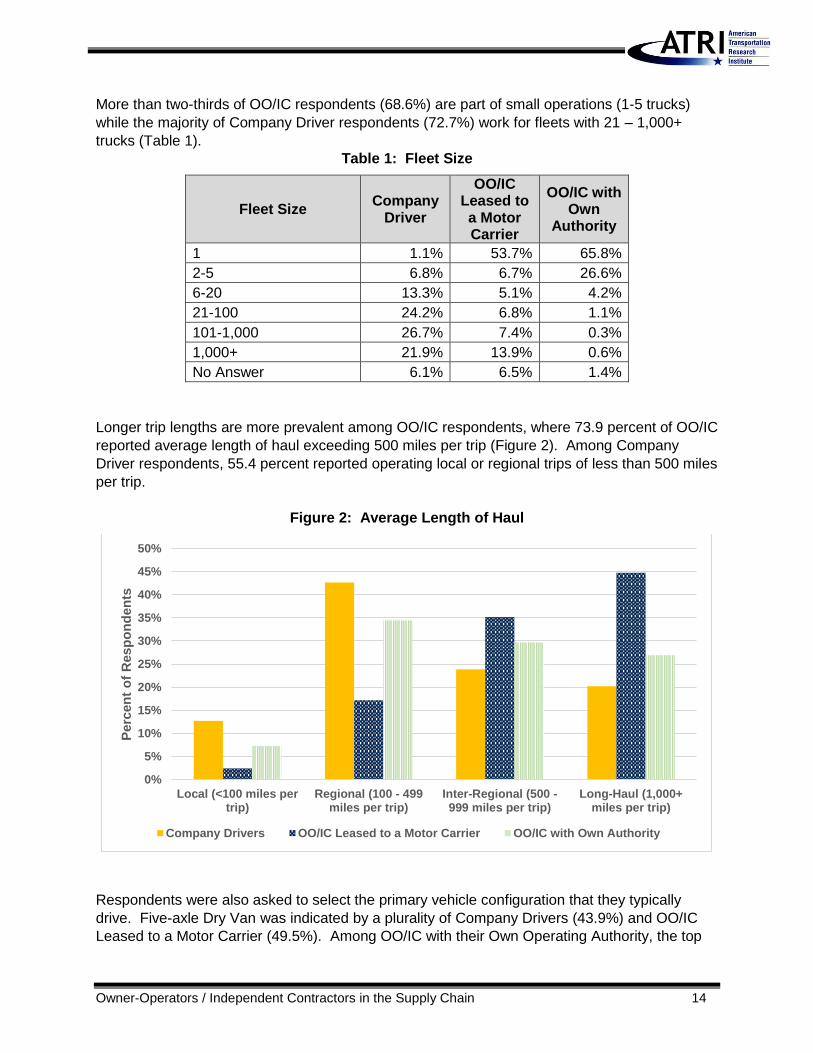
More than two-thirds of OO/IC respondents (68.6%) are part of small operations (1-5 trucks)
while the majority of Company Driver respondents (72.7%) work for fleets with 21 – 1,000+
trucks (Table 1).
Table 1: Fleet Size
Fleet Size Company
Driver
OO/IC Leased to a Motor Carrier
OO/IC with Own
Authority
1 1.1% 53.7% 65.8%
2-5 6.8% 6.7% 26.6%
6-20 13.3% 5.1% 4.2%
21-100 24.2% 6.8% 1.1%
101-1,000 26.7% 7.4% 0.3%
1,000+ 21.9% 13.9% 0.6%
No Answer 6.1% 6.5% 1.4%
Longer trip lengths are more prevalent among OO/IC respondents, where 73.9 percent of OO/IC
reported average length of haul exceeding 500 miles per trip (Figure 2). Among Company
Driver respondents, 55.4 percent reported operating local or regional trips of less than 500 miles
per trip.
Figure 2: Average Length of Haul
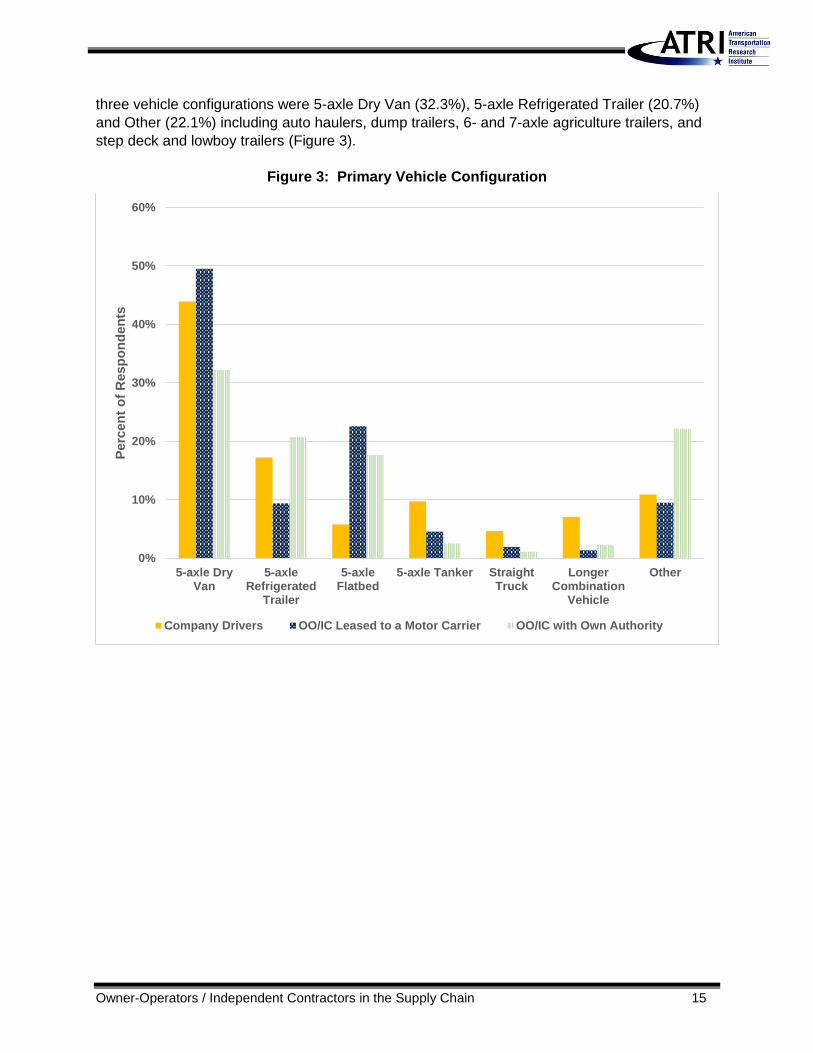
Respondents were also asked to select the primary vehicle configuration that they typically
drive. Five-axle Dry Van was indicated by a plurality of Company Drivers (43.9%) and OO/IC
Leased to a Motor Carrier (49.5%). Among OO/IC with their Own Operating Authority, the top
0%
5%
10%
15%
20%
25%
30%
35%
40%
45%
50%
Local (<100 miles pertrip)
Regional (100 - 499miles per trip)
Inter-Regional (500 -999 miles per trip)
Long-Haul (1,000+miles per trip)
Perc
en
t o
f R
esp
on
den
ts
Company Drivers OO/IC Leased to a Motor Carrier OO/IC with Own Authority
Owner-Operators / Independent Contractors in the Supply Chain 15
three vehicle configurations were 5-axle Dry Van (32.3%), 5-axle Refrigerated Trailer (20.7%)
and Other (22.1%) including auto haulers, dump trailers, 6- and 7-axle agriculture trailers, and
step deck and lowboy trailers (Figure 3).
Figure 3: Primary Vehicle Configuration
0%
10%
20%
30%
40%
50%
60%
5-axle DryVan
5-axleRefrigerated
Trailer
5-axleFlatbed
5-axle Tanker StraightTruck
LongerCombination
Vehicle
Other
Perc
en
t o
f R
esp
on
den
ts
Company Drivers OO/IC Leased to a Motor Carrier OO/IC with Own Authority
Owner-Operators / Independent Contractors in the Supply Chain 16
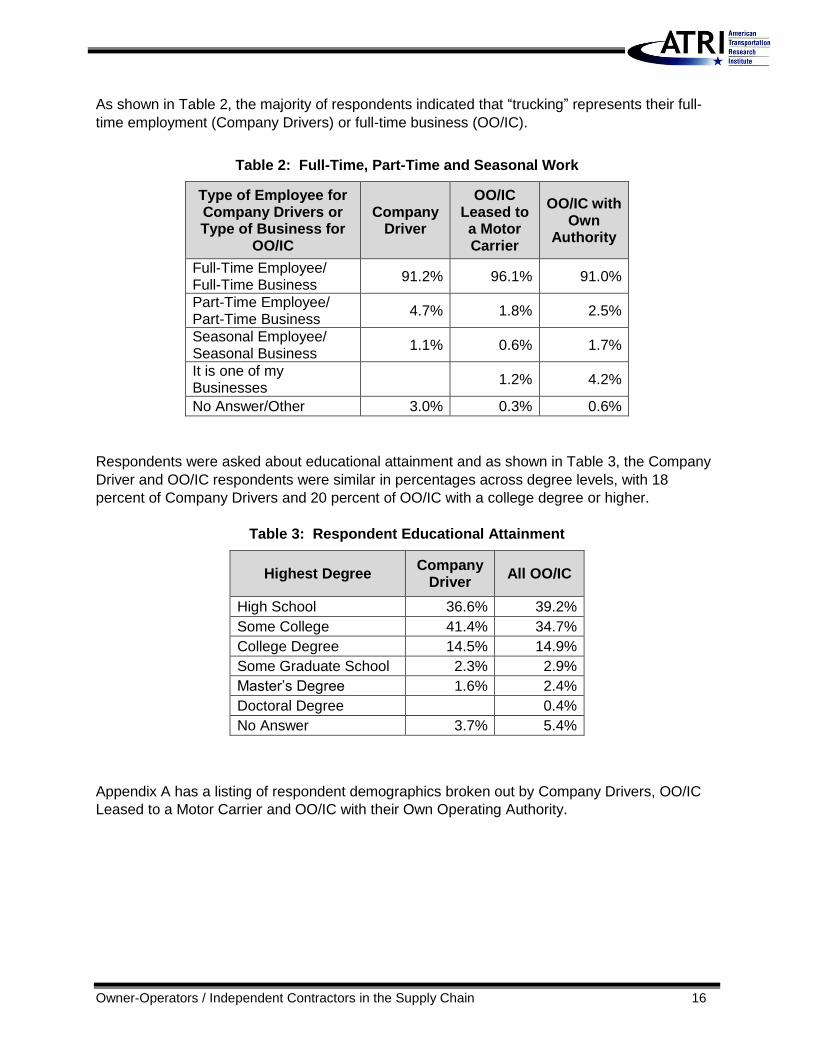
As shown in Table 2, the majority of respondents indicated that “trucking” represents their full-
time employment (Company Drivers) or full-time business (OO/IC).
Table 2: Full-Time, Part-Time and Seasonal Work
Type of Employee for Company Drivers or Type of Business for
OO/IC
Company Driver
OO/IC Leased to a Motor Carrier
OO/IC with Own
Authority
Full-Time Employee/ Full-Time Business
91.2% 96.1% 91.0%
Part-Time Employee/ Part-Time Business
4.7% 1.8% 2.5%
Seasonal Employee/ Seasonal Business
1.1% 0.6% 1.7%
It is one of my Businesses
1.2% 4.2%
No Answer/Other 3.0% 0.3% 0.6%
Respondents were asked about educational attainment and as shown in Table 3, the Company
Driver and OO/IC respondents were similar in percentages across degree levels, with 18
percent of Company Drivers and 20 percent of OO/IC with a college degree or higher.
Table 3: Respondent Educational Attainment
Highest Degree Company
Driver All OO/IC
High School 36.6% 39.2%
Some College 41.4% 34.7%
College Degree 14.5% 14.9%
Some Graduate School 2.3% 2.9%
Master’s Degree 1.6% 2.4%
Doctoral Degree 0.4%
No Answer 3.7% 5.4%
Appendix A has a listing of respondent demographics broken out by Company Drivers, OO/IC
Leased to a Motor Carrier and OO/IC with their Own Operating Authority.
Owner-Operators / Independent Contractors in the Supply Chain 17
FINDINGS
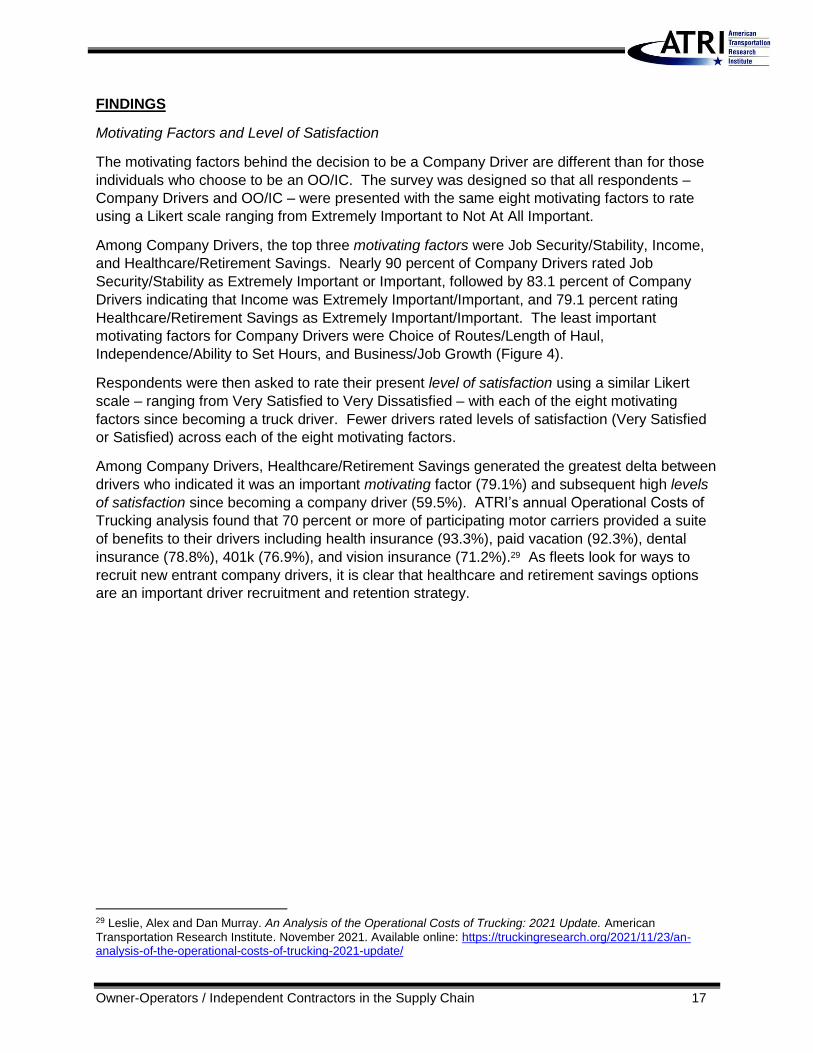
Motivating Factors and Level of Satisfaction
The motivating factors behind the decision to be a Company Driver are different than for those
individuals who choose to be an OO/IC. The survey was designed so that all respondents –
Company Drivers and OO/IC – were presented with the same eight motivating factors to rate
using a Likert scale ranging from Extremely Important to Not At All Important.
Among Company Drivers, the top three motivating factors were Job Security/Stability, Income,
and Healthcare/Retirement Savings. Nearly 90 percent of Company Drivers rated Job
Security/Stability as Extremely Important or Important, followed by 83.1 percent of Company
Drivers indicating that Income was Extremely Important/Important, and 79.1 percent rating
Healthcare/Retirement Savings as Extremely Important/Important. The least important
motivating factors for Company Drivers were Choice of Routes/Length of Haul,
Independence/Ability to Set Hours, and Business/Job Growth (Figure 4).
Respondents were then asked to rate their present level of satisfaction using a similar Likert
scale – ranging from Very Satisfied to Very Dissatisfied – with each of the eight motivating
factors since becoming a truck driver. Fewer drivers rated levels of satisfaction (Very Satisfied
or Satisfied) across each of the eight motivating factors.
Among Company Drivers, Healthcare/Retirement Savings generated the greatest delta between
drivers who indicated it was an important motivating factor (79.1%) and subsequent high levels
of satisfaction since becoming a company driver (59.5%). ATRI’s annual Operational Costs of
Trucking analysis found that 70 percent or more of participating motor carriers provided a suite
of benefits to their drivers including health insurance (93.3%), paid vacation (92.3%), dental
insurance (78.8%), 401k (76.9%), and vision insurance (71.2%).29 As fleets look for ways to
recruit new entrant company drivers, it is clear that healthcare and retirement savings options
are an important driver recruitment and retention strategy.
29 Leslie, Alex and Dan Murray. An Analysis of the Operational Costs of Trucking: 2021 Update. American
Transportation Research Institute. November 2021. Available online: https://truckingresearch.org/2021/11/23/an-analysis-of-the-operational-costs-of-trucking-2021-update/
Owner-Operators / Independent Contractors in the Supply Chain 18
Figure 4: Motivating Factors and Level of Satisfaction for Company Drivers
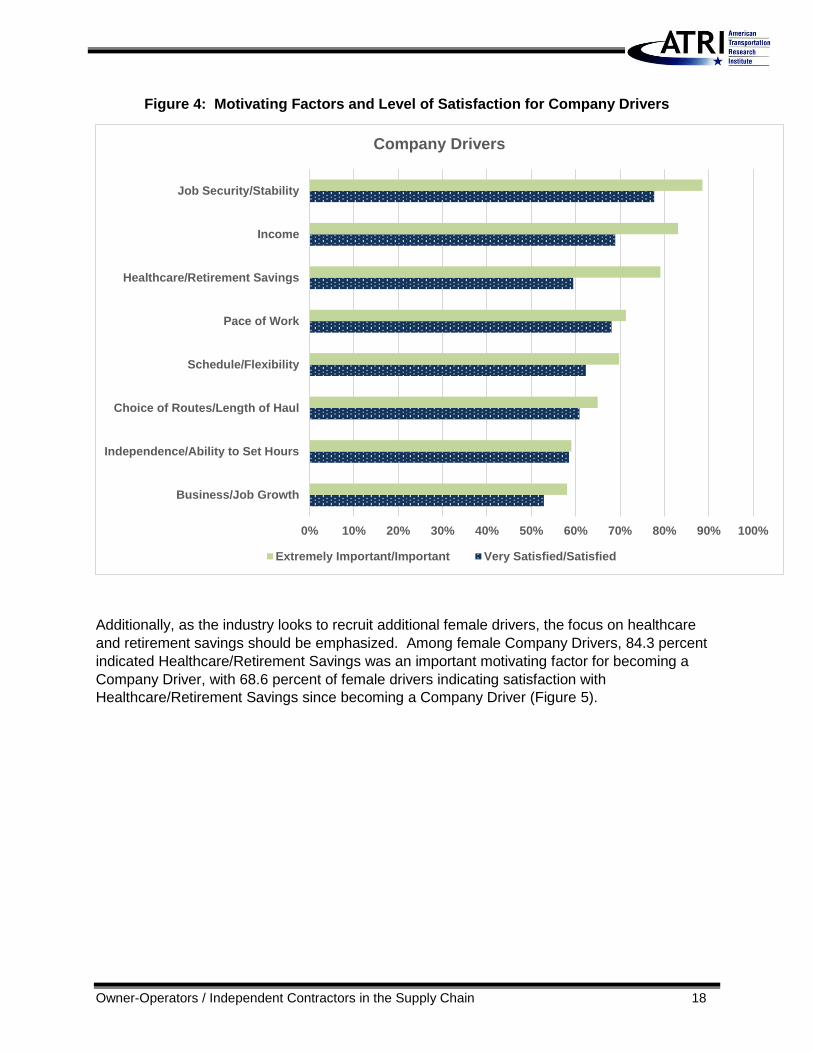
Additionally, as the industry looks to recruit additional female drivers, the focus on healthcare
and retirement savings should be emphasized. Among female Company Drivers, 84.3 percent
indicated Healthcare/Retirement Savings was an important motivating factor for becoming a
Company Driver, with 68.6 percent of female drivers indicating satisfaction with
Healthcare/Retirement Savings since becoming a Company Driver (Figure 5).
0% 10% 20% 30% 40% 50% 60% 70% 80% 90% 100%
Business/Job Growth
Independence/Ability to Set Hours
Choice of Routes/Length of Haul
Schedule/Flexibility
Pace of Work
Healthcare/Retirement Savings
Income
Job Security/Stability
Company Drivers
Extremely Important/Important Very Satisfied/Satisfied
Owner-Operators / Independent Contractors in the Supply Chain 19
Figure 5: Top Motivating Factors and Level of Satisfaction for Female Company Drivers
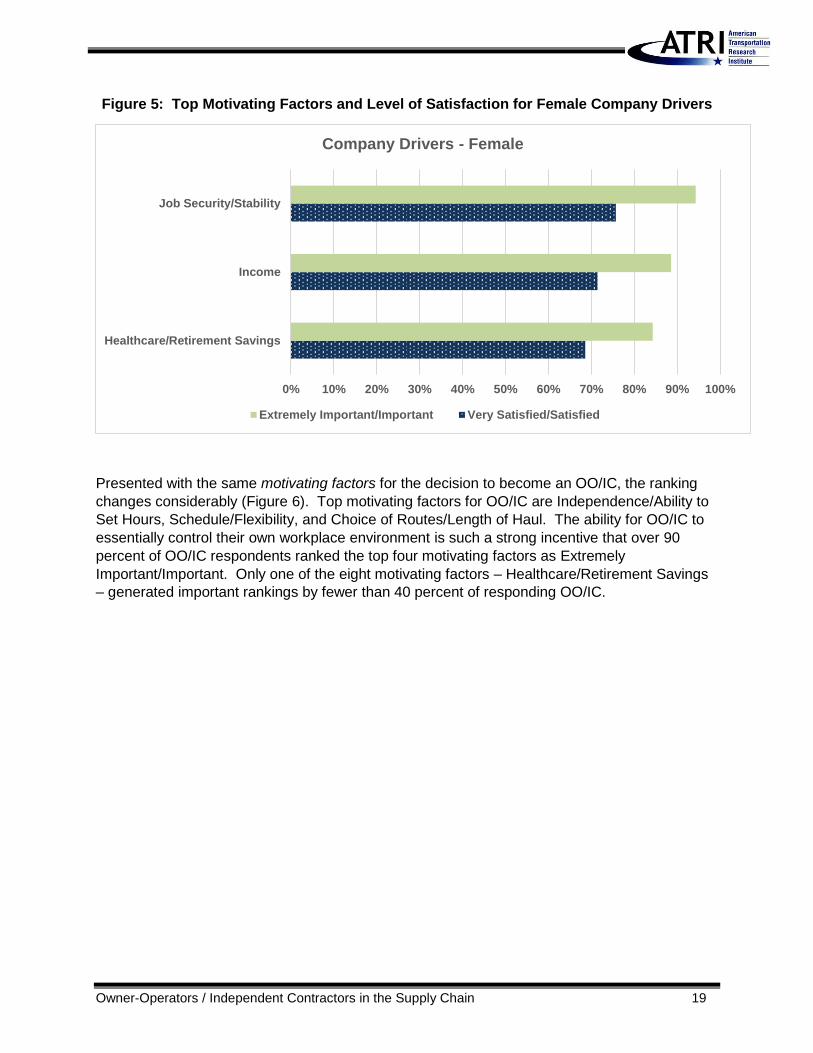
Presented with the same motivating factors for the decision to become an OO/IC, the ranking
changes considerably (Figure 6). Top motivating factors for OO/IC are Independence/Ability to
Set Hours, Schedule/Flexibility, and Choice of Routes/Length of Haul. The ability for OO/IC to
essentially control their own workplace environment is such a strong incentive that over 90
percent of OO/IC respondents ranked the top four motivating factors as Extremely
Important/Important. Only one of the eight motivating factors – Healthcare/Retirement Savings
– generated important rankings by fewer than 40 percent of responding OO/IC.
0% 10% 20% 30% 40% 50% 60% 70% 80% 90% 100%
Healthcare/Retirement Savings
Income
Job Security/Stability
Company Drivers - Female
Extremely Important/Important Very Satisfied/Satisfied
Owner-Operators / Independent Contractors in the Supply Chain 20
Figure 6: Motivating Factors and Level of Satisfaction for OO/IC
In terms of levels of satisfaction with each of the motivating factors, OO/IC, like Company
Drivers, rated lower levels of satisfaction with each than they did the importance of each
motivating factor. Even so, over 80 percent of OO/IC indicated they were Very
Satisfied/Satisfied with their Independence/Ability to Set Hours, Schedule/Flexibility, Choice of
Routes/Length of Haul, Income, and Pace of Work.
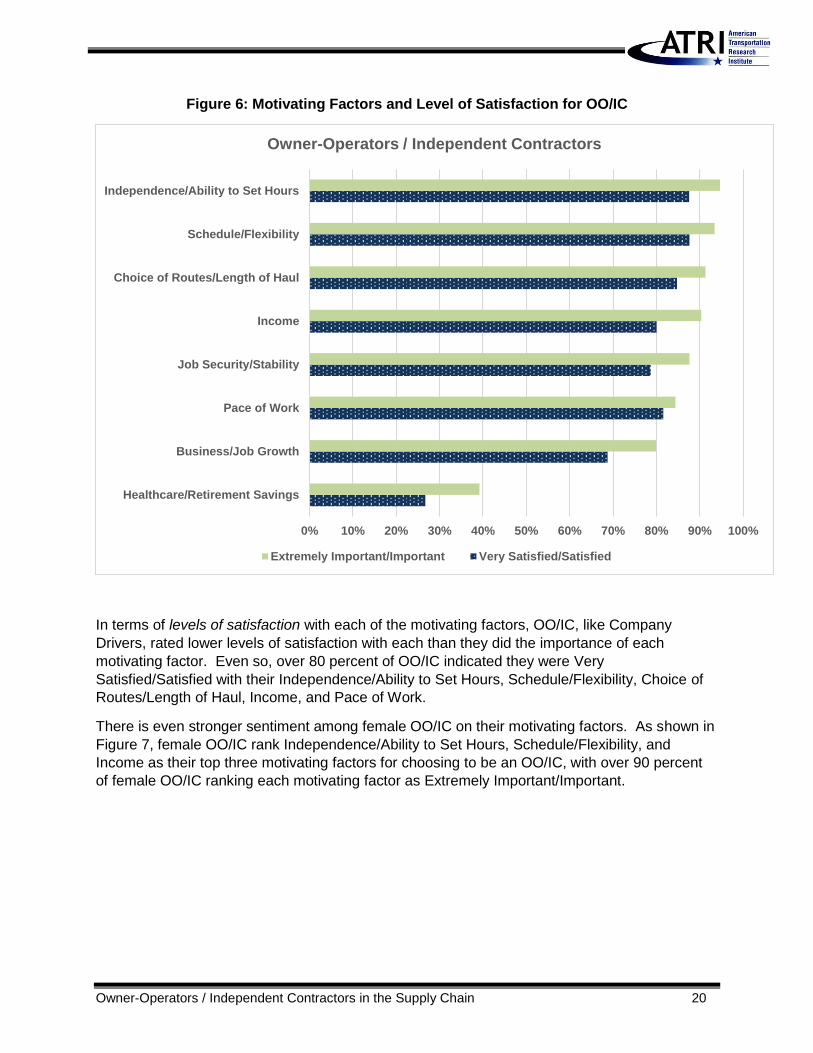
There is even stronger sentiment among female OO/IC on their motivating factors. As shown in
Figure 7, female OO/IC rank Independence/Ability to Set Hours, Schedule/Flexibility, and
Income as their top three motivating factors for choosing to be an OO/IC, with over 90 percent
of female OO/IC ranking each motivating factor as Extremely Important/Important.
0% 10% 20% 30% 40% 50% 60% 70% 80% 90% 100%
Healthcare/Retirement Savings
Business/Job Growth
Pace of Work
Job Security/Stability
Income
Choice of Routes/Length of Haul
Schedule/Flexibility
Independence/Ability to Set Hours
Owner-Operators / Independent Contractors
Extremely Important/Important Very Satisfied/Satisfied
Owner-Operators / Independent Contractors in the Supply Chain 21
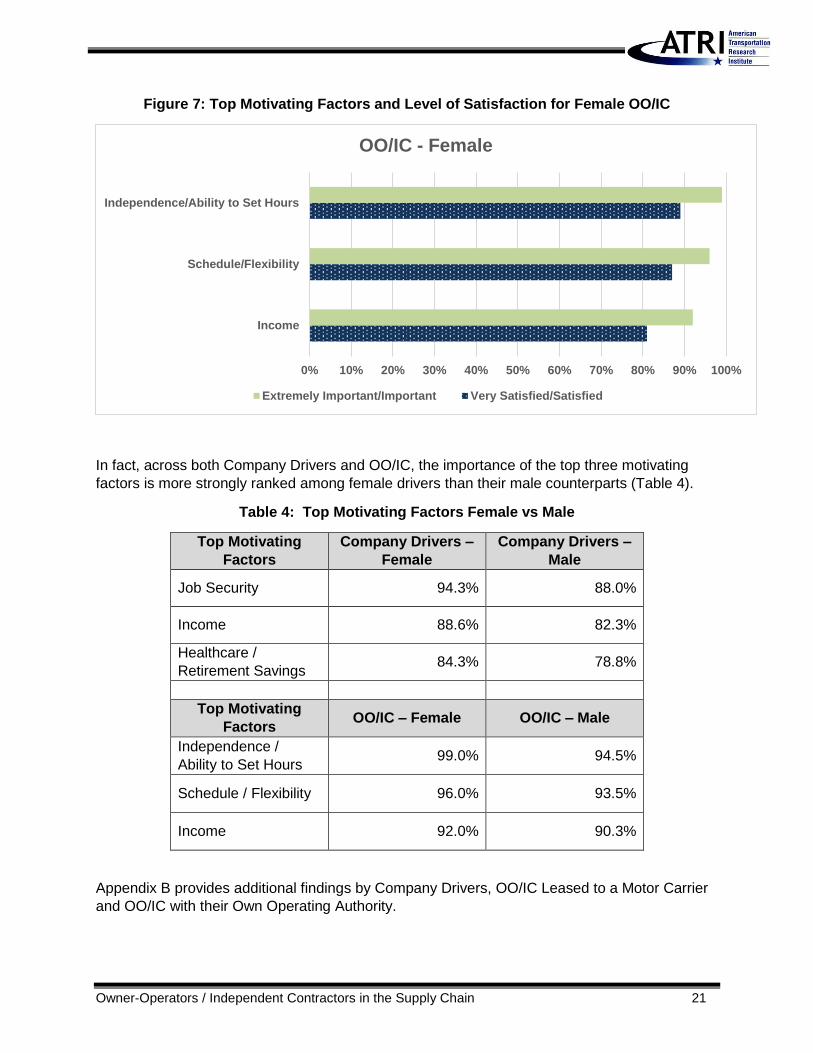
Figure 7: Top Motivating Factors and Level of Satisfaction for Female OO/IC
In fact, across both Company Drivers and OO/IC, the importance of the top three motivating
factors is more strongly ranked among female drivers than their male counterparts (Table 4).
Table 4: Top Motivating Factors Female vs Male
Top Motivating
Factors
Company Drivers –
Female
Company Drivers –
Male
Job Security 94.3% 88.0%
Income 88.6% 82.3%
Healthcare /
Retirement Savings 84.3% 78.8%
Top Motivating
Factors OO/IC – Female OO/IC – Male
Independence /
Ability to Set Hours 99.0% 94.5%
Schedule / Flexibility 96.0% 93.5%
Income 92.0% 90.3%
Appendix B provides additional findings by Company Drivers, OO/IC Leased to a Motor Carrier
and OO/IC with their Own Operating Authority.
0% 10% 20% 30% 40% 50% 60% 70% 80% 90% 100%
Income
Schedule/Flexibility
Independence/Ability to Set Hours
OO/IC - Female
Extremely Important/Important Very Satisfied/Satisfied
Owner-Operators / Independent Contractors in the Supply Chain 22
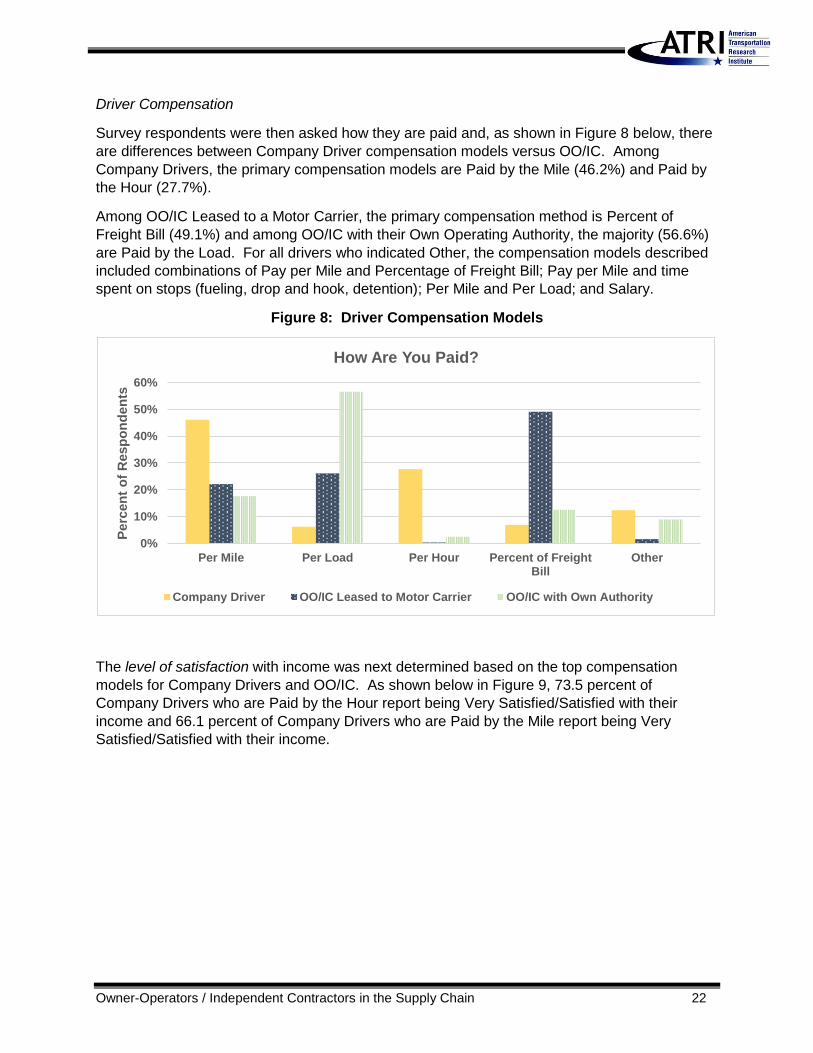
Driver Compensation
Survey respondents were then asked how they are paid and, as shown in Figure 8 below, there
are differences between Company Driver compensation models versus OO/IC. Among
Company Drivers, the primary compensation models are Paid by the Mile (46.2%) and Paid by
the Hour (27.7%).
Among OO/IC Leased to a Motor Carrier, the primary compensation method is Percent of
Freight Bill (49.1%) and among OO/IC with their Own Operating Authority, the majority (56.6%)
are Paid by the Load. For all drivers who indicated Other, the compensation models described
included combinations of Pay per Mile and Percentage of Freight Bill; Pay per Mile and time
spent on stops (fueling, drop and hook, detention); Per Mile and Per Load; and Salary.
Figure 8: Driver Compensation Models
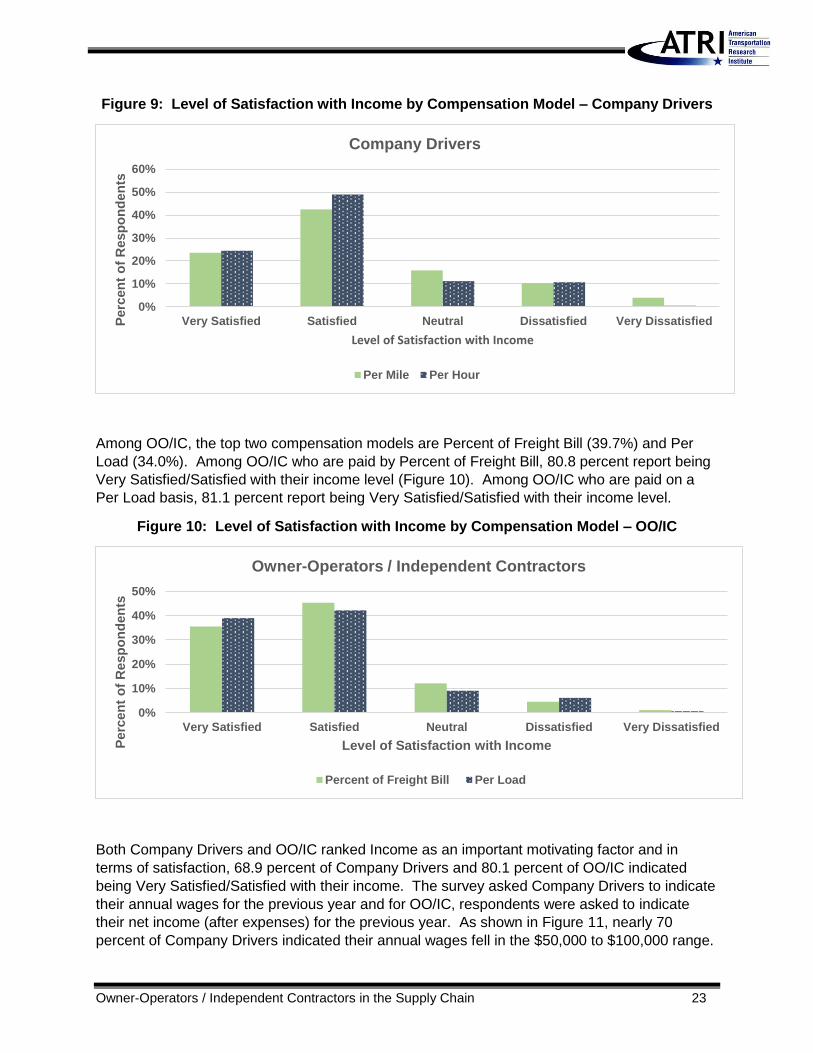
The level of satisfaction with income was next determined based on the top compensation
models for Company Drivers and OO/IC. As shown below in Figure 9, 73.5 percent of
Company Drivers who are Paid by the Hour report being Very Satisfied/Satisfied with their
income and 66.1 percent of Company Drivers who are Paid by the Mile report being Very
Satisfied/Satisfied with their income.
0%
10%
20%
30%
40%
50%
60%
Per Mile Per Load Per Hour Percent of FreightBill
Other
Perc
en
t o
f R
esp
on
den
ts
How Are You Paid?
Company Driver OO/IC Leased to Motor Carrier OO/IC with Own Authority
Owner-Operators / Independent Contractors in the Supply Chain 23
Figure 9: Level of Satisfaction with Income by Compensation Model – Company Drivers
Among OO/IC, the top two compensation models are Percent of Freight Bill (39.7%) and Per
Load (34.0%). Among OO/IC who are paid by Percent of Freight Bill, 80.8 percent report being
Very Satisfied/Satisfied with their income level (Figure 10). Among OO/IC who are paid on a
Per Load basis, 81.1 percent report being Very Satisfied/Satisfied with their income level.
Figure 10: Level of Satisfaction with Income by Compensation Model – OO/IC
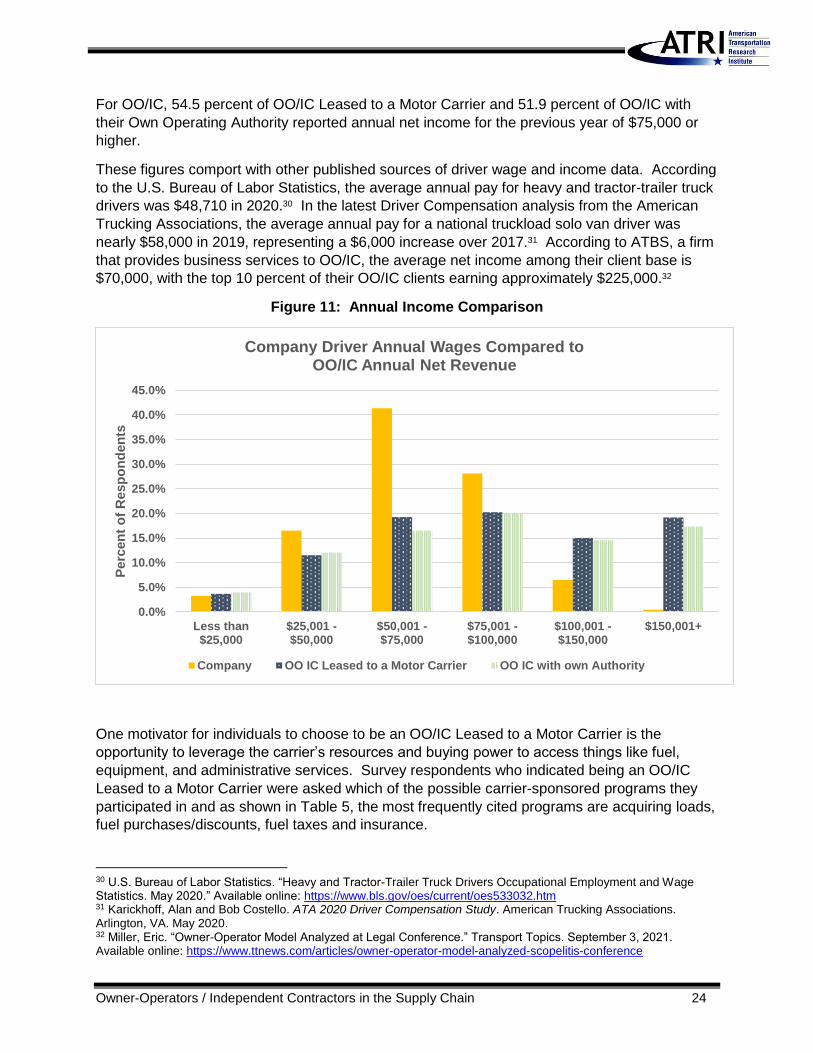
Both Company Drivers and OO/IC ranked Income as an important motivating factor and in
terms of satisfaction, 68.9 percent of Company Drivers and 80.1 percent of OO/IC indicated
being Very Satisfied/Satisfied with their income. The survey asked Company Drivers to indicate
their annual wages for the previous year and for OO/IC, respondents were asked to indicate
their net income (after expenses) for the previous year. As shown in Figure 11, nearly 70
percent of Company Drivers indicated their annual wages fell in the $50,000 to $100,000 range.
0%
10%
20%
30%
40%
50%
60%
Very Satisfied Satisfied Neutral Dissatisfied Very DissatisfiedPerc
en
t o
f R
esp
on
den
ts
Level of Satisfaction with Income
Company Drivers
Per Mile Per Hour
0%
10%
20%
30%
40%
50%
Very Satisfied Satisfied Neutral Dissatisfied Very Dissatisfied
Perc
en
t o
f R
esp
on
den
ts
Level of Satisfaction with Income
Owner-Operators / Independent Contractors
Percent of Freight Bill Per Load
Owner-Operators / Independent Contractors in the Supply Chain 24
For OO/IC, 54.5 percent of OO/IC Leased to a Motor Carrier and 51.9 percent of OO/IC with
their Own Operating Authority reported annual net income for the previous year of $75,000 or
higher.
These figures comport with other published sources of driver wage and income data. According
to the U.S. Bureau of Labor Statistics, the average annual pay for heavy and tractor-trailer truck
drivers was $48,710 in 2020.30 In the latest Driver Compensation analysis from the American
Trucking Associations, the average annual pay for a national truckload solo van driver was
nearly $58,000 in 2019, representing a $6,000 increase over 2017.31 According to ATBS, a firm
that provides business services to OO/IC, the average net income among their client base is
$70,000, with the top 10 percent of their OO/IC clients earning approximately $225,000.32
Figure 11: Annual Income Comparison
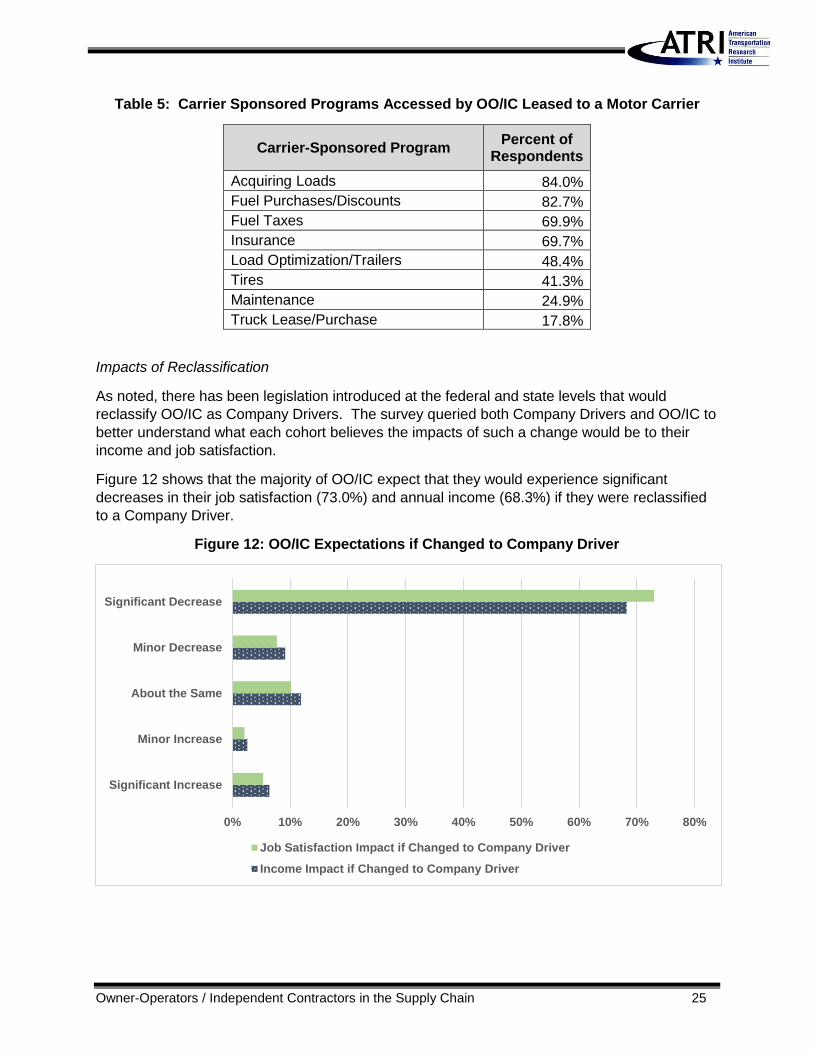
One motivator for individuals to choose to be an OO/IC Leased to a Motor Carrier is the
opportunity to leverage the carrier’s resources and buying power to access things like fuel,
equipment, and administrative services. Survey respondents who indicated being an OO/IC
Leased to a Motor Carrier were asked which of the possible carrier-sponsored programs they
participated in and as shown in Table 5, the most frequently cited programs are acquiring loads,
fuel purchases/discounts, fuel taxes and insurance.
30 U.S. Bureau of Labor Statistics. “Heavy and Tractor-Trailer Truck Drivers Occupational Employment and Wage Statistics. May 2020.” Available online: https://www.bls.gov/oes/current/oes533032.htm 31 Karickhoff, Alan and Bob Costello. ATA 2020 Driver Compensation Study. American Trucking Associations. Arlington, VA. May 2020. 32 Miller, Eric. “Owner-Operator Model Analyzed at Legal Conference.” Transport Topics. September 3, 2021. Available online: https://www.ttnews.com/articles/owner-operator-model-analyzed-scopelitis-conference
0.0%
5.0%
10.0%
15.0%
20.0%
25.0%
30.0%
35.0%
40.0%
45.0%
Less than$25,000
$25,001 -$50,000
$50,001 -$75,000
$75,001 -$100,000
$100,001 -$150,000
$150,001+
Perc
en
t o
f R
esp
on
den
ts
Company Driver Annual Wages Compared to OO/IC Annual Net Revenue
Company OO IC Leased to a Motor Carrier OO IC with own Authority
Owner-Operators / Independent Contractors in the Supply Chain 25
Table 5: Carrier Sponsored Programs Accessed by OO/IC Leased to a Motor Carrier
Carrier-Sponsored Program Percent of
Respondents
Acquiring Loads 84.0%
Fuel Purchases/Discounts 82.7%
Fuel Taxes 69.9%
Insurance 69.7%
Load Optimization/Trailers 48.4%
Tires 41.3%
Maintenance 24.9%
Truck Lease/Purchase 17.8%
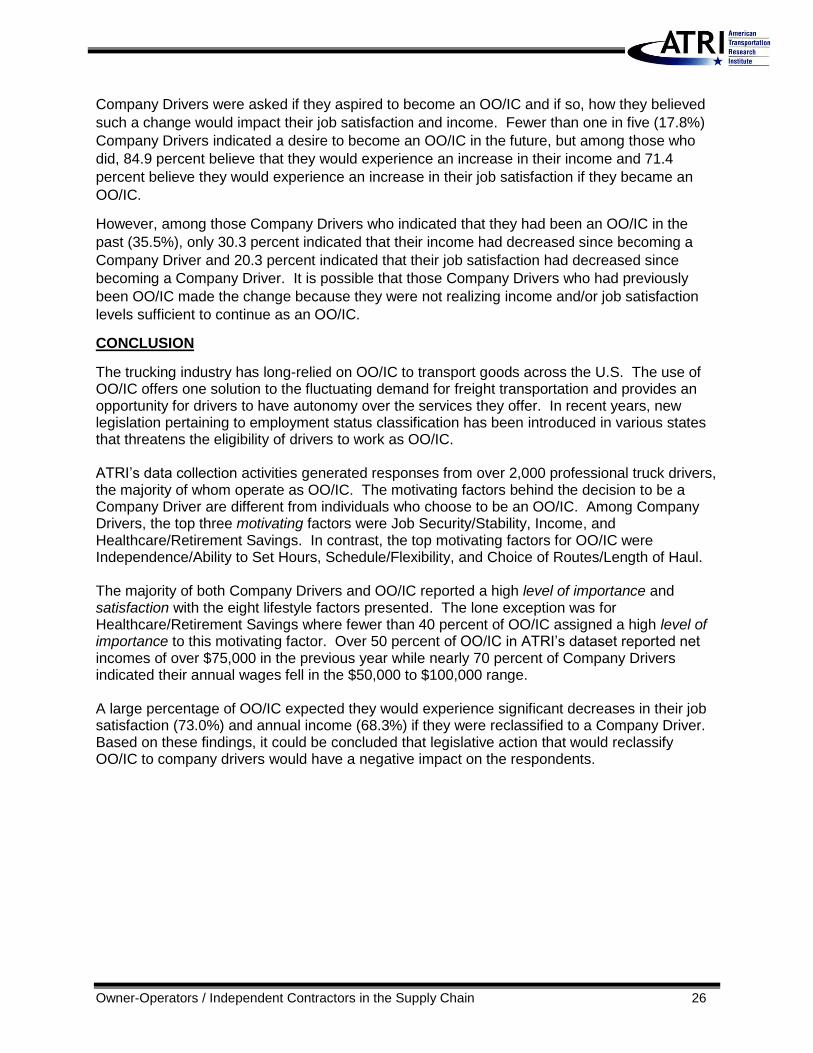
Impacts of Reclassification
As noted, there has been legislation introduced at the federal and state levels that would
reclassify OO/IC as Company Drivers. The survey queried both Company Drivers and OO/IC to
better understand what each cohort believes the impacts of such a change would be to their
income and job satisfaction.
Figure 12 shows that the majority of OO/IC expect that they would experience significant
decreases in their job satisfaction (73.0%) and annual income (68.3%) if they were reclassified
to a Company Driver.
Figure 12: OO/IC Expectations if Changed to Company Driver
0% 10% 20% 30% 40% 50% 60% 70% 80%
Significant Increase
Minor Increase
About the Same
Minor Decrease
Significant Decrease
Job Satisfaction Impact if Changed to Company Driver
Income Impact if Changed to Company Driver
Owner-Operators / Independent Contractors in the Supply Chain 26
Company Drivers were asked if they aspired to become an OO/IC and if so, how they believed
such a change would impact their job satisfaction and income. Fewer than one in five (17.8%)
Company Drivers indicated a desire to become an OO/IC in the future, but among those who
did, 84.9 percent believe that they would experience an increase in their income and 71.4
percent believe they would experience an increase in their job satisfaction if they became an
OO/IC.
However, among those Company Drivers who indicated that they had been an OO/IC in the
past (35.5%), only 30.3 percent indicated that their income had decreased since becoming a
Company Driver and 20.3 percent indicated that their job satisfaction had decreased since
becoming a Company Driver. It is possible that those Company Drivers who had previously
been OO/IC made the change because they were not realizing income and/or job satisfaction
levels sufficient to continue as an OO/IC.
CONCLUSION
The trucking industry has long-relied on OO/IC to transport goods across the U.S. The use of OO/IC offers one solution to the fluctuating demand for freight transportation and provides an opportunity for drivers to have autonomy over the services they offer. In recent years, new legislation pertaining to employment status classification has been introduced in various states that threatens the eligibility of drivers to work as OO/IC. ATRI’s data collection activities generated responses from over 2,000 professional truck drivers, the majority of whom operate as OO/IC. The motivating factors behind the decision to be a Company Driver are different from individuals who choose to be an OO/IC. Among Company Drivers, the top three motivating factors were Job Security/Stability, Income, and Healthcare/Retirement Savings. In contrast, the top motivating factors for OO/IC were Independence/Ability to Set Hours, Schedule/Flexibility, and Choice of Routes/Length of Haul. The majority of both Company Drivers and OO/IC reported a high level of importance and satisfaction with the eight lifestyle factors presented. The lone exception was for Healthcare/Retirement Savings where fewer than 40 percent of OO/IC assigned a high level of importance to this motivating factor. Over 50 percent of OO/IC in ATRI’s dataset reported net incomes of over $75,000 in the previous year while nearly 70 percent of Company Drivers indicated their annual wages fell in the $50,000 to $100,000 range. A large percentage of OO/IC expected they would experience significant decreases in their job satisfaction (73.0%) and annual income (68.3%) if they were reclassified to a Company Driver. Based on these findings, it could be concluded that legislative action that would reclassify OO/IC to company drivers would have a negative impact on the respondents.
Owner-Operators / Independent Contractors in the Supply Chain 27
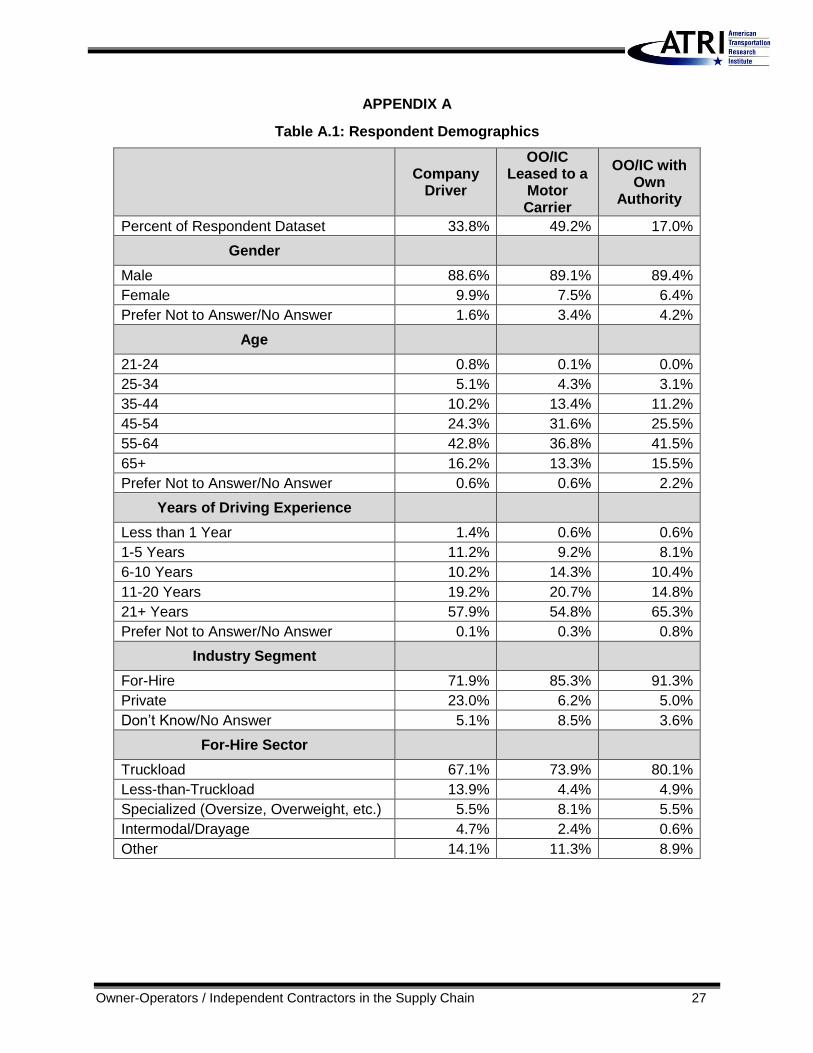
APPENDIX A
Table A.1: Respondent Demographics
Company
Driver
OO/IC Leased to a
Motor Carrier
OO/IC with Own
Authority
Percent of Respondent Dataset 33.8% 49.2% 17.0%
Gender
Male 88.6% 89.1% 89.4%
Female 9.9% 7.5% 6.4%
Prefer Not to Answer/No Answer 1.6% 3.4% 4.2%
Age
21-24 0.8% 0.1% 0.0%
25-34 5.1% 4.3% 3.1%
35-44 10.2% 13.4% 11.2%
45-54 24.3% 31.6% 25.5%
55-64 42.8% 36.8% 41.5%
65+ 16.2% 13.3% 15.5%
Prefer Not to Answer/No Answer 0.6% 0.6% 2.2%
Years of Driving Experience
Less than 1 Year 1.4% 0.6% 0.6%
1-5 Years 11.2% 9.2% 8.1%
6-10 Years 10.2% 14.3% 10.4%
11-20 Years 19.2% 20.7% 14.8%
21+ Years 57.9% 54.8% 65.3%
Prefer Not to Answer/No Answer 0.1% 0.3% 0.8%
Industry Segment
For-Hire 71.9% 85.3% 91.3%
Private 23.0% 6.2% 5.0%
Don’t Know/No Answer 5.1% 8.5% 3.6%
For-Hire Sector
Truckload 67.1% 73.9% 80.1%
Less-than-Truckload 13.9% 4.4% 4.9%
Specialized (Oversize, Overweight, etc.) 5.5% 8.1% 5.5%
Intermodal/Drayage 4.7% 2.4% 0.6%
Other 14.1% 11.3% 8.9%
Owner-Operators / Independent Contractors in the Supply Chain 28
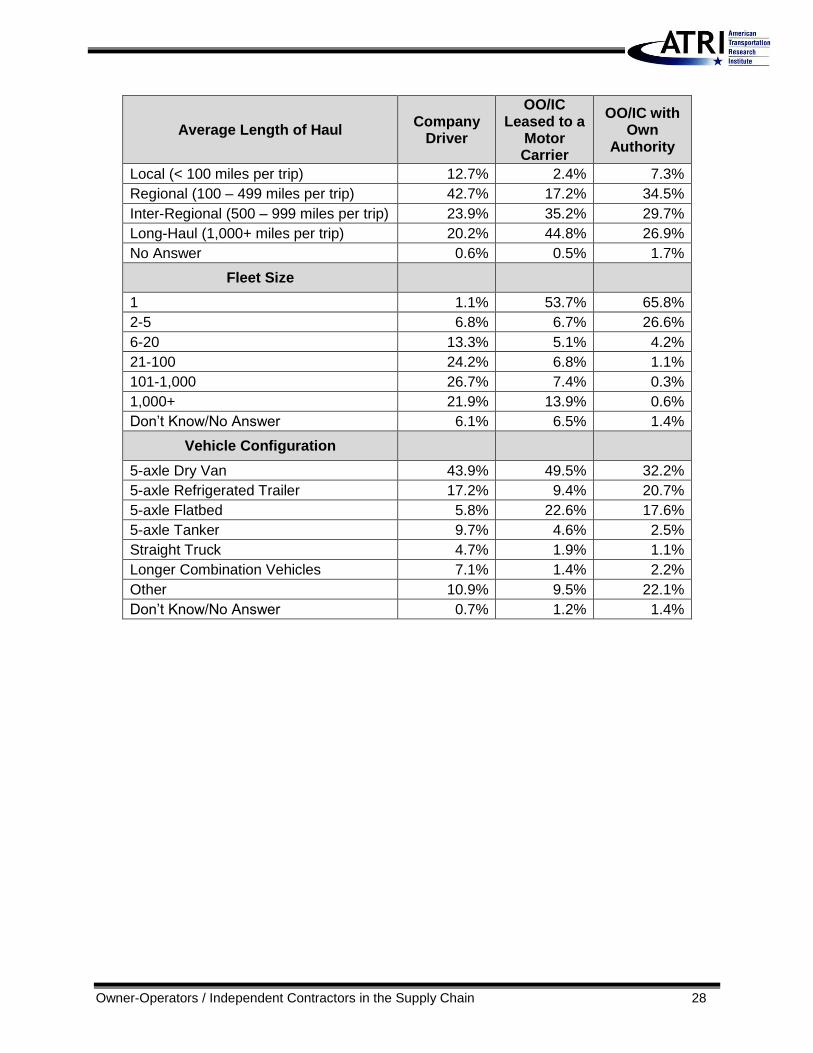
Average Length of Haul Company
Driver
OO/IC Leased to a
Motor Carrier
OO/IC with Own
Authority
Local (< 100 miles per trip) 12.7% 2.4% 7.3%
Regional (100 – 499 miles per trip) 42.7% 17.2% 34.5%
Inter-Regional (500 – 999 miles per trip) 23.9% 35.2% 29.7%
Long-Haul (1,000+ miles per trip) 20.2% 44.8% 26.9%
No Answer 0.6% 0.5% 1.7%
Fleet Size
1 1.1% 53.7% 65.8%
2-5 6.8% 6.7% 26.6%
6-20 13.3% 5.1% 4.2%
21-100 24.2% 6.8% 1.1%
101-1,000 26.7% 7.4% 0.3%
1,000+ 21.9% 13.9% 0.6%
Don’t Know/No Answer 6.1% 6.5% 1.4%
Vehicle Configuration
5-axle Dry Van 43.9% 49.5% 32.2%
5-axle Refrigerated Trailer 17.2% 9.4% 20.7%
5-axle Flatbed 5.8% 22.6% 17.6%
5-axle Tanker 9.7% 4.6% 2.5%
Straight Truck 4.7% 1.9% 1.1%
Longer Combination Vehicles 7.1% 1.4% 2.2%
Other 10.9% 9.5% 22.1%
Don’t Know/No Answer 0.7% 1.2% 1.4%
Owner-Operators / Independent Contractors in the Supply Chain 29
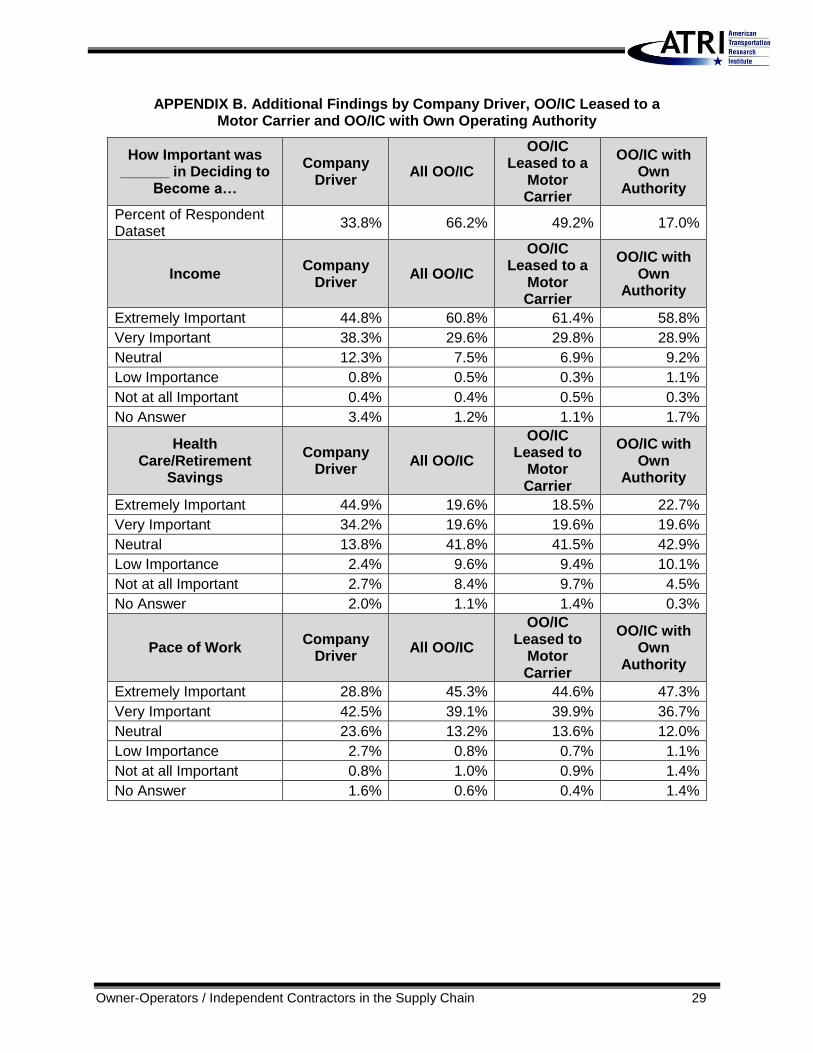
APPENDIX B. Additional Findings by Company Driver, OO/IC Leased to a Motor Carrier and OO/IC with Own Operating Authority
How Important was ______ in Deciding to
Become a…
Company Driver
All OO/IC
OO/IC Leased to a
Motor Carrier
OO/IC with Own
Authority
Percent of Respondent Dataset
33.8% 66.2% 49.2% 17.0%
Income Company
Driver All OO/IC
OO/IC Leased to a
Motor Carrier
OO/IC with Own
Authority
Extremely Important 44.8% 60.8% 61.4% 58.8%
Very Important 38.3% 29.6% 29.8% 28.9%
Neutral 12.3% 7.5% 6.9% 9.2%
Low Importance 0.8% 0.5% 0.3% 1.1%
Not at all Important 0.4% 0.4% 0.5% 0.3%
No Answer 3.4% 1.2% 1.1% 1.7%
Health Care/Retirement
Savings
Company Driver
All OO/IC
OO/IC Leased to
Motor Carrier
OO/IC with Own
Authority
Extremely Important 44.9% 19.6% 18.5% 22.7%
Very Important 34.2% 19.6% 19.6% 19.6%
Neutral 13.8% 41.8% 41.5% 42.9%
Low Importance 2.4% 9.6% 9.4% 10.1%
Not at all Important 2.7% 8.4% 9.7% 4.5%
No Answer 2.0% 1.1% 1.4% 0.3%
Pace of Work Company
Driver All OO/IC
OO/IC Leased to
Motor Carrier
OO/IC with Own
Authority
Extremely Important 28.8% 45.3% 44.6% 47.3%
Very Important 42.5% 39.1% 39.9% 36.7%
Neutral 23.6% 13.2% 13.6% 12.0%
Low Importance 2.7% 0.8% 0.7% 1.1%
Not at all Important 0.8% 1.0% 0.9% 1.4%
No Answer 1.6% 0.6% 0.4% 1.4%

Owner-Operators / Independent Contractors in the Supply Chain 30
Independence / Ability to Set Hours
Company Driver
All OO/IC
OO/IC Leased to
Motor Carrier
OO/IC with Own
Authority
Extremely Important 24.3% 70.9% 70.3% 72.8%
Very Important 34.7% 23.8% 24.5% 21.6%
Neutral 32.2% 4.3% 4.5% 3.9%
Low Importance 4.9% 0.4% 0.4% 0.6%
Not at all Important 2.5% 0.4% 0.3% 0.8%
No Answer 1.3% 0.1% 0.1% 0.3%
Schedule / Flexibility Company
Driver All OO/IC
OO/IC Leased to
Motor Carrier
OO/IC with Own
Authority
Extremely Important 30.2% 69.8% 69.9% 69.7%
Very Important 39.5% 23.6% 23.7% 23.2%
Neutral 25.1% 5.2% 5.1% 5.3%
Low Importance 2.7% 0.4% 0.4% 0.6%
Not at all Important 1.3% 0.4% 0.4% 0.6%
No Answer 1.1% 0.5% 0.1% 0.6%
Choice of Routes / Length of Haul
Company Driver
All OO/IC
OO/IC Leased to
Motor Carrier
OO/IC with Own
Authority
Extremely Important 30.9% 66.6% 65.3% 70.3%
Very Important 34.0% 24.7% 25.8% 21.6%
Neutral 26.6% 7.1% 7.2% 6.7%
Low Importance 4.9% 0.9% 1.1% 0.6%
Not at all Important 2.5% 0.6% 0.6% 0.6%
No Answer 1.0% 0.1% 0.1% 0.3%
Business / Job Growth Company
Driver All OO/IC
OO/IC Leased to
Motor Carrier
OO/IC with Own
Authority
Extremely Important 22.2% 47.1% 46.2% 49.6%
Very Important 35.9% 32.8% 34.7% 27.5%
Neutral 33.2% 17.1% 16.6% 18.5%
Low Importance 4.2% 1.8% 1.5% 2.8%
Not at all Important 2.5% 0.6% 0.7% 0.6%
No Answer 2.0% 0.6% 0.4% 1.1%
Owner-Operators / Independent Contractors in the Supply Chain 31
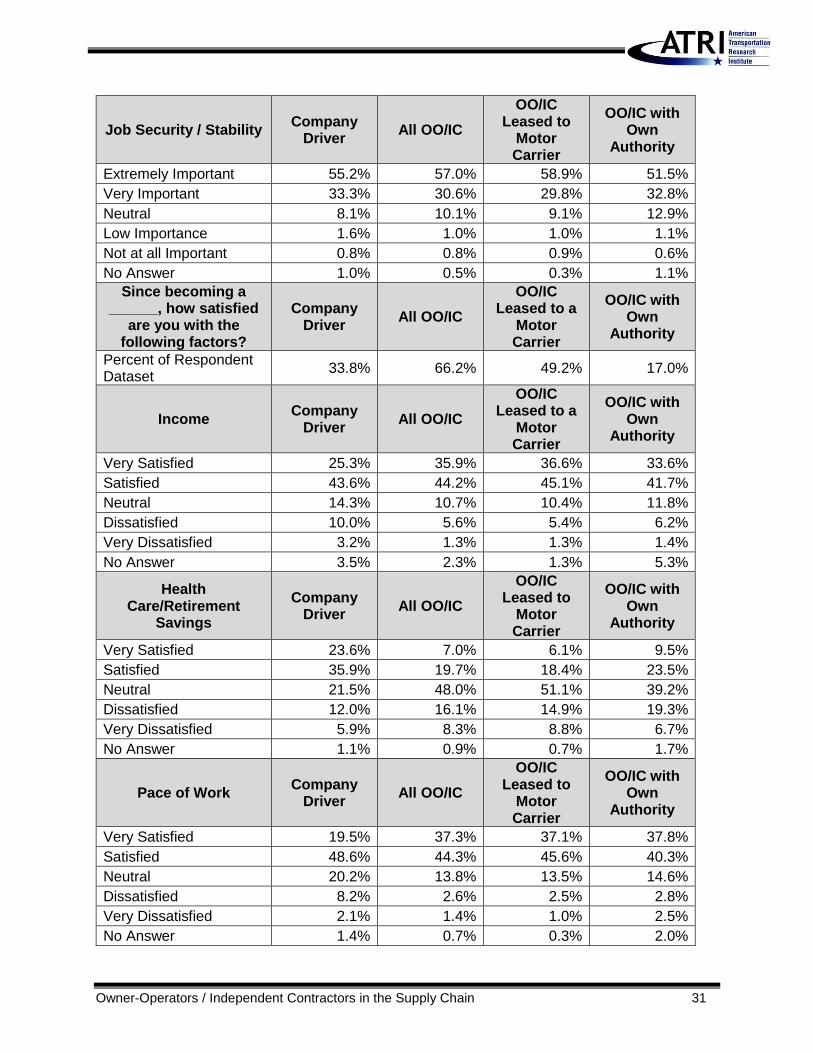
Job Security / Stability Company
Driver All OO/IC
OO/IC Leased to
Motor Carrier
OO/IC with Own
Authority
Extremely Important 55.2% 57.0% 58.9% 51.5%
Very Important 33.3% 30.6% 29.8% 32.8%
Neutral 8.1% 10.1% 9.1% 12.9%
Low Importance 1.6% 1.0% 1.0% 1.1%
Not at all Important 0.8% 0.8% 0.9% 0.6%
No Answer 1.0% 0.5% 0.3% 1.1%
Since becoming a ______, how satisfied
are you with the following factors?
Company Driver
All OO/IC
OO/IC Leased to a
Motor Carrier
OO/IC with Own
Authority
Percent of Respondent Dataset
33.8% 66.2% 49.2% 17.0%
Income Company
Driver All OO/IC
OO/IC Leased to a
Motor Carrier
OO/IC with Own
Authority
Very Satisfied 25.3% 35.9% 36.6% 33.6%
Satisfied 43.6% 44.2% 45.1% 41.7%
Neutral 14.3% 10.7% 10.4% 11.8%
Dissatisfied 10.0% 5.6% 5.4% 6.2%
Very Dissatisfied 3.2% 1.3% 1.3% 1.4%
No Answer 3.5% 2.3% 1.3% 5.3%
Health Care/Retirement
Savings
Company Driver
All OO/IC
OO/IC Leased to
Motor Carrier
OO/IC with Own
Authority
Very Satisfied 23.6% 7.0% 6.1% 9.5%
Satisfied 35.9% 19.7% 18.4% 23.5%
Neutral 21.5% 48.0% 51.1% 39.2%
Dissatisfied 12.0% 16.1% 14.9% 19.3%
Very Dissatisfied 5.9% 8.3% 8.8% 6.7%
No Answer 1.1% 0.9% 0.7% 1.7%
Pace of Work Company
Driver All OO/IC
OO/IC Leased to
Motor Carrier
OO/IC with Own
Authority
Very Satisfied 19.5% 37.3% 37.1% 37.8%
Satisfied 48.6% 44.3% 45.6% 40.3%
Neutral 20.2% 13.8% 13.5% 14.6%
Dissatisfied 8.2% 2.6% 2.5% 2.8%
Very Dissatisfied 2.1% 1.4% 1.0% 2.5%
No Answer 1.4% 0.7% 0.3% 2.0%
Owner-Operators / Independent Contractors in the Supply Chain 32
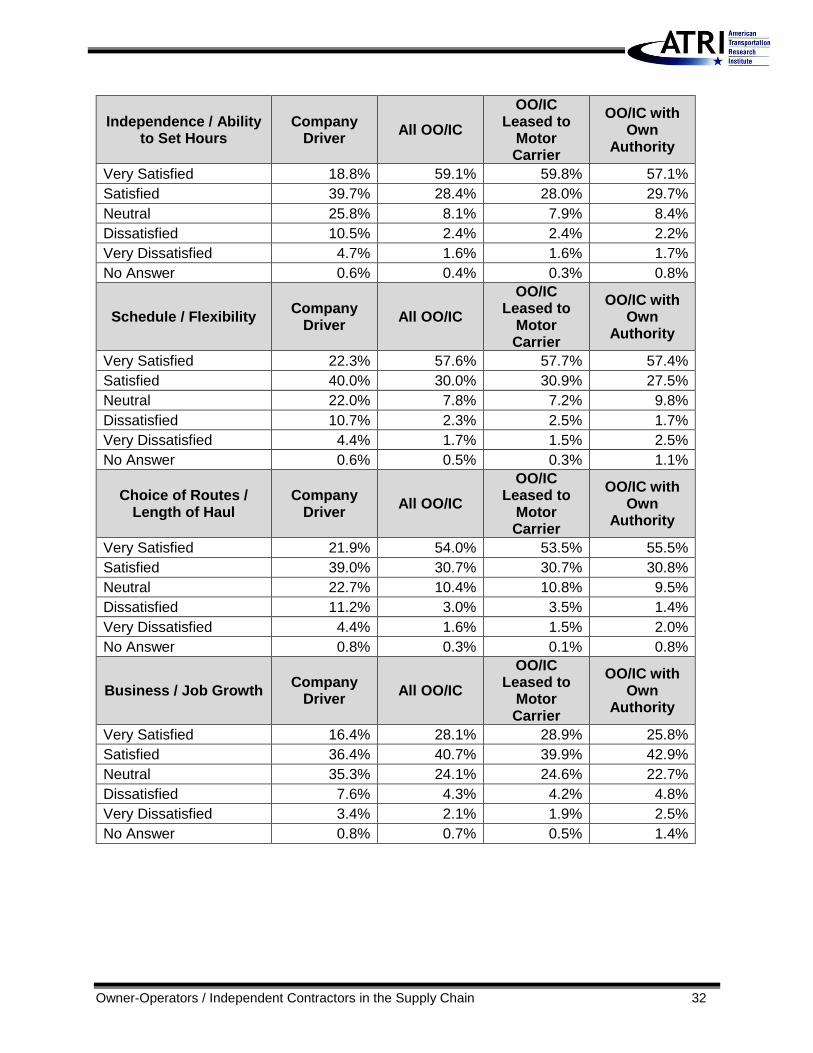
Independence / Ability to Set Hours
Company Driver
All OO/IC
OO/IC Leased to
Motor Carrier
OO/IC with Own
Authority
Very Satisfied 18.8% 59.1% 59.8% 57.1%
Satisfied 39.7% 28.4% 28.0% 29.7%
Neutral 25.8% 8.1% 7.9% 8.4%
Dissatisfied 10.5% 2.4% 2.4% 2.2%
Very Dissatisfied 4.7% 1.6% 1.6% 1.7%
No Answer 0.6% 0.4% 0.3% 0.8%
Schedule / Flexibility Company
Driver All OO/IC
OO/IC Leased to
Motor Carrier
OO/IC with Own
Authority
Very Satisfied 22.3% 57.6% 57.7% 57.4%
Satisfied 40.0% 30.0% 30.9% 27.5%
Neutral 22.0% 7.8% 7.2% 9.8%
Dissatisfied 10.7% 2.3% 2.5% 1.7%
Very Dissatisfied 4.4% 1.7% 1.5% 2.5%
No Answer 0.6% 0.5% 0.3% 1.1%
Choice of Routes / Length of Haul
Company Driver
All OO/IC
OO/IC Leased to
Motor Carrier
OO/IC with Own
Authority
Very Satisfied 21.9% 54.0% 53.5% 55.5%
Satisfied 39.0% 30.7% 30.7% 30.8%
Neutral 22.7% 10.4% 10.8% 9.5%
Dissatisfied 11.2% 3.0% 3.5% 1.4%
Very Dissatisfied 4.4% 1.6% 1.5% 2.0%
No Answer 0.8% 0.3% 0.1% 0.8%
Business / Job Growth Company
Driver All OO/IC
OO/IC Leased to
Motor Carrier
OO/IC with Own
Authority
Very Satisfied 16.4% 28.1% 28.9% 25.8%
Satisfied 36.4% 40.7% 39.9% 42.9%
Neutral 35.3% 24.1% 24.6% 22.7%
Dissatisfied 7.6% 4.3% 4.2% 4.8%
Very Dissatisfied 3.4% 2.1% 1.9% 2.5%
No Answer 0.8% 0.7% 0.5% 1.4%
Owner-Operators / Independent Contractors in the Supply Chain 33
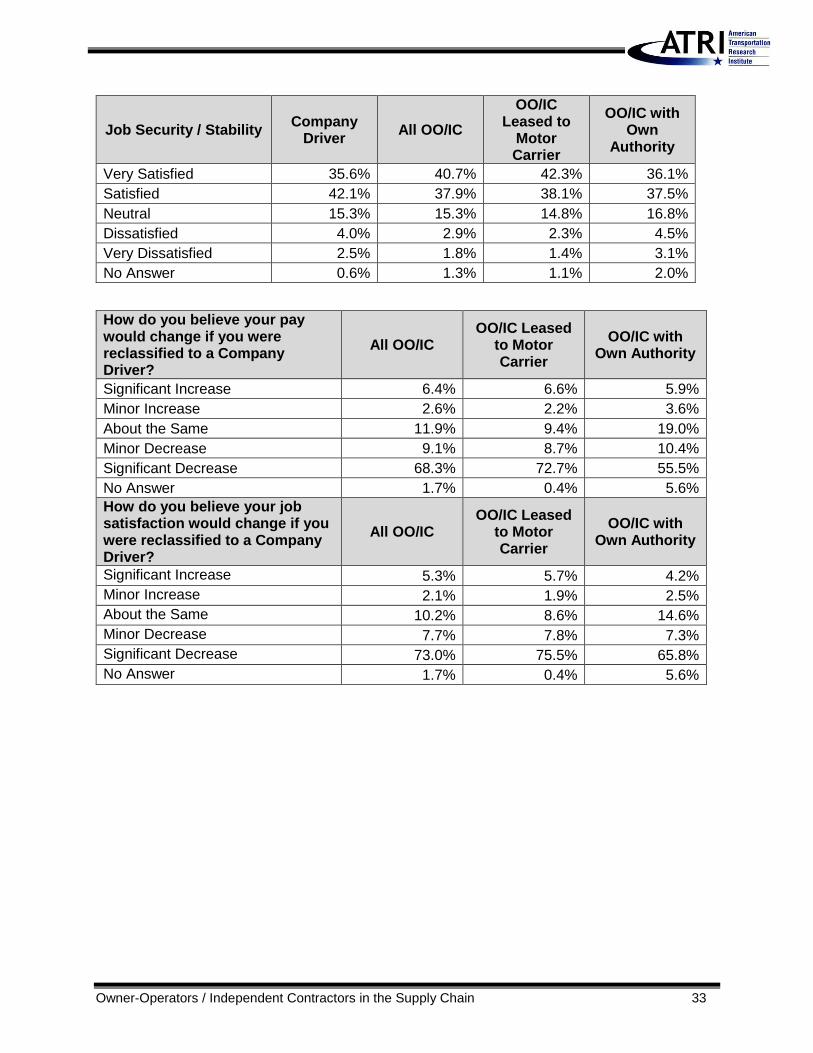
Job Security / Stability Company
Driver All OO/IC
OO/IC Leased to
Motor Carrier
OO/IC with Own
Authority
Very Satisfied 35.6% 40.7% 42.3% 36.1%
Satisfied 42.1% 37.9% 38.1% 37.5%
Neutral 15.3% 15.3% 14.8% 16.8%
Dissatisfied 4.0% 2.9% 2.3% 4.5%
Very Dissatisfied 2.5% 1.8% 1.4% 3.1%
No Answer 0.6% 1.3% 1.1% 2.0%
How do you believe your pay would change if you were reclassified to a Company Driver?
All OO/IC OO/IC Leased
to Motor Carrier
OO/IC with Own Authority
Significant Increase 6.4% 6.6% 5.9%
Minor Increase 2.6% 2.2% 3.6%
About the Same 11.9% 9.4% 19.0%
Minor Decrease 9.1% 8.7% 10.4%
Significant Decrease 68.3% 72.7% 55.5%
No Answer 1.7% 0.4% 5.6%
How do you believe your job satisfaction would change if you were reclassified to a Company Driver?
All OO/IC OO/IC Leased
to Motor Carrier
OO/IC with Own Authority
Significant Increase 5.3% 5.7% 4.2%
Minor Increase 2.1% 1.9% 2.5%
About the Same 10.2% 8.6% 14.6%
Minor Decrease 7.7% 7.8% 7.3%
Significant Decrease 73.0% 75.5% 65.8%
No Answer 1.7% 0.4% 5.6%