OVERVIEW, SWOT ANALYSIS AND INSTITUTIONAL … Website... · 2. SWOT ANALYSIS Table 1 STRENGTHS...
21
1. OVERVIEW The following sets out the Integrated Development Planning of the Steve Tshwete Local Municipality which governs all planning as obligated by Section 153 of Act No. 108 of 1996 (The Constitution of the Republic of South Africa). VISION To be the leading community driven municipality in the provision of sustainable services and developmental programmes. MISSION We are committed to the total well being of all our citizens through: Rendering affordable, cost-effective, accessible, efficient and quality services; Effective management systems, procedures, skilled and motivated workforce; Maximising infrastructural development through the utilisation of all available resources; Improving the quality of life by co-ordinating youth, gender and social development programmes; Creating an enabling environment for economic growth and job creation Ensuring effective community and relevant stakeholder participation and co- operation; Ensuring skilled, motivated and committed work force; and Compliance with the Batho-Pele Principles; To strive to sustain the fiduciary position of the municipality towards achieving the clean audit, CORE VALUES To always treat everyone with dignity and respect; To perform our duties with integrity, honesty and diligence.
Transcript of OVERVIEW, SWOT ANALYSIS AND INSTITUTIONAL … Website... · 2. SWOT ANALYSIS Table 1 STRENGTHS...

1. OVERVIEW
The following sets out the Integrated Development Planning of the Steve Tshwete Local Municipality which governs all planning as obligated by Section 153 of Act No. 108 of 1996 (The Constitution of the Republic of South Africa).
VISION
To be the leading community driven municipality in the provision of sustainable services and developmental programmes.
MISSION
We are committed to the total well being of all our citizens through: Rendering affordable, cost-effective, accessible, efficient and quality services; Effective management systems, procedures, skilled and motivated workforce; Maximising infrastructural development through the utilisation of all available
resources; Improving the quality of life by co-ordinating youth, gender and social
development programmes; Creating an enabling environment for economic growth and job creation Ensuring effective community and relevant stakeholder participation and co-
operation; Ensuring skilled, motivated and committed work force; and Compliance with the Batho-Pele Principles; To strive to sustain the fiduciary position of the municipality towards achieving the clean audit,
CORE VALUES
To always treat everyone with dignity and respect; To perform our duties with integrity, honesty and diligence.

GOALS
Seven (7) strategic goals have been identified to drive the vision and mission of the Municipality: Poverty Alleviation; Service delivery; Financial viability Economic Growth and Development (LED); Good Corporate Governance; Good Co-operative Governance; Integrated Environmental, Social, Economic and Spatial
Planning.
KEY INSTITUTIONAL CHALLENGES
The following are challenges to the Steve Tshwete Municipality and which demand to be confronted head on:
● Air pollution; ● Inadequate funding for housing supply; ● Inadequate transport infrastructure; ● Insufficient funding for infrastructure upgrading; ● Provision of sufficient serviced stands; ● Apathy of communities in municipal matters; ● Obtain and retain skilled staff (results in shortage
of skilled staff); Insufficient communication within and marketing
of the municipality.

2. SWOT ANALYSIS
Table 1
STRENGTHS Financial Viability: Good income base; Sound Financial Planning and Management; Proper Credit control.
Good Municipal Infrastructure: Proper infrastructural maintenance; Expansion of new infrastructure where needed.
High level of service delivery. Good Corporate Image with awarding of a number of awards. Cordial employer and labour unions relationship. Functional Local Aids Council. Sound relationship between politicians and administration. Well established EAP. Development of rural villages. Good expenditure of government grants. Sound relationship between STLM and the business. Decentralised paypoints and electricity outlets. Committed workforce.
WEAKNESSES Inadequate parking space in CBD. Limited communication of achievements. Lack of funds for servicing of land. Performance Management System limited to higher positions. Ineffective Local Economic Development Forum. Lengthy procurement processes. Overlapping of portfolios represented in council. Municipal buildings not accommodative of disabled persons. Loss of qualified staff (job hopping). Lack of office space in Civic Centre. Lines of communication not always followed.
OPPORTUNITIES Availability of Natural Resources: Benefits from mining.
Strategic Location: Maputo Corridor; Close to the Large Commercial Centres and Metro Municipalities; Nkangala District Municipality;
Positive economic growth indicators:

Maputo Corridor; New mall; Implementation of the Property Rates Act; Mining development; Tourist Information Centre; Industrial Park (Possible job creation).
Growth Point in terms of the NSDF. Good corporate image due to awards. Accreditation of housing function. Banquet hall. Credit worthiness. Social networking. Clean audit.
THREATS Negative impact of HIV/AIDS. High levels of crime. Fiscal fluctuation. Infrastructure does not accommodate the high influx of trucks. High unemployment rate. Informal settlements. Environmental hazards & impact: Veld fires; Hazardous material in transit; Pollution.
Closure of mines (mergers, downsizing). Poor maintenance of roads (provincial & national). Lack of civil engineering services to cater for densification. Lack of suitable land for cemeteries. High population growth. Climate change. Amended Municipal Property Rates Act. Unaffordability of high electricity tariffs. No rental housing allowance for employees. No affordable accommodation for employees.
3. INSTITUTIONAL ANALYSIS
3.1. Location and Description of the Municipal Area
The Steve Tshwete Municipality is a category B municipality situated in the Nkangala District of the Mpumalanga Province. It is positioned some 150km east of Pretoria on the way to Mbombela, and covers a geographic area of 3993 km². The N4 runs east/west through the municipal space, whilst the N11 traverses the area in a north/south direction. Some six other provincial roads link Middelburg to other towns in Mpumalanga. There are two nodal points or note: Middelburg/Mhluzi that is the main commercial and administrative center, and the much smaller Hendrina/Kwazamokuhle near the south/east boundary. Other than Middelburg and Hendrina, the remainder of settlements is arranged in three settlement categories for planning purposes. The first are small agricultural service villages, such as Somaphepha (Kwa-Makalane), Sikhululiwe and Doornkop that provide a “corner shop” function to a small and localized farming and rural community. Amenities are very limited and focus on only the most basic business and social needs. The second type of settlement includes the holiday towns of Presidentsrus and Kranspoort. Development in these towns is strictly regulated to maintain a specific character. The third category of settlement encompasses the towns associated with mines and power stations. These include Hendrina, Rietkuil, Pullenshope, Koornfontein, Blinkpan and Komati. With the exception of Hendrina, these towns will not develop any further and will fulfill the same role as agricultural services and amenities are generally better developed. Naledi and Lesedi are mining towns that do not receive any municipal services.

MAP 1: THE STEVE TSHWETE LOCAL MUNICIPALITY AS ONE OF SIX LOCAL MUNICIPALITIES IN THE NKANGALA DISTRICT MUNICIPALITY

MAP 2: THE AREA COMPRISING THE STEVE TSHWETE LOCAL MUNICIPALITY

3.2. DEMOGRAPHIC ANALYSIS
Statistical Premise
The data used in this review of the analysis phase of the IDP was obtained from the
Community Survey 2007 from Statistics South Africa and the Municipal Demarcation
Board.
POPULATION GROWTH ESTIMATES
It is imperative to note that population growth statistics was taken in to consideration
throughout the IDP planning processes of the municipality. Specific reference is made to
the latest Community Survey 2007 statistics.
Table 2: POPULATION SIZE: 1996, 2001 AND 2007
Census
1996
Census
2001
Community
survey 2007
Steve Tshwete Local Municipality 135 412 142 775 182 507
Source: Census 1996, Census 2001, Community Survey 2007 The above figures indicate a growth of 27.8% over the 6 year period on average growth
of 4.63% per year. This is a substantial population growth which inevitably puts severe
additional strain on the available municipal services.
POPULATION BY AGE GROUPS
Age Group Number Percentage (%)
0-4 15 307 8
5-14 30 693 17
15-34 71 342 39
35-64 58 698 32
65+ 6 467 4
Total 182 507 100

Source: Community Survey 2007
The table above illustrates that about 64.3% of the population is below 35 years of age
which suggests that the greater need for youth development exists within the
municipality.
Table 3: HOUSEHOLDS (HH)
Age group Number Percentage (%)
0-14 - -
15 - 19 122 0.2
20 - 24 1 867 4
25 - 29 5 154 10
30 - 34 6 260 12
35 - 39 6 959 14
40 - 44 6 624 13
45 - 49 6 675 13
50 - 54 6 103 12
55 - 59 4 085 8
60+ 6 599 13
Total 50 449 100
Source: Community Survey 2007 HOUSEHOLD SIZE HH Size Number of HH Percentage (%)
01 12 175 24
02 9 082 18
03 8 198 16
04 7 297 14
05 5 770 11
06 2 983 6
07 1 819 4
08 797 2
09 1 295 3
10+ 1 034 2
Total 50 449 100

Source: Community Survey 2007
The estimated population size for 2007 is 182 507 people, and the number of households stand at 50 449. This yields an average household size of 3.62 people, and a population density of 46 people per km². Some 89.5% of the population resides in urban areas.
SOCIO ECONOMIC ANALYSIS
The socio-economic analysis is specifically aimed at spatial related matters, i.e.
employment, income and economic profile. This analysis is based on a municipal level to
give a broader overview of the Municipality.
Level of Education
The level of education for the population in the study area is reflected in table format with
specific reference to number of people with primary, secondary and tertiary qualifications.
Table 4: LEVEL OF EDUCATION OF HOUSEHOLD HEAD
Level of Education Number %
No schooling 5 542 11
Grade 0 352 1
Grade 1-2 1 530 3
Grade 3-7 11 313 23
Grade 8-11 15 586 31
Grade 12 7 607 15
Diploma/ Certificate without Grade 12 3 386 7
Diploma/ Certificate with Grade 12 2 840 6
Post Graduate Diploma / BTech / Bachelor's
Degree And Higher 1 986 4
Total 50143 100
Source: Community Survey 2007
11% of the household heads have not received any schooling whilst a further 4% have
only attended school up to Grade 2. This indicates a definite need within the municipality
for ABET training.

Over an above basic education, there is a need to improve educational facilities with the
aim of ensuring an effective and conducive learning environment.
The provision of community educational facilities in Middelburg is fairly well distributed.
However there is only one tertiary institution i.e. the local FET College. At least one
more tertiary institution concentrating on rendering practical skills is needed
Table 5: OCCUPATION OF HOUSEHOLD HEAD
OCCUPATION NO. %
Legislators; senior officials and managers 4 078 8
Professionals 2 630 5
Technicians and associate professionals 1 412 3
Clerks 1 401 3
Service workers; shop and market sales
workers 2 439 5
Skilled agricultural and fishery workers 1 706 3
Craft and related trades workers 7 570 15
Plant and machine operators and assemblers 5 822 12
Elementary occupations 5 710 11
Occupations unspecified and not elsewhere
classified 5 425 11
Not applicable 12 255 24
Total 50 449 100
Source: Community Survey 2007
EMPLOYMENT STATUS OF HOUSEHOLD HEAD
Employment status No. of HH heads % of HH head
Employed 37 777 75
Unemployed 5 639 11
Not economically active 7 033 14
Total 50 449 100
Source: Community Survey 2007

This table indicates that the employment rate of Steve Tshwete Local Municipality is
relatively low compared to the national average of between 25 and 30 %.
HOUSEHOLD SERVICES
Table 6: ACCESS TO WATER WHERE WATER IS ACCESSED NO. OF HH %
Piped water inside the dwelling 30 532 61
Piped water inside the yard 11 402 23
Piped water from access point outside the
yard 6 045 12
Borehole 782 2
Spring 119 0
Dam/pool 118 0
River/stream 101 0
Water vendor 118 0
Rain water tank 513 1
Other 721 1
Total 50 449 100
Source: Community Survey 2007
ENERGY FOR COOKING SOURCE NO. OF HH %
Electricity 38 837 77
Gas 311 1
Paraffin 5 872 12
Wood 1 460 3
Coal 3 969 8
Animal dung - -
Solar - -
Other - -
Total 50 449 100
Source: Community Survey 2007

ENERGY FOR HEATING SOURCE NO. OF HH %
Electricity 32 565 65
Gas 398 1
Paraffin 2 554 5
Wood 1 951 4
Coal 10 791 21
Animal dung - -
Solar 59 0
Other 2 131 4
Total 50 449 100
Source: Community Survey 2007
ENERGY FOR LIGHTING SOURCE NO. OF HH %
Electricity 45 623 90
Gas 180 0
Paraffin 971 2
Candles 3 553 7
Solar - -
Other 121 0
Total 50 449 100
Source: Community Survey 2007
In a study conducted on rural areas (2004) an indication is given that on average only 27% of the households in the rural areas have access to electricity. This leaves a massive 73% of the households having to rely on other sources of energy such as wood, coal, gas or paraffin thereby contributing significantly to air pollution. It is not only important but also necessary to provide for the needs of these households.

REFUSE DISPOSAL Type of Refuse disposal NO. OF HH %
Removed by local authority/private company at
least once a week 39 198 78
Removed by local authority/private company less
often 3 597 7
Communal refuse dump 969 2
Own refuse dump 5 069 10
No rubbish disposal 1 557 3
Other 58 0
Total 50 449 100
Source: Community Survey 2007
The municipality has recorded an increase in the total amount of waste generated in the last two years, (2009 = 6000 tons/month on average; 2011 = 8000 tons/month on average). This is attributed to the increased number of households and economic activities. The current number of households is 50 449 (Community Survey 2007) of which 47 484 has access to kerbside refuse removal services. It can be estimated that the amount of refuse generated in the next 2 years will be in the average of 10000 tons/month, including activities from the mall. Waste minimization projects are being implemented at a low rate, the impact is insignificant (0.05% of each ton disposed), as a result most of the waste has to be transported to the landfill site for final disposal.
TOILET FACILITIES TYPE OF TOILET FACILITIES NO. OF HH %
Flush toilet (connected to sewerage
system) 39 425 78
Flush toilet (with septic tank) 1 508 3
Dry toilet facility 742 1
Pit toilet with ventilation (VIP) 2 121 4
Pit toilet without ventilation 3 670 7
Chemical toilet 457 1

Bucket toilet system 877 2
None 1 648 3
Total 50449 100
Source: Community Survey 2007
TENURE STATUS TENURE STATUS NO. OF HH %
Owned and fully paid off 17 524 35
Owned but not yet paid off 7 216 14
Rented 16 422 33
Occupied rent-free 8 992 18
Other 295 1
Total 50 449 100
Source: Community Survey 2007
TYPE OF DWELLING
TYPE OF DWELLING NO. OF HH %
House or brick structure on a separate stand or yard 31 370 62
Traditional dwelling/hut/structure made of traditional materials 2 788 6
Flat in block of flats 1 076 2
Town/cluster/semi-detached house (simplex: duplex: triplex) 2 291 5
House/flat/room in back yard 2 105 4
Informal dwelling/shack in back yard 1 897 4
Informal dwelling/shack NOT in back yard e.g. in an
informal/squatter settlement 5 509 11
Room/flatlet not in back yard but on a shared property 649 1
Caravan or tent 307 1
Private ship/boat 153 0
Workers hostel(bed/room) 2 304 5
Other - -
Total 50 449 100
Source: Community Survey 2007
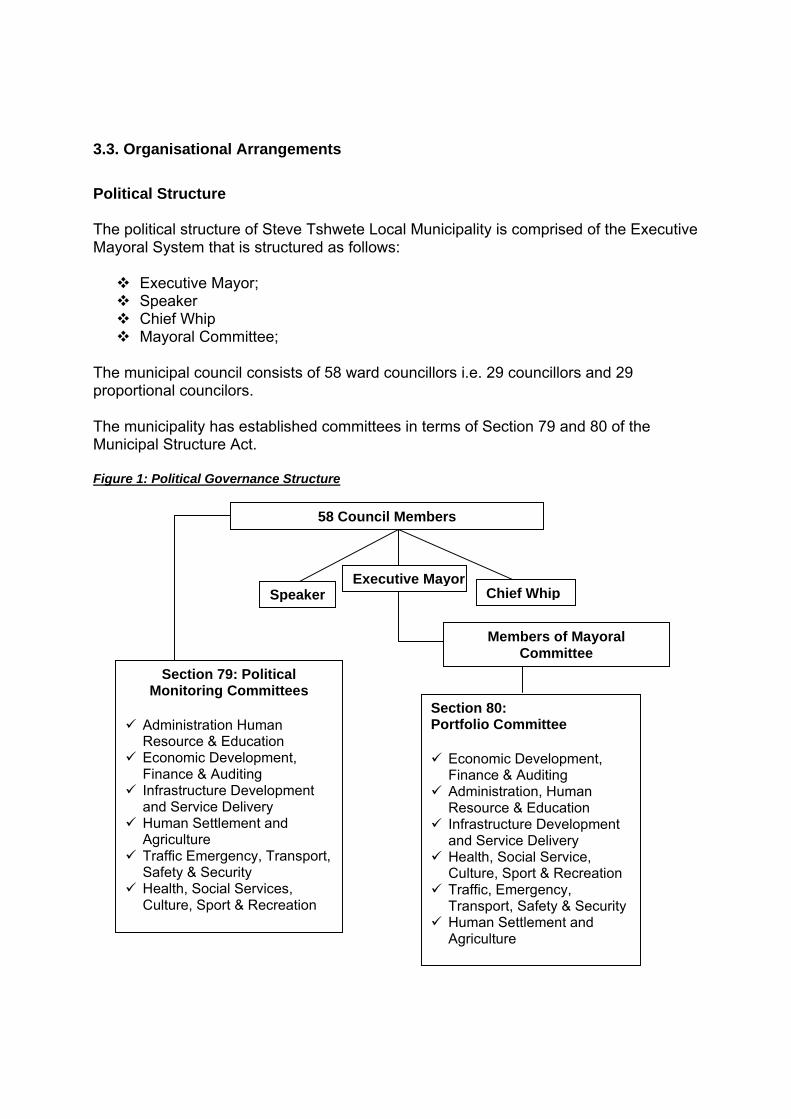
3.3. Organisational Arrangements
Political Structure The political structure of Steve Tshwete Local Municipality is comprised of the Executive Mayoral System that is structured as follows:
Executive Mayor; Speaker Chief Whip Mayoral Committee;
The municipal council consists of 58 ward councillors i.e. 29 councillors and 29 proportional councilors.
The municipality has established committees in terms of Section 79 and 80 of the Municipal Structure Act.
Figure 1: Political Governance Structure
Executive Mayor
Section 79: Political Monitoring Committees
Administration Human Resource & Education
Economic Development, Finance & Auditing
Infrastructure Development and Service Delivery
Human Settlement and Agriculture
Traffic Emergency, Transport, Safety & Security
Health, Social Services, Culture, Sport & Recreation
Section 80: Portfolio Committee
Economic Development, Finance & Auditing
Administration, Human Resource & Education
Infrastructure Development and Service Delivery
Health, Social Service, Culture, Sport & Recreation
Traffic, Emergency, Transport, Safety & Security
Human Settlement and Agriculture
58 Council Members
Members of Mayoral Committee
Speaker Chief Whip

EXECUTIVE MANAGER TECHNICAL AND FACILITIES
1 MANAGER LIBRARY SERVICES Library Services 2 SENIOR MANAGER: HOUSING
Housing services RDP housing Rental housing Management of New Town (informal
settlements) 3 SENIOR MANAGER: HEALTH
Health Services Clinic services Health Inspectorate 4 SENIOR MANAGER: TRAFFIC Traffic & Security Services 5 SENIOR MANAGER: LICENSING
SERVICES Licensing services 6 SENIOR MANAGER: FIRE & RESCUE Fire prevention
Fire fighting Civil Protection Disaster Management
1 SENIOR MANAGER: CIVIL ENGINEERTING
Who will render Civil Engineering and related Services
2 SENIOR MANAGER: TOWN PLANNING
Town Planning and related Services 3 CHIEF MUNICIPAL BUILDING
Construction, maintenance and related services
4 SENIOR MANAGER: PARKS AND
RECREATION Parks, cemeteries and recreational facilities
5 SENIOR MANAGER: WASTE
MANAGEMENT Refuse removal services
6 TOWN ELECTRICAL ENGINEER
Electrical distribution and related services
1 SENIOR MANAGER: LEGAL AND ADMINISTRTION Admin support & Public Participation,
Legal Services & Properties, Events Management & Marketing
2 SENIOR MANAGER: HUMAN RESOURCES Human Resources Management and
related services
3 CHIEF: IT Information Technology GIS Services and related services
4 SENIOR MANAGER: PROPERTY VALUATIONS Property Valuation and related services
EXECUTIVE MANAGER CORPORATE SERVICES
Manager: Internal Audit Manager: LED Manager: IDP/PMS Manager: PMU Manager: Gender & Social Development
EXECUTIVE MANAGER PUBLIC SERVICES
EXECUTIVE MANAGER FINANCE
EMPLOYEES IN THE OFFICE OF THE EXECUTIVE MAYOR Personal Assistant to the Mayor Manager: Communication Manager: Youth Development Personal Assistant to the
Municipal Manager
MUNICIPAL MANAGER
SENIOR MANAGER: FINANCE Budgeting/Budget control / Loans
Administration and Investment/ Financial reports.
Stores/Buying/Credit payments / Housing development claims
Assets/Insurance/costing claims / Salaries/Expenditure certification
Credit Control / action against defaulters/ Clearances/Property administration
Public Liaison/Cashier /Inquiries Assessment rates / Valuation /
Valuation roll / Sundry-debtors Metering /Data capturing /
Refuse/Sewerage levies / balancing and income verifications.
Financial electronic data preparation.
Administration support
Figure 2: STLM- Executive and Organisational Structure

Staff Component and Appointments The staff complement of the municipality as of 31 January 2012 stands at 1187 employees. Appointments that were made since then, have taken into consideration implementation of the Employment Equity Act 55, 1998. The table below indicates the current workforce profile according to the various occupational levels:

Table 7: Employment Equity Plan/Status Quo Report January 2012
BASELINE(1045 Employees) STATUS QUO(1187 employees) DISABILITY 0.8% (9 disabled employees) 1.85% (22 disabled employees) FEMALES 33% (363 female employees) 35% (412 female employees) BLACK 91.5% (1034 black employees) 88% (1049 black employees)
Occupational Levels
Male
Female
Foreign Nationals
Total A C I 1. W A C I W Male Female
Target Status Quo
TargetStatus Quo
TargetStatus Quo
Target Status Quo
TargetStatus Quo
TargetStatus Quo
TargetStatus Quo
TargetStatus Quo
TargetStatus Quo
TargetStatus Quo
TargetStatus Quo
Top management 2 1 2 2 1 5 4
Senior management 13 11 1 1 11 9 11 11 4 4 40 36
Professionally qualified and experienced specialists and mid-management
22 21 2 2 9 9 16 17 1 1 4 4 54 54
Skilled technical and academically qualified workers, junior management, supervisors, foremen, and superintendents
188 185 4 5 3 2 35 32 166 172 17 18 8 8 35 35 456 457
Semi-skilled and discretionary decision making
72 72 2 2 3 42 42 1 1 2 1 123 117
Unskilled and defined decision making
431 419 3 2 1 4 1 102 97 1 4 546 587
TOTAL PERMANENT 726 708 11 11 5 3 64 52 339 341 20 19 9 8 49 44 1 1224 1187
Temporary employees
GRAND TOTAL 726 708 11 11 5 3 64 52 339 341 20 19 9 8 49 44 1 1224 1187

Table 8: Current Workforce Profile
Occupational Levels
Designated Non-Designated TOTAL Male Female White
Male Foreign Nationals
A C I A C I W W Male Female
Top Management (0) 2 1 1 4 Senior Management (1-3) 11 1 11 4 11 36 Professionally qualified and experienced specialists and mid-management (4-6)
21 2 17 1 4 9 54
Skilled technical and academically qualified workers, Junior Management, Supervisors, Foreman and Superintendents (7-12)
185 5 2 172 18 8 35 32 457
Semi-skilled and discretionary decision making (13-16)
72 2 42 1 117
Unskilled and defined decision making (17-20)
419 2 97 1 519
1.1.1 TOTAL PERMANENT 708 11 3 341 19 8 44 52 1 1187 Non-permanent employees 1.1.2 GRAND TOTAL 708 11 3 341 19 8 44 52 1 1187 Table below indicates the demographic profile of Steve Tshwete Municipality as aligned to the Statistic South Africa, expressed in percentages. Table 8.1: RACE AND GENDER PROFILE
Group Male Female Total %
Black 43,8 34,5 78,3
Colored 1,1 1,3 2,4
Asian 0,8 0,7 1,5
White 8,6 9,2 17,8
Total 54,3 45,7 100 The table below indicates the summary of the status quo and numerical goals for Steve Tshwete Local Municipality. Table 8.2: NUMERICAL GOALS AND STATUS QUO NATIONALITY CURRENTLY
EMPLOYED CURRENT PERCENTAGE (%)
NUMERIC GOALS
PERCENTAGE

AFRICAN MALE 708 59,7 458 43,8 AFRICAN FEMALE 341 28,74 360 34,5 COLOURED MALE 11 0,93 12 1,1 COLOURED FEMALE
19 1,60 14 1,3
INDIAN MALE 3 0,25 8 0,8 INDIAN FEMALE 8 0,67 7 0,7 WHITE MALE 52 4,39 90 8,6 WHITE FEMALE 44 3,72 96 9,2 TOTAL 1187 100 1045 100 APPOINTMENTS FROM MAY 2000 – 31 JAN 2012 AS COMPARED TO TARGETS
LEVEL 0-3
May-00 12-Jan Target
AFRICAN MALE
0 12 13
WHITE MALE 20 9 13
COLOURED MALE
0 0 1
ASIAN MALE 0 1 0
AFRICAN FEMALE
1 14 13
WHITE FEMALE
4 4 4
COLOURED MALE
0 0 0
ASIAN FEMALE
0 0 0
EQUITY TARGETS AND STATUS QUO AT THE THREE HIGHEST LEVELS IN THE MUNICIPALITY FOR THE PERIOD OF 2009-2013
LEVEL 0-3DESIGNATED GROUPS TARGET STATUS QUO BLACK 25 26WOMEN 18 18DISABLED 2 1
ORGANISATIONAL LEVELBLACK 1114 1049WOMEN 469 412DISABLED 38 22