Overview of Variable Renewable Energy Regulatory Issues · PDF fileOverview of Variable...
47
Technical Report NREL/TP-6A20-61350 May 2014 Contract No. DE-AC36-08GO28308 Overview of Variable Renewable Energy Regulatory Issues A CLEAN ENERGY REGULATORS INITIATIVE REPORT Mackay Miller and Sadie Cox National Renewable Energy Laboratory
Transcript of Overview of Variable Renewable Energy Regulatory Issues · PDF fileOverview of Variable...

Technical Report NREL/TP-6A20-61350 May 2014 Contract No. DE-AC36-08GO28308
Overview of Variable Renewable Energy Regulatory Issues A CLEAN ENERGY REGULATORS INITIATIVE REPORT
Mackay Miller and Sadie Cox National Renewable Energy Laboratory

Technical Report NREL/TP-6A20-61350 May 2014 Contract No. DE-AC36-08GO28308
Overview of Variable Renewable Energy Regulatory Issues Mackay Miller and Sadie Cox National Renewable Energy Laboratory
Produced under the guidance of the Department of Energy and the Clean Energy Ministerial by the National Renewable Energy Laboratory under Interagency Agreement S-OES-12-IA-0010 and Task Number WW3N.1000.
NREL is a national laboratory of the U.S. Department of Energy, Office of Energy Efficiency & Renewable Energy, operated by the Alliance for Sustainable Energy, LLC.

NOTICE
This manuscript has been authored by employees of the Alliance for Sustainable Energy, LLC (“Alliance”) under Contract No. DE-AC36-08GO28308 with the U.S. Department of Energy (“DOE”). This report was prepared as an account of work sponsored by an agency of the United States government. Neither the United States government nor any agency thereof, nor any of their employees, makes any warranty, express or implied, or assumes any legal liability or responsibility for the accuracy, completeness, or usefulness of any information, apparatus, product, or process disclosed, or represents that its use would not infringe privately owned rights. Reference herein to any specific commercial product, process, or service by trade name, trademark, manufacturer, or otherwise does not necessarily constitute or imply its endorsement, recommendation, or favoring by the United States government or any agency thereof. The views and opinions of authors expressed herein do not necessarily state or reflect those of the United States government or any agency thereof.
Printed on paper containing at least 50% wastepaper, including 10% post consumer waste.

iii
This report is available at no cost from the National Renewable Energy Laboratory (NREL) at www.nrel.gov/publications.
Acknowledgments The authors wish to thank the expert staff of the Regulatory Assistance Project, Leonardo Energy, and the International Copper Association for their insights and research on the topic of clean energy regulation. The authors would also like to acknowledge Jaquelin Cochran, Aaron Bloom, Jeffrey Logan, and Doug Arent for their contributions to this report. Finally, the authors are greatly indebted to Scott Gossett and Kendra Palmer in NREL Communications for their production support.

iv
This report is available at no cost from the National Renewable Energy Laboratory (NREL) at www.nrel.gov/publications.
Executive Summary This report focuses on key regulatory issues associated with the deployment of variable renewable energy (VRE) sources, especially wind and solar power. Drawing upon research and experiences from various international contexts, the report identifies key issues and ideas that have emerged as VRE deployment has grown and presents a framework for understanding regulatory issues within the larger context of power system evolution. Finally, in order to help regulators anticipate issues that may arise in the future, the report aims to provide a forward look at regulatory lessons learned in cases of high penetrations of VRE.
Based on international experience, there is not a one-size-fits-all approach to the regulation of VRE. Many variables shape the issues that arise in a given context, especially power system characteristics, geographic and spatial availability of VRE resources, institutional organization of the power system, public policy goals, and the political economy of power system issues. Despite these variations, common issues arise at each stage of VRE deployment. This report identifies four broad categories of issues, and the structure of this report follows this categorization:
• Facilitating New VRE Generation In accordance with policy mandates, regulators play a role in facilitating new VRE generation through various mechanisms, including setting tariffs, organizing auctions, and influencing grid codes and the interconnection of new VRE generation.
• Ensuring Adequate Grid Infrastructure Regulators play a role in shaping the grid infrastructure development of a power system, which is a key dimension of VRE deployment and system integration.
• Ensuring Short-term Security of Supply (Flexibility) Regulators play a role in encouraging power system flexibility, which in turn plays an important role in the integration of VRE into power systems, especially as levels of deployment grow.
• Ensuring Long-term Security of Supply (Resource Adequacy) Regulators play a key role in ensuring adequate power system resources, including incorporating VRE into resource planning, and managing potential impacts on the economics of other resources in the system.
These four domains are interrelated, and become more so as VRE deployment levels grow. The report surveys regulatory experiences around the world in each of these domains, providing brief ‘snapshots’ of emerging challenges and solutions from countries including Australia, Denmark, Germany, Guatemala, India, Mexico, the United Kingdom, and the United States. From these varied experiences, the report identifies key regulatory ideas in each of the four domains:
Facilitating New VRE Generation • Linking RE tariffs to delivered and metered power incentivizes efficient system siting and operation.
• Tariffs can be designed to promote investment and achieve policy goals while limiting total costs to the public.
• Simplifying interconnection procedures for distributed resources is often complementary to other procurement measures such as policy targets and specialized tariffs.
VRE
Generation
Grid
Infrastructure
Resource Adequacy
Flexibility
Figure ES-1. The four main categories of VRE regulation

v
This report is available at no cost from the National Renewable Energy Laboratory (NREL) at www.nrel.gov/publications.
• Replacing ‘first-come, first-served’ interconnection processes with a more orderly and transparent process based on system impacts can result in more efficient outcomes and provide more clarity to investors.
• Harmonizing interconnection procedures with robust technical standards can encourage investment while maintaining reliability.
Ensuring Adequate Grid Infrastructure • In cases where there is plausible risk of stranded transmission assets, one common risk management
approach is to place the risk on parties best able to evaluate and manage it.
• Network usage charges can significantly alter VRE project economics and can be designed to advance policy goals.
• Transmission expansion costs can be minimized through coordinated planning processes that identify high-quality resource areas, address investment risk through funding structures that ensure cost recovery, and engage stakeholders throughout the process.
• Distribution grid concerns at high VRE penetrations can be mitigated through advanced grid codes and allowance for strategic curtailment of VRE.
Ensuring Short-term Security of Supply (Flexibility) • Changes to system operational and forecasting methods can be combined to unlock physical
flexibility and enhance system reliability under growing shares of VRE.
• Reserve requirements can be reduced through advanced forecasting techniques and effective integration of those techniques into power system operation.
• Compared to low-VRE scenarios, preliminary analysis indicates that high VRE penetrations require additional reserve requirements, though these are relatively small compared to total system size, and important differences in reserve impacts emerge depending on the mix of solar and wind generation.
• Demand Response represents an important source of flexibility, and large-scale DR participation will depend upon regulatory clarification of eligibility, performance characteristics, performance validation, and compensation mechanisms.
Ensuring Long-term Security of Supply (Resource Adequacy) • Resource adequacy issues raise multiple issues related to investment incentives and business model
evolution for conventional thermal generators, and of risk allocation between generators and load.
• VRE procurement at high penetrations can be sustained through increased support for resource characterization and project site assessment, and through streamlined, transparent processes.
• Institutional measures to expand balancing areas can result in greater flexibility due to lower aggregate variability and higher aggregate reserve capacity, lessening concerns over resource adequacy.
While there are unique forces at play in each regulatory context, the report provides a framework that highlights the common issues and key ideas that emerge across contexts and at each stage of VRE deployment and integration. In support of increased international collaboration through the Clean Energy Regulators Initiative, the report concludes with an exploration of priority areas of focus for regulatory attention and innovation.

vi
This report is available at no cost from the National Renewable Energy Laboratory (NREL) at www.nrel.gov/publications.
Table of Contents 1 Introduction: A Brief Note on the Physical Characteristics of Variable Renewable Energy ........ 1
1.1 A Framework for Categorizing VRE Regulatory Issues.................................................................. 1 2 Early Stage Regulatory Issues ............................................................................................................ 5
2.1 VRE Generation Procurement: Early Stage Issues .......................................................................... 5 2.1.1 Specialized Tariffs .................................................................................................................. 5 2.1.2 Auctions .............................................................................................................................. 6 2.1.3 Quotas and Targets ............................................................................................................. 7 2.1.4 Interconnection Queue Management .................................................................................. 7
2.2 Grid Infrastructure: Early Stage Issues ............................................................................................ 8 2.2.1 Transmission Network Expansion ...................................................................................... 8 2.2.2 Network Usage Costs ........................................................................................................ 10 2.2.3 Distributed Generation Network Interconnection ............................................................. 10
2.3 Flexibility and Resource Adequacy: Planning for the Future ........................................................ 12 3 Intermediate Stage Regulatory Issues ............................................................................................. 13
3.1 VRE Procurement: Intermediate Stage Issues ............................................................................... 13 3.2 Grid Infrastructure: Intermediate Stage Issues ............................................................................... 13
3.2.1 Transmission Network Expansion .................................................................................... 13 3.2.2 Distribution Network Development .................................................................................. 15
3.3 Flexibility: Intermediate Stage Issues ............................................................................................ 19 3.3.1 Estimating Reserve Impacts of VRE ................................................................................ 19 3.3.2 Forecasting ........................................................................................................................ 20 3.3.3 Improving System Operation Practices ............................................................................ 20
3.4 Resource Adequacy: Intermediate Stage Issues ............................................................................. 22 3.4.1 Adequacy Mechanisms ..................................................................................................... 23
4 Advanced Stage Regulatory Issues ................................................................................................. 27 4.1 Advanced Stage VRE Procurement Issues .................................................................................... 27
4.1.1 Evolution of RE Siting ...................................................................................................... 27 4.2 Grid Infrastructure: Advanced Stage Issues ................................................................................... 28 4.3 Advanced Stage Flexibility ............................................................................................................ 28
4.3.1 High-penetration Reserve Requirements .......................................................................... 28 4.3.2 Evolution of Demand Response ........................................................................................ 29
4.4 Resource Adequacy: Advanced Stage Issues ................................................................................. 31 4.4.1 Institutional Coordination ................................................................................................. 31
5 Conclusion: Regulation for Comprehensive VRE Integration ....................................................... 32 References ................................................................................................................................................. 33

vii
This report is available at no cost from the National Renewable Energy Laboratory (NREL) at www.nrel.gov/publications.
List of Figures Figure ES-1. The four main categories of VRE regulation ................................................................. iv Figure 1. The four main categories of VRE regulation ......................................................................... 2 Figure 2. Illustration of FIT CfD strike price ........................................................................................ 6 Figure 3. Classification of transmission network cost allocation policies ............................................. 9 Figure 4. "Competitive RE zones" and related transmission lines in Texas ........................................ 14 Figure 5. Investment properties of transmission and distribution networks ........................................ 15 Figure 6. Power flows between transmission and distribution network in the Puglia region of Italy,
2010–2012 .................................................................................................................................... 16 Figure 7. February 2014 "Locational Value Map" of Oahu, illustrating PV penetration as a percent of
daytime minimum load ................................................................................................................. 17 Figure 8. Wind energy as a percentage of energy consumption, Tamil Nadu, India, 2010–2013....... 26 Figure 9. Five-minute changes in power density: load only, high wind, and high solar scenarios ..... 29
List of Tables
Table 1. Illustrative Issues and Actions Associated with Different Stages of VRE Deployment ......... 3 Table 2. Administrative and Market-based Constructs for Adequacy ................................................ 23 Table 3. Resource Adequacy Mechanism Options Examined for the ERCOT System ...................... 24 Table 4. Simulated Reserve Requirements of Different Wind/Solar Mixes in the WWSIS Phase 2
Analysis (NREL 2013) ................................................................................................................. 29 Table 5. Necessary Attributes for DR to Supply Ancillary Services in the CAISO Market ............... 30

1
This report is available at no cost from the National Renewable Energy Laboratory (NREL) at www.nrel.gov/publications.
1 Introduction: A Brief Note on the Physical Characteristics of Variable Renewable Energy
Just as the unique physical characteristics of electricity networks strongly influence regulation of the electricity sector,1 the unique physical characteristics of variable renewable energy (VRE) strongly shape associated regulatory issues. A more thorough examination of the relevant physical characteristics of specific VRE technologies will be provided later in the CERI report series. For the purposes of this report, the relevant characteristics of VRE that impact regulation are:
• Resource geography. Wind and solar power resources vary significantly by geography; some places are sunnier or windier than others. From a regulatory perspective, geographically-constrained resources can translate into the need for modified procedures, such as tailored cost-benefit assessment of transmission network expansion to deliver remote VRE power onto the grid.
• Variability. Wind and solar power resources vary over time. While variability is a natural feature of power systems, the additional variability of VRE often merits regulatory attention—for instance in defining the level of capacity credit for each incremental megawatt (MW) of VRE, and in determining the level of conventional generation capacity to be held in reserve to reliably balance VRE fluctuations.
• Uncertainty. The precise availability of wind power (and to a lesser extent, solar power) during any given hour of the year is inherently uncertain. The level of uncertainty of VRE power production is reflected in wind and solar forecasting errors. Although uncertainty is a natural feature of power systems, the uncertainty of VRE can impact regulatory needs, such as the setting of rules for forecasting and power system operation.
• Electrical interactions. VRE has distinct electrical characteristics that interact with alternating current (AC) electricity grids differently than conventional rotating generators. For example, conventional rotating generators produce torque and spin synchronously with the load-frequency of the system. As such, each generator provides inertia to the system. In contrast, the majority of wind turbines—and all PV systems—are asynchronous, meaning that they are not directly coupled with the system frequency except through power electronics. These electrical characteristics can merit regulatory attention in the establishment of interconnection protocols and grid codes.
While these unique technical characteristics are important for regulators to understand, it is equally important to understand that their aggregate impact varies widely and is a function of the unique interactions between the VRE generation profile and the specific power system as well as the market and regulatory context. A 15% penetration of VRE power (measured as a percentage of annual generation) may be easily integrated in one power system while causing significant challenges in another, depending upon a range of factors including resource distribution, market rules, system size, grid reliability, level of interconnection, and system operation protocols.
1.1 A Framework for Categorizing VRE Regulatory Issues Given the diversity of power systems globally, and the interdependency between regulatory options and system context, establishing universally applicable rules for regulation of VRE is not feasible. Nonetheless, experience can shed light on common high-level issues and concerns that arise from early to advanced stages of VRE. These regulatory issues fall into four broad and interrelated categories,2 which are illustrated in Figure 1 and constitute the recurring themes of this report:
1 An introduction to the interaction of electricity with network regulation can be found in Pérez-Arriaga (2013). 2 These four categories are adapted from Miller et al. (2013). That report explores associated technical and policy considerations in more detail.

2
This report is available at no cost from the National Renewable Energy Laboratory (NREL) at www.nrel.gov/publications.
• Facilitating New VRE Generation While the impetus for new VRE generation is typically driven by policy or economic factors, regulators play a crucial role in, inter alia, setting tariffs, facilitating auctions, shaping grid codes, and influencing the interconnection of new VRE generation. These regulatory functions can strongly influence the pace of new VRE deployment.
• Ensuring Adequate Grid Infrastructure Grid infrastructure enables VRE deployment, and regulators play a crucial role in shaping the grid investment landscape, especially with regard to planning, siting, cost allocation, and cost recovery.
• Ensuring Short-term Security of Supply (Flexibility) Significant penetration of VRE brings increased variability and uncertainty to power system operations. Regulators play a crucial role in employing strategies that ensure system flexibility in a cost-efficient manner, such as encouraging the integration of forecasting into system operations and encouraging investment in flexible demand- and supply-side resources.
• Ensuring Long-term Security of Supply (Resource Adequacy) The impact of VRE on resource adequacy is important in all settings, though the regulatory role varies considerably depending upon the level of excess generation capacity in the existing power system. In systems with excess capacity, VRE generation can erode the volume of conventional generation and suppress average market prices for energy, placing financial stress on legacy conventional generators, which leads to concerns over sufficient conventional dispatchable capacity. In systems with capacity scarcity, the contribution of VRE generation instead tends to mitigate overall capacity shortages and the contribution depends significantly upon the resource profile and the ability of the system to accommodate all of the resulting generation (in other words, to minimize curtailment of the resource). These two broad contexts (alternately termed “stable” and “dynamic” contexts in Müller [2013]) correspond roughly to Organization for Economic Cooperation and Development (OECD) and non-OECD countries, respectively.
These four categories represent the key domains of VRE regulation. Also important are the interactions between these domains—for example, the interdependency between VRE generation and grid infrastructure planning. Actions to address issues in these four domains are not static—they evolve as VRE deployment grows as a percentage of annual generation. Table 1 illustrates some potential regulatory actions that may be appropriate in each of these categories at early, intermediate, and advanced stages3 of VRE deployment. More darkly shaded squares indicate relatively greater importance at each stage.
3 For this report, the early stage equates to approximately 5% or less of VRE as a percentage of total annual generation, the intermediate stage equates to roughly 5-20% of annual generation, and the advanced stage equates to 20% or greater of annual generation, although the boundaries of these stages are not precise and depend heavily upon, inter alia, system characteristics and pace of deployment.
VRE
Generation
Grid
Infrastructure
Resource Adequacy
Flexibility
Figure 1. The four main categories of VRE regulation

3
This report is available at no cost from the National Renewable Energy Laboratory (NREL) at www.nrel.gov/publications.
Table 1. Illustrative Issues and Actions Associated with Different Stages of VRE Deployment
VRE Generation Grid Infrastructure Short-term Security of Supply: Flexibility
Long-term Security of Supply: Adequacy
Early Stage (VRE
approximately < 5%4)
Establish appropriate VRE support mechanisms
Establish queue
management
Establish efficient siting processes
Simplify interconnection
protocols
Initiate data collection efforts that will facilitate formal grid integration
studies
Initiate data collection efforts that will
facilitate formal grid integration studies
Intermediate Stage (VRE
approximately 5-20%)
Refine VRE support mechanisms if
necessary
Refine siting and queue management
Establish VRE grid codes and designated
transmission zones
Coordinate generation and grid planning
Establish distribution network standards for
VRE
Initiate formal grid integration study
Improve forecasting
Broaden balancing-area footprints
Improve system operation methods
Initiate formal grid integration study, with
capacity credit or resource adequacy
components as needed
Advanced Stage (VRE
approximately >20%)
Encourage alignment between demand and
VRE production
Incentivize VRE dispatchability
Expand grid interconnection and
market coupling
Employ locational pricing
Incentivize active network management
Employ advanced system operation
Incentivize demand response (DR)
Incentivize flexible generation and/or
storage
Improve adequacy mechanism in
accordance with predominant
paradigm (e.g., capabilities market; strategic
reserve requirement; full scarcity pricing)
Table 1 reinforces how regulatory priorities evolve—and issues become more interdependent—as shares of VRE increase. For example:
• In early stages (normally less than 5% of annual generation) regulatory concerns typically center on the establishment of mechanisms for procuring new RE generation and defining interconnection standards. Complex system integration issues are of a lower priority at these stages.
• In intermediate stages (typically between 5-20% VRE penetration) regulatory concerns increasingly center on the interactions between VRE and existing systems, such as how to achieve cost-efficient planning for grid expansion, how to identify VRE integration needs and evaluate costs, and how to allocate various charges to specific actors.
• In advanced stages (as VRE generation surpasses 20% of annual generation) regulatory concerns increasingly focus on the evolution of the entire power system, such as significant changes to institutional arrangements, grid infrastructure, conventional generation assets, demand elasticity, and interactions with neighboring systems, which can complicate regulatory initiatives.
4 The percentages provided here are illustrative. Actual stages of VRE impacts on a power system are highly context-specific.

4
This report is available at no cost from the National Renewable Energy Laboratory (NREL) at www.nrel.gov/publications.
KEY IDEA Regulatory issues of VRE are narrowly focused at early stages (mainly focused on VRE generation and grid infrastructure)5 and expand to a more comprehensive scope at advanced stages (spanning all four framework areas). Following this framework, the remainder of the report is structured as follows. Section 2 briefly discusses early stage VRE regulatory issues, focusing primarily on generation procurement and grid planning. Section 3 discusses intermediate stage issues, focusing primarily on grid, flexibility, and adequacy considerations. Section 4 briefly discusses emerging issues at advanced stages of VRE deployment, focusing primarily on grid. Section 5 concludes and summarizes key areas of focus for further research.
5 However, rapidly growing and dynamic systems may be strongly focused on adequacy, even at early stages.

5
This report is available at no cost from the National Renewable Energy Laboratory (NREL) at www.nrel.gov/publications.
2 Early Stage Regulatory Issues In 2014, the majority of electric power systems around the world still procure less than 5% of annual generation from VRE sources. As such, the issues outlined in this section are of broad interest to many regulators, and benefit from the greatest body of accumulated knowledge and research.
2.1 VRE Generation Procurement: Early Stage Issues In 2014, energy from renewable sources is typically more expensive than energy from conventional sources,6 so policy and regulatory interventions have emerged to promote deployment such as elevated tariffs, long-term contracts, or mandatory targets. Intervening in prices paid for energy is an important but complex role for regulators. This section will discuss key regulatory considerations involved in some of these mechanisms, reviewing lessons learned in their application.
2.1.1 Specialized Tariffs Specialized tariffs are a common mechanism to spur RE deployment. Since the regulatory aspects of tariff setting in this regard are well known in the literature, this report will not discuss these concerns in detail. The most common tariff instruments around the world are feed-in tariffs, or “FITs,” which set specialized prices for various types of RE generation. Discussion of tariff setting for VRE can be found in Miller et al. (2013), Couture et al. (2010), Couture and Gagnon (2010), Klein et al. (2007). By guaranteeing a price linked to generation, FITs avoid some pitfalls associated with mechanisms linked only to investment costs, which may incentivize project developers to seek excess rents through arbitrage of the margin between the investment price and the price paid through the mechanism. Additionally, linking the premium to delivered power incentivizes developers to seek high-quality resource areas and to maintain facility output. The production tax credit employed in the United States shares these same characteristics.
KEY IDEA Linking RE tariffs to delivered and metered power incentivizes efficient system siting and operation.
2.1.1.1 “Future Proofing” Tariff and Procurement Mechanisms VRE procurement mechanisms have long-lived terms, typically 10 years or greater, and it is important to consider how to “future proof” these mechanisms against events such as technology cost reductions that can result in large mismatches between the tariff and the actual technology cost. In other words, early stage design of tariffs can anticipate issues that may arise as VRE technology costs decline and overall penetrations increase. Recent history has revealed the importance of ensuring that procurement mechanisms appropriately limit public risk and cost as VRE deployment grows. For example, FITs can aim to incorporate more accurate information about current and projected technology costs in order to limit windfall profits if technology costs fall precipitously. Over the period of 2008-2013, the public costs of solar PV tariffs in Spain and Germany have risen and have become the subject of political debate (Economist 2010; Economist 2011; Economist 2012). The case of the United Kingdom provides one perspective on emerging mechanisms to limit public cost exposure.
2.1.1.1.1 Snapshot: United Kingdom FITs with “Contracts for Difference” Challenge: The UK government is faced with setting tariffs that meet the dual challenges of meeting ambitious RE and greenhouse gas (GHG) emission mitigation targets while also ensuring low cost electricity.
6 The relative cost of renewable and conventional energy is heavily dependent upon inter alia accounting approaches, externality costs, and system characteristics. In some areas (such as remote islands) VRE is already less expensive than most or all other imported energy sources.

6
This report is available at no cost from the National Renewable Energy Laboratory (NREL) at www.nrel.gov/publications.
Solution: To address these challenges, the UK government, through its Department of Energy and Climate Change and its independent Office of Gas and Electricity Markets (Ofgem), and with input from various stakeholders, proposed and adopted a mechanism called “Feed-in Tariffs with Contracts for Difference” (FIT CfD) under the country’s broader Electricity Market Reform (EMR). At the center of the FIT CfD design are the ‘strike prices’ for four different technology types (onshore wind, offshore wind, biomass, and ‘other’); these are set for five-year periods. The FIT CfD stabilizes revenues within a pre-determined range, set by the strike price, for the duration of the contract. When the market price for a generator’s electricity is less than the strike price (see Figure 2), the generator receives the difference in payment. When the market price is more than the strike price, the generator pays back the difference (in other CfD designs, the generator simply receives no payment). Relative to spot prices, FIT CfDs reduce revenue uncertainty for VRE power. Relative to conventional FITs, FIT CfDs bound the risk to the customer and reduce incentives to bid VRE electricity into markets even when market prices are negative, thus increasing efficient market performance. Technical details of the UK FIT CfD scheme can be found in DECC (2012). A more extensive examination of the challenges of FIT CfD implementation can be found in RAP (2013).
KEY IDEA Tariffs can be designed to promote investment and achieve policy goals while limiting total costs to the public.
2.1.2 Auctions Auctions are a mechanism to contract for a known volume of new VRE power capacity. They have grown in popularity as a procurement and remuneration mechanism for VRE, especially in developing countries. The number of countries employing auctions—also known as tenders, demand auctions, procurement auctions, or public competitive bidding—grew from 9 in 2009 to at least 44 by early 2013, including 30 developing countries (IRENA 2013; REN21 2013).
Key considerations for designing and implementing effective auctions are described in detail in Maurer & Barroso (2011). Further VRE-specific considerations and experiences from a wide range of national case studies are explored in Azuela & Barroso (2012) and IRENA (2013). IRENA (2013) suggests key principles in auction design and implementation:
Figure 2. Illustration of FIT CfD strike price (Source: DECC 2011)
7
This report is available at no cost from the National Renewable Energy Laboratory (NREL) at www.nrel.gov/publications.
• Selecting the type of auction (e.g. sealed-bid, descending clock, hybrid, and reverse auctions) considering their relative ease of implementation, ability to limit collusion, and ability to foster price discovery.
• Determining auction volume with consideration of the capacity of the market to deliver.
• Setting a ceiling price and not disclosing it to bidders in order to foster competition and price discovery.
• Ensuring streamlined administrative procedures, active communication, and transparency are provided equally to all bidders.
• Setting strong guarantees and penalties to prevent underbidding (e.g. bids that cannot later secure commercial financing), collusion, and project failures.
Finally, some observers note that the maturity of each specific VRE technology should be taken into account when considering auctions as a procurement option. For example, auctions may be most appropriate for VRE technologies that are commercially proven and relatively close in cost to conventional technologies, such as wind power (Pérez-Arriaga 2013).
2.1.3 Quotas and Targets VRE quotas—either as stand-alone measures or as a complement to a procurement scheme—also represent a mechanism to procure a known volume of new VRE capacity. While VRE quotas are often set through policy rather than through regulation, they are nonetheless important framework conditions that guide the design of remuneration mechanisms (e.g. tariffs, auctions) that are commonly within the regulatory purview. Quotas are often utilized in concert with remuneration instruments. For example, in much of the United States where state-level renewable portfolio standards exist to create RE quotas, the federal production tax credit, which represents an “adder” tariff instrument,7 is also available. In Europe, binding targets at the level of the European Commission exist alongside national remuneration mechanisms as well as the Emissions Trading Scheme.
The various mechanisms described above can be employed alone or in concert. Their effectiveness in various combinations is beyond the scope of this report, but various researchers have examined this issue (see, e.g., Becker and Fischer [2013], Butler and Neuhoff [2008], Hiroux and Saguan [2010], Lauber [2004], and Mitchell, Bauknecht, and Connor [2006]).
2.1.4 Interconnection Queue Management The mechanisms above are the driving forces behind VRE deployment, but even when effective remuneration schemes are in place, VRE deployment rates can be constrained by licensing and interconnection issues warranting regulatory attention. Some emerging approaches in these areas are discussed below.
Effective VRE procurement mechanisms typically result in a large number of grid connection applications that require evaluation in the context of limited grid capacity. This problem of queue management places an administrative burden on regulators and requires a fair mechanism for prioritizing grid connection applications. In some contexts, the regulator evaluates grid connections directly, while in other settings, the regulator sets the rules for evaluation to be performed by system operators. Applying a ‘first come, first served’ or pro rata allocation method (in which all applicants receive a reduced share of their original bid) typically results in an economically inefficient outcome since applicants otherwise willing to pay more for scarce resources are not allowed to do so (ERRA and NARUC 2013). Instead, a more economically efficient outcome can be achieved through a competitive tender process in which interconnection capacities are tied to the applicants’ willingness to pay. Resulting offers—and associated 7 An “adder” tariff instrument guarantees a premium rate for a specific energy source on top of the sale price for power.

8
This report is available at no cost from the National Renewable Energy Laboratory (NREL) at www.nrel.gov/publications.
income—can be used either to reduce consumer prices or to reinforce network capacity at key points (ERRA and NARUC 2013).
A more administrative variation on the competitive tendering solution is the Irish Gate System. Historically, all wind generation applications were processed piecemeal in Ireland. As the number of wind farm applications grew in the 1990s and early 2000s, this ad hoc process became intractable due to competition for scarce grid capacity (Miller et al. 2013). It became clear that a more carefully designed queue management method could allow for integration of more of the annual available wind energy with significantly less infrastructure development. In 2004, the Irish Commission for Energy Regulation directed the transmission system operator, EirGrid, to develop a new queue management protocol. The resulting “Gate System” or group-processing approach involves setting out criteria for each successive batch of wind farms, which can then be processed as a single group. The procedure for each group generally involved setting a target wind power capacity (in MW), and then selecting candidate wind farm projects based on the submission date of each completed application as well as the assessment of system impact performed by the system operator. For more detail see CER (2008).
KEY IDEA Replacing ‘first-come, first-served’ grid connection processes with a more orderly and transparent process based on system impacts can result in more efficient outcomes and provide more clarity to investors.
2.2 Grid Infrastructure: Early Stage Issues The remote nature of some high-quality VRE resources can often require grid expansion, elevating the need for regulatory actions to minimize cost of new grid infrastructure through more coordinated planning approaches, and to adjust cost recovery mechanisms in line with policy goals and grid costs. This section explores some of the key concepts and emerging approaches in this domain.
2.2.1 Transmission Network Expansion At early stages, the regulation of transmission network expansion typically focuses on 1) supporting orderly project development so as to minimize overall network upgrade costs; 2) minimizing stranded resource risk8 for VRE developers; and 3) appropriately allocating cost and risk of network connection and expansion among developers and ratepayers in accordance with policy goals. This latter point is important, as some jurisdictions prioritize rapid VRE deployment and thus enact regulatory frameworks that minimize the financial burden of network expansion to project developers. Such frameworks are commonly referred to as shallow or super-shallow frameworks (see Figure 3).
8 Stranded resource risk can be defined as the risk that an infrastructure investment is under or unutilized. In the context of VRE developers, there may be a perceived risk that transmission capacity will not be available to carry power by the time the project is ready for commercial operation.

9
This report is available at no cost from the National Renewable Energy Laboratory (NREL) at www.nrel.gov/publications.
In shallow and super-shallow regulatory frameworks, the regulator typically allocates most or all of the cost of network expansion to load. This has typically been the case in the European Union, and in particular in Germany and Denmark, where both have enacted super-shallow frameworks to reduce the burden to generators, particularly for offshore wind development (Scott 2007). In contrast, deep policy frameworks place more of the burden of network upgrades on the RE generator. For example, Mexico has traditionally placed responsibility for transmission expansion on generators. However, a process called “Open Season” allows for more efficient planning by the Mexican utility to reduce overall transmission costs. Deep policy approaches to network expansion will perhaps slow development but also reduce the financial burden to load. Below, the case of Australia illuminates these issues further.
2.2.1.1 Snapshot: Australia’s “Scaled Efficient Network Extension” Challenge: While the government of Australia has been proactive in promoting VRE through both energy and climate-related policy, the remoteness of VRE resources has posed a challenge for development. To address this barrier, the Australian Energy Market Commission (AEMC) proposed two options under the conceptual framework of “Scaled Efficient Network Extension” (SENE) in which upfront costs are minimized through economies of scale and cost-sharing. The two options varied mainly in how costs and risks were allocated. Each option, described below, posed further challenges associated with possible stranded resource risks.
Proposed Solutions: Under the first proposed SENE option, consumers would pay the majority (75%) of upfront costs associated with transmission extension and would be reimbursed as more generation came online in the future. While transmission extension decisions would be based on analysis of interest in the market and projected future generation in the proposed geographic area, the consumers would still take on the majority of risk associated with the potential for stranded resources if further generation development did not come to fruition. Under the second SENE option, RE generators or investors would pay the upfront costs to extend transmission taking on the possible “stranded resource” risk noted above. Similar to consumers, the early generators and investors paying the upfront cost would ideally be reimbursed as new generators came online.
Outcome: The AEMC, concerned that consumers would be least equipped to deal with stranded resource risk, elected the second option to finance transmission extension. AEMC cited that analysis projecting future generation was not robust enough for consumers to take on the risk and that generators and investors would have “better information, capability and incentive to weigh the benefits of scale efficiencies versus stranding risk.” In this regard, AEMC enacted a “semi-deep” policy, allocating risks to
Figure 3. Classification of transmission network cost allocation policies Source: Madrigal and Stoft (2011)

10
This report is available at no cost from the National Renewable Energy Laboratory (NREL) at www.nrel.gov/publications.
VRE developers based on the idea that they are best able to price these risks. This choice reflects the broader policy approach in Australia, where new VRE generation planning is largely market-based and “there is no mechanism to force any particular outcome and any decision to invest in new generation is entirely the responsibility of the investing party” (Cochran et al. 2012, p. 41). Therefore, private generators are assumed to have the best information and data, as national-level planning processes are largely indicative and only intended to provide high-level information on economically feasible VRE areas. The SENE example is discussed in greater detail in (ICER 2012).
KEY IDEA In cases where there is plausible risk of stranded transmission assets, one common risk management model is to place the risk on parties best able to evaluate and manage it.
2.2.2 Network Usage Costs In addition to network expansion costs, the allocation of network usage costs (alternately known as “use of system” or UoS costs) also impacts the revenue streams to VRE generators. Generally, methods to allocate costs of network usage fall into one of two camps: ‘postage stamp’ and ‘flow-based’ methods. Under the former, the transmission system user pays the same rate regardless of the source or destination of the electricity, or of the costs and benefits of the generator’s production. Like sending an in-country letter with a postage stamp, price is not linked to the sending or receiving location (Hempling 2009, Madrigal 2012). Under flow-based methods, also known as “pancaking,” transmission system users are charged according to level of use, usually defined according to some engineering proxy of the path that electrons take to their final destination. (An engineering proxy is required since it is physically impossible to trace individual electrons on a grid.) Mathematical formulations for both postage stamp and various flow-based methods are discussed in depth in Madrigal (2012). In some cases, VRE generators are not charged any network usage cost at all, for example, in Spain, Germany, India (solar only), and Texas (Madrigal 2012).
Given that VRE resources are geographically specific, and that geographic diversity of VRE resources is generally beneficial to system operation because it reduces aggregate variability and uncertainty, the design of network usage costs takes on increased importance in the shift to high VRE penetrations. Generally speaking, postage stamp methods reduce the financial burden of network usage on VRE generators while flow-based methods increase them. Analysis by Madrigal (2012) explores the dual role played by network connection cost charge and the network usage cost in the final levelized cost of electricity (LCOE) for a basic 50-MW wind farm. The combination most favorable to the generator—zero connection costs and zero usage costs—resulted in an LCOE approximately 15% lower than the least favorable— a flow-based usage cost and a semi-deep connection cost that included costs of the transformer and the connection line (not upgrades to the substation), along with a flow-based usage cost. While 15% may not appear substantial, it can represent a very large percentage of a premium tariff, so the treatment of network connection and usage charges is an important complement to tariff design. Thorough discussion of this topic can be found in Madrigal (2012), Scott (2007), and Pérez-Arriaga (2013).
KEY IDEA Network usage charges can significantly alter VRE project economics and can be designed to advance policy goals.
2.2.3 Distributed Generation Network Interconnection At all levels of penetration, ease of interconnection of distributed generators at the medium- and low-voltage networks is recognized as one of the key non-cost factors that influence rates of distributed RE deployment. During early stages, jurisdictions seeking to accelerate VRE deployment typically focus on reducing barriers posed by interconnection rules. The terms of grid interconnection are often in the purview of regulators (although they are typically shared with grid operators and international standards

11
This report is available at no cost from the National Renewable Energy Laboratory (NREL) at www.nrel.gov/publications.
bodies), and thus represent an important way to reduce barriers to deployment. The cases of Hawaii and Guatemala shed some light on typical issues that arise in this area.
2.2.3.1 Snapshot: Hawaii Solar Interconnection, Part 1 Challenge: With high energy prices and favorable solar resources, Hawaii aims to substantially increase PV deployment. However, complex legacy interconnection procedures and licensing processes can present significant non-economic barriers to solar PV development and implementation, frustrating policy goals.
Solution: To reduce non-economic barriers to PV deployment, in 2008 the Hawaii Public Utility Commission issued decisions to simplify the grid interconnection process for small-scale renewables. Among other elements, the new rules simplify the application process; streamline interconnection procedures, guidelines, and net-metering agreements; and establish timelines for interconnection requirements, including time needed to resolve any disputes related to projects. A subsequent decision in 2011 limited the number of projects that need to provide an Interconnection Requirements Study (IRS). Details of Hawaii interconnection procedures can be found at DSIRE (2012). Part 2 of this snapshot, which discusses technical issues encountered with very rapid PV deployment, is found in Section 3.
KEY IDEA Simplifying interconnection procedures for distributed resources is often complementary to other procurement mechanisms such as policy targets and specialized tariffs.
2.2.3.2 Snapshot: Guatemala Distributed RE Interconnection Challenge: Interest in RE in Guatemala has been driven by relatively high reliance on energy imports and persistently low energy access. Despite these drivers and policy incentives, interconnection processes and technical standards were criticized as unclear by various market actors, frustrating the goal of rapid RE deployment, especially distributed hydro resources below 5 MW.
Solution: In 2006, the regulator, the Comisión Nacional de Energia Eléctrica (CNEE), embarked on a series of reforms to clarify interconnection rules and technical standards. The resulting amendments to the General Electricity Law elaborated a set of rules (“DRG Rules”) that clarified the definition of distributed renewable generation (DRG), compelled distribution companies to allow interconnection of RE generators below 5 MW conditional upon adequate modifications to interconnection capacity, and mandated that distributors purchase electricity at wholesale market prices, if not already contracted by another party. DRG Rules also clarified that if an interconnection necessitated modification or expansion of the network, the RE generator would bear the cost. Finally, the DRG Rules gave CNEE the explicit authority to regulate the connection, operation, control, and marketing conditions of distributed RE.
In tandem with the DRG Rules, which clarified the legal and regulatory issues of DRG connections, CNEE promulgated a technical standard for interconnection to improve the quality of power delivered from distributed resources. This standard (“Norma Técnica para la Conexión, Operación, Control y Comercialización de la Generación Distribuida Renovable”) was based in part on technical references of the IEEE 1547 Standard (“Standard for Interconnecting Distributed Resources with Electric Power Systems”) to clarify minimum protective equipment for RE plants below 5 MW. For a more detailed exploration of the Guatemala experience, see NARUC (2011).
KEY IDEA Harmonizing interconnection procedures with robust technical standards can encourage investment while maintaining reliability.
Beyond the issues of interconnection, queue management, and siting, other more substantial grid reinforcement issues are rarely critical at the early stage of VRE deployment. In jurisdictions where all high-quality resources are remote, or where systems are very small, isolated, or weak, even small

12
This report is available at no cost from the National Renewable Energy Laboratory (NREL) at www.nrel.gov/publications.
additions of VRE may challenge existing grid infrastructure. However, in such cases, grid infrastructure concerns would not be unique to VRE, but would extend to all forms of generation. For further reading on such settings, various IRENA reports have focused on the issues of grid reinforcement of small systems, such as IRENA (2012).
2.3 Flexibility and Resource Adequacy: Planning for the Future Although each system is different, given the relatively minor impacts on system operation and overall fleet composition at early stages of VRE deployment, substantial regulatory changes are rarely required with regard to either system flexibility or resource adequacy. These early stages are, however, a critical time to begin to plan for these issues, and to collect data that will support regulatory and policy decision-making at intermediate and advanced stage stages. These data are crucial to support more thorough analyses (such as formal grid integration studies, discussed in Section 3) that later will be important for exploring key issues such as transmission and reserve capacity needs, market design modifications, and flexibility requirements. Such data requirements are discussed in detail in IEA WIND (2013b) and may include:
• Historic load data. Multiple years of historic load data are important for understanding the temporal patterns of load. These will be important considerations for understanding reserve requirements under future VRE scenarios, as well as for understanding the capacity credit contributions of VRE.
• Power plant data. Historic data of power plant generation, and about power plant capabilities, are critically important to accurate grid integration studies. Key performance factors for power plants include ramp rates, minimum generation levels, heat rates as a function of load, and emissions rates. To the extent hydro plants constitute a significant resource, important data include storage levels, water inflow, and any non-power constraints on generation, such as agricultural use or ecological protection.
• Multiple years of wind and solar resource data. Robust grid integration studies will require multiple years of solar and wind resource data. It takes multiple years to collect VRE resource data, and wind data--in contrast to solar--is typically more difficult and costly to measure and model. Data for both resources will ideally be at high spatio-temporal resolution, and will span multiple historic weather years in order to capture year-to-year weather cycles (such as La Niña/ El Niño) and related correlations between wet/dry years, hydro power production, and biomass production insofar as they are of interest.
Further discussion of these and other data requirements can be found in IEA WIND (2013b). Finally, a practical consideration discussed in that report is the establishment of a leadership team to carry out grid integration studies, including a lead agency supported by a study guidance committee to facilitate participation by critical stakeholders. Depending on the planned rate of VRE deployment, these issues can warrant regulatory consideration during the early stage.
In addition to grid infrastructure issues, the next two sections explore further the flexibility and resource adequacy issues as they grow in importance at intermediate and advanced stage VRE penetration.
13
This report is available at no cost from the National Renewable Energy Laboratory (NREL) at www.nrel.gov/publications.
3 Intermediate Stage Regulatory Issues Beyond the early stages of deployment, regulatory priorities expand to include more systemic effects at intermediate stages, such as efficient large-scale grid expansion and total power system flexibility. This section explores a sampling of lessons learned in these more complex issues.
3.1 VRE Procurement: Intermediate Stage Issues Implemented well, the VRE procurement concepts outlined in Section 2.1 will also largely satisfy regulatory requirements at intermediate stages. Especially important are remuneration schemes that balance system-specific requirements, public policy goals, and financial constraints as VRE penetration grows. Similarly, queue management will be equally important at the intermediate stage.
3.2 Grid Infrastructure: Intermediate Stage Issues As deployment rates reach intermediate levels, a more coordinated regulatory approach to network expansion and reinforcement can be needed.
3.2.1 Transmission Network Expansion After the closest utility-scale VRE generation sites have been developed during the early stages, regulatory issues at intermediate stages can focus on facilitating access to increasingly remote locations, which has important ramifications for resource quality and network expansion cost and complexity. As such, this issue is closely related to queue management (discussed in Section 2.1.4) since a transparent and orderly process for siting can reduce project development risk and costs. Broadly speaking, the role of regulators in supporting efficient transmission planning grows along with VRE deployment since uncoordinated VRE siting can result in suboptimal solutions (Madrigal 2012). Innovative approaches to transmission planning are discussed in RAP (2013b). The case of Texas provides one emerging approach to this issue.
3.2.1.1 Snapshot: Texas “Competitive RE Zones” Challenge: High-quality wind resources in Texas are distant from large load centers. In this context, uncertainty around the level and timing of public investment in transmission can make it difficult to attract VRE project development. Also, transmission investments in the United States typically follow wind generation proposals and are contingent upon commitments from generators to use the lines, posing a classic chicken-and-egg dilemma. Finally, transmission extension can take up to a decade while deployment of VRE generation often only takes up to a few years, creating challenges around incongruence of investment timing. To address these challenges and in order to meet state energy goals, regulators sought to spur development while appropriately balancing risk between the public and private sectors.
Solution: Texas Senate Bill 20 mandated the Public Utility Commission of Texas (PUCT) to identify Competitive Renewable Energy Zones (CREZ) in the state (Texas Senate 2005). The PUCT worked with transmission providers to design detailed transmission extension and upgrade plans for feasible and competitive wind generation areas (Figure 4). The transmission plans focus on long-term infrastructure needs, e.g., constructing higher voltage lines, which will lead to greater transmission efficiencies over time (PUCT 2010).

14
This report is available at no cost from the National Renewable Energy Laboratory (NREL) at www.nrel.gov/publications.
Notably, Texas Senate Bill 20 also set forth a funding structure authorizing CREZ transmission investments to be financed by utility customers. This authorization guaranteed cost recovery for transmission investors, reducing risk and addressing the chicken-and-egg dilemma noted above.
The CREZ process also involved intensive stakeholder consultations that informed final decisions on wind project and transmission siting. Issues that often raise public concern, such as line extension, were mitigated by ensuring active stakeholder engagement and facilitating multiple opportunities for feedback, thus increasing efficiency and speed of the process. Primarily routing transmission lines over private land rather than federal land (which requires compliance with the National Environmental Policy Act and a larger number of stakeholders), basing choice of CREZ locations on wind developer interest, and focusing
Figure 4. "Competitive RE zones" and related transmission lines in Texas Source: SNLFinancial (2013)

15
This report is available at no cost from the National Renewable Energy Laboratory (NREL) at www.nrel.gov/publications.
public stakeholder feedback on transmission line location also contributed to an efficient and timely process (Cochran et al. 2012).
KEY IDEA Transmission expansion costs can be minimized through coordinated planning processes that identify high-quality resource areas, address investment risk through funding structures that ensure cost recovery, and engage stakeholders throughout the process.
Aside from the above issues of efficiency and timeliness, RE project siting in developing countries can raise additional complexities, such as ensuring equitable terms in site procurement. For example, in many developing country settings, existing tenants may not have full land rights or may not know the fair market value of their land. In either case, if handled inappropriately, VRE siting and land acquisition practices can exacerbate existing inequities around land use. For more on this issue, see Ledec, Rapp, and Aiello (2011).
3.2.2 Distribution Network Development The rapid growth of VRE on distribution networks (especially distributed PV) is raising the importance of regulatory treatment of distribution networks. Investments in distribution and transmission networks differ from each other in several important ways, especially in terms of the number and cost of projects, planning periods, and “lumpiness” of annual budgets, among other factors (Petrov 2013). Figure 5 illustrates some of these differences.
Figure 5. Investment properties of transmission and distribution networks
Source: Adapted from Petrov (2013)
Distribution network regulatory issues involve substantive, procedural, and public interest questions. Substantive issues focus on accurately assessing the impact of VRE production on distribution networks. Procedural issues include determining appropriate modifications to distribution networks, minimizing their costs, and appropriately allocating these costs. This final step of allocation involves questions of public interest. Deep policies (allocating all network reinforcement costs to generators) will slow deployment but limit the cost to utilities and the public while shallow policies will accelerate deployment but require allocation to specific parties.
Increasing penetrations of VRE—especially solar PV—challenges existing models of distribution network regulation and operation. Distribution networks have historically been, and continue to be, designed to accommodate peak demand. In some locations, PV can reduce these peaks, yet in many regions peak demand occurs in the evening or in the winter, when solar PV production is absent or

16
This report is available at no cost from the National Renewable Energy Laboratory (NREL) at www.nrel.gov/publications.
reduced, so the overall network cost is not reduced and may even increase (Eurelectric 2013). Figure 6 illustrates how in the span of 3 years, PV installations in the region of Puglia, Italy have nearly eliminated—and in some cases, reversed—power flows from the transmission network to the distribution network, creating occasional “backflow” conditions during the middle of sunny, springtime weekend days. At the same time, these new PV penetrations have left the evening peak unchanged, leading to a steep ramp in the afternoon (Eurelectric 2013). Substantively, the answers to questions about PV impact on distribution network production and loading need to be answered through detailed grid integration studies at high temporal and spatial resolutions.
Figure 6. Power flows between transmission and distribution network in the Puglia region of Italy,
2010–2012
Source: Enel Distribuzione in Eurelectric (2013)
In addition to its impacts on peak demand requirements beyond certain penetration levels on distribution networks, VRE may contribute to additional need for grid reinforcement due to voltage variation and congestion (Eurelectric 2013). The precise penetration levels at which grid reinforcement may be required are highly sensitive to existing grid configuration. Additionally, innovative grid reinforcement and protection schemes are an active area of technical, policy, and regulatory research. The case studies of Hawaii and Germany may shed light on some of these issues.
3.2.2.1 Snapshot: Hawaii Solar PV Interconnection, Part 2 Update: Favorable incentives, falling PV costs, simplified interconnection processes, and very high electricity prices have combined to produce very rapid growth in PV deployment in Hawaii. As discussed in Section 2, a 2011 Hawaii PUC decision sought to relax requirements of PV interconnection studies. After this decision, utilities essentially guaranteed interconnection for residential systems with capacity less than 10 kW.

17
This report is available at no cost from the National Renewable Energy Laboratory (NREL) at www.nrel.gov/publications.
Under these conditions, the largest utility in Hawaii, Hawaiian Electric Company (HECO), observed rapid solar deployment after 2011. By 2013 approximately 10% of utility customers had installed PV compared to approximately 3% in California (Mulkern 2013). In 2013, HECO established new interconnection review study (IRS) processes, mandating an IRS for all systems up to 10 kW on circuits where total PV capacity exceeds 100% of “daytime minimum load” or DML (see Figure 8).9 This threshold was later increased to 120% of DML in February 2014 (“Transient Overvoltage Mitigation” 2014). The percentage-of-DML threshold is based on the system operators’ assessment of reliability and safety concerns from PV backflow, and the requirement for interconnection studies has dramatically limited new interconnections on the island, which in turn has prompted a regulatory response. On April 28, 2014, the Hawaii PUC released an order (PUC of Hawaii 2014), articulating the following concerns, among others:
• That HECO “failed to anticipate the rapid growth in distributed solar PV interconnections, and thus did not proactively plan and manage the distribution circuit interconnection process or technical challenges” (“Transient Overvoltage Mitigation” 2014, p. 91).
• That there is a lack of transparency regarding status of interconnection applications and the interconnection review process itself.
• That the DML metric is imprecisely measured.
The Hawaii PUC ordered HECO to develop a formal, transparent, unified distribution system interconnection queue. Every distribution circuit will have its own queue with technical information and a waiting list (with timelines) for when IRSs will be completed. HECO will be required to file monthly reports with extensive information on all interconnection requests and IRSs they say are required, and must also explain why there are delays in performing any scheduled IRSs. Regarding the measurement of DML, HECO will now be required to develop and implement an “ongoing distribution circuit monitoring program” to measure real-time voltage and other power quality parameters (e.g., voltage fluctuations and flicker, voltage during transient events, harmonics, etc.). This approach aims to establish a data-driven and transparent approach to IRS requirements.
The Hawaii story raises a trio of regulatory questions—substantive, procedural, and public interest—that are applicable to other settings with growing shares of distribution-level PV deployment. Substantively, what are the actual system reliability impacts of high penetrations of PV, what grid reinforcements will allow for greater penetrations of PV today and in the future, and what will such reinforcements cost? Procedurally, at what point can distribution system operators (DSOs) independently place restrictions on PV interconnection due to system reliability concerns? Also, if grid reinforcement is required for system reliability, how can costs be minimized, for example through coordinated planning, and how should they
9 There is some debate over the appropriate calculation of daytime minimum load. See "Hawaii Solar Voices" (2013).
Figure 7. February 2014 "Locational Value Map" of Oahu, illustrating PV penetration as a percent of daytime minimum
load Source: HECO (2014)

18
This report is available at no cost from the National Renewable Energy Laboratory (NREL) at www.nrel.gov/publications.
be allocated? With regards to the public interest, to what extent are additional expenditures on grid reinforcement justified by public policy goals of PV deployment?
As Hawaiian regulators and utilities grapple with PV deployment, planning, and grid reinforcement needs, they may find useful lessons to be learned from Germany, the focus of the next snapshot.
3.2.2.2 Snapshot: Facilitating PV Integration Through Mandated Grid Services in Germany
Challenge: Over the past 15 years, Germany led new annual solar capacity installations globally.10 As of November 2013, more than 35 GW of solar PV was installed in Germany, and annual generation in 2013 exceeded 29.7 TWh (Fraunhofer Institute for Solar Energy Systems 2014). On Sunday, July 7, 2013, German PV output peaked at nearly 40% of instantaneous demand and provided approximately 21% of total daily generation (Gerke 2013). While Sundays are typically low-demand days, these types of events will likely be more common as PV capacity continues to grow.
In this context, German regulators have been tasked with ensuring the quality and performance of the electricity system. While HECO currently caps PV deployment on any given circuit at 100% of daytime minimum load distributed, in southern Germany, DSOs have not established such caps, and PV output commonly represents a majority of local maximum load and, in many cases, exceeds it by multiple times (Eurelectric 2013).11 In such instances, distribution networks are in a backflow state and appear as a large generator to the transmission system operator (TSO).
Solution: A number of operational practices, grid codes, technical standards, and control schemes have been established by German policymakers, regulators, and standards bodies to ensure that PV supply supports grid reliability.12 Feed-in management is one such operational practice. In Germany, the DSO has active management of PV installations over a certain size, which allows for the technical ability to curtail production as needed. PV installation owners can either choose to install a communication device that allows for direct feed-in reduction by the DSO, or can choose to reduce the feed-in power to 70% of the nameplate capacity. This arrangement leads to greater control for the DSO and overall higher levels of connection to the network since new installations can be added without immediately incurring the need for large-scale reinforcement. But this arrangement also leads to the loss of about 5% of energy to the system. In Germany, installation owners are compensated for lost production and these costs are socialized (Eurelectric 2013).
In addition to feed-in management systems, the Medium and Low Voltage Directives mandate hardware requirements for PV systems which enable operators to provide grid services; these include inverters with control algorithms to address frequency and voltage variations and devices which enabled PV installations to dynamically curtail outputs to support grid stability (Stetz 2012). These investments defer larger grid reinforcement costs, and can be viewed as providing option value, allowing time for grid reinforcement schemes and technologies to evolve, and for their costs to drop (Miller et al. 2013).
KEY IDEA Distribution grid concerns at intermediate and high VRE penetrations can be mitigated through advanced grid codes and allowance for strategic curtailment of VRE.
10 The United States was forecasted to take over the lead in PV installations in 4th quarter of 2013 (Munsell 2013). 11 Germany is not the only example. For example, in Galicia, Spain, the capacity of distributed generation sources connected to the distribution network exceeds 120% of peak demand. The sources are varied however, including wind, combined heat and power (CHP), hydro, and PV, so the variability and uncertainty is less than with only PV (Eurelectric 2013). 12 Specifically, these codes were developed by the German Association for Electrical, Electronic & Information Technologies (VDE) and the German Association of Energy and Water Industries (BDEW).

19
This report is available at no cost from the National Renewable Energy Laboratory (NREL) at www.nrel.gov/publications.
3.3 Flexibility: Intermediate Stage Issues At intermediate penetrations, VRE may begin to exert more noticeable demands on power system flexibility, which is the ability of the power system to respond to changes in supply and demand. Power systems are all flexible to some degree, historically driven by demand fluctuations, ramping constraints and outages of conventional generators. Growing VRE generation increases the need for power system flexibility; some systems may easily absorb VRE fluctuations while others may require earlier attention and in some cases, regulatory action. This section discusses some of the key issues in understanding flexibility needs at the intermediate stage of deployment.
3.3.1 Estimating Reserve Impacts of VRE In systems with sufficient capacity, system operators typically hold additional generation capacity in reserve to address contingency events (such as the loss of a generator or transmission line) and accommodate normal fluctuations in demand. As VRE grows, changes to reserve requirements may become necessary. Many system operators further hedge against additional variability and uncertainty by holding additional reserves. Recent analysis suggests, however, that wind and solar generation tends to free up other generation capacity in proportion to its production, thus canceling out some or all of the net cost of additional operating reserves (Hummon et al. 2013).
Thus key substantive questions arise, namely how much capacity (and of what performance characteristics) needs to be held in reserve for reliability. Answers to these questions can impact the system-wide cost of integrating large amounts of VRE generation. The substantive issues involved in assessing adequate reserves under growing VRE shares are technically complex; for more detail see Doherty & O’Malley (2005), Ela, Milligan, and Kirby (2011), Hummon et al. (2013), and Morales, Conejo, and Perez-Ruiz (2009).
In light of these substantive questions, procedural changes may also be required as VRE penetrations increase—for example, modifications to reserve planning methodologies. Regulators may require that a system operator performs enhanced analysis to gain a clearer picture of required system flexibility in light of anticipated amount, composition, and location of new VRE generation. Additionally, regulators may re-assess the planning procedures that determine allowable risk of reliability events due to reserve shortfalls. IEA WIND (2013) recommends utilizing existing operational requirements for reliability risk when developing planning scenarios (such a requirement may state, for example, that the system is able cover 95% of the variations in load and net load.)
While establishing reliability risk tolerance is typically within the regulatory purview, estimating specific reserve requirements of future scenarios more typically falls to the system operator. Nonetheless, determining which resources qualify to provide reserves (e.g., DR) and how these reserves are obtained are important regulatory responsibilities. Appropriate strategies depend strongly on the market and regulatory framework. For example, vertically integrated utilities may simulate reserve requirements and propose capital investment based on estimated reserve changes, requiring careful technical review by regulators. In contrast, in organized wholesale market settings the approach typically falls into the larger question of ancillary services market design, which determines the types of ancillary services required and prices paid to generators (or demand-side resources) that provide them (RAP 2013c; Cochran et al. 2013).
International experience has generally revealed that reserve requirements can be reduced through a variety of ‘soft’ measures. These include system operational measures (such as improving forecasting and implementing faster scheduling), institutional measures (such as expanding balancing areas and coordinating reserve sharing with adjacent balancing areas), and planning measures (such as incentivizing geographic diversity of wind and solar resources)(Cochran et al. 2012). These measures are discussed in this section and in Section 4.

20
This report is available at no cost from the National Renewable Energy Laboratory (NREL) at www.nrel.gov/publications.
3.3.2 Forecasting In concert with market rules and system operation protocols, high-quality forecasting reduces uncertainty about the level of reserve capacity that needs to be held at any given time, and thus reduces reserve requirements in the aggregate. The specific requirements placed on system operators and generators to employ forecasting are often the purview of regulatory agencies. The case of Germany provides one perspective on this issue.
3.3.2.1 Snapshot: Reducing Reserve Requirements Through Better Forecasting in Germany
Challenge: With increasing levels of both wind and solar generation in Germany, system operators face increasing probability of significant variability events, elevating the importance of efficient reserve management.
Solution: The government of Germany mandated state-of-the art forecasting techniques to support grid reliability with increasing variable resource integration. German transmission system operators (TSOs) use a number of forecast outputs from various models to combine and produce optimal forecasts that also take into account current weather patterns. This approach is advantageous as different models often have better prediction outputs for certain weather conditions and combining these outputs can create a more accurate and robust forecast to support electricity planning. Based on the modeling outputs, the forecast amount is sold by TSOs to day-ahead and intra-day spot markets. Using this technique, the average forecast error is 4.5% for day-ahead predictions (Review of Industry Practice 2012). As highlighted in Germany, advanced forecasting methods can be valuable in ensuring reliability of the electricity system. Regulators may have the opportunity to support and direct TSOs in choosing forecasting techniques that enhance efficiency across the power system.
KEY IDEA Reserve requirements can be reduced through advanced forecasting techniques and effective integration of those techniques into power system operation.
3.3.3 Improving System Operation Practices Increasingly, system operation practices are recognized as tools to manage VRE flexibility requirements, thereby reducing integration costs. For example, systems that establish hourly (or less frequent) dispatch intervals effectively strand significant flexibility. Under hourly scheduling, because wind and solar resources exhibit variability on time frames shorter than an hour, all intra-hour changes must be managed through reserves, which are typically more expensive. In contrast, energy markets running dispatch and schedule changes every 5-15 minutes substantially increase the ability of the system to manage higher penetrations of VRE at less cost (Milligan et al. 2011). Most major organized markets in the United States employ five-minute scheduling (DOE SETP 2011) while the German market employs 15-minute scheduling intervals (ICER 2012).
The case of the U.S. Federal Energy Regulatory Commission (FERC) approach to supporting VRE integration provides one perspective on these issues.
3.3.3.1 Snapshot: U.S. Federal Energy Regulatory Commission Order 764 Challenge: In the United States, operational practices for addressing electricity system variability and related ancillary services were established when generation was sourced predominantly from conventional, dispatchable electricity resources. Thus, historically, load fluctuation was the predominant source of intra-hour variation. VRE can contribute to additional intra-hour variation, and conventional system operation practices were resulting in discriminatory treatment of VRE generators, suboptimal system operation, and increased costs to consumers (FERC 2012).
21
This report is available at no cost from the National Renewable Energy Laboratory (NREL) at www.nrel.gov/publications.
Solution: To address this challenge and advance system operation practices, FERC promulgated Order 764 in 2012. This order encompassed a wide range of measures, first revising the Open Access Transmission Tariff (OATT) to give transmission customers the ability to adjust intra-hour transmission schedules, a measure particularly beneficial given the intra-hour variability of VRE. Second, the order revised the Large Generator Interconnection Agreement (LGIA) to allow transmission providers to request forecast-relevant data from wind and solar resources for the purpose of developing and using power production forecasts. Additionally, Order 764 clarifies that transmission providers are only allowed to require this data if they are charging a differentiated rate for ancillary services. In effect, Order 764 bounded the types of data transmission providers can request from generators, and required that these requests had to match the level of forecasting being conducted.
Order 764 reforms aimed to reduce potential discriminatory system operation practices while providing transmission operators the necessary data to accurately forecast total wind output on their systems, resulting in more efficient management of variability and uncertainty. These matters are discussed in detail in FERC (2012).
KEY IDEA Changes to system operational and forecasting methods can be combined to unlock physical flexibility and enhance system reliability under growing shares of VRE.
In Focus: Grid Integration Charges In some jurisdictions, grid integration charges have been levied on VRE generators as a mechanism to recoup costs associated with system balancing. Other jurisdictions have explicitly opted against such charges, holding that they break from the traditional practice of socializing balancing costs across all customers. This section briefly explores some regulatory issues involved in assessing whether and how to assess grid integration charges.
When conducting regulatory cost-benefit analysis for VRE additions, complexity arises in accurately assessing and allocating both costs and benefits. On the cost side, precise VRE integration costs are difficult to assess, might change over time, might be higher or lower depending on system characteristics, and will depend significantly on the accounting methods used. Furthermore, whether to fully socialize these costs or to assess charges to specific network actors also depends upon the regulatory and policy context. The regulatory treatment of these costs will impact the investment landscape for VRE deployment, so advancing the state of knowledge in this area is of keen interest, especially given continued policy commitments to larger VRE contributions to power systems.
Because regulators do not directly observe the components of VRE integration costs, classic issues of regulation arise, namely attempting to overcome information asymmetries in order to produce results that might otherwise emerge from efficient, competitive markets. In practice, regulators administratively set the prices of goods and services for which natural price discovery is difficult or impossible and attempt to produce the most fair and efficient outcomes. Such regulatory efforts strongly shape market functioning and outcomes, in electricity systems generally and in VRE integration in particular.13
Administratively setting integration charges requires a comprehensive understanding of the nature of grid functioning, and furthermore requires tailored processes that seek to meet policy mandates fairly and efficiently. Regulatory determinations based on incomplete or faulty information, or based on faulty stakeholder engagement processes, can impede VRE development (e.g., in the case of onerous integration
13 Various characteristics of power systems inhibit naturally-occurring efficiency and competition. See, for example, Joskow and Schmalensee (1983), Kahn (1988), and Stoft (2002). Over the past 30 years, however, experiments in power market restructuring have revealed the potential for much greater competition than was thought possible through most of the 20th century. Even in restructured markets, however, the role of regulators is significant. See, for example, Joskow (2002) and Joskow (2003).

22
This report is available at no cost from the National Renewable Energy Laboratory (NREL) at www.nrel.gov/publications.
charges), or degrade system reliability or market functioning (e.g., in the case of failure to address VRE integration as an issue).
Estimating integration costs accurately—and assigning them fairly—is not a straightforward task. For example, to date there is no single globally accepted method for calculating VRE integration costs (Milligan et al. 2011), and given the significant uniqueness of power systems, a global “standard model” of estimating integration charges is unlikely to emerge soon. VRE integration costs are idiosyncratic, and the difficulty in estimating and allocating them derives from various factors:
• Determining integration costs directly attributable to VRE requires a comparison to some “reference case” scenario, and the specification of that reference scenario will significantly impact the resulting estimates of integration charges (Milligan et al. 2011).
• Given the nature of power system economics, precise attribution of causation of integration costs is often difficult and dependent on characteristics of the generation portfolio online, complicating the process of cost allocation.
• The least-cost path to VRE integration is unique to each power system, and is typically a product of “learning-while-doing.” In such a context, it is difficult for regulators to accurately predict integration costs.
• RE confers social and system benefits in addition to incurring system costs, so holistic benefit-cost analysis may impact the final estimated cost of VRE integration.
• The patterns of future deployment of VRE and other relevant system assets such as networks and demand-side resources will impact final integration costs. Since these are difficult to predict with precision, ex ante integration charges may over- or understate actual costs.
• Multiple actors advocate for diverging approaches to VRE integration, each with different system implications into the future, and so problems of advocacy and “picking winners” further complicates the accurate development of integration charges.
Improving the regulatory understanding of VRE integration can help resolve some of these issues, but others are inherently difficult to overcome. In this context, socializing integration costs across all customers is a common regulatory option, as it aligns with historical practice and avoids the complexities of determining specific costs and levying charges appropriately.
3.4 Resource Adequacy: Intermediate Stage Issues Generation adequacy is the ability to deliver sufficient capacity to meet electricity demand at all times in the future.14 VRE generation contributes to this ability, although the precise contribution is highly dependent upon system characteristics. Generally, VRE capacity contributions—or capacity credit —are less than those of conventional dispatchable power plants. Technical formulations of the capacity credit question have evolved over the past decade and are discussed in detail in Keane et al. (2011), and Milligan and Porter (2006). While inadequate generation adequacy uniquely due to VRE has not been documented at intermediate levels of VRE penetration, at today’s intermediate stage in Europe, there are contested debates underway about the impacts (both current and anticipated) of VRE generation on the financial health of conventional generators (ACER 2013). This section examines some of these issues in both contexts of excess capacity (found in most OECD nations) and capacity scarcity (found in many emerging economies).
14 In more technical terms, generation adequacy measures the capability of the power system to supply aggregate demand in all the states in which the power system may exist considering standard conditions (European Commission 2012).

23
This report is available at no cost from the National Renewable Energy Laboratory (NREL) at www.nrel.gov/publications.
3.4.1 Adequacy Mechanisms Adequacy is ensured through a wide variety of mechanisms. Table 2 summarizes international approaches—both administrative and market-based—to address resource adequacy. Further information and exploration on these examples can be found in Spees, Newell, and Pfeifenberger (2013).
Table 2. Administrative and Market-based Constructs for Adequacy
Administrative Mechanisms (Customers Bear Relatively More Risk)
Market-based Mechanisms (Suppliers Bear Relatively More Risk)
Regulated Utilities
Administrative Contracting
Capacity Payments
LSE RA Requirement
Capacity Markets
Energy-Only
Markets Examples SPP, BC
Hydro, much of WECC and SERC
Ontario
Spain, South America
California, MISO (both also have regulated IRP)
PJM, NYISO, ISO-NE, Brazil, Italy, Russia
ERCOT, Alberta, Australia’s NEM, Scandinavia
Resource Adequacy Requirement?
Yes (Utility IRP)
Yes (Administrative IRP)
Yes (Rules for Payment Size and Eligibility)
Yes (Creates Bilateral Capacity Market)
Yes (Mandatory Capacity Auction)
No (Resource Adequacy not Assured)
How are capital costs recovered?
Rate Recovery
Energy Market plus Administrative Contracts
Energy Market plus Capacity Payments
Bilateral capacity payments plus Energy Market
Bilateral capacity payments plus Capacity and Energy Markets
Energy Market
Source: Adapted from Spees, Newell, and Pfeifenberger (2013)
The ongoing debates in Texas and the United Kingdom over appropriate regulatory approach to resource adequacy provide two contrasting perspectives on this issue.
3.4.1.1 Snapshot: Resource Adequacy Debates in the Electric Reliability Council of Texas (ERCOT)
Challenge: The Electric Reliability Council of Texas (ERCOT), which manages and operates an energy-only wholesale market covering much of the electricity system in Texas, has experienced several years of growing demand, increasing VRE (wind) penetration, and consistently tight reserve margins. Some stakeholders argue that this tight margin threatens reliability of the system and will not be resolved in an energy-only market with price suppression effects of wind power. Other stakeholders argue that tight reserve margins signal efficient operation of the market, and that a capacity market would represent a shift of risk away from generators to consumers (Anderson 2014). The Public Utility Commission of Texas (PUCT) is currently debating whether to establish a dedicated remuneration mechanism to encourage greater investment in capacity or to retain the energy-only approach to adequacy.
Proposed Solutions: ERCOT hired the Brattle Group to assess possible options to address this challenge through the lens of three key considerations: criteria for investors to invest, effect of proposed rules on investment and the market, and possible policy options. Possible actions based on this assessment are outlined in the table below (Newell et al. 2012).15
15 The Brattle Group did not propose a specific course of action, noting that the decision would need to be made by policymakers and stakeholders, but instead provided an assessment of pros and cons of each possible option.

24
This report is available at no cost from the National Renewable Energy Laboratory (NREL) at www.nrel.gov/publications.
Table 3. Resource Adequacy Mechanism Options Examined for the ERCOT System Option How
Reliability Level is Determined
Who Makes Investment Decisions
Risk of Low Reliability
Investor Risks
Economic Efficiency
Market Design Changes
Comments
Energy-only with Market-Based Reserve Margin
Market Market High in short-run; lower in long run with more DR
High May be highest in long-run
Easy Depends on substantial DR participating to set prices at willingness-to-pay; ERCOT does not yet have much DR.
Energy-only with Adders to Support a Target Reserve Margin
Regulated Market Medium High Lower Easy - Not a reliable way to meet target - Adders are administratively determined.
Energy-only with Backstop Procurement at Minimum Acceptable Reliability
Regulated (when backstop imposed)
Regulated (when backstop imposed)
Low High Lower Easy -Attractive as an infrequent last resort, but long-term reliance is inefficient, non-market-based, and slippery-slope.
Mandatory Resource Adequacy Requirement for Load Serving Entities
Regulated Market Low (with sufficient deficiency penalty)
Med-High Medium (due to regulatory parameter)
Medium -Well-defined system and local requirements and resource qualification support bilateral trading of fungible credits, and competition - Cannot be a forward requirement - Flexibility: DR is like opting out; customers not behind a single distribution feeder could pay for higher reserves and reliability.
Resource Adequacy Requirement with Centralized Forward Capacity Market
Regulated Market Low Med-High (slightly less than #4)
Medium (due to regulatory parameters)
Major - Working well in PJM - Forward construct can efficiently respond to retirements and meet needs with sufficient lead time - Transparency valuable to market participants and market monitor - Many administrative determinations.
Source: Newell et al. (2012)
Outcome: Based on the Brattle Group assessment and option comparison above, ERCOT is currently most closely considering variations of Option 3, an energy-only market where the supplier takes on most of the risk, albeit with a mandatory reliability margin. The issue is far from settled, however, as a number of contentious regulatory debates on this issue took place in 2013 and 2014.
The ERCOT snapshot can be contrasted with the UK approach to the question of resource adequacy, in which the allocation of cost and risk has also been shifting in recent years.
3.4.1.2 Snapshot: Implementing a Capacity Market in the United Kingdom Challenge: As noted in the example in Section 2.1.1, the UK government is working to meet ambitious RE targets while also ensuring reliability of the electricity system.
Solution: As part of its Energy Market Reform, the UK government also adopted a capacity market mechanism to ensure security of electricity supply by incentivizing producers to deliver power as needed

25
This report is available at no cost from the National Renewable Energy Laboratory (NREL) at www.nrel.gov/publications.
under conditions of insufficient capacity (DECC 2013). Ultimately, the capacity market provides an additional tariff stream to conventional generators, thus incentivizing resource adequacy investment and contributing to long-term system reliability. As noted in Table 2 above, under this mechanism suppliers assume most of the risk of resource adequacy, albeit relatively less than under an energy-only paradigm. Thus in moving from an energy-only market to a capacity market, some level of risk is shifted to customers.
KEY IDEA Resource adequacy issues raise multiple issues of investment incentives and business model evolution for conventional thermal generators, and of risk allocation between generators and load. In Focus: Resource Adequacy in Contexts of Scarcity and Surplus In terms of ensuring adequate electricity supply, VRE generation can have different regulatory implications depending on the amount of existing generation capacity and pace of new conventional capacity additions. From a capacity factor point of view, wind and solar power typically confer between 15-40% of nameplate capacity. However, the substantive regulatory question pertains more to capacity credit, in other words how much the VRE capacity contributes to adequacy and reliability. The answer depends on a range of factors, especially patterns of demand in the jurisdiction, and characteristics of the generation fleet.
However, the impact of VRE capacity credit in context of scarcity is a more recent area of regulatory attention. Consider, for example, a hypothetical capacity addition of wind or solar power that would meet 5% of existing annual demand. In excess capacity settings—where some generators are already operating at low capacity usage for economic reasons—such an addition would further contribute to generation over-supply, leading to more reductions in capacity usage of conventional generators. All else being equal, the same addition in a scarce capacity setting (where demand regularly outstrips supply) would mainly contribute to satisfying incremental demand. Thus, in capacity-scarce systems, the same amount of VRE generation may pose less of a regulatory concern with regards to ‘asset stranding’ than in an excess-capacity power system. A more detailed discussion can be found in (IEA 2014).
Thus, in excess capacity settings found in most OECD contexts, regulatory attention increasingly focuses on the displacement of generation from ‘legacy’ generators and the accelerated removal of those generators from the market. Both the financial and system operational impacts of this trend have received regulatory attention. Financially, regulatory challenges focus on who should bear the risk of economic stranding of power plants. With regards to system operational impacts, the concern is essentially that at some point the conventional fleet will no longer be able to provide desired characteristics, especially sufficient dispatchability to manage substantial VRE fluctuation events and sufficient system inertia to maintain stable and reliable operation during contingency events. In sum, the regulatory questions focus on establishing rules and frameworks such that the reduction of the conventional fleet is fair, orderly, and maintains reliability. These questions are the focus of much debate in EU settings today, as reflected in recent discussions of capacity markets in ACER (2013) and European Commission (2013).
Regulatory concerns in capacity-scarce systems are typically different. When integrated appropriately (i.e., when curtailment is minimized and system operators can manage the variability), new VRE generation satisfies latent demand and adds “more tools to the toolbox” for resolving chronic supply shortages. In a context of falling VRE costs, capacity-scarce systems are no longer limited to deploying coal, gas, hydro, and nuclear plants to meet growing energy demand. Wind and solar PV technologies have a unique and sometimes favorable investment profile relative to other options given their modularity, flexible sizing, and relatively straightforward project development cycles. In addition, a variety of novel forms of financing are available for VRE, ranging from carbon financing to third-party solar leasing.
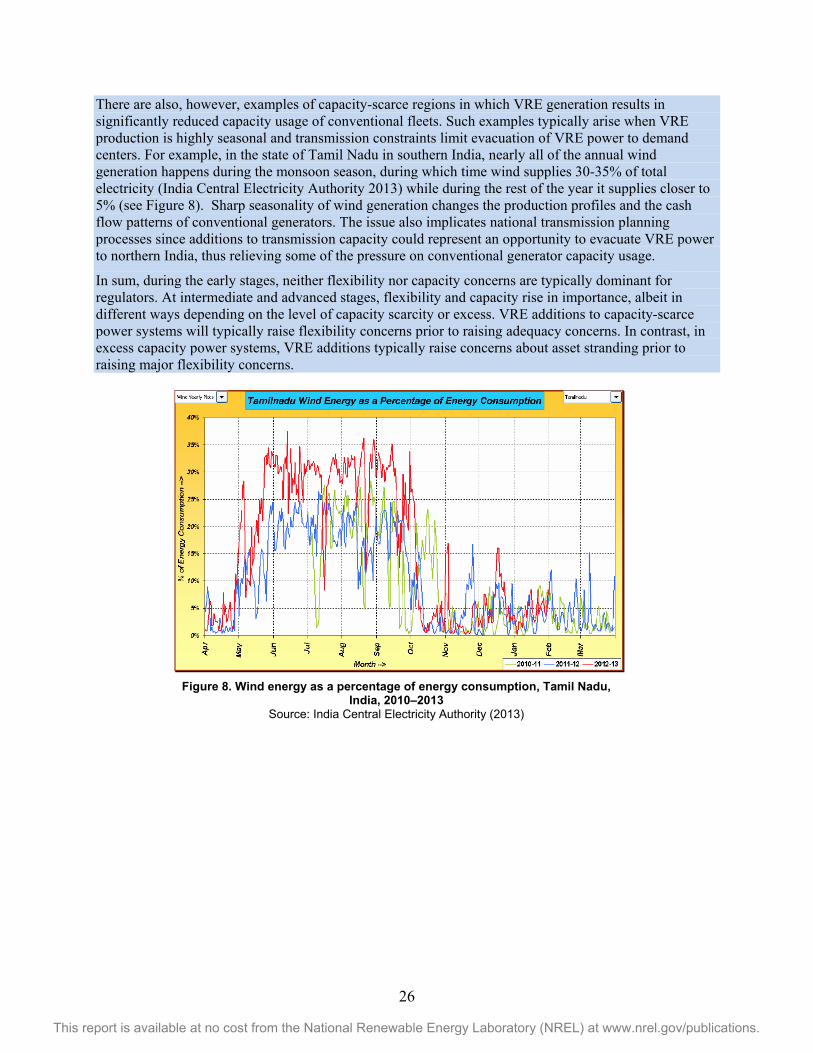
26
This report is available at no cost from the National Renewable Energy Laboratory (NREL) at www.nrel.gov/publications.
There are also, however, examples of capacity-scarce regions in which VRE generation results in significantly reduced capacity usage of conventional fleets. Such examples typically arise when VRE production is highly seasonal and transmission constraints limit evacuation of VRE power to demand centers. For example, in the state of Tamil Nadu in southern India, nearly all of the annual wind generation happens during the monsoon season, during which time wind supplies 30-35% of total electricity (India Central Electricity Authority 2013) while during the rest of the year it supplies closer to 5% (see Figure 8). Sharp seasonality of wind generation changes the production profiles and the cash flow patterns of conventional generators. The issue also implicates national transmission planning processes since additions to transmission capacity could represent an opportunity to evacuate VRE power to northern India, thus relieving some of the pressure on conventional generator capacity usage.
In sum, during the early stages, neither flexibility nor capacity concerns are typically dominant for regulators. At intermediate and advanced stages, flexibility and capacity rise in importance, albeit in different ways depending on the level of capacity scarcity or excess. VRE additions to capacity-scarce power systems will typically raise flexibility concerns prior to raising adequacy concerns. In contrast, in excess capacity power systems, VRE additions typically raise concerns about asset stranding prior to raising major flexibility concerns.
Figure 8. Wind energy as a percentage of energy consumption, Tamil Nadu, India, 2010–2013
Source: India Central Electricity Authority (2013)

27
This report is available at no cost from the National Renewable Energy Laboratory (NREL) at www.nrel.gov/publications.
4 Advanced Stage Regulatory Issues Advanced stages of VRE penetration incur more complex changes in power system regulation. As of 2014, few jurisdictions have annual VRE penetrations greater than 20% of total annual generation, so empirical evidence of regulatory approaches is relatively scarce.16 However, Germany, Italy, Spain, and Ireland are approaching 20% penetration and will likely surpass it in 2014 (EIA 2013; WEO 2013). This section attempts to provide a brief overview of regulatory issues arising at these advanced stages.17
4.1 Advanced Stage VRE Procurement Issues At advanced stages, the challenges of VRE procurement will likely be similar to those enumerated in Section 3.1, but more acute. This section briefly explores the limited empirical evidence of challenges at the advanced stage.
4.1.1 Evolution of RE Siting As VRE penetration grows, siting of VRE generation plants may increasingly be constrained by land-use competition (Mai, Sandor, Wiser, et al. 2012) or public opposition (IEA WIND 2013a). Tailoring VRE planning and procurement processes to minimize these issues will be an important regulatory concern at significant levels of penetration. As a small country with aggressive policy targets, the case of Denmark provides insights into this issue.
4.1.1.1 Snapshot: Integrated Offshore Resource Planning in Denmark Challenge: A problem of increasingly limited onshore wind sites has driven Denmark to pursue offshore wind, which has less favorable costs, but improves resource quality and mitigates many land use and public opposition challenges. In the context of aggressive policy goals, Denmark decision makers face the challenge of cultivating a robust yet cost-efficient offshore wind development industry.
Solution: Denmark has refined its approach to offshore wind tenders over the last 10 years (with 8 offshore wind facilities currently operating) and also gained experience from similar approaches in the oil and gas sector. The tender process in Denmark involves the following steps and practices:
• Site assessment and selection. In order to reduce risk and cost to investors, the government of Denmark funds site assessment and selection for suitable offshore wind sites, which is often time-consuming and expensive for private developers, limiting the pace of investment (Deloitte 2011).
• Development of tender process. Before releasing initial offshore wind tenders, applicants and the Danish Energy Authority (DEA) are given the opportunity to negotiate and address any imprecise or unclear aspects of the tender conditions. Tender conditions are then finalized in cooperation with key energy authorities in Denmark and, together with licensing requirements, are aligned with Denmark’s Electricity Act to ensure an efficient process. DEA also works closely with the system operator, Energinet DK, to develop a detailed description of the responsibilities for both the TSO and the tender winner in relation to timing for key activities and grid connection conditions.
• Pre-qualification. Applicants are assessed on the basis of technical and financial qualifications.
• Tender award. Award of the tender is based on (in order of priority): price/kWh, design and location of the project, and timeline for building the project.
A number of factors contribute to the efficiency of the tender process for offshore wind farms in Denmark. First, the government of Denmark takes on much of the upfront burden of site assessment and 16 Only one jurisdiction in the world (Denmark) has VRE penetrations of more than 25% of total annual electricity generation in 2012. Additionally, Denmark is highly interconnected to both continental Europe and the Nordic system, so the full penetration of VRE is not integrated in isolation. 17 Naturally, what today qualifies as ‘advanced stage’ will no longer be ‘advanced’ in 2020 or 2030.

28
This report is available at no cost from the National Renewable Energy Laboratory (NREL) at www.nrel.gov/publications.
selection, which greatly reduces cost and thus risk to possible investors. This also allows for an accelerated RE investment process. Second, the approach focuses on reducing risk for tender applicants by creating a transparent, collaborative, and coordinated process (e.g., integrating licensing requirements, etc.). Integration within the DEA of planning, licensing, and permitting responsibility—as well as a mandate to play the overall coordination role with other relevant power sector entities—allows for a more streamlined and cost-effective process (Jørgensen 2013).
KEY IDEA VRE procurement at high penetrations can be sustained through increased support for resource characterization and project site assessment, and through streamlined, transparent processes.
4.2 Grid Infrastructure: Advanced Stage Issues As illustrated in Section 4.1 (as well as in Sections 3.1 and 3.2 above), VRE procurement and grid infrastructure typically become increasingly interdependent at intermediate and advanced stages. The principles and actions outlined in the preceding sections apply at advanced stages. Corresponding to the limited international experience above 20% VRE penetrations, empirical evidence of regulatory best practices in grid infrastructure is only now emerging, and is beyond the scope of this report. Subsequent CERI research will focus on these issues.
4.3 Advanced Stage Flexibility At higher penetrations, VRE exerts noticeable demands on system flexibility. Generally speaking, wind and solar have different profiles in this regard: solar dominates variability, and wind dominates uncertainty (NREL 2013). In other words, solar output is less uncertain than wind, but is more variable, because sunrise and sunset (and to a lesser extent, cloud events) cause variations in power output that are larger and faster than those typically observed in wind power systems (see Figure 10). To some extent these regular variations can be anticipated and planned for in day-ahead scheduling. Wind power tends to change more slowly, but the specific timing of those changes is more uncertain than solar and is more difficult to plan for in day-ahead scheduling.
These differences illustrate how the relative shares of wind and solar capacity in a high-penetration scenario will imply different reserve requirements strategies. At a substantive level, this could require detailed modeling in order to reach appropriate regulatory determinations of reserve capacity and to design appropriate mechanisms for procuring that capacity.
4.3.1 High-penetration Reserve Requirements Little empirical evidence exists to guide regulators on procuring sufficient reserves at VRE penetrations greater than 20%. Ireland is one of the only relatively isolated systems to manage greater than 15% penetration of wind. Other jurisdictions with similar or greater VRE penetrations (e.g., Spain, Portugal, Denmark) are more deeply integrated into large balancing areas, thus reducing the need for autonomous flexibility. In lieu of empirical evidence, detailed simulations provide the best indications of reserve requirements under high VRE penetration scenarios. The U.S. Western Wind and Solar Integration Study, Phase 2 (NREL 2013) provides important insights in this regard.
4.3.1.1 Snapshot: Differential Solar and Wind Reserve Requirements for the Western United States
Challenge: Policymakers in the western United States have noted the need for robust estimation of reserve requirements under high wind and solar scenarios. Historically, the majority of research on VRE reserve requirements focused primarily on wind, partly due to better data on wind power, and because high solar penetrations have historically been less of a concern (WWSIS 2 2013; Orwig et al. 2012; Navigant Consulting et al. 2011). Thus, the specific flexibility needs under high solar penetrations was less recognized.

29
This report is available at no cost from the National Renewable Energy Laboratory (NREL) at www.nrel.gov/publications.
Solution: The Western Wind and Solar Integration Study (WWSIS) Phase 2 was commissioned to investigate system impacts, including reserve requirements, under various wind and solar penetrations. Reserve impacts are summarized in Table 4. Ibanez et al. (2012) proposed a formal methodology for calculating solar reserves and this methodology was subsequently used in the study (WWSIS Phase 2 2013). The WWSIS Phase 2 study was one of the first of its depth, and much remains to be learned. Results suggest that the magnitude of impact on secondary regulation reserves (with a response time of seconds to minutes) is roughly similar under either wind or solar scenarios, but that tertiary, load-following reserves (with a response time of minutes to hours) are higher under the 25% wind scenario. A primary lesson from this analysis18 is that high wind and high solar scenarios each require up to 10% more regulating reserves than a “no renewables” scenario, but that a high wind scenario additionally requires load-following reserves of 3% of installed VRE capacity. This is reduced to 1% for the high solar scenario.
Table 4. Simulated Reserve Requirements of Different Wind/Solar Mixes in the WWSIS Phase 2 Analysis (NREL 2013)
KEY IDEA At high VRE penetrations, preliminary analysis indicates that additional reserve requirements are relatively small compared to total system size, and that there are important differences in reserve impacts depending on the mix of solar and wind generation.
4.3.2 Evolution of Demand Response DR will likely be an important source of flexibility as VRE penetrations grow. The volume, cost, and performance characteristics of DR remain important open questions relative to other flexibility options, such as interconnection and flexible generation. Preliminary assessments of DR capacity and performance characteristics for California shed some light on this issue.
18 WWSIS analysis may have limited applicability to other regions around the world given the assumption of five-minute economic dispatch and the unique nature of the resource and power system in the western United States.
WWSIS Scenario Contingency (MW) Regulation (MW) Load Following (MW)
No Renewables (0% wind, 0% solar) 3,361 1,120 0
Base Case (9.4% wind, 3.6% solar) 3,361 1,158 1,193
High Wind (25% wind, 8% solar) 3,361 1,236 2,599
High Mix (16.5% wind, 16.5% solar) 3,361 1,211 2,035
High Solar (25% solar, 8% wind) 3,361 1,207 1,545
Figure 9. Five-minute changes in power density: load only, high wind, and high solar scenarios
Source: WWSIS 2 (2013)

30
This report is available at no cost from the National Renewable Energy Laboratory (NREL) at www.nrel.gov/publications.
4.3.2.1 Snapshot: Increasing Flexibility Through the use of Demand-side Resources—The California Public Utilities Commission (PUC)
Challenge: California’s Renewable Portfolio Standard (RPS) target of 33% renewable installed capacity by 2020 requires innovative solutions to address possible integration challenges associated with intra-hour variability of VRE. While DR is currently used as an emergency (peak-reduction) resource in California, its ability to provide substantial flexibility for VRE integration remains largely untested, leaving important knowledge gaps regarding the extent to which it will be part of the flexibility solution.
Proposed Solutions: To address these unknowns, the California Public Utilities Commission (CPUC) commissioned a study (Perlstein et al. 2012) to assess the capabilities of DR resources and to suggest modifications to current DR programs that would allow it to play a substantial role in providing ancillary services. Navigant surveyed various DR programs in the state and attempted to quantify the level of fit between the technical requirements of these programs with existing ancillary services market requirements. Correcting mismatches between these technical requirements would likely require making modifications such as: use of telemetry for real-time communications, metering, and control; reduced or no advance notification time; automated response to control signals; and increasing number of times and frequency with which a program could be dispatched. More details of these suggested adjustments are in Table 5.
The CPUC is currently in the process of assessing whether to mandate any modifications to existing DR programs or to make other necessary changes. The barriers to change are not insubstantial. For example, reducing the response time of DR through automated control equipment requires new capital investment, which would in turn require the CPUC to clarify eligibility of various investors to recover such costs. Additionally, relaxing the limits on the timing and frequency of DR events could alter the willingness to participate in such programs. These issues have yet to be clarified formally in California, but the type of analysis carried out in this setting to identify specific technical specifications provides important insights for regulators.
Table 5. Necessary Attributes for DR to Supply Ancillary Services in the CAISO Market
Attributes Needed to Provide Ancillary
Services Continuous Ramping/
Load Following Spinning and Non-spinning Reserves Regulation Services
Telemetry Required Required Required Response time Less than one hour, but
some resources taking 10 hours or more could be used
Less than 10 minutes; less than 10 seconds to begin ramping is desirable
Less than a minute
Automated response Required Required Required Event limitations 10 hours or more
duration, minimum of one hour
Dozens to more than 100 events lasting at least one hour each
Continuous availability desired
Daily/seasonal availability*
24 x 7 year-round, with seasonal variation
24 x 7 year-round 24 x 7 year-round
Target end uses Commercial lighting and HVAC
Agricultural and municipal pumping, electric water heat (if available)
Temperature controlled warehouses, industrial motor loads on variable frequency drives
Source: Perlstein et al. (2012)
KEY IDEA DR represents an important source of flexibility, and large-scale DR participation will depend upon regulatory specification of eligibility, performance characteristics, performance validation, and compensation mechanisms.

31
This report is available at no cost from the National Renewable Energy Laboratory (NREL) at www.nrel.gov/publications.
4.4 Resource Adequacy: Advanced Stage Issues There is limited empirical experience regarding regulatory approaches to ensuring resource adequacy at advanced stage penetrations (beyond 20%). Instead, this section focuses on one area that will likely play an increasingly important role: institutional coordination across jurisdictional borders.
4.4.1 Institutional Coordination Institutional coordination—effectively expanding the geographical area over which reserves are shared—can lead to lower overall system costs through reducing overall uncertainty and variability of VRE generation and through increased shared reserve capacity. Merging various balancing areas is one example. The creation of organized wholesale markets spanning many balancing areas represents a major trend in institutional coordination in the past 30 years. Even in jurisdictions where organized wholesale markets have not been established, institutional coordination can assist in VRE integration. Given the substantive, procedural, and public interest involved, institutional coordination has significant implications for regulators. The case of the U.S. Western Interconnection illustrates this point.
4.4.1.1 Snapshot: Reducing Reserve Requirements in the U.S. Western Interconnection Through an Energy Imbalance Market
Challenge: The western United States consists of more than 30 interconnected balancing area authorities (BAAs) with abundant wind and solar resources. Anticipating a significant increase in wind and solar generation through 2020 and beyond, interest has grown in forms of institutional coordination to accommodate increasingly higher penetrations of VRE and reduce VRE integration costs. Policymakers and regulators in the various states of the western United States have become increasingly interested in substantive and public interest questions about potential region-wide solutions to VRE integration.
Solution: An ‘energy imbalance market’ (EIM) has been proposed to ensure reliable and cost-effective VRE integration, as an EIM would allow for intra-hour scheduling of energy and ancillary services between balancing areas. An EIM would provide some of the benefits of balancing area expansion without requiring the formal merger of balancing areas or the creation of a single market. An EIM effectively expands the operational footprint of the power system, reducing aggregate VRE variability and allowing for reserve sharing. This generally allows BAA system operators to do more with less: the aggregate ramping capability of the generation fleet scales linearly with expansion while the ramping needs of the power system scale sub-linearly, resulting in economies of scale (Milligan et al. 2011). In early 2012, regulators from the 12 states in the region formed a working group to review proposals and commission cost-benefit analyses for various EIM designs. Initial analyses indicated that annual benefits (achieved through reserve sharing) outweigh the startup and operating costs by nearly 2-to-1 (Kavulla 2013).
But precisely how to implement an EIM across the western United States? This question will require significant collaboration between adjacent policymakers and regulators—a process that is at a very early stage. A key regulatory consideration is multi-jurisdictional cost estimation and allocation since, even though overall system costs are significantly lower, some balancing areas providing additional reserves may see locational marginal price increases.
While full regional regulatory coordination has not been achieved, a preliminary EIM is being assembled in a more incremental fashion. In November 2013, the California Independent System Operator (CAISO) Board of Governors approved a plan to make a filing to FERC to establish an EIM with its adjacent balancing area to the north, PacifiCorp. In April 2014, NVEnergy, a utility balancing area to the east, filed a request with its state regulator to join the CAISO EIM (Electric Light & Power/POWERGRID International 2014).
KEY IDEA Institutional measures to expand operating footprints results in greater flexibility due to lower aggregate variability and higher aggregate reserve capacity, reducing concerns over resource adequacy.

32
This report is available at no cost from the National Renewable Energy Laboratory (NREL) at www.nrel.gov/publications.
5 Conclusion: Regulation for Comprehensive VRE Integration This paper charts the progression of regulatory issues across early, intermediate, and advanced stages of VRE penetration. The common thread of this progression is increasing interdependency between four key domains: facilitating new VRE generation, ensuring adequate grid infrastructure, ensuring short-term security of supply (flexibility), and ensuring long-term security of supply (resource adequacy).
CERI aims to situate VRE deployment and integration into a larger framework. Key to this framework is the recognition that all significant changes to a power system incur some need for integration. For example, a new transmission line changes power flows and locational prices, and new baseload generation changes the economics of all other generators. Especially at high penetrations, VRE integration is a complex and iterative issue, involving many interrelated actors and assets, and involving various feedback loops.
Regulators around the world are engaging with the key considerations that impact VRE deployment and integration, especially:
• Actions that impact the operational practices of the power system
• Actions that impact network development
• Actions that determine the level of reserves required for reliable operation
• Determinations of how to allocate integration costs.
All of these “first order” actions may result in integration costs in the short term (as well as in the medium- and long-term). In addition to the above, there are actions that will impact the VRE integration challenge through medium- and long-term effects:
• Actions that impact VRE siting
• Actions that impact the terms of VRE interconnection and provision of grid services
• Actions that impact the evolution of the conventional fleet
• Actions that impact the evolution of demand-side responsiveness.
These second order actions have a longer term impact on the cost of VRE integration, as they will direct the evolution of the broader power system as VRE penetrations grow. The minimization of these costs is a goal of system operators, VRE project developers, customers, and regulators alike. Dialogue and exchange between these stakeholder groups—and across the global regulatory community—will be increasingly important in accelerating the development of systemic approaches to VRE integration.

33
This report is available at no cost from the National Renewable Energy Laboratory (NREL) at www.nrel.gov/publications.
References ACER-Agency for the Cooperation of Energy Regulators. (2013). Capacity Remuneration Mechanisms and the Internal Market for Electricity. Article 11 of Regulation (EC) No 713/2009. Accessed April 29, 2014: http://www.acer.europa.eu/Official_documents/Acts_of_the_Agency/Publication/CRMs%20and%20the%20IEM%20Report%20130730.pdf.
Anderson, K. W. (2014). “The Nature of ERCOT's Capacity Reserve Margin.” Presented at Restructuring for Today Webinar. Accessed April 29, 2014: http://www.puc.texas.gov/agency/about/commissioners/anderson/pp/Restructuring%20Today%20Webinar%20Jan%2015%202014.pdf
Azuela, G.E.; Barroso, L.A. (2012). Design and Performance of Policy Instruments to Promote the Development of Renewable Energy: Emerging Experience in Selected Developing Countries. Paper No. 22. Washington, DC: The World Bank. Accessed April 29, 2014: http://siteresources.worldbank.org/EXTENERGY2/Resources/DiscPaper22.pdf.
Becker, B.; Fischer, D. (2013). "Promoting Renewable Electricity Generation in Emerging Economies." Energy Policy (56); pp. 446–455. Accessed April 29, 2014: http://dx.doi.org/10.1016/j.enpol.2013.01.004.
Burger, B. (2014). "Electricity Production from Solar and Wind in Germany in 2013." Accessed April 29, 2014: http://www.ise.fraunhofer.de/en/downloads-englisch/pdf-files-englisch/news/electricity-production-from-solar-and-wind-in-germany-in-2013.pdf.
Butler, L.; Neuhoff, K. (2008). "Comparison of Feed-In Tariff, Quota and Auction Mechanisms to Support Wind Power Development." Renewable Energy (33:8); pp. 1854–1867. Accessed April 29, 2014: http://dx.doi.org/10.1016/j.renene.2007.10.008.
Central Electricity Authority, Government of India. (2013). Large Scale Grid Integration of Renewable Energy Sources-Way Forward. Accessed April 29, 2014: www.cea.nic.in/reports/powersystems/large_scale_grid_integ.pdf.
CER-Commission for Energy Regulation. (2008). Criteria for Gate 3 Renewable Generator Offers & Related Matters. CER/08/260. Accessed April 29, 2014: http://www.cer.ie/docs/000903/cer08260.pdf.
Cochran, J.; Bird, L.; Heeter, J.; Arent, D.J. (2012). Integrating Variable Renewable Energy In Electric Power Markets: Best Practices from International Experience. NREL/TP-6A00-53732. Golden, CO: National Renewable Energy Laboratory. Accessed April 29, 2014: http://www.nrel.gov/docs/fy12osti/53732.pdf.
Cochran, J.; Miller, M.; Milligan, M.; Ela, E.; Arent, D.; Bloom, A.; Futch, M.; Kiviluoma, J.; Holtinnen, H.; Orths, A.; Gomez-Lazaro, E.; Martin-Martinez, S.; Kukoda, S.; Garcia, G.; Mikkelsen, K. M.; Yongqiang, Z.; Sandholt, K. (2013). Market Evolution: Wholesale Electricity Market Design for 21st Century Power Systems. NREL/TP-6A20-57477. Golden, CO: National Renewable Energy Laboratory. Accessed May 9, 2014: http://www.nrel.gov/docs/fy14osti/57477.pdf.
Couture, T.D.; Cory, K.; Kreycik, C.; Williams, E. (2010). Policymaker’s Guide to Feed-in Tariff Policy Design. NREL/TP-6A2-44849. Golden, CO: National Renewable Energy Laboratory. Accessed April 29, 2014: http://www.nrel.gov/docs/fy10osti/44849.pdf.

34
This report is available at no cost from the National Renewable Energy Laboratory (NREL) at www.nrel.gov/publications.
Couture, T.; Gagnon, Y. (2010). "An Analysis of Feed-In Tariff Remuneration Models: Implications for Renewable Energy Investment." Energy Policy (38:2); pp. 955–965. Accessed April 29, 2014: http://dx.doi.org/10.1016/j.enpol.2009.10.047.
DECC-Department of Energy & Climate Change. (2012). Annex A: Feed-In Tarrif with Contracts for Difference: Operational Framework. Accessed April 29, 2014: https://www.gov.uk/government/uploads/system/uploads/attachment_data/file/65635/7077-electricity-market-reform-annex-a.pdf.
DECC-Department of Energy & Climate Change. (2013). Electricity Market Reform-Contract for Difference: Contract and Allocation Overview. Accessed April 29, 2014: https://www.gov.uk/government/uploads/system/uploads/attachment_data/file/233004/EMR__Contract_for_Difference__Contract_and_Allocation_Overview_Final_28_August.pdf.
Doherty, R.; O’Malley, M. (2005). "A New Approach to Quantify Reserve Demand in Systems with Significant Installed Wind Capacity." IEEE Transactions on Power Systems (20:2); pp. 587–595. Accessed April 29, 2014: http://dx.doi.org/10.1109/TPWRS.2005.846206.
DSIRE. (2012). Hawaii Interconnection Standards. DSIRE. Retrieved from http://www.dsireusa.org/incentives/incentive.cfm?Incentive_Code=HI01R.
Economist. (2010). “Fed up: Germany’s support for solar power is becoming ever harder to afford.” Accessed May 2014: http://www.economist.com/node/15213817.
Economist. (2011). “Renewable energy: Sun-burned.” Accessed May 2014: http://www.economist.com/blogs/babbage/2011/07/renewable-energy.
Economist. (2012). “Energiewende: German plans to cut carbon emissions with renewable energy are ambitious, but they are also risky.” Accessed May 2014: http://www.economist.com/node/21559667.
Ela, E.; Milligan, M.; Kirby, B. (2011). Operating Reserves and Variable Generation. NREL/TP-5500-51978. Golden, CO: National Renewable Energy Laboratory. Accessed April 29, 2014: http://www.nrel.gov/docs/fy11osti/51978.pdf.
ERRA-Energy Regulators Regional Association (2013). ERRA Issue Paper: Regulatory Practices Supporting Deployment of Renewable Generators through Enhanced Network Connection. Budapest, Hungary. Accessed April 29, 2014: http://erranet.org/index.php?name=OE-eLibrary&file=download&keret=N&showheader=N&id=9317.
Eurelectric-Union of the Electricity Industry. (2013). Active Distribution System Management: A Key Tool for the Smooth Integration of Distributed Generation. Brussels, Belgium. Accessed April 29, 2014: http://www.eurelectric.org/media/74356/asm_full_report_discussion_paper_final-2013-030-0117-01-e.pdf.
European Commission. (2013). Generation Adequacy in the Internal Electricity Market-Guidance on Public Interventions. SWD(2013) 438 final. Brussels, Belgium. Accessed April 29, 2014: http://ec.europa.eu/energy/gas_electricity/doc/com_2013_public_intervention_swd01_en.pdf.
Federal Energy Regulatory Commission. (2012). Order 764. 18 CFR Part 35. Accessed April 29, 2014: http://www.ferc.gov/whats-new/comm-meet/2012/062112/E-3.pdf.
http://www.eurelectric.org/media/74356/asm_full_report_discussion_paper_final-2013-030-0117-01-e.pdf

35
This report is available at no cost from the National Renewable Energy Laboratory (NREL) at www.nrel.gov/publications.
Gerke, T. (2013). "Sunday, Solar Sunday—Germany’s July 7 Solar Power Record In-Depth." Clean Technica. Accessed April 29, 2014: http://cleantechnica.com/2013/07/12/sunday-solar-sunday-germany-solar-power-record-in-depth/.
Hiroux, C.; Saguan, M. (2010). "Large-Scale Wind Power in European Electricity Markets: Time for Revisiting Support Schemes and Market Designs?" Energy Policy (38:7); pp. 3135–3145. Accessed April 29, 2014: http://dx.doi.org/10.1016/j.enpol.2009.07.030.
Hummon, M.; Denholm, P.; Jorgenson, J.; Palchak, D.; Kirby, B.; Ma, O. (2013). Fundamental Drivers of the Cost and Price of Operating Reserves. NREL/TP-6A20-58491. Golden, CO: National Renewable Energy Laboratory. Accessed April 29, 2014: http://www.nrel.gov/docs/fy13osti/58491.pdf.
ICER-International Confederation of Energy Regulators. (2012). Report on Renewable Energy and Distributed Generation: International Case Studies on Technical and Economic Considerations. I12-CC-17-03. Accessed April 29, 2014: http://www.icer-regulators.net/portal/page/portal/ICER_HOME/publications_press/ICER_Reports_2009_2012/ICER_Reports/ICER%20RES%20and%20DG%20Report_FINAL_0.pdf.
IEA Wind-International Energy Agency. (2013). Expert Group Summary in Recommended Practices #14: Social Acceptance of Wind Energy Projects. Accessed April 29, 2014: http://www.socialacceptance.ch/images/RP_14_Social_Acceptance_FINAL.pdf.
IEA Wind-International Energy Agency. (2013). Expert Group Report on Recommended Practices #16: Wind Integration Studies. Accessed April 29, 2014: http://www.ieawind.org/index_page_postings/100313/RP%2016%20Wind%20Integration%20Studies_Approved%20091213.pdf.
IEA-International Energy Agency (2014). The Power of Transformation Wind, Sun and the Economics of Flexible Power Systems. Paris: OECD Publishing.
IRENA-International Renewable Energy Agency. (2012). IRENA Policy Brief: Policy Challenges for Renewable Energy Deployment in Pacific Island Countries and Territories. Abu Dhabi, United Arab Emirates. Accessed April 29, 2014: http://www.irena.org/DocumentDownloads/Publications/Policy_Challenges_for_Renewable_Energy_Deployment_PICTs.pdf.
IRENA-International Renewable Energy Agency. (2013). Renewable Energy Auctions in Developing Countries. Abu Dhabi, United Arab Emirates. Accessed April 29, 2014: http://www.irena.org/DocumentDownloads/Publications/IRENA_Renewable_energy_auctions_in_developing_countries.pdf.
Jørgensen, M.H. (2013). “A new model for developing offshore wind farms in Danish waters.” Offshoreenergy.dk. Accessed May 2014: http://www.offshoreenergy.dk/offshoreenergy/news-media/on-off-magazines/article/a-new-model-for-developing-offshore-wind-farms-in-danish-waters.aspx.
Jørgensen, C.; Enevoldsen, M. (2011). Analysis of Framework Conditions in Key EU Countries. Work performed by Deloitte, UK. Copenhagen, Denmark: Ministry of Climate and Energy. Accessed April 29, 2014: http://www.ens.dk/sites/ens.dk/files/supply/renewable-energy/wind-power/offshore-wind-power/planning-siting-offshore-wind/Deloitte%20Background%20report%201%20-%20Analysis%20of%20framework%20conditions%20in%20key%20EU%20countries.pdf.

36
This report is available at no cost from the National Renewable Energy Laboratory (NREL) at www.nrel.gov/publications.
Joskow, P.L.; Schmalensee, R. (1983). Markets for Power: An Analysis of Electric Utility Deregulation. Cambridge, MA: MIT Press.
Joskow, P.L. (2002). “Lessons Learned from Electricity Liberalization in the UK and US. Presentation at conference, Towards a European Market for Electricity.” SSPA—Italian Advanced School of Public Administration. Rome, Italy. June 24.
Joskow, P.L. (2003). “Electricity Sector Restructuring and Competition: Lessons Learned.” Latin American Journal of Economics (40:121); pp. 548–558. Accessed April 29, 2014: http://www.laje-ce.org/previous-issues-results-en?docid=1943.
Kahn, A.E. (1988). The Economics of Regulation: Principles and Institutions. Cambridge, MA: MIT Press.
Kavulla, T. (2013). "PUC EIM Group Update." Presented at WECC Joint Standing Committee Meetings. Accessed April 29, 2014: http://www.westgov.org/PUCeim/documents/07-12-13EIMgu.pdf.
Keane, A.; Milligan, M.; Dent, C.J.; Hasche, B.; D’Annunzio, C.; Dragoon, K.; Holttinen, H.; Soder, L.; O’Malley, M. (2011). "Capacity Value of Wind Power." IEEE Transactions on Power Systems (26:2); pp. 564–572. Accessed April 29, 2014: http://dx.doi.org/10.1109/TPWRS.2010.2062543.
Klein, A.; Held, A.; Ragwitz, M.; Resch, G.; Faber, T. (2007). Evaluation of Different Feed-In Tariff Design Options: Best Practice Paper for the International Feed-in Cooperation. Germany: Ministry for the Environment, Nature Conservation and Nuclear Safety (BMU). Accessed April 29, 2014: http://www.feed-in-cooperation.org/wDefault_7/wDefault_7/download-files/research/best_practice_paper_2nd_edition_final.pdf.
Lauber, V. (2004). "REFIT and RPS: Options for a Harmonised Community Framework." Energy Policy (32:12); pp. 1405–1414. Accessed April 29, 2014: http://dx.doi.org/10.1016/S0301-4215(03)00108-3.
Ledec, G.C.; Rapp, K.W.; Aiello, R.G. (2011). Greening the Wind. The World Bank. Accessed April 29, 2014: http://migratorysoaringbirds.undp.birdlife.org/sites/default/files/GreeningTheWind%20-%20Full%20Report_0.pdf.
Lew, D.; Brinkman, G. (2013). The Western Wind And Solar Integration Study: Phase 2: Executive Summary. NREL/TP-5500-58798. Golden, CO: National Renewable Energy Laboratory. Accessed April 29, 2014: http://www.nrel.gov/docs/fy13osti/58798.pdf.
Madrigal, M. (2011). Transmission expansion for renewable energy scale-up: emerging lessons and recommendations. Paper No. 26. Washington DC: The World Bank. Accessed April 29, 2014: http://siteresources.worldbank.org/EXTENERGY2/Resources/Transmission-Expansion-and-RE.pdf.
Maurer, L.T.A.; Barroso, L.A. (2011). Electricity Auctions: An Overview of Efficient Practices. Washington, DC: World Bank Publications. Accessed April 29, 2014: http://www.ifc.org/wps/wcm/connect/8a92fa004aabaa73977bd79e0dc67fc6/Electricity+and+Demand+Side+Auctions.pdf?MOD=AJPERES.

37
This report is available at no cost from the National Renewable Energy Laboratory (NREL) at www.nrel.gov/publications.
Miller, M.; Bird, L.; Cochran, J.; Milligan, M.; Bazilian, M.; Denny, E.; Dillon, J.; Bialek, J.; O'Malley; Neuhoff, K. (2013). RES-E-NEXT: Next Generation of RES-E Policy Instruments. Utrecht, The Netherlands: IEA-RETD. Accessed April 29, 2014: http://iea-retd.org/wp-content/uploads/2013/07/RES-E-NEXT_IEA-RETD_2013.pdf.
Milligan, M.; Ela, E.; Hodge, B.-M.; Kirby, B.; Lew, D.; Clark, C.; DeCesaro, J.; Lynn, K. (2011). Cost-Causation and Integration Cost Analysis for Variable Generation. NREL/TP-5500-51860. Golden, CO: National Renewable Energy Laboratory. Accessed April 29, 2014: http://www.nrel.gov/docs/fy11osti/51860.pdf.
Milligan, M.; Porter, K. (2006). "The Capacity Value of Wind in the United States: Methods and Implementation." The Electricity Journal (19:2); pp. 91–99. Accessed April 29, 2014: http://dx.doi.org/10.1016/j.tej.2005.12.010.
Mitchell, C.; Bauknecht, D.; Connor, P.M. (2006). "Effectiveness Through Risk Reduction: A Comparison of the Renewable Obligation in England and Wales and the Feed-in System in Germany." Energy Policy, (34:3); pp. 297–305. Accessed April 29, 2014: http://dx.doi.org/10.1016/j.enpol.2004.08.004.
Morales, J.M.; Conejo, A.J.; Perez-Ruiz, J. (2009). "Economic Valuation of Reserves in Power Systems with High Penetration of Wind Power." IEEE Power Energy Society General Meeting, 2009. PES ’09. Accessed April 29, 2014: http://dx.doi.org10.1109/PES.2009.5260229.
Mulkern, A.; ClimateWire (2013). "A Solar Boom So Successful, It’s Been Halted." Scientific American. Accessed April 29, 2014: http://www.scientificamerican.com/article/a-solar-boom-so-successfull-its-been-halted/.
National Renewable Energy Laboratory. (2012). Renewable Electricity Futures Study. Hand, M.M.; Baldwin, S.; DeMeo, E.; Reilly, J.M.; Mai, T.; Arent, D.; Porro, G.; Meshek, M.; Sandor, D. eds. 4 vols. NREL/TP-6A20-52409. Golden, CO: National Renewable Energy Laboratory. Accessed April 29, 2014: http://www.nrel.gov/analysis/re_futures/. Newell, S.; Spees, K.; Pfeifenberger, J.; Mudge, R.; DeLucia, M.; Carlton, R. (2012). ERCOT Investment Incentives and Resource Adequacy. Work performed by The Brattle Group. Austin, TX: Electric Reliability Council of Texas (ERCOT). Accessed April 29, 2014: http://www.ercot.com/content/news/presentations/2013/Brattle%20ERCOT%20Resource%20Adequacy%20Review%20-%202012-06-01.pdf.
"NV Energy Files to be in California ISO Energy Imbalance Market." (2014). Electric Light & Power/POWERGRID International. Accessed April 29, 2014: http://www.elp.com/articles/2014/04/nv-energy-files-to-be-in-california-iso-energy-imbalance-market.html.
Pérez-Arriaga, I.J., ed. (2013). Regulation of the Power Sector. Power Systems. London: Springer.
Perlstein, B.; Gilbert, E.; Stern, F.; Corfee, K., Battenberg, L.; Maslowski, R.; Schare, S.; Firestone, R. (2012). Potential Role of Demand Response Resources in Maintaining Grid Stability and Integrating Variable Renewable Energy under California’s 33 Percent Renewable Portfolio Standard. San Francisco: Navigant Consulting. Accessed April 29, 2014: http://www.calmac.org/publications/7-18-12_Final_White_Paper_on_Use_of_DR_for_Renewable_Energy_Integration.pdf.
38
This report is available at no cost from the National Renewable Energy Laboratory (NREL) at www.nrel.gov/publications.
Petrov, K. (2013). "Introduction to Network Regulation, Module 3: Regulatory Investment Incentives." Accessed April 29, 2014: http://www.slideshare.net/slideshow/embed_code/28119196?hostedIn=slideshare&referer=http://www.slideshare.net/sustenergy.
Public Utility Commission of Texas - CREZ Transmission Program Information Center. (2010). Public Utility Commission of Texas. Accessed April 29, 2014: http://www.texascrezprojects.com/overview.aspx.
Public Utility Commission of Hawaii. (2013). Ruling on RSWG Work Product and Other Reliability Matters. Docket No. 2011-0206. Order No. 32053. Accessed May 2014: http://puc.hawaii.gov/wp-content/uploads/2014/04/Order-No.-32053.pdf. Regulatory Assistance Project (RAP). (2013). Gottstein, M.; Skillings, S. A Review of Challenges in Implementing UK’s New Feed-in-Tariff: Relevance for “Market Premium” Discussions in Germany? Berlin, Germany: Regulatory Assistance Project. Accessed May 9, 2014: http://www.raponline.org/document/download/id/6632. RAP. (2013b.) Encouraging Transmission Investment for Clean Energy. Cowart, R. Berlin, Germany: Regulatory Assistance Project. Accessed May 9, 2014: http://www.raponline.org/document/download/id/6928. RAP. (2013c). Aligning Power Markets to Deliver Value. Hogan, M. Burlington, VT: Regulatory Assistance Project. Accessed May 2014: http://www.raponline.org/document/download/id/6932. REN21. (2013). Renewables 2013 Global Status Report. Paris. Accessed April 29, 2014: http://www.ren21.net/Portals/0/documents/Resources/GSR/2013/GSR2013_lowres.pdf.
Review of Industry Practice and Experience in the Integration of Wind and Solar Generation. (2012). Prepared for PJM Interconnection, LLC. Accessed May 2014: http://pjm.com/~/media/committees-groups/task-forces/irtf/postings/pris-task3b-best-practices-from-other-markets-final-report.ashx.
The Role of Electricity Markets and Market Design in Integrating Solar Generation. (2011). DOE/GO-102011-3199. Washington, DC: U.S. Department of Energy. Accessed April 29, 2014: http://www1.eere.energy.gov/solar/pdfs/50058.pdf.
Scott, N.C. (2007). European Practices with Grid Connection, Reinforcement, Constraint and Charging of Renewable Energy Projects. Highlands and Islands Enterprise. Accessed April 29, 2014: http://www.ontario-sea.org/Storage/28/1978_EU-practices-grid-connection_2007.pdf.
SETIS-Strategic Energy Technology Information System Glossary. European Commission. Accessed April 29, 2014: http://setis.ec.europa.eu/glossary.
Spees, K.; Newell, S.A.; Pfeifenberger, J.P. (2013). "Capacity Markets - Lessons Learned from the First Decade." Economics of Energy & Environmental Policy (2:2); pp. 1-26. Accessed April 29, 2014: http://dx.doi.org/10.5547/2160-5890.2.2.1.
Stetz, T. (2012). "German Guidelines and Laws for PV Grid Integration." Presented at the IEA Task 14 Meeting. Accessed April 29, 2014: http://www.sunspec.org/wp-content/uploads/2013/06/03_germanlawsandstandards_thomasstetz.pdf.

39
This report is available at no cost from the National Renewable Energy Laboratory (NREL) at www.nrel.gov/publications.
Texas Senate. (2005). Senate Bill 20. Legislative Session: 79(1). Accessed April 29, 2014: http://www.capitol.state.tx.us/BillLookup/Text.aspx?LegSess=791&Bill=SB20.
“Transient Over-Voltage Mitigation: Explanation and Mitigation Options for Inverter-Based Distributed Generation Projects ≤ 10kW.” (2014). Honolulu, HI: HECO. Accessed May 2014: http://www.hawaiianelectric.com/vcmcontent/StaticFiles/pdf/TOV-Mitigation-Measures-Public-Brief-Feb-24-2014(Final).pdf.
"Understanding HECO’s Recent Policy Changes on Solar Interconnection." (2013). Hawaii Solar Voices. Accessed April 29, 2014: http://www.hawaiisolarvoices.org/1/post/2013/09/-understanding-hecos-recent-policy-changes-on-solar-interconnection.html.