Overview of the status of soil resource in Uganda, and the needs and priorities for its sustainable...
14
Overview of the status of soil Overview of the status of soil resource in Uganda, and the needs and priorities for its sustainable management management O S ll & K ki C Ki i Onesmus Semalulu & Kayuki C. Kaizzi NARO‐Kawanda
Transcript of Overview of the status of soil resource in Uganda, and the needs and priorities for its sustainable...
Overview of the status of soilOverview of the status of soil resource in Uganda, and the needs and priorities for its sustainable
managementmanagement
O S l l & K ki C K i iOnesmus Semalulu & Kayuki C. Kaizzi
NARO‐Kawanda
Overview• Location : Uganda lies astride the Equator, between latitudes 4o 12´ N and 1o 29´ S and longitudes 29o 34´ W, and 35o 0´ E.
• Size: Total land area 241, 548 km2 of which about 15% is covered by water bodiesy
• Population : About 32 Million People• Population : About 32 Million People
• Population Growth: 3.2 % per annum
Climate and TopographyClimate and Topography
• ClimateClimate– Temperature range: 15o ‐ 30o C.
Annual Rainfall range: 750 to 1500 mm– Annual Rainfall range: 750 to 1500 mm
T h• Topography‐Mainly, lying between 1000 ‐ 2500 metres above
l lsea level.
UGANDA SOILSThe soil resources
GULU
KOTIDO
KITGUM
PADERARUA
YUMBE MOYO
ADJUMANI
of Uganda
LIRA
APAC
MASINDI
MOROTO
KATAKWI
NEBBI
SOROTI
NAKAPIRIPIRIT
KABERAMAIDO
HOIMA
MUBENDE
KAMULI
KUMI
KIBOGA
KIBAALE
KYENJOJO
NAKASEKE
IGANGA
LUWERO
PALLISA
NAKASONGOLA
TORORO
MBALEKAYUNGA
KABAROLE
BUNDIBUGYO
JINJA
KAPCHORWA
BUSIA
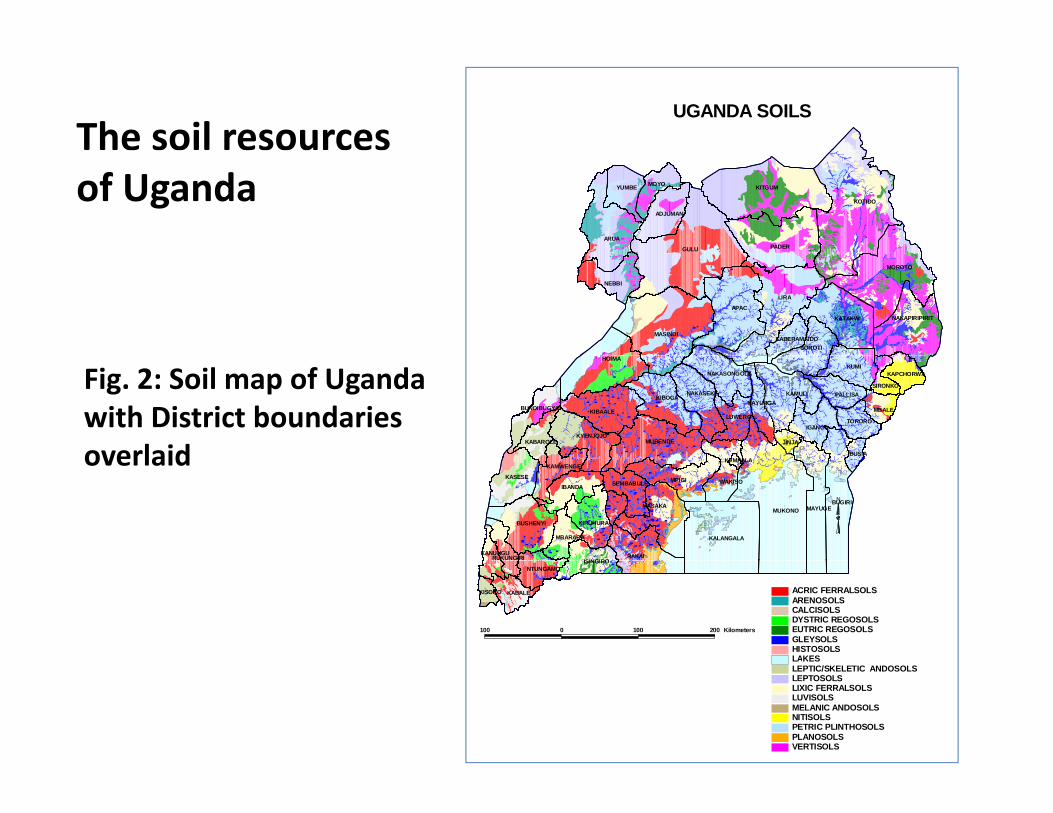
SIRONKOFig. 2: Soil map of Uganda with District boundaries overlaid
MUKONOBUGIRI
RAKAI
KALANGALA
MPIGI
MASAKA MAYUGE
KASESE
BUSHENYI
WAKISOIBANDA
ISINGIRO
KIRUHURA
KAMWENGE
SEMBABULE
MBARARA
RUKUNGIRIKANUNGU
KAMPALA
N
overlaid
ISINGIRO
KABALE
NTUNGAMO
KISORO
100 0 100 200 Kilometers
ACRIC FERRALSOLSARENOSOLSCALCISOLSDYSTRIC REGOSOLSEUTRIC REGOSOLSGLEYSOLSHISTOSOLSLAKESLEPTIC/SKELETIC ANDOSOLSLEPTOSOLSLIXIC FERRALSOLSLUVISOLSMELANIC ANDOSOLSNITISOLSPETRIC PLINTHOSOLSPLANOSOLSVERTISOLS

Inherent productivity rating of Uganda soils
High-Very highModerate-HighLow-ModerateVery Low-Low– High ‐ 8%
N
EW
S
– Medium – 14%
– Fair ‐ 43% 50 0 50 Kilometers
– Low – 30%
– Negligible ‐ 5%
‐Varying productivity depending on placedepending on place ‐ Research indicates declining soil fertility due to nutrient i i d littl
Fig. 3: Inherent fertility of Uganda soils (based on grading in the soil memoirs, 1960s)
mining and little or no replenishment of nutrients
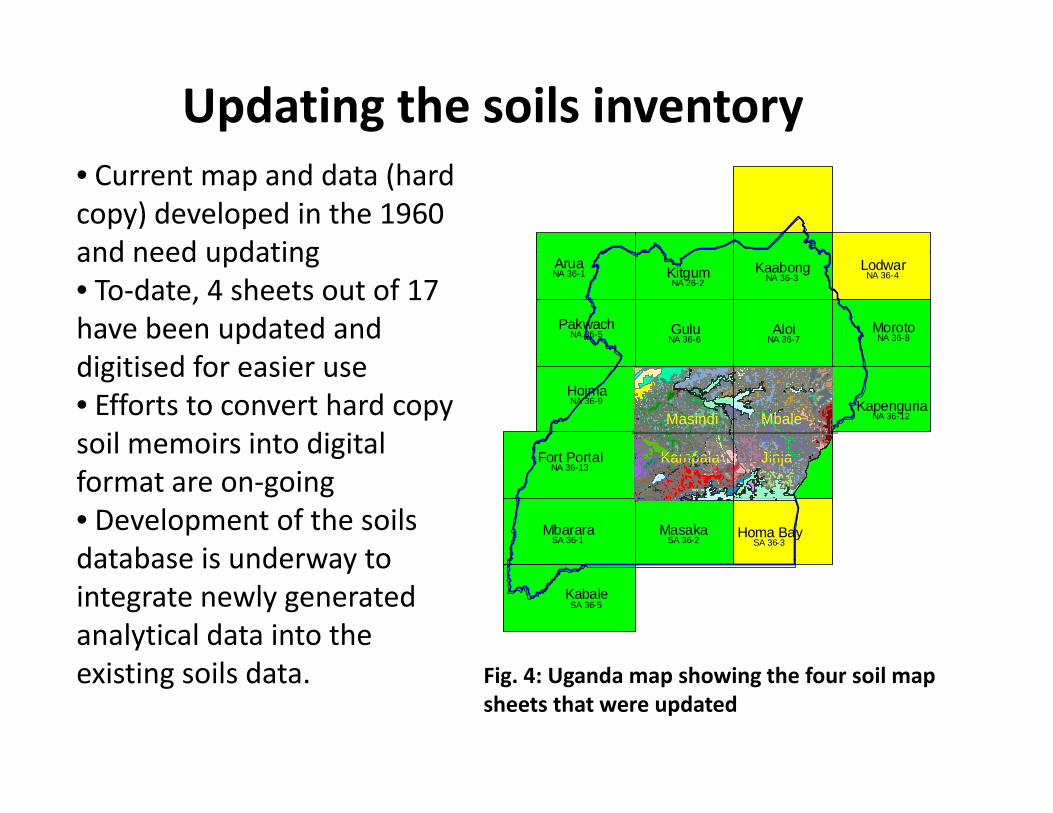
Updating the soils inventory• Current map and data (hard copy) developed in the 1960 and need updating
Aloi
Arua
Gulu Moroto
Kitgum LodwarKaabong
Pakwach
NA 26-2
NA 36-7 NA 36-8
NA 36-4
NA 36-5
NA 36-1 NA 36-3
NA 36-6
and need updating• To‐date, 4 sheets out of 17 have been updated and d d f
MbaleHoima Masindi
Fort Portal K l
KapenguriaNA 36-9
NA 36-12NA 36-11NA 36-10
42
41
41
137
42
62
150
65
137 6262
138
65
150
138
62
41
41
62
44
137
41
137
137
39
39 4161
40 61
137
137
41
41
41
64
137
61
61
41
41
41
137
61
61
63
63
63
63
150
137
61
63
6161
44
137
100
99
102
100
33
33
31
137
41
41
100
100
99
102
99
98
101
10333
75
137
75
63
138
100
104
75
113 75
111113 75
137
71
71
75
75
137
71
71113 75
111
71
61
63
75
150
113 75
99
101
100
33102102
32
32
33
118
65
62
41
137
138
6565
65
65
65
138
62
62
6262
41
137
137
41
137
11862
4142
42
137
41
137
13740
137
138
138
61
61137
6113747
14
14
65
125
41
125
47
3777 77
50
47
14
14
47
125
125
138
14
41
4141
41
41
42
125 41
41
41
41
41
41
125
125
125
12541
40
40
40
40
40 40 4041
65
124137
137
65
65
41
41
41
41
41
125
125
125
125
138
127
150
150
150
150
150
138
4161
138
137
137
137
64
64
64
64
137
61
61
62
138
137
41
49137
82
50
123
14
48
14
47
50 50
48
48
48
43
43
40
42
43125
42
42
125
43
15
42
38842
388
12716
25 388
388
125
125
65
65
65
41
40
125 125
351 9 351 9
42
42
4242
12543 4343
4040
43
124
1125
127
42
42
65
65
41
4141
40
42
40
4040
40
40
65 65
65
65
17 17
138
125
125
19
4340
4043
43
41
137137
41
42
138
137
41
41
101
98
40
41
138137
137
137 13733
33
33
Masindi Mbale
Kampala Jinja
digitised for easier use• Efforts to convert hard copy soil memoirs into digital
Jinja
Mbarara Masaka
Fort Portal Kampala
Homa BaySA 36-1
NA 36-13
SA 36-2 SA 36-3
NA 36-14 NA 36 -1541
41
137
137
41
41
137
18
18
42
111 9
25
24
24
11232 4
126
128
12
17
17
171 32
17
18
137
137
18
18
35
27
27
124
124
27
35
35
150
2021
21
124
21
124
2020
126
20
12620
128
126
65
65
124
124
128
11
11
11
11
11
11
68
127
42
27
27
126
38
38
19
19
19
19
11
11
181 29
128 12 9
128 12 9171 28 17
12
11
18
1818
18
18
181 29
13
127
127
25
25
11
11
150
111 9
111 9
111 9
111 9
111 9
27
42
42
181 29
181 29
181 29
151
38
38
187 2
126
12622
126
22
232 4
11
128
42
137
137
137
137
24
40
40
40
34
3434
11
18
17
137
41
40127
126
40137
24
12
40
41Kampala Jinjagformat are on‐going• Development of the soils database is underway to
KabaleSA 36-5
database is underway to integrate newly generated analytical data into the i i il dexisting soils data. Fig. 4: Uganda map showing the four soil map
sheets that were updated
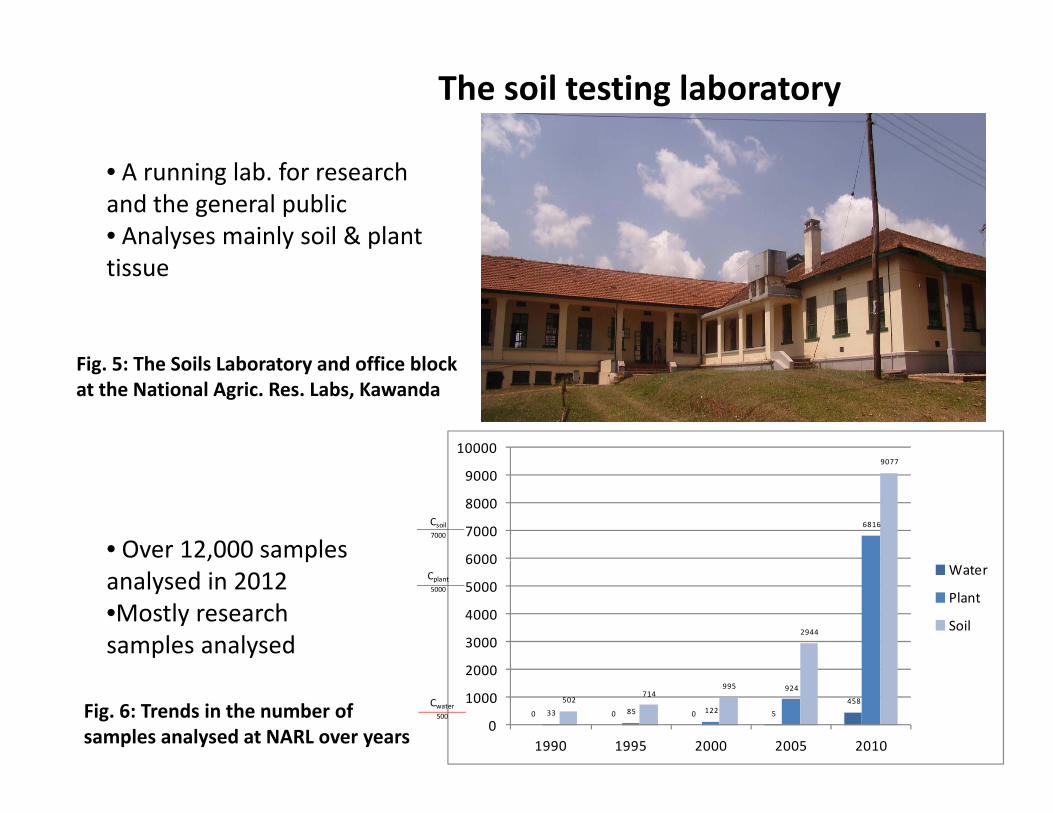
The soil testing laboratory
• A running lab. for research and the general public• Analyses mainly soil & plant tissue
Fig. 5: The Soils Laboratory and office block at the National Agric. Res. Labs, Kawanda
10000
6816
9077
6000
7000
8000
9000
Csoil7000
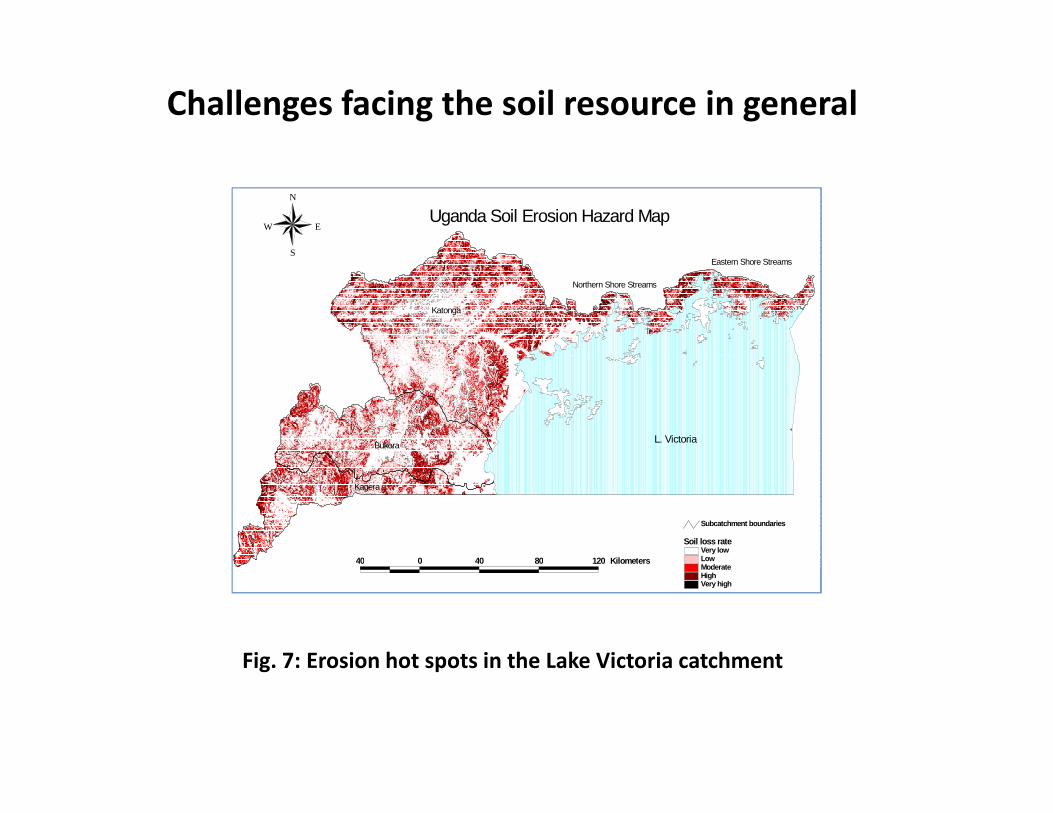
• Over 12,000 samples
2944
3000
4000
5000
6000Water
Plant
Soil
Cplant5000
, panalysed in 2012 •Mostly research samples analysed
0 0 0 5
458
33 85 122
924
502714
995
0
1000
2000
1990 1995 2000 2005 2010
Cwater500Fig. 6: Trends in the number of
samples analysed at NARL over years
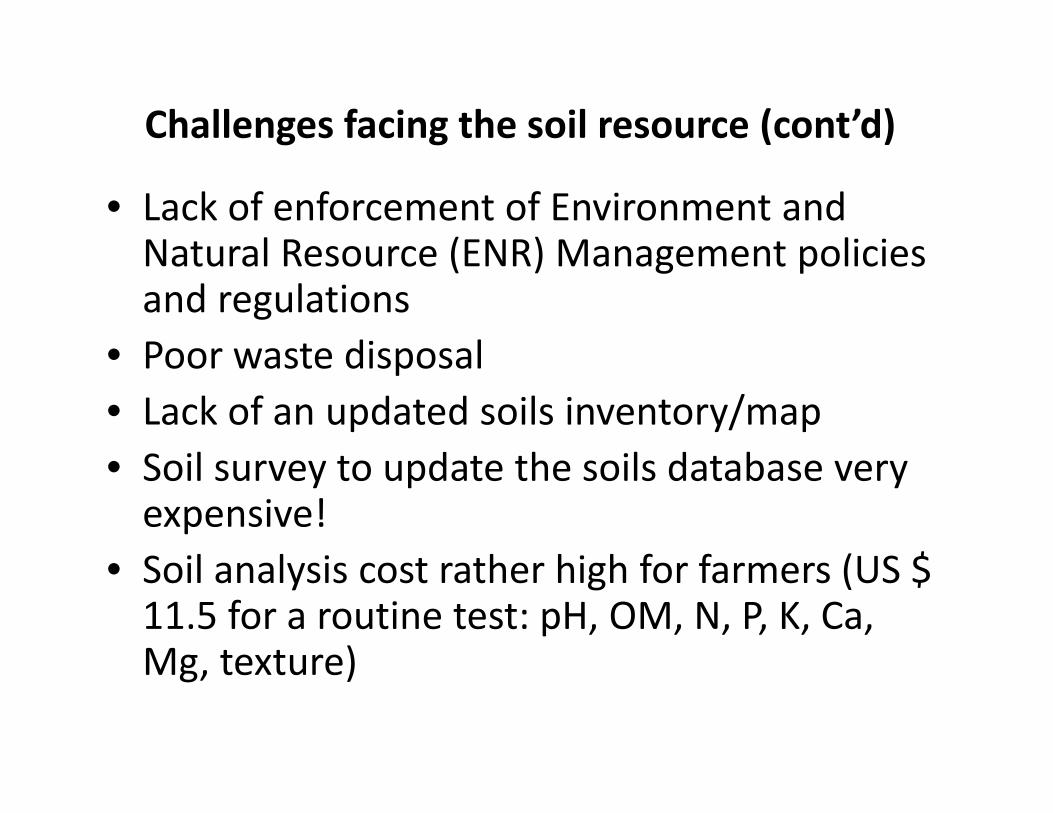
Challenges facing the soil resource in general
Uganda Soil Erosion Hazard MapN
EW
S
Northern Shore Streams
Eastern Shore Streams
Katonga
S
L. VictoriaBukora
Kagera
Very lowLow
Subcatchment boundaries
Soil loss rate
40 0 40 80 120 Kilometers LowModerateHighVery high
40 0 40 80 120 Kilometers
Fig 7: Erosion hot spots in the Lake Victoria catchmentFig. 7: Erosion hot spots in the Lake Victoria catchment

Challenges facing the soil resource in general
• Land degradation (soil erosion esp. in hilly and mountainous areas, deforestation, soil fertility , , ydecline, …)
• Inadequate knowledge on proper soil/land use tipractices
• Poor land management practices leading to unsustainable useunsustainable use
• Population pressure leading to continuous cultivation
• Inability of smallholder farmers to invest in sustainable land management practices (e.g. very low fertiliser use)low fertiliser use)
Challenges facing the soil resource (cont’d)
• Lack of enforcement of Environment and Natural Resource (ENR) Management policiesNatural Resource (ENR) Management policies and regulations
• Poor waste disposal• Poor waste disposal• Lack of an updated soils inventory/mapS il t d t th il d t b• Soil survey to update the soils database very expensive!S il l i t th hi h f f (US $• Soil analysis cost rather high for farmers (US $ 11.5 for a routine test: pH, OM, N, P, K, Ca, Mg texture)Mg, texture)

Current efforts to address soil h llmanagement challenges
• Generating and promoting ISFM interventions• Generating and promoting ISFM interventions (SLM, CA, linking ISFM to profitable enterprises, etc.)enterprises, etc.)
• Multi‐institutional/stakeholder collaborative projectsprojects
• Updating fertiliser recommendations for major cropsmajor crops
• Updating the soils information to meet requirementsrequirements

Current efforts to address soil h ll ( ’d)management challenges (cont’d)
bl h f• Public‐private partnerships in information dissemination
idi il i i f d• Providing soil testing service to farmers and private sectorP li i i ( d l i• Policy interventions (e.g. developing a fertiliser strategy, govt support to fertiliser use through NAADS)through NAADS)
• A number of projects by development partnerspartners
Needs and priorities for sustainable soil management
• Promote sustainable land/soil management– Sensitise grassroot communities on sustainable land managementInnovative ways of disseminating soil management– Innovative ways of disseminating soil management information
• Improve information management andImprove information management and dissemination systems
• Improved networking and information/data p g /sharing among institutions/departments
Needs and priorities for sustainable soil management (cont’d)(cont d)
• Increased support to soils research• Increased support to soils research
• Soils inventory update / soil survey and land se planninguse planning
• Policy intervention (e.g. enforcement of ENR policies and legislation, formulate a land use policy, increase budgetary support to
)agriculture and ENR programs)