
Kurt Thome - Radiometric Calibration of IKONOS using Ground ...
Overview of the Radiometric Calibration of MOBY
Dennis K. Clarka, Michael E. Feinholz', Mark A. Yarbroughb, B. Carol JOhIISOflC, Steven W. Browne,Yong Sung Kim', and Robert A. Barnese
aNational Environmental Satellite, Data, and Information Service, National Oceanic and AtmosphericAdministration, Washington, DC 20233, USA
bSan Jose State University, Moss Landing Marine Laboratories, Moss Landing, CA 95039,USAcNational Institute of Standards and Technology, Gaithersburg, MD 20899, USA
dData Systems and Technology, Inc., Rockville, MD 20850, USAeScience Applications International Corporation, Beltsville, MD 20705, USA
ABSTRACT
The Marine Optical Buoy (MOBY) provides values of water-leaving radiance for the calibration and validation of satelliteocean color instruments. Located in clear, deep ocean waters near the Hawaiian Island ofLanai, MOBY measures the upwellingradiance and downwelling irradiance at three levels below the ocean surface plus the incident solar irradiance just above the sur-face. The radiance standards for MOBY are two integrating spheres with calibrations based on standards traceable to theNational Institute of Standards and Technology (NIST). For irradiance, the MOBY project uses standard lamps that are rou-tinely recalibrated at NIST. Wavelength calibrations are conducted with a series of emission lines observed from a set of lowpressure lamps. Each MOBY instrument views these standards before and after its deployment to provide system responses(calibration coefficients). During each deployment, the stability of the MOBY spectrographs and internal optics are monitoredusing three internal reference sources. In addition, the collection optics for the instrument are cleaned and checked on a monthlybasis while the buoy is deployed. Divers place lamps over the optics before and after each cleaning to monitor changes at thesystem level. As a hyperspectral instrument, MOBY uses absorption lines in the solar spectrum to monitor its wavelength sta-bility. When logistically feasible during each deployment, coincident measurements are made with the predecessor buoy beforethat buoy's recovery. Measurements of the underwater light fields from the deployment vessel are also compared with thosefrom the buoy. Based on this set of absolute calibrations and the suite of stability reference measurements, a calibration historyis created for each buoy. These calibration histories link the measurement time series from the set of MOBY buoys. In general,the differences between the pre- and post-deployment radiance calibrations of the buoys range from +1% to -6% with a defmi-tive bias to a negative difference for the post-deployment values. This trend is to be expected after a deployment of 3 months.To date, only the pre-deployment calibration measurements have been used to adjust the system responses for the MOBY timeseries. Based on these results, the estimated radiometric uncertainty for MOBY in-water ocean color measurements is estimatedto be about 4% to 8% (k=1). As part of a collaboration with NIST, annual radiometric comparisons are made at the MOBYcalibration facility. NIST personnel use transfer radiometers and integrating spheres to validate (verify) the accuracy of theMOBY calibration sources. Recently, we began a study of the stray light contribution to the radiometric uncertainty in theMOBY systems. A complete reprocessing of the MOBY data set, including the changes within each MOBY deployment, willcommence upon the completion of the stray light characterization, which is scheduled for the fall of 2001. It is anticipated thatthis reprocessing will reduce the overall radiometric uncertainty to less than 5%(k=1).
Keywords: MOBY, Marine Optical Buoy, ocean color, calibration
For further author information:D.K.C. email: dermis.k.clarknoaa.gov; telephone: 301-763-8102; facsimile: 301-763-8020
Earth Observing Systems VI, William L. Barnes, Editor,Proceedings of SPIE Vol. 4483 (2002) © 2002 SPIE · 0277-786X/02/$15.0064
Downloaded From: http://proceedings.spiedigitallibrary.org/ on 01/31/2013 Terms of Use: http://spiedl.org/terms
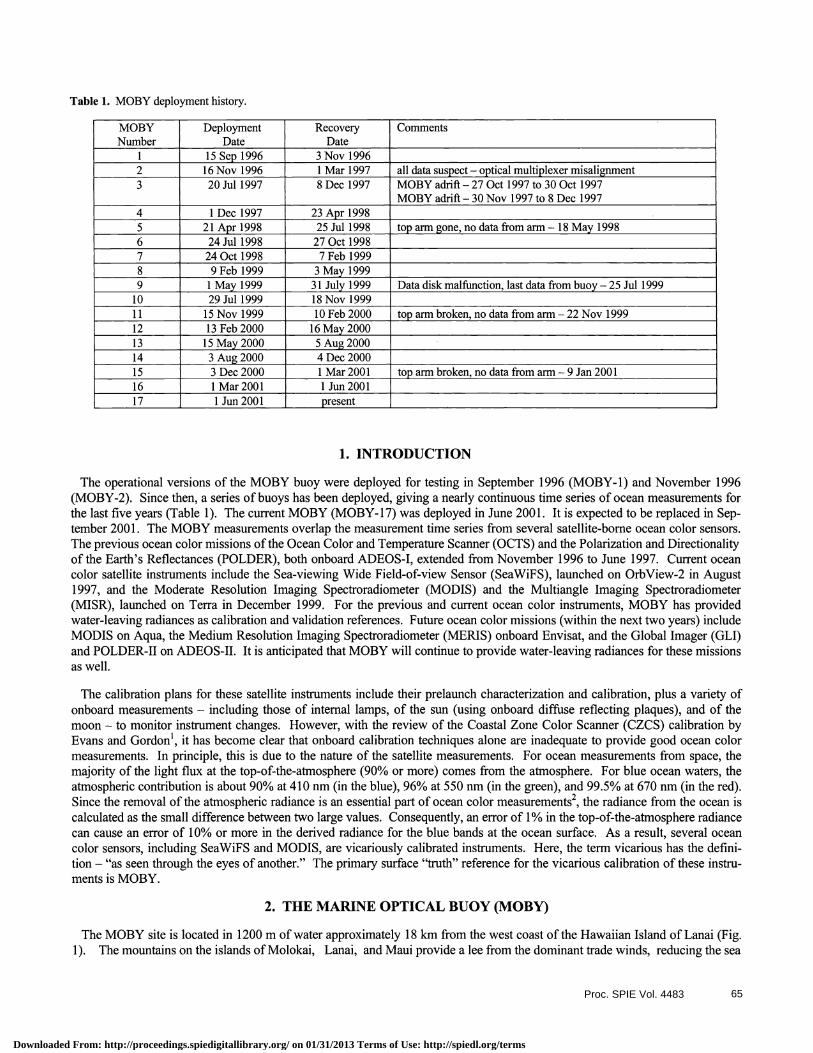
Table 1. MOBY deployment history.
MOBYNumber
DeploymentDate
RecoveryDate
Comments
1 15 Sep 1996 3 Nov 1996
2 16 Nov 1996 1 Mar 1997 all data suspect — optical multiplexer misalignment3 20 Jul 1997 8 Dec 1997 MOBY adrift — 27Oct 1997 to 30 Oct 1997
MOBY adrift — 30Nov 1997 to 8 Dec 19974 1 Dec 1997 23 Apr 19985 21 Apr 1998 25 Jul 1998 top arm gone, no data from arm — 18May 19986 24 Jul 1998 27 Oct 1998
7 24 Oct 1998 7 Feb 1999
8 9 Feb 1999 3 May 19999 1 May 1999 3 1 July 1999 Data disk malfunction, last data from buoy — 25 Jul 199910 29 Jul 1999 18 Nov 1999
1 1 15 Nov 1999 10 Feb 2000 top arm broken,no data from arm—22 Nov 199912 l3Feb2000 l6May200013 1 5 May 2000 5 Aug200014 3 Aug 2000 4 Dec 2000
15 3 Dec 2000 1 Mar 2001 top arm broken, no data from arm — 9 Jan 200116 1 Mar 2001 1 Jun 2001
17 1 Jun 2001 present
1. INTRODUCTION
The operational versions of the MOBY buoy were deployed for testing in September 1996 (MOBY-l) and November 1996(MOBY-2). Since then, a series of buoys has been deployed, giving a nearly continuous time series of ocean measurements forthe last five years (Table 1). The current MOBY (MOBY-1 7) was deployed in June 2001 . It is expected to be replaced in Sep-tember 2001 . The MOBY measurements overlap the measurement time series from several satellite-borne ocean color sensors.The previous ocean color missions ofthe Ocean Color and Temperature Scanner (OCTS) and the Polarization and Directionalityof the Earth's Reflectances (POLDER), both onboard ADEOS-I, extended from November 1996 to June 1997. Current oceancolor satellite instruments include the Sea-viewing Wide Field-of-view Sensor (SeaWiFS), launched on OrbView-2 in August1997, and the Moderate Resolution Imaging Spectroradiometer (MODIS) and the Multiangle Imaging Spectroradiometer(MISR), launched on Terra in December 1999. For the previous and current ocean color instruments, MOBY has providedwater-leaving radiances as calibration and validation references. Future ocean color missions (within the next two years) includeMODIS on Aqua, the Medium Resolution Imaging Spectroradiometer (MERIS) onboard Envisat, and the Global Imager (GLI)and POLDER-Il on ADEOS-Il. It is anticipated that MOBY will continue to provide water-leaving radiances for these missionsas well.
The calibration plans for these satellite instruments include their prelaunch characterization and calibration, plus a variety ofonboard measurements — including those of internal lamps, of the sun (using onboard diffuse reflecting plaques), and of themoon — to monitor instrument changes. However, with the review of the Coastal Zone Color Scanner (CZCS) calibration byEvans and Gordon', it has become clear that onboard calibration techniques alone are inadequate to provide good ocean colormeasurements. In principle, this is due to the nature of the satellite measurements. For ocean measurements from space, themajority of the light flux at the top-of-the-atmosphere (90% or more) comes from the atmosphere. For blue ocean waters, theatmospheric contribution is about 90% at 410 nm (in the blue), 96% at 550 urn (in the green), and 99.5% at 670 urn (in thered).Since the removal of the atmospheric radiance is an essential part of ocean color measurements2, the radiance from the ocean iscalculated as the small difference between two large values. Consequently, an error of 1% in the top-of-the-atmosphere radiancecan cause an error of 10% or more in the derived radiance for the blue bands at the ocean surface. As a result, several oceancolor sensors, including SeaWiFS and MODIS, are vicariously calibrated instruments. Here, the term vicarious has the defini-tion — "as seen through the eyes of another." The primary surface "truth" reference for the vicarious calibration of these instru-ments is MOBY.
2. THE MARINE OPTICAL BUOY (MOBY)
The MOBY site is located in 1200 m of water approximately 18 km from the west coast of the Hawaiian Island of Lanai (Fig.1). The mountains on the islands ofMolokai, Lanai, and Maui provide a lee from the dominant trade winds, reducing the sea
Proc. SPIE Vol. 4483 65
Downloaded From: http://proceedings.spiedigitallibrary.org/ on 01/31/2013 Terms of Use: http://spiedl.org/terms

158W 157W 156W 155W
OahuCIMEL Site
Molokai
Ste LE:::t::7
McM3Y?rc(tMIl
Hawaii
22t
Hawaiian Islands]
Figure 1. Chart ofthe MOBY site. The site is in the lee ofthe islands ofLanai, Maui, and Molokai.
swell and cloud cover at the site. The MOBY operations site is located in Honolulu, on the south shore ofthe island of Oahu, atthe University ofHawaii's Marine Center on pier 45. The MOBY project also operates Cimel* sn photometers for the AerosolRobotic Network (AERONET) Project on the southwest shore of Lanai and on the eastern shore of Oahu to provide auxiliaryatmospheric measurements. Finally, there are cellular telephone relay sites on Lanai, Maui, and Molokai to provide communi-cations between the buoy and the operation site.
MOBY is a wave-rider buoy tethered to a slack-line moored buoy to prevent drifting. This arrangement keeps MOBY oH-ented as a vertical column extending from the ocean surface to a depth of 12 m at the buoy's base (Fig. 2). The surface floatforthe buoy is 1.7 m in diameter with four 40 W solar panels mounted to the antenna support column. The float houses the control-ling computers, data storage, electronics, cellular modem, global positioning system receiver, and computer battery. The MarineOptical System (MOS) is located in the instrument bay at the base of the buoy, along with four 200 A/h marine batteries. Theupwelling radiances (La's) and downwelling irradiances (Ed's) within the ocean are measured by remote collectors positioned onarms away from the buoy's central cohimn. The arms can be positioned along the column at varying depths, typically 1.5 m,5 m, and 9 m. The incident solar irradiance (E5) is measured at the top ofthe surface float The remote collectors are connectedto I mm, ultraviolet-transmitting, silica fiber-optic cables that are terminated at a fiber-optic rotary selector (multiplexer). Thisoptical multiplexer is mounted on one of the entrance windows ofthe MOS spectrograph, and light is transmitted into the MOSoptical train, through the spectrographs, and then onto the thermoelectrically cooled detectors. The optical and ancillary datafrom MOS are relayed to the surface computer and stored on disk for access via a cellular telephone link.
3, WATER-LEAVING RADIANCE AT NADIR
MOBY makes measurements at three depths near the ocean surface. The shallowest measurements (at 1.5 m) are propagatedupward to just below the ocean surface by calculating the upwelled spectral radiance coefficient KL(X) using
K (A)— ln1" E2(A) I (I)L\ 2_1 [ E,(A) L(z2,A)jwhere X is the wavelength and z1 and z2 are the two shallowest depths at which measurements are made (z1<z2). The solar irra-diances E5" and E5a are the averages of the E3 measurements before and after the in-water L measurements to remove the ef-fects of solar irradiance changes from those measurements3. The convention for this calculation is that the depth at the surface iszero and that the values ofz increase with depth. Then the radiance change between depth z1 and the surface is calculated using
La (0, 2) = L (z1 , A)exp{KL (A);]. (2)
*Cet.fin commercial equipment, instruments, or materials are identified in this paper to foster understanding. Such identifica-tion does not imply recommendation or endorsement by the National Institute of Standards and Tecbnology, nor does itimply that the materials or equipment identified are necessarily the best available for the purpose.
Proc. SPIE Vol. 448366
Downloaded From: http://proceedings.spiedigitallibrary.org/ on 01/31/2013 Terms of Use: http://spiedl.org/terms
Marine Optical Buoy— Es Collector
a GPS,RPF,.— Cellular.Strobe
L — SolarPanels 4 x 40 W
Mooring MOBY Surface Float:Tether ir ._-.------ * TT7 Control Unit
\4 * Cellular Transceiver
3nil)epth I ns
Fiber Optic Cable Pass
Fiberglass Mast
Ed CollectorDepthSns
Lu Collector
2 In—atDepth 9 in
Collector Standoff
—___________ Instrument Bay:_s MOS System— a Power JunctionDepth 12 m C Batteries
Figure 2. Schematic ofthe Marine Optical Buoy (MOBY).
The propagation of the upwelling radiance through the ocean surface, that is, the calculation of the water-leaving radiance, isaccomplished using
L(O,A) = -?-L5(O,2), (3)
where L(O,2) is the water-leaving radiance, n is the index of refraction of water, and TF is the Fresnel transmittance of the air-sea interface3. The time-averaged value ofTF for the ocean surface, as a function ofwind speed at the surface, has been given byAustin4. These calculations assume the transmission of light along a vertical path through the ocean and the ocean surface, pro-viding the spectral radiance for a nadir-viewing instrument immediately above the ocean surface. In practice, these calculationsare complicated by the angular dependence of the upwelling radiance, the water-leaving radiance, and the Fresnel transmittance,given in terms of the polar and azimuthal angles in polar coordinates3. Finally, for comparisons with satellite-borne ocean colorinstruments, the high-resolution water-leaving radiance spectra from MOBY are convolved with the spectral responses of thesatellite bands to form band-averaged spectral radiances5.
For MOBY measurements, the propagation of light to the surface is made from the topmost arm of the buoy (z1=l.5 m).However, as shown in Table 1 , there are periods when the topmost arm is either broken or missing. For these periods, the centerarm (z1=5 m) is used in its place.
4. THE MARINE OPTICAL SYSTEM (MOS)
There are four Marine Optical Systems in the MOBY program —one in the deployed buoy, one in the buoy undergoing refur-bishment, one in the Profiler, and one as a spare. The Profiler is a shipboard version that provides observations of the apparentoptical properties ofthe ocean (La's and Ed's) during MOBY deployment cruises and during other validation cruises for satellite
Proc. SPIE Vol. 4483 67
Downloaded From: http://proceedings.spiedigitallibrary.org/ on 01/31/2013 Terms of Use: http://spiedl.org/terms
Marine Optical System - Dual Spectrographs
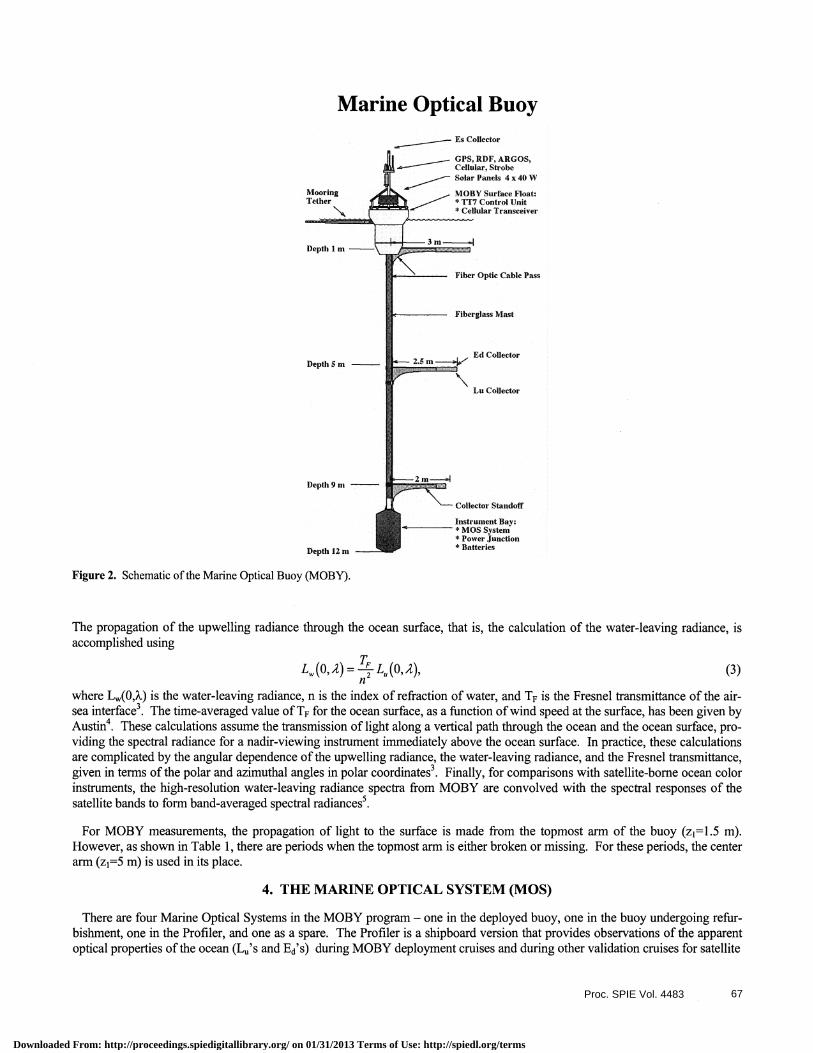
Figure 3. Schematic ofthe optical train ofthe Marine Optical System (MOS). Light from the radiance and irradiance collectors enter thespectrograph through the four position mirror. On command, the mirror allows light from the calibration sources to enter MOS — orallowsthe instrument to view a dark target to set the zero offset. The blue spectrograph measures from 340 nm to 640 nm using a 512x512 CCDarray. The red spectrograph measures from 550 nm to 955 nm, also with a 512x512 array.
ocean color instruments. The schematic for the Profiler and its Marine Optical System (MOS) is shown in Fig. 3. It includesone Ed collector and one L collector. The MOS system contains two spectrographs, one to measure light in the near ultravioletand visible from 340 nm to 640 nm (the blue spectrograph), and one to measure light in the red and near infrared from 550 nmto955 nm (the red spectrograph).
The basic optical design for the collection optics allows the measurement of the input radiance at a small angular field of viewthrough an ultraviolet-transmitting silica viewing window. In order to measure irradiance, a cosine collector is attached over theviewing port, allowing the diffuse light exiting the back side of the cosine collector to be measured, as illustrated in Fig. 3. Thisallows the MOS spectrographs to handle light from the two types of collectors in the same manner. For the MOBY buoy, a setof collection optics for E, Ed, and L (see Fig. 2) was designed to be coupled through multi-mode fiber optic cables. Light fromeach of these collectors on the buoy is relayed to the MOS spectrographs through an optical multiplexer which physicallyreplaces the irradiance collector that is illustrated in Fig. 3. Operating under computer control, up to 10 multiplexer ports can beselected. Also under computer control, a four position mirror within MOS allows, on command, light from the windows, multi-plexer, or from the calibration sources to impinge on the detectors. A dark target position is available to set the zero offset; how-ever, in the operational versions, this function is accomplished with shutters. In addition, the depolarizer optic is not used in theconfiguration for the MOBY systems.
In consideration of the large range of values present in the spectral composition of water, due to its absorption properties, adichroic mirror was designed for MOS to reduce the potential for stray light contamination of the observations. This dichroicmirror (see Fig. 3) spectrally separates the input radiance, reflecting the blue and green portion into the blue spectrograph andtransmitting the red and near infrared portion into the red spectrograph. For the dichroic, the reflectance is nearly 100% forwavelengths from 400 nm to 600 nm, and the transmittance averages 90% for wavelengths between 700 nm and 1000 nm.There is a transition in the wavelength region between 600 nm and 700 nm. In this region, the reflectance of the dichroicdecreases with wavelength and the transmittance increases with wavelength. This transition can be seen in the radiance respon-sivity curves for the two spectrographs in Fig. 4. The responsivities are given as the outputs of each channel of the spectrograph(with units of counts per second) per unit radiance (with units of tW cm2 sr1 nm1). These are nominal responsivity spectra forthe spectrographs taken from one of the pre-deployment calibrations at the MOBY operations facility. Actual responsivities
tdtLnp
ReferenceCalibration o o Sources
Dark Blie /EdPosition LED // LEDH Mirror
(Four Position)
Proc. SPIE Vol. 448368
Downloaded From: http://proceedings.spiedigitallibrary.org/ on 01/31/2013 Terms of Use: http://spiedl.org/terms

E 5000U)
c' 4000
'T0 3000a)U)
I 2000
I300 400 500 600 700 800 900 1000
Wavelength (nm)
Figure 4. Radiance responsivities ofthe blue and red spectrographs in the MOS. The responsivities are given as the instrument output (incounts per second) per unit of input radiance.
vary from spectrograph to spectrograph and from calibration to calibration. However, Fig. 4 does show the general shapes of theradiance responsivities of the two spectrographs with wavelength. The reflectance and transmittance properties of the dichroicdominate these shapes, although other factors, such as the wavelength dependence of the quantum efficiency of the detectorarray, are important.
The spectrographs for MOS are based on the Offner design and reconfigured with original holographic convex diffractiongratings by American Holographic, Inc.* The CCD arrays in the spectrographs are thermoelectrically cooled to —38°Cto stabi-lize the MOS outputs and to improve the signal-to-noise ratios in the measurements.
For the blue spectrograph, a holographic grating, operating in first order, separates the input light into its spectral components,and a two-dimensional CCD array collects this spectrum in 512 channels at wavelengths from 340 nm to 640 urn. For the redspectrograph, the array collects the spectrum in 512 channels for wavelengths from 550nm to 955 nm. In addition, the opticalpath for the red spectrograph contains a long pass filter that blocks light at wavelengths shorter than about 600 nm. Along withthe dichroic, this filter ensures that there is no second order diffracted light from the grating for wavelengths in the blue andgreen to contaminate the red spectrograph's measurements in the red and near infrared.
For the red spectrograph, the input radiance to the grating is small for wavelengths below 650nm, since the transmittance ofthe dichroic is low. This leads to a significant contamination of the measurements at these wavelengths by light scatteredthrough the spectrograph from longer wavelengths. When referring to filter radiometers, this scattered light is also called spec-tral out-of-band. The effect derives primarily from the diffraction characteristics ofthe spectrograph's single grating. Similar tothe reflectance properties of a surface, light diffracted by the grating can be separated into three components: a specular compo-nent, a haze component, and a diffuse component. The proper separation of light by the spectrograph relies on the specularcomponent only. The haze and diffuse components are stray light. A nominal function demonstrating the response ofthe MOSbench unit red spectrograph to monochromatic light at 747 6 is shown in Fig. 5. The sharp central peak in the figure showsthe specular component of the light diffracted from the grating. From about 650 nm to 850 nm, there is the presence of a hazefrom forward scattered light at angles near the scattering angle. This haze decreases with angle away from the diffraction direc-tion, and the detectors near the peak —with angles near the scattering angle — receive more of the haze component. At all angles,there is a background of diffusely scattered light from the grating that is nearly constant with angle —contaminating all detectorsequally. The response function is the combined sum of the three components. For the blue spectrograph, the response functionhas a similar shape. The effect of stray light can be reduced using an instrument with two gratings or with a grating combinedwith a prism.
In operation, the MOS spectrographs do not view monochromatic light. For each channel, the detector receives the specularreflectance from the grating for its own wavelength, plus the haze from nearby wavelengths, plus the diffuse contribution. Fortransition regions ofthe dichroic, such as the region below 650nm in the MOS red spectrograph, the specular component of the
Proc. SPIE Vol. 4483 69
Downloaded From: http://proceedings.spiedigitallibrary.org/ on 01/31/2013 Terms of Use: http://spiedl.org/terms

100
a) -1U) IV00U) -2IV
U)N ioE0z io'
Nominal Response Function
io500 600 700 800 900 1000
Wavelength (nm)
Figure 5. A response function for the MOS bench unit red spectrograph. The figure shows the response to monochromatic light with a wave-length near 745 nm. The sharp central peak shows the specular reflectance from the grating at the grating's scattering angle for the inputlight. For the region with wavelengths within about 100 nm of the central peak, there is a haze of imperfectly reflected light at approxi-mately the same scattering angle as the specular reflectance, a haze that decreases with distance away from the scattering angle. For allwavelengths, there is a background ofnearly constant diffuse scattered light from the grating. The slit scattering function is the sum of thecontributions from these three sources. The response functions for the MOS blue spectrograph have shapes similar to this.
EC
U)
EC.)
U)0CCa
•0CU
U)CU
C
II; Specular
S
1011.4
I .2
I .0
0.8
0.6
0.4
0.2
0.0 106300 400 500 600 700 800 900 300
)L 101E0: 10
! bI . I I I . I
400 500 600 700 800 900
Wavelength (nm) Wavelength (nm)
Figure 6. In-water measurement results from MOBY. The measurements of upwelling radiance were made on 14 February 2001 using thetopmost MOBY arm. The measurements from the blue and red spectrographs are joined at 622 nm. Measurements at wavelengths greaterthan 900 nm are not shown. Both panels show the same measurement results.a. Radiances on a linear scale.b. Radiances on a logarithmic scale.
light incident onto a channel can be very low, so that the diffuse component and the haze from longer wavelengths can contrib-ute a significant portion of the total signal. The amount of stray light contamination at a particular wavelength also depends onthe spectral distribution of the source being measured and affects both the calibration and subsequent field measurements. Thecombined error in measuring an unknown source's radiance is minimized if the field source has the same spectral shape as thecalibration source. In this case, the effect of the "excess light" nearly cancels. MOS is calibrated in the laboratory using lamp-illuminated integrating spheres where the flux peaks at wavelengths near 1000 nm. However, the MOBY buoy operates in clearocean waters where the spectral radiance peaks near 400 nm. A typical ocean measurement result is shown in Fig. 6. Here theMOS spectrographs measure the radiance from the MOBY top-arm radiance collector. Figure 6b shows that radiances beyond650 nm are small, but finite; there is still a pattern and structure to the measurement results. This is due to the excellent dynamic
Proc. SPIE Vol. 448370
Downloaded From: http://proceedings.spiedigitallibrary.org/ on 01/31/2013 Terms of Use: http://spiedl.org/terms

MOBY CALIBRATION
Pre-Deployment During Deployment Post-Deployment
Figure 7. Calibration Flowchart for MOBY Measurements.
range (up to 108) for the MOBY measurements, which results from variable CCD bin factors, variable integration times for themeasurements, and detector cooling. In this case, the spectral out-of-band contributes significantly less "excess light" to theocean measurement than to the calibration. This difference in "excess light" leads to radiance determinations from the red MOSspectrograph that are too low for wavelengths below 650nm6.
To account for stray light, the spectral responses ofthe MOS spectrographs in the MOS Profiler have been determined using aset of tunable lasers7'8. This approach enables the spectrographs' responsivities to be determined with no stray light. The laserwavelength was varied over the spectral ranges ofthe spectrographs, providing a complete set of slit scattering functions. Theseresults were used to develop a stray light correction algorithm for MOS8. Each in-water radiance requires two measurements: acalibration measurement at the MOBY operations facility and a measurement in the water. Since the light in each measurementhas its own spectral shape, each in-water radiance requires two correction factors. The correction factor for the laboratory meas-urement is fixed by the spectral shape of the integrating sphere's radiance; however, the spectral shape of the in-water measure-ments changes, depending on the chlorophyll concentration and the depth of the measurement, among other factors. The in-water measurements provide an initial spectrum for an iterative stray light correction.
Preliminary results from the NIST characterization of the MOS Profiler indicate that, in clear, blue waters, the measured valuesfor light flux in the ocean are about 5% to 6% too low at 412 nm, about 3% too low at 443 nm, and about 2% to 3% too high at555 nm, due to stray light effects in the MOS system. It must be stressed that these are preliminary results for the MOS Profiler
Proc. SPIE Vol. 4483 71
Downloaded From: http://proceedings.spiedigitallibrary.org/ on 01/31/2013 Terms of Use: http://spiedl.org/terms
and that the MOS systems in the MOBY buoys may give different results. Each MOS will require its own stray light correctionfactors, and these factors must be applied to the source spectral shape for each in-water measurement. However, the preliminaryresults presented here do provide a magnitude estimate ofthe stray light effects that must be accounted for.
5. MOBY ABSOLUTE CALIBRATION AND STABILITY TIME SERIES
To date, the MOBY time series includes 17 buoy deployments. The MOBY calibration program has three primary objectives.The first is to obtain absolute values in SI units that are directly traceable to NIST primary standards. The second is to link thecalibrations of the individual buoys. To do this, the MOS system from each buoy is calibrated before and after deploymentusing irradiance and radiance standards that are, themselves, calibrated and monitored on a routine basis. This is a system cali-bration that includes the collecting optics and fiber optic cables in the buoy. The third objective is the monitoring of changes inthe MOBY measurements during each deployment to provide a link between the calibrations performed pre- and post-deploy-ment. Several times during each deployment, divers place lamps over the radiance and irradiance collectors at the end of each ofthe buoy's arms. These measurements check the response ofthe MOBY system from end-to-end. In addition, the spectrographroutinely views internal references (a white lamp and red and blue light emitting diodes) to check for changes within the spec-trographs. These procedures are complemented by auxiliary comparison measurements, including coincident measurementsfrom ships and from temporally overlapping MOBY buoys. The latter comparison is made during the interval between thedeployment of the new buoy and the recovery of the old one. A flowchart for this process is given in Fig. 7. Once the setofmeasurements from before, during, and after the deployment is completed, a re-evaluation ofthe instrument's calibration historyis performed. A complete reprocessing of the MOBY data set will commence upon the completion of the stray light characteri-zation by NIST, which is scheduled for the fall of 2001.
5.1 INTEGRATING SPHERES AND STANDARD LAMP MONITORS (SLMs)The radiance reference sources for the MOBY Program are two commercial integrating spheres, Optronic Laboratories modelsOL420 and OL425. Both spheres are routinely calibrated by the manufacturer, after about 50 hours ofuse. Upon arrival there,each sphere is calibrated against a NIST-traceable source. Then, the sphere is relamped and refurbished as necessary. Finally,the sphere is calibrated again before it is returned to the MOBY facility in Hawaii. As a result, the program has "before andafter" calibrations of the spheres for each period of use. The OL420 sphere has been in use since 1992, well before the start ofthe MOBY time series. The 0L425 sphere has been in use since August 1997. The uncertainty ofthe calibrations ofthe spheresis estimated to be 2.5% (k=1).
The irradiance references for the MOBY Program are a set of FEL irradiance lamps9. These are NIST primary standards thatare routinely calibrated by NIST, after about 50 hours of use. The wavelength references are the emission lines from a set ofmercury, argon, and neon low pressure lamps.
In addition, the MOBY Program has contracted NIST to build and calibrate two single-channel narrow-band filter radiometers,the Standard Lamp Monitors (SLMs). The SLMs were designed as simplified versions of the SeaWiFS Transfer Radiometer(SXR), also built by NIST'°. In addition, each SLM has a transmission diffuser that can be used in place of the radiance foreoptics. This allows each SLM to monitor both radiance and irradiance sources. The short wavelength SLM (5LM412) has acenter wavelength at 41 1.8 nm and a bandwidth of 10.7 nm. The long wavelength SLM (5LM872) has a center wavelength at872.2 nm and a bandwidth of 12.3 nm. For radiance measurements, the SLMs have 5° fields of view. For irradiance measure-ments, they view the full hemisphere in front of their collection optics in the same manner as the MOBY irradiance collectors.The SLMs are temperature stabilized at 28°C. They are routinely recalibrated at NIST, and the uncertainty of their radianëe andirradiance calibrations is estimated to be 1.5% (k=1).
5.2 LONG-TERM CALIBRATION TIME SERIESThe measurements ofthe output ofthe 0L420 integrating sphere by the 5LM412 are shown in Fig. 8a. For these measurements,the sphere was operated using the lamp configuration from the manufacturer's calibration. The corresponding measurements bythe 5LM872 are shown in Fig. 8b. These panels also show the time series for the corresponding spectral radiances from thesphere. These time series extend from 23 May 1996 to the present. The sphere values in Fig. 8 are band-averages, using thespectral radiances from the sphere calibration curves and the relative spectral responses ofthe SLM channels:
LB = (4)$ RAdA
Proc. SPIE Vol. 448372
Downloaded From: http://proceedings.spiedigitallibrary.org/ on 01/31/2013 Terms of Use: http://spiedl.org/terms

E
,I- 0.060U)
E0
0.055
0L420 and SLM4I2 Radiances at 41 1 .8 nm 0L420 and SLM872 Radiances at 872.2 nm0.030
c 0.028
0.026 • •_______ ••0
E0
.: 0.024 • 0 Optronics Calibration
Q) Calibration Series 10 I - Calibration Series 2c 4% _____ Calibration Series 3:a 0.022 • -c Calibration Series 4
a .0.020
1996 1997
01
0, 0;..4,l, .E
U)
E0
a)0C
0
0.38
0.36
0.34
0.32
b0.30
1996
I
•4...• I.. •Ø
0 Optronics CalibrationCalibration Series 1
Calibration Series 2
Calibration Series 3
Calibration Series 4
. SLM872
1998 1999 2000 2001 2002 1997 1998 1999 2000 2001 2002
Date Date
Figure 8. Time series ofband averaged spectral radiances for the 0L420 sphere and the SLMs. The open circles give the manufacturer's cali-bration values and the horizontal lines give the calibration time series for the sphere. The four calibration series cover the MOBY deploy-ment history in Table 1. For calibration series 1 through 3, the horizontal line is the average of the manufacturer's calibrations occurringimmediately before and after the series. For calibration series 4 there is, as yet, no calibration after the series.a. 0L420 and SLM412 radiances at 411.8 nm.b. 0L420and SLM872 radiances at 872.2 nm.
0L425 and SLM4I 2 Radiances at 41 1 .8 nm 0L425 and SLM872 Radiances at 872.2 nm0.065 0.85
EC0.80
U)
E0
I0.75
0_Z ... g
4%
a
0 Optronics Calibration
Calibration Series I
Calibration Series 2
. SLM4I2 I0.05011111 0.70111111996 1997 1998 1999 2000 2001 2002 1996 1997 1998 1999 2000 2001 2002
0 Optronics Calibration
Calibration Series 1
Calibration Series 2
. SLM872
Date Date
Figure9. Time series ofband averaged spectral radiances for the 0L425 sphere and the SLMs. The format ofthis figure is the same as Figure8, except for the integrating sphere.a. 0L425 and SLM412 radiances at 411.8 nm.b. 0L425 and SLM872 radiances at 872.2 urn.
where LB is the band-averaged spectral radiance, L is the spectral radiance from the source at wavelength X, R, is the spectralresponse of the SLM, and and ?2 are the lower and upper wavelength limits for the integration — which are given by thewavelength range over which the SLM has a significant response. The units for the spectral radiances and the band-averagedspectral radiances are tW cm2 (1 nm1.
The horizontal lines in Fig. 8 give the sphere spectral radiances for the periods between the "before" and "after" calibrations bythe manufacturer. Since the SLMs show no significant drift in the outputs of the sphere over time, the lines between the Op-tronic calibration of the sphere are horizontal, giving the average of the "before" and "after" calibrations. This practice is the
Proc. SPIE Vol. 4483 73
Downloaded From: http://proceedings.spiedigitallibrary.org/ on 01/31/2013 Terms of Use: http://spiedl.org/terms

same for each calibration series (calibration time line), except for the current calibration series, which, as yet, has no "after" cali-bration by the manufacturer. The current series uses the "before" calibration, only —and assumes no drift in the sphere outputsince that calibration. The horizontal lines give the calculated values for the band-averaged spectral radiances that the SLMs"should" see, based on the manufacturer's calibration ofthe sphere.
Both the calibration of the sphere and the calibration of the SLMs are traceable to NIST, albeit with different paths. However,measured values by the SLMs are not the same as those calculated from the manufacturer's calibration of the sphere. On theaverage, the 0L420 values for the SLM412 average 1.2% lower than the SLM measured values. For the SLM872, the 0L420values are 4.4% higher. At 412 urn the differences between the two calibrations are well within the combined uncertainties ofthe two calibrations (0L420: 2.5%, k=1 ; SLM: 1 .5%, k=1). At 872 nm, the differences are outside of the combineduncertainties for k=1 but within the uncertainties for k=2. At present, the Optronic calibration is used to set the calibrationcoefficients for the MOS spectrographs, and the SLM measurements are used to validate (verify) the manufacturer's calibration.
A similar comparison of the radiances from the 0L425 sphere and the SLMs is shown in Fig. 9. For this sphere, the differ-ences between the calculated and measured values are less than 1%. The time series for the 0L425 starts on 31 July 1997 andcontinues into the present.
Before and after each deployment, the MOS spectrograph views the integrating spheres through the MOBY fiber optics andcollecting optics to give the system responses (see Fig. 7). In addition, several procedural approaches to incorporate the resultsfrom the NIST comparison measurements at the MOBY operations site into the MOBY calibration time series are under evalua-tion. However, the pre- and post-deployment calibrations do not provide the time dependence for the instrument changes duringthe deployment. And in general, the differences between the pre- and post-deployment calibrations of the buoys range from 1%to 6%.
5.3 CALIBRATION CHANGES DURING DEPLOYMENTSDuring each deployment, the MOS spectrographs observe three internal light sources, an incandescent lamp and two lightemitting diodes, one blue and one red. During each of its measurement cycles, they provide three time series for the changes inthe spectrograph's response. Ofcourse, from these measurements, it is not possible to separate changes in the spectrograph fromchanges in the internal light sources, themselves. However, the values for the pre- and post-deployment system responses(calibration coefficients) fix the magnitude of the system change, so the lamp measurements allow an evaluation of theuniformity of the rate of change during the deployment. Measurements of the reference sources show the MOS spectrographoutputs to be stable at the 1% level over the period of each MOBY deployment.
The change in the response of the MOBY system includes more than the change in response of the spectrograph, itself. Inparticular, the cosine bezels provide attachment surfaces for ocean animals, such as gooseneck barnacles, and as a result, theseoptics are prone to biological fouling. The radiance collectors are protected, for the most part, by anti-fouling tubes which usecopper surfaces and a slow release of bromide. Divers visit the buoy on a monthly basis to clean the collection optics and toreplace the anti-fouling devices. In addition, the divers document the condition of the buoy and its optics using underwaterphotography. Before and after each cleaning, the diver places a lamp over each collection optic to obtain a measure of thechange in the transmission efficiency ofthe optic between cleanings. This commercial, underwater lamp has been modified withthe addition of constant current circuitry to its battery pack and with the construction of lamp housings that fit over the MOBYirradiance and radiance collectors. These housings block ambient light and maintain a fixed distance between the collectors andthe lamp. Laboratory tests of the lamp systems indicate that the systems are repeatable at the 1% level so long as the batterypacks remain within one-quarter of full charge. The results of a set of pre- and post-cleaning measurements is shown in Fig. 10.An evaluation of the instrument changes from the internal references and from the external lamp measurements provides theoverall time dependence of the instrument output during each deployment. The measurements of the internal sources haveremained stable during each MOBY deployment, changing by 1% or less. For the measurements using the divers lamps,changes to the in-water time series are made when the pre- and post-cleaning measurements differ by more than 4%, which isthe estimated uncertainty for each ofthese measurements.
5.4 WAVELENGTH CHANGES DURING DEPLOYMENTSSince MOS is a hyperspectral instrument, the structure in the downwelling irradiance is present in the MOBY data set. This
line structure comes from the absorption of energy in the Sun's atmosphere (Fraunhofer lines) and in the Earth's atmosphere(oxygen A-band absorption near 762 nm). The wavelengths of these absorption features are known and provide a reference tomonitor wavelength drifts in the spectrographs. During the 17 MOBY deployments, there have been no signs of wavelengthchanges, within the wavelength resolutions ofthe spectrographs.
Proc. SPIE Vol. 448374
Downloaded From: http://proceedings.spiedigitallibrary.org/ on 01/31/2013 Terms of Use: http://spiedl.org/terms

6.O
44.00 2.0
Ic 2.0U)0 -4.0CU)U)
-6.0400 900
Wavelength (nm)
Figure 10. Pre- and Post-Cleaning Measurements ofthe MOBY Top Arm Radiance Collector on 4 October 2000. The measurement resultsare given as the are differences from the lamp measurements on the day ofthe buoy's deployment. Since the differences between the pre-and post-cleaning measurements are less than the uncertainty for a single measurement, no correction is applied to the time series based onthese measurements. The wavelengths for the measurement pairs have been separated by 3 nm for clarity.
6. CONCLUDING REMARKS
The uncertainty of the calibration radiances from the MOBY integrating spheres is estimated to be about 3% (k=1). This isbased on the regular calibrations of the spheres by the manufacturer and on routine measurements of the sphere outputs by theMOBY program's SLMs. The MOBY program also has an interagency cooperative agreement with NIST. As part of this col-laboration, NIST personnel annually visit the MOBY site to perform comparison measurements. The artifacts in these compari-sons include transfer radiometers and integrating spheres. These artifacts are calibrated at NIST before and after each set ofcomparisons. The results of these comparison campaigns show the NIST measurements to agree with the calibration values forthe MOBY integrating spheres at the 3% level or better —and the NIST measurements confirm the estimated uncertainty for theMOBY calibration standards. The focused effort to establish and maintain traceability (see Fig. 7) to SI values of radiometricquantities at a national metrology institute was a major element of achieving this result.
The uncertainty in the calibration changes during each MOBY deployment is less easily determined. Currently, only the pre-deployment calibration measurements have been used to provide the system responses for each MOBY deployment. In general,the differences between the pre- and post-deployment radiance calibrations of the buoys range from +1% to -6% with a defini-tive bias to a negative difference for the post-deployment values. This trend is to be expected after a deployment of 3 months.Based on our experience, we feel that the instrument changes during each deployment are known at the 6% level. However, thisuncertainty does not include the effects of scattered light within the MOS spectrographs. For ocean color measurements at theblue and green wavelengths, these effects can be as large as 3% to 5%. In addition, these effects can be as large as a factor oftwo in the ultraviolet for the blue spectrograph and in the red and near infrared for the red spectrograph. Recently, NIST began astudy of the stray light contribution to the radiometric uncertainty in the MOBY systems. A complete reprocessing of theMOBY data set, including the changes within each MOBY deployment, will commence upon the completion of the stray lightcharacterization, which is scheduled for the fall of 2001. It is anticipated that this reprocessing will reduce the overalluncertainties to less than 5% (k=l). Until these changes are made, the overall uncertainty for the radiometric calibration ofMOBY in-water ocean color measurements is about 4% to 8% (k=l).
ACKNOWLEDGEMENTS
The authors would like to extend their appreciation to the MOBY team members: Eric Stengel, Edwin Fisher, Edward King,Marilyn Yuen, Mike Ondrusek, (NOAA/NESDIS) -Stephanie Flora, John Heine, Darryl Peters, Teny Houlihan, William Bro-enkow, (San Jose State Univ., Moss Landing Marine Laboratories) - Charles Trees, Chris Kinkade, (San Diego State Univ.,Center for Hydro-Optics and Remote Sensing) and to the University ofHawaii's RV Mona Wave and RV Kaimikai-O-Kanaloa
500 600 700 800
Proc. SPIE Vol. 4483 75
Downloaded From: http://proceedings.spiedigitallibrary.org/ on 01/31/2013 Terms of Use: http://spiedl.org/terms
ship personnel for their professional support in the challenging tasks associate with the MOBY deployments and retrievals.Over the past 12 years this work has been supported by NASA Goddard Space Flight Center under contracts S-19864-E(EOS/MODIS Project) and S-42017-E, NAS5-31746 (SeaWiFS Project). Additional support for the NIST participation in thisproject has been provided under contracts S-41365-F (EOS Project Science Office) and S-64096-E (SeaWiFS Project).
REFERENCES
1. R. H. Evans, and H. R. Gordon, "Coastal Zone Color Scanner 'system calibration:' A retrospective examination," J. Geo-phys. Res., 99, 7293-7307, 1994.
2. H. R. Gordon, "Atmospheric correction of ocean color imagery in the Earth Observing System Era," J. Geophys. Res. ,102,17,081-17,106, 1997.
3. D. K. Clark, H. R. Gordon, K. J. Voss, Y. Ge, W. Broenkow, and C. Trees, "Validation of atmospheric correction over theoceans," .1. Geophys. Res., 102, 17,209-17,217, 1997.
4. R. W. Austin, "The remote sensing of spectral radiance from below the ocean surface," in Optical Aspects of Oceanogra-phy, N. G. Jerlov and E. S. Nielson, eds., pp. 317-344, Academic Press, New York, 1974.
5. H. R. Gordon, "Remote sensing of ocean color: A methodology for dealing with broad spectral bands and significant out-of-band response," Appl. Opt., 34, 8363-8374, 1995.
6. C. Habauzit, S. W. Brown, K. R. Lykke, B. C. Johnson, M. Feinholz, M. Yarbrough, and D. K. Clark, "Radiometric charac-terization and absolute calibration of the Marine Optical System (MOS) bench unit," in preparation for submission to J.Atmos. Oceanic Technol., 2001.
7. 5. w. Brown, G. P. Eppeldauer, and K. R. Lykke, "NIST facility for spectral irradiance and radiance response calibrationswith a uniform source," Metrologia, 37, 579-582, 2000.
8. 5. W. Brown, B. C. Johnson, K. R. Lykke, M. E. Feinholz, M. A. Yarbrough, S. E. Flora, R. A. Barnes, and D. K. Clark,"Radiometric Characterization and Calibration of the Marine Optical System," in preparation for submission to J. Atmos.Oceanic Technol., 2001.
9. J. H. Walker, R. D. Saunders, J. K. Jackson, and D. A. McSparron, Spectral irradiance calibrations, NBS Special Publica-tion 250-20, National Institute of Standards and Technology, Gaithersburg, Md., 1987.
10. B. C. Johnson, Fowler, and C. R. Cromer, The SeaWiFS transfer radiometer (SXR), NASA Tech. Memo. 1998-206892,Vol. 1, NASA Goddard Space Flight Center, Greenbelt, Md., 1998.
Proc. SPIE Vol. 448376
Downloaded From: http://proceedings.spiedigitallibrary.org/ on 01/31/2013 Terms of Use: http://spiedl.org/terms


