
OVERVIEW OF THE INDUSTRIAL ACCIDENTS CAUSED … · when natural and technological hazards collide...
110
WHEN NATURAL AND TECHNOLOGICAL HAZARDS COLLIDE OVERVIEW OF THE INDUSTRIAL ACCIDENTS CAUSED BY THE GREAT TOHOKU EARTHQUAKE AND TSUNAMI JAPAN, MARCH 11 th , 2011 FRENCH MINISTRY OF ECOLOGY, SUSTAINABLE DEVELOPMENT AND ENERGY
Transcript of OVERVIEW OF THE INDUSTRIAL ACCIDENTS CAUSED … · when natural and technological hazards collide...
WHEN NATURAL AND TECHNOLOGICAL HAZARDS COLLIDE
OVERVIEW OF THE INDUSTRIAL ACCIDENTS CAUSED BY THE GREAT TOHOKU
EARTHQUAKE AND TSUNAMI
JAPAN, MARCH 11th, 2011
FRENCH MINISTRY OF ECOLOGY, SUSTAINABLE DEVELOPMENT AND ENERGY

After arriving in Minamisōma, I met some acquaintances from the time I lived there. The first person I saw was a former colleague.
“What are you doing here?” he asked me.
« I came to see. »
kind of answer that could really rile the inhabitants of this disaster-stricken place. And yet, he said:
“Yes, you’re right. You have to see what happened.”
Ryôchi Wago - Japanese poet and author of a number of series of poems written after the disaster of March 11th , 2011
CONTENTSTHE DGPR’S POST EARTHQUAKE MISSION IN JAPAN p. 4ACKNOWLEDGEMENTS p. 5MAP OF INDUSTRIAL ACCIDENTS OCCURED ON MARCH 11th, 2011 p. 6
1. NATURAL PHENOMENA OF MARCH 11th, 2011 p. 7 1.1 A megathrust earthquake p. 8 1.2 A ‘once-in-a-millennium’ tsunami p. 9
2. NATECH RISKS p. 11
3. MAIN ACCIDENTS BY INDUSTRIAL SECTOR p. 15 3.1 Thermal power plants p. 16 3.2 Timber industry p. 20 3.3 Chemicals and petrochemicals p. 25 3.4 Oil and gas industry p. 32 3.5 Iron and steel industry p. 44 3.6 Minerals industry p. 48 3.7 Food-processing industry p. 52 3.8 Automotive industry p. 58 3.9 Electronics industry p. 62 3.10 Logistics p. 68 3.11 Water treatment p. 72 3.12 Hydraulic structures p. 76
4. POLLUTION AND WASTE MANAGEMENT p. 81 4.1 Pollution p. 82 4.2 Management of tsunami waste p. 86
5. LESSONS LEARNT p. 93
APPENDIX : p. 105 Seismic scales p. 106 Japanese regulation and NaTech risks p. 107 Glossary p. 109 Additional resources p. 109
4
THE DGPR ‘s POST EARTHQUAKE MISSION IN JAPAN
Eight months after the massive disaster that struck Japan on March 11th, 2011, France’s General Directorate for Risk Prevention (DGPR) – part of France’s Ministry of Ecology, Sustainable Development and Energy – appointed a NaTech task force to go to Japan and gather feedback in Tokyo and the Tōhoku region. Led by a group of engineers specialised in the prevention of technological risks, the task force’s objectives were to conduct field investigations at a few of the industrial sites hit hardest by the events of March 11th, 2011 and meet with the operators of these sites as well as with representatives of the Japanese authorities in order to better understand how the disaster had been managed and what difficulties were encountered.
The accidents described in this document are in part based on the information obtained by the task force. The other information and examples provided are excerpts from press releases, reports on the consequences of the earthquake and tsunami placed online by Japanese companies and blogs written by private citizens. Each example’s sources are cited in its accompanying caption. The reader is reminded that the businesses and persons mentioned in this document are the sole holders of the copyrights to the photos in this document.
The damage amounts listed in this document were obtained from the ‘loss on natural event’ or ‘extraordinary loss, earthquake and tsunami’ sections of financial reports published between June 2011 and March 2012 (the end of the 2011 financial year in Japan). These amounts include direct damage suffered by industrial facilities and, in some cases, destroyed inventories (raw materials and finished products) and production losses (unsold products, overhead, etc.). Some companies were unable to determine the damages suffered by such or such site. As a result, the costs listed for them encompass all their production sites. Amounts are given in yen (¥) and euros (€) at the average euro/yen exchange rate for 2011 (€1 = ¥100).
5
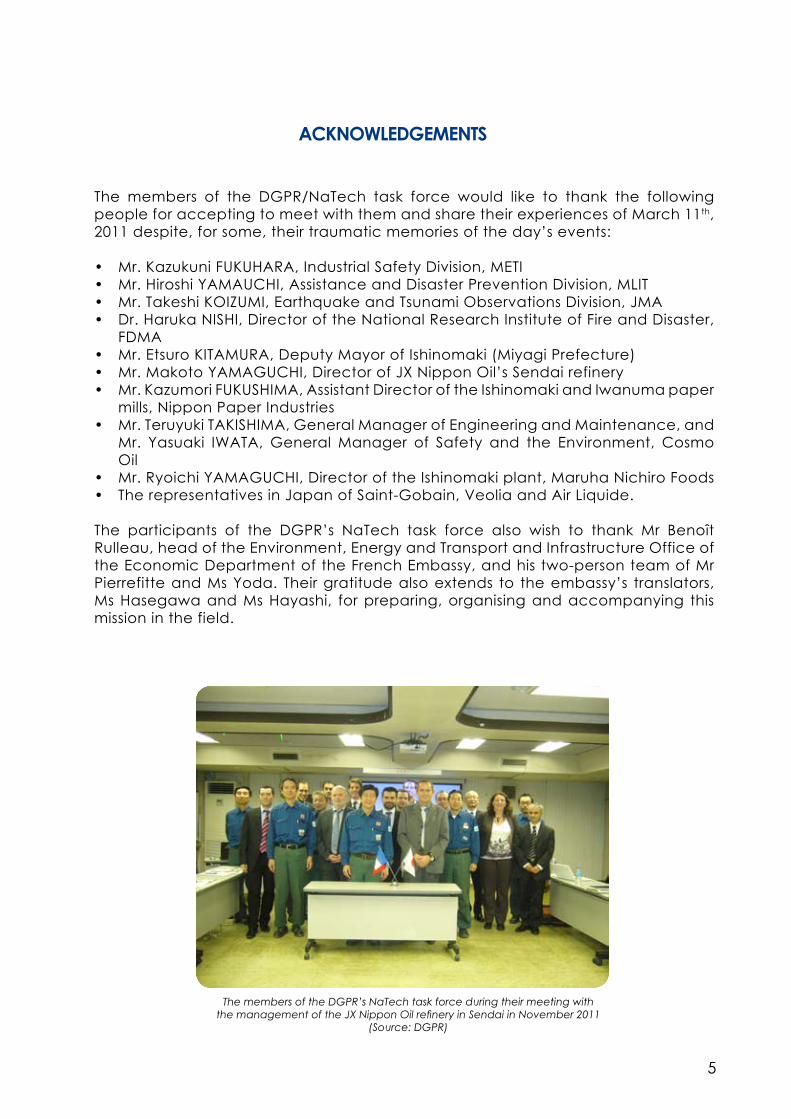
The members of the DGPR’s NaTech task force during their meeting with the management of the JX Nippon Oil refinery in Sendai in November 2011
(Source: DGPR)
The members of the DGPR/NaTech task force would like to thank the following people for accepting to meet with them and share their experiences of March 11th, 2011 despite, for some, their traumatic memories of the day’s events:
Mr. Kazukuni FUKUHARA, Industrial Safety Division, METI• Mr. Hiroshi YAMAUCHI, Assistance and Disaster Prevention Division, MLIT• Mr. Takeshi KOIZUMI, Earthquake and Tsunami Observations Division, JMA• Dr. Haruka NISHI, Director of the National Research Institute of Fire and Disaster, • FDMAMr. Etsuro KITAMURA, Deputy Mayor of Ishinomaki (Miyagi Prefecture)• Mr. Makoto YAMAGUCHI, Director of JX Nippon Oil’s Sendai refinery• Mr. Kazumori FUKUSHIMA, Assistant Director of the Ishinomaki and Iwanuma paper • mills, Nippon Paper IndustriesMr. Teruyuki TAKISHIMA, General Manager of Engineering and Maintenance, and • Mr. Yasuaki IWATA, General Manager of Safety and the Environment, Cosmo OilMr. Ryoichi YAMAGUCHI, Director of the Ishinomaki plant, Maruha Nichiro Foods• The representatives in Japan of Saint-Gobain, Veolia and Air Liquide.•
The participants of the DGPR’s NaTech task force also wish to thank Mr Benoît Rulleau, head of the Environment, Energy and Transport and Infrastructure Office of the Economic Department of the French Embassy, and his two-person team of Mr Pierrefitte and Ms Yoda. Their gratitude also extends to the embassy’s translators, Ms Hasegawa and Ms Hayashi, for preparing, organising and accompanying this mission in the field.
ACKNOWLEDGEMENTS
6
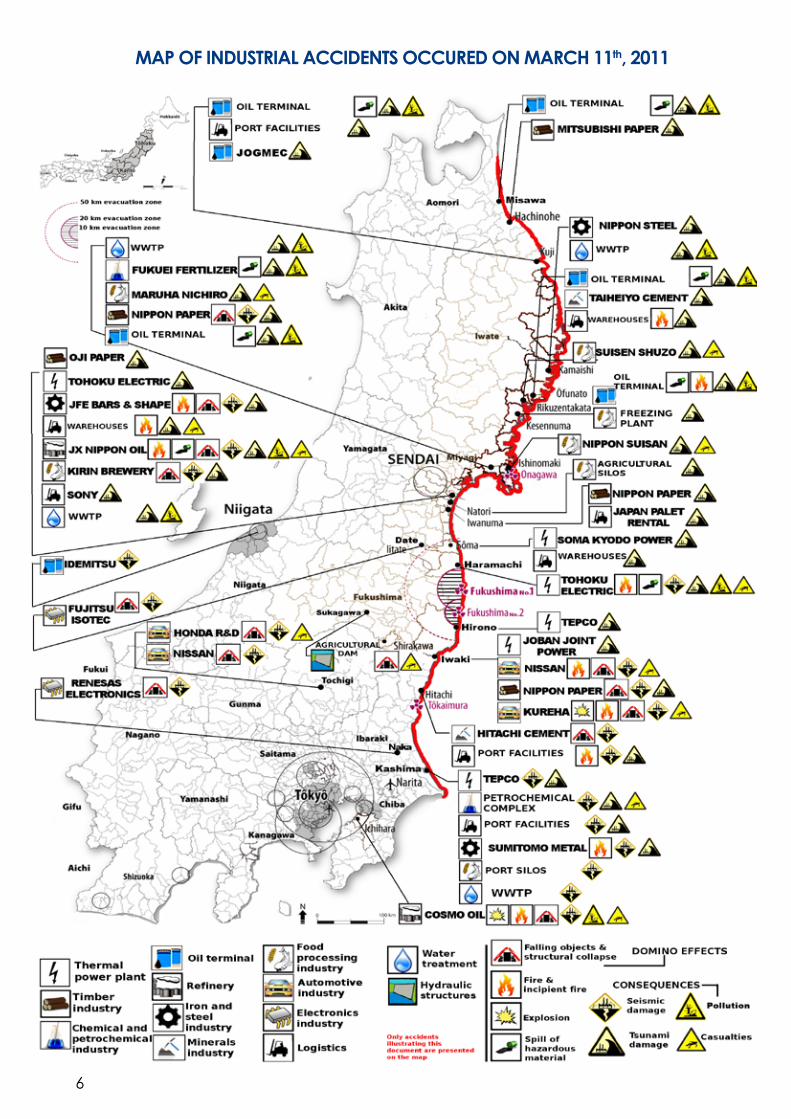
MAP OF INDUSTRIAL ACCIDENTS OCCURED ON MARCH 11th, 2011

7
CHAPTER 1
NATURAL PHENOMENA OF
MARCH 11th, 2011
8
1.1 A megathrust earthquake
1. NATURAL PHENOMENA OF MARCH 11th, 2011
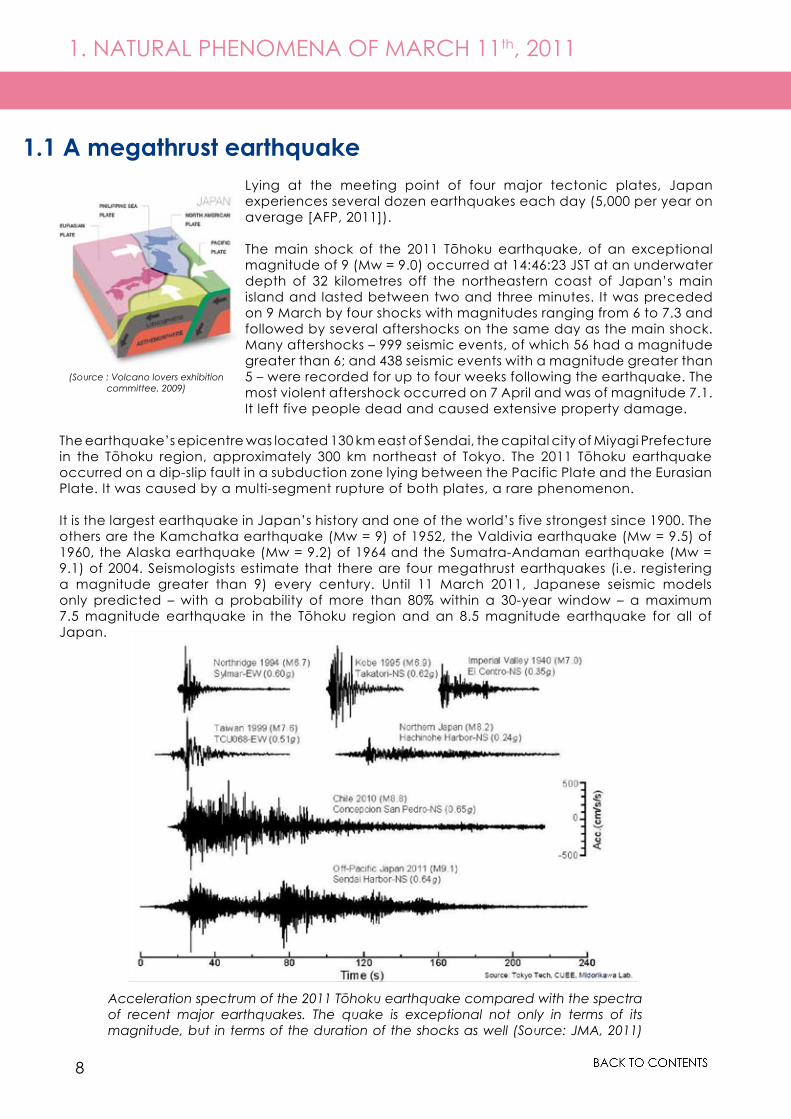
Lying at the meeting point of four major tectonic plates, Japan experiences several dozen earthquakes each day (5,000 per year on average [AFP, 2011]).
The main shock of the 2011 Tōhoku earthquake, of an exceptional magnitude of 9 (Mw = 9.0) occurred at 14:46:23 JST at an underwater depth of 32 kilometres off the northeastern coast of Japan’s main island and lasted between two and three minutes. It was preceded on 9 March by four shocks with magnitudes ranging from 6 to 7.3 and followed by several aftershocks on the same day as the main shock. Many aftershocks – 999 seismic events, of which 56 had a magnitude greater than 6; and 438 seismic events with a magnitude greater than 5 – were recorded for up to four weeks following the earthquake. The most violent aftershock occurred on 7 April and was of magnitude 7.1. It left five people dead and caused extensive property damage.
Acceleration spectrum of the 2011 Tōhoku earthquake compared with the spectra of recent major earthquakes. The quake is exceptional not only in terms of its magnitude, but in terms of the duration of the shocks as well (Source: JMA, 2011)
The earthquake’s epicentre was located 130 km east of Sendai, the capital city of Miyagi Prefecture in the Tōhoku region, approximately 300 km northeast of Tokyo. The 2011 Tōhoku earthquake occurred on a dip-slip fault in a subduction zone lying between the Pacific Plate and the Eurasian Plate. It was caused by a multi-segment rupture of both plates, a rare phenomenon.
It is the largest earthquake in Japan’s history and one of the world’s five strongest since 1900. The others are the Kamchatka earthquake (Mw = 9) of 1952, the Valdivia earthquake (Mw = 9.5) of 1960, the Alaska earthquake (Mw = 9.2) of 1964 and the Sumatra-Andaman earthquake (Mw = 9.1) of 2004. Seismologists estimate that there are four megathrust earthquakes (i.e. registering a magnitude greater than 9) every century. Until 11 March 2011, Japanese seismic models only predicted – with a probability of more than 80% within a 30-year window – a maximum 7.5 magnitude earthquake in the Tōhoku region and an 8.5 magnitude earthquake for all of Japan.
(Source : Volcano lovers exhibition committee, 2009)
9
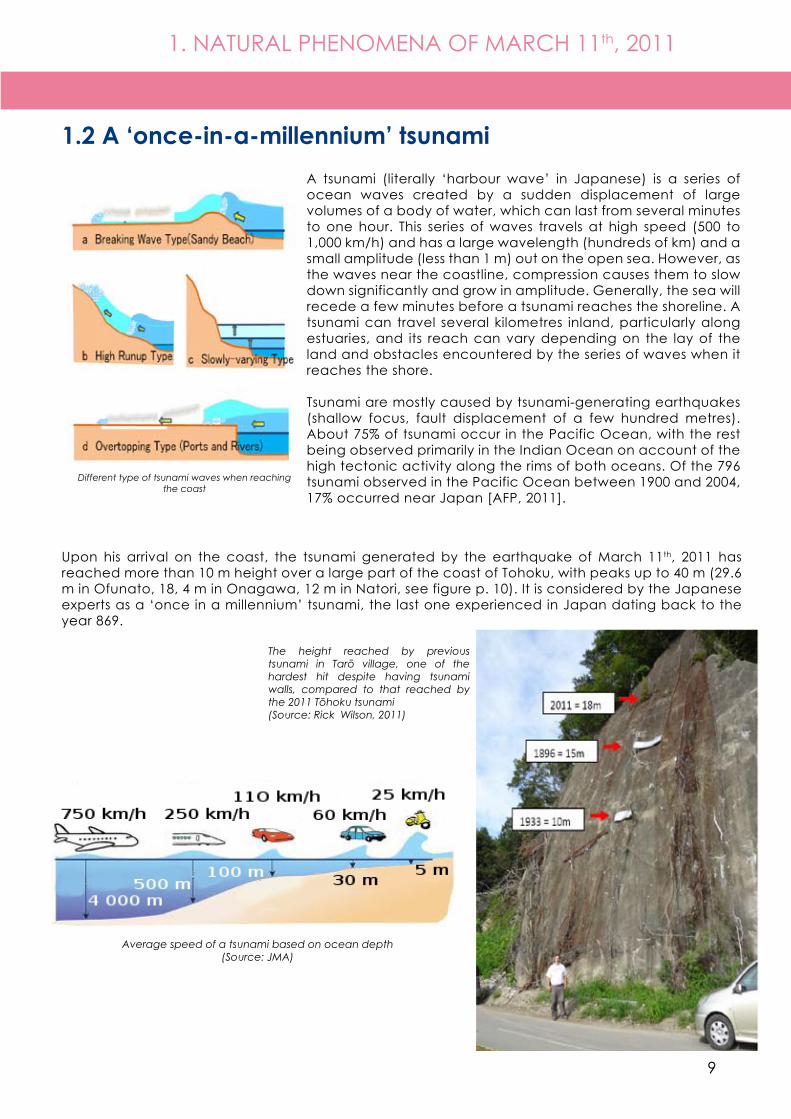
A tsunami (literally ‘harbour wave’ in Japanese) is a series of ocean waves created by a sudden displacement of large volumes of a body of water, which can last from several minutes to one hour. This series of waves travels at high speed (500 to 1,000 km/h) and has a large wavelength (hundreds of km) and a small amplitude (less than 1 m) out on the open sea. However, as the waves near the coastline, compression causes them to slow down significantly and grow in amplitude. Generally, the sea will recede a few minutes before a tsunami reaches the shoreline. A tsunami can travel several kilometres inland, particularly along estuaries, and its reach can vary depending on the lay of the land and obstacles encountered by the series of waves when it reaches the shore.
Tsunami are mostly caused by tsunami-generating earthquakes (shallow focus, fault displacement of a few hundred metres). About 75% of tsunami occur in the Pacific Ocean, with the rest being observed primarily in the Indian Ocean on account of the high tectonic activity along the rims of both oceans. Of the 796 tsunami observed in the Pacific Ocean between 1900 and 2004, 17% occurred near Japan [AFP, 2011].
Upon his arrival on the coast, the tsunami generated by the earthquake of March 11th, 2011 has reached more than 10 m height over a large part of the coast of Tohoku, with peaks up to 40 m (29.6 m in Ofunato, 18, 4 m in Onagawa, 12 m in Natori, see figure p. 10). It is considered by the Japanese experts as a ‘once in a millennium’ tsunami, the last one experienced in Japan dating back to the year 869.
1.2 A ‘once-in-a-millennium’ tsunami
1. NATURAL PHENOMENA OF MARCH 11th, 2011
The height reached by previous tsunami in Tarō village, one of the hardest hit despite having tsunami walls, compared to that reached by the 2011 Tōhoku tsunami (Source: Rick Wilson, 2011)
Average speed of a tsunami based on ocean depth (Source: JMA)
Different type of tsunami waves when reaching the coast
10
1. NATURAL PHENOMENA OF MARCH 11th, 2011
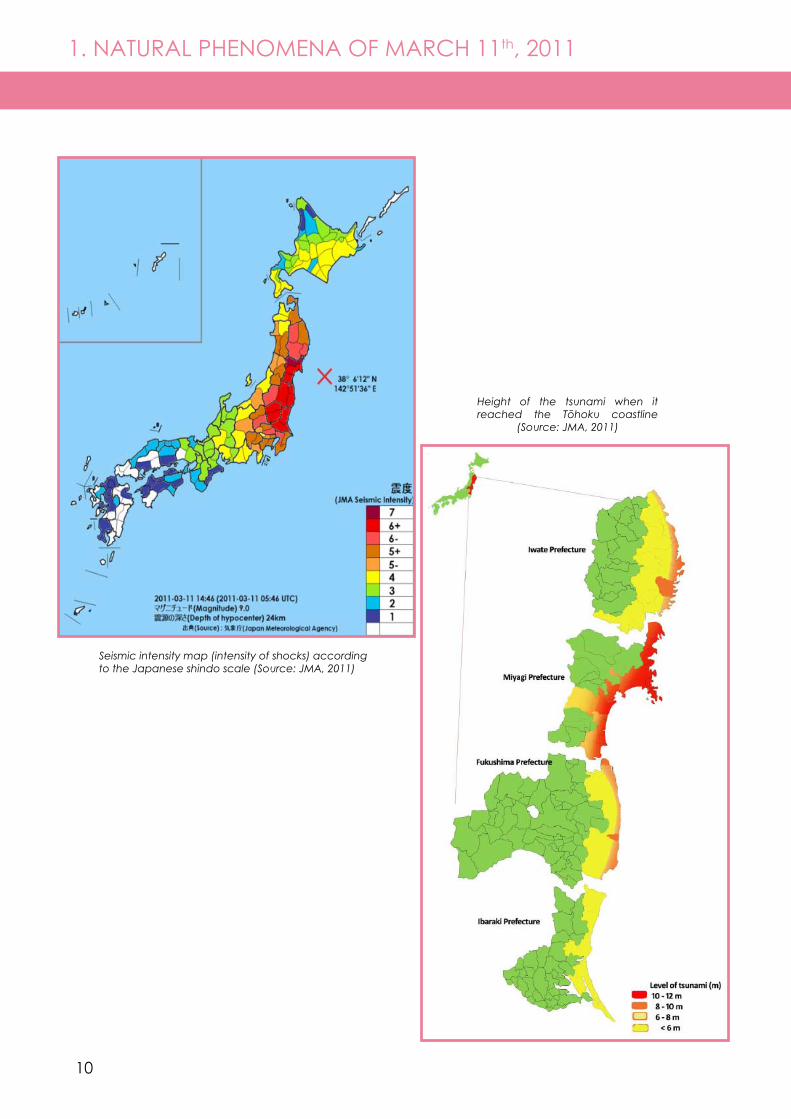
Seismic intensity map (intensity of shocks) according to the Japanese shindo scale (Source: JMA, 2011)
Height of the tsunami when it reached the Tōhoku coastline
(Source: JMA, 2011)
11
CHAPTER 2
NATECH RISKS
12
2. NATECH RISKS
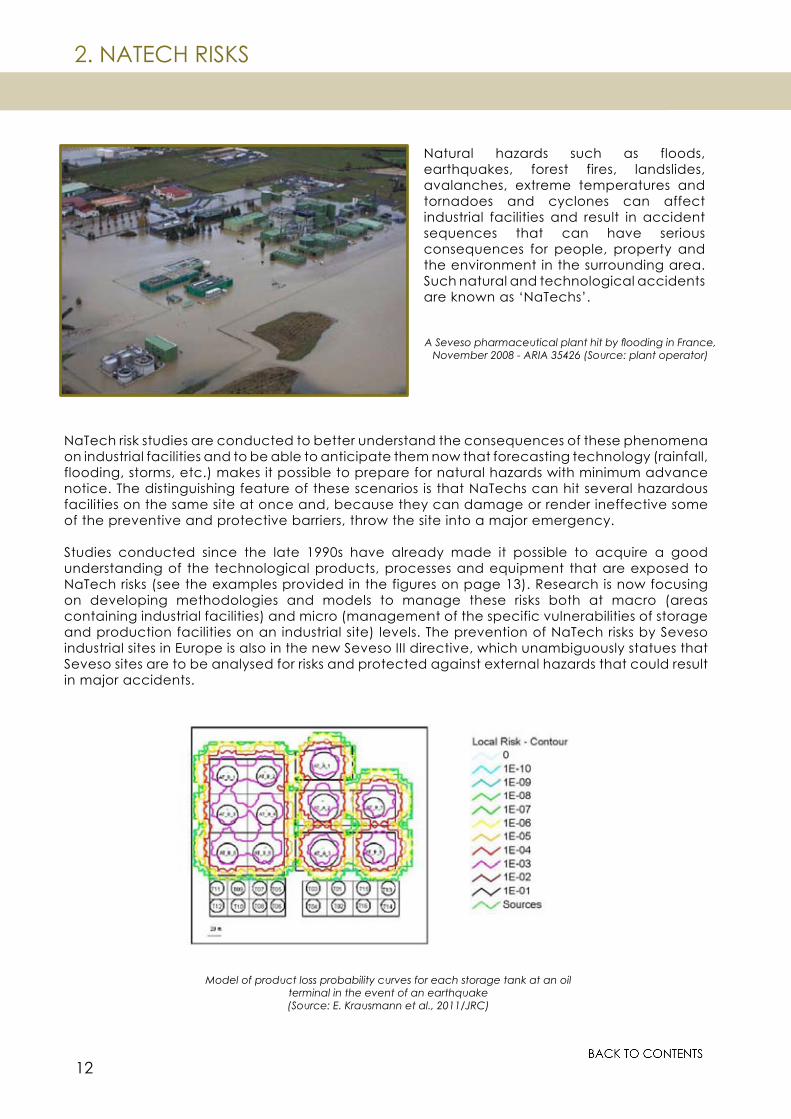
Natural hazards such as floods, earthquakes, forest fires, landslides, avalanches, extreme temperatures and tornadoes and cyclones can affect industrial facilities and result in accident sequences that can have serious consequences for people, property and the environment in the surrounding area. Such natural and technological accidents are known as ‘NaTechs’.
Model of product loss probability curves for each storage tank at an oil terminal in the event of an earthquake (Source: E. Krausmann et al., 2011/JRC)
NaTech risk studies are conducted to better understand the consequences of these phenomena on industrial facilities and to be able to anticipate them now that forecasting technology (rainfall, flooding, storms, etc.) makes it possible to prepare for natural hazards with minimum advance notice. The distinguishing feature of these scenarios is that NaTechs can hit several hazardous facilities on the same site at once and, because they can damage or render ineffective some of the preventive and protective barriers, throw the site into a major emergency.
Studies conducted since the late 1990s have already made it possible to acquire a good understanding of the technological products, processes and equipment that are exposed to NaTech risks (see the examples provided in the figures on page 13). Research is now focusing on developing methodologies and models to manage these risks both at macro (areas containing industrial facilities) and micro (management of the specific vulnerabilities of storage and production facilities on an industrial site) levels. The prevention of NaTech risks by Seveso industrial sites in Europe is also in the new Seveso III directive, which unambiguously statues that Seveso sites are to be analysed for risks and protected against external hazards that could result in major accidents.
A Seveso pharmaceutical plant hit by flooding in France, November 2008 - ARIA 35426 (Source: plant operator)
13
2. NATECH RISKS
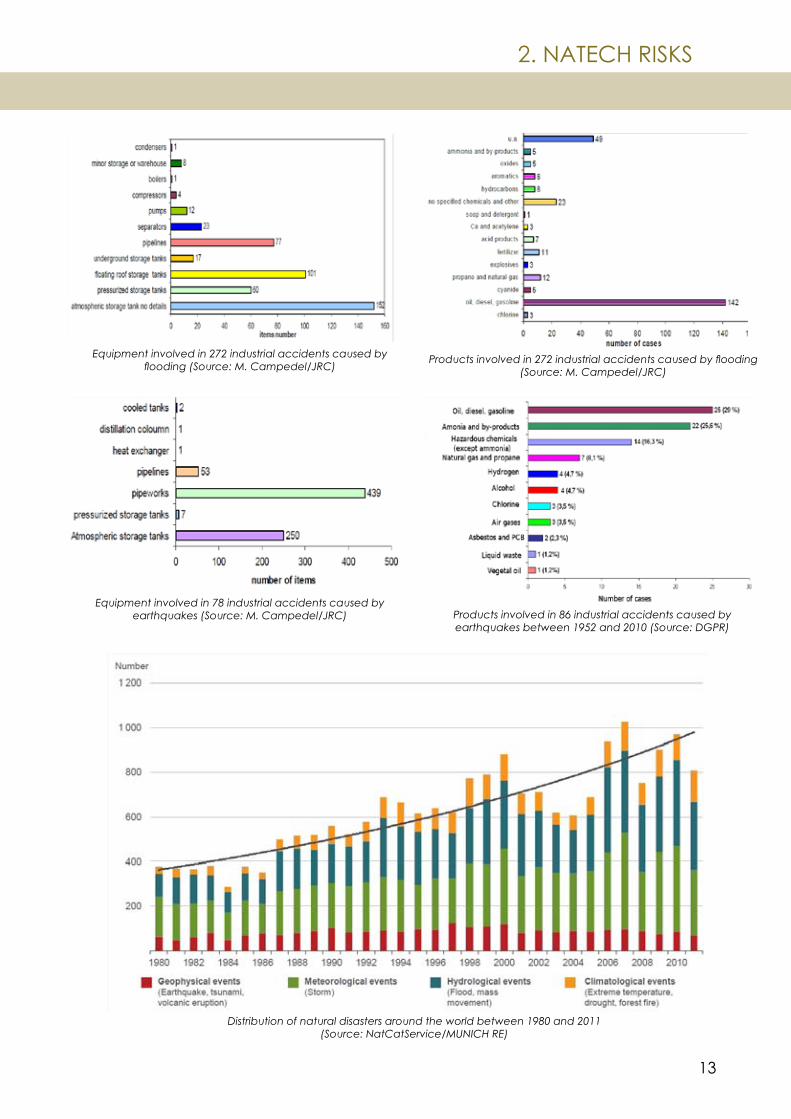
Equipment involved in 78 industrial accidents caused by earthquakes (Source: M. Campedel/JRC)
Products involved in 272 industrial accidents caused by flooding (Source: M. Campedel/JRC)
Products involved in 86 industrial accidents caused by earthquakes between 1952 and 2010 (Source: DGPR)
Equipment involved in 272 industrial accidents caused by flooding (Source: M. Campedel/JRC)
Distribution of natural disasters around the world between 1980 and 2011 (Source: NatCatService/MUNICH RE)
14
2. NATECH RISKS
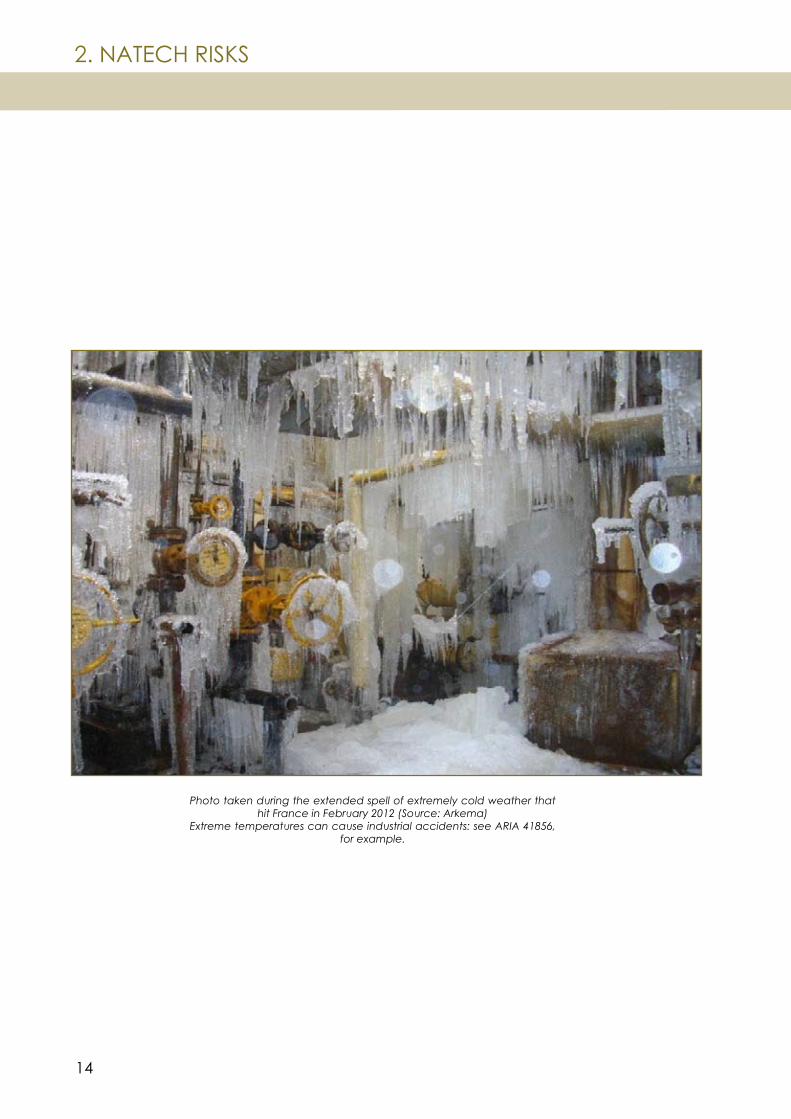
Photo taken during the extended spell of extremely cold weather that hit France in February 2012 (Source: Arkema)
Extreme temperatures can cause industrial accidents: see ARIA 41856, for example.
15
CHAPTER 3
MAIN ACCIDENTS BY INDUSTRIAL SECTOR
16
Company Damaged thermal power plants and
capacities
Main damage caused by the earthquake
Main damage caused by the tsunami
Date of resumption of operations
Amount of damage (2011)
Tokyo ElectricPower
Co.(TEPCO)
Hirono fuel oil/crude/coal plant (3.8 GW)
Hitachinaka coal plant
(1 GW)
Kashima fuel oil /crude plant (4.4 GW)
Higashi-Ogishima natural-gas-fired
plant (1 GW)
minor
coal conveyor
outdoor units and storage
tanks
gas leak
transformer station and coal terminal, ground
floor of turbine building and wastewater treat-
ment plant(see p. 18)
coal terminal
roads and jetties
none (built on high ground)
one 0.6 GW coal-fired unit in June
2011; fuel-oil-fired units in July 2011
one 1 GW unit in May 2011
five units in April 2011 and one in
May
one unit in March 2011
¥50 bn (€500 m) in damage to the thermal
power stations
Tohoku ElectricPower
Co.
Haramachi coal-fired plant (2 GW)
Sendai natural-gas-fired plant
(0.44 GW)
fuel-oil plant Port of Sendai
(0.95 GW)
coal conveyor
minor
minor
one fatality during evacuation; fire caused
by oil leaking from turbine on 4th floor; boat, coal terminal, outdoor storage and
other facilitiespartially submerged
evacuation following fire at JX refinery;
ground floor of turbine building submerged
summer 2013
December 2011, one unit shut down
December 2011
72 G¥ (720 M€)
de dommages
et
87 G¥(870 M€)
de pertes de production
Soma KyodoPower
Co.
Sinchi-Soma coal-fired plant
(2 GW)minor
coal unloading terminal, electrical
equipment (partially submerged)
at half capacity in December 2011 1
full capacity in summer 2012
included in damages reported
by TEPCO and Tohoku
ElectricJoban Joint
Power Co.
Iwaki-Nakoso coal/fuel-oil plant
(1.5 GW)minor
unloading terminal and stock of coal swept
away by the tsunami
two units restarted in July 2011, full
capacity in summer 2012
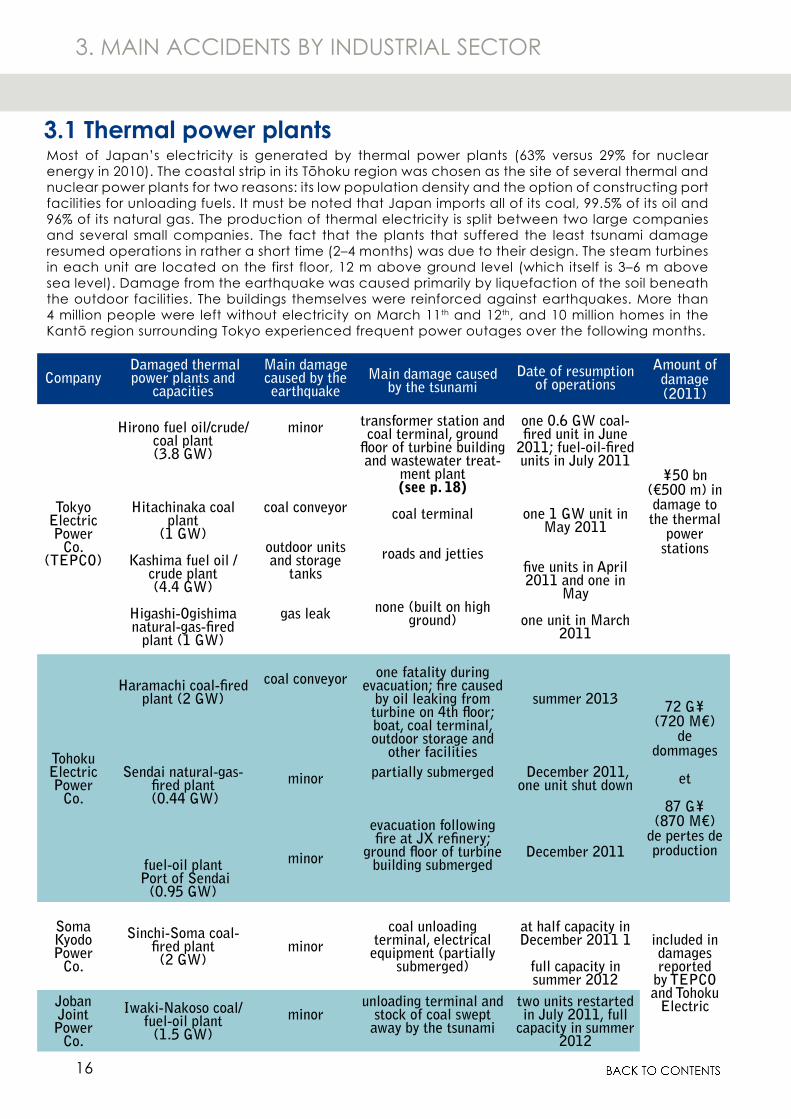
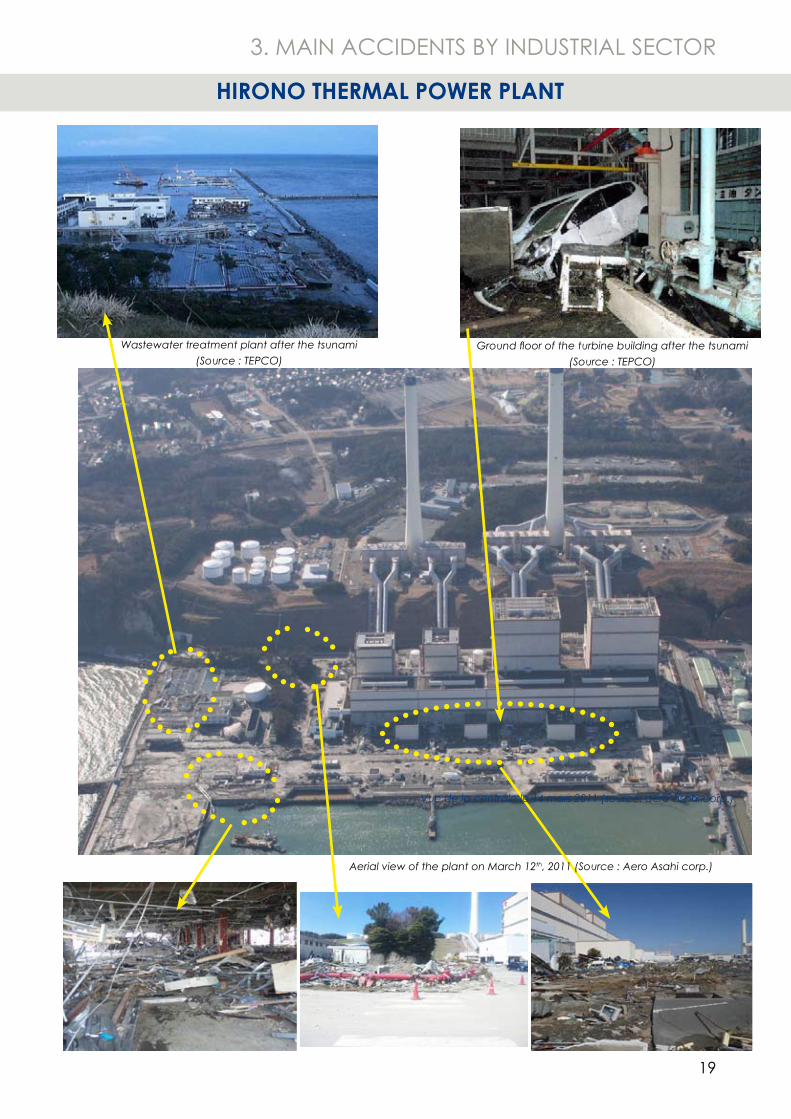
3.1 Thermal power plants Most of Japan’s electricity is generated by thermal power plants (63% versus 29% for nuclear energy in 2010). The coastal strip in its Tōhoku region was chosen as the site of several thermal and nuclear power plants for two reasons: its low population density and the option of constructing port facilities for unloading fuels. It must be noted that Japan imports all of its coal, 99.5% of its oil and 96% of its natural gas. The production of thermal electricity is split between two large companies and several small companies. The fact that the plants that suffered the least tsunami damage resumed operations in rather a short time (2–4 months) was due to their design. The steam turbines in each unit are located on the first floor, 12 m above ground level (which itself is 3–6 m above sea level). Damage from the earthquake was caused primarily by liquefaction of the soil beneath the outdoor facilities. The buildings themselves were reinforced against earthquakes. More than 4 million people were left without electricity on March 11th and 12th, and 10 million homes in the Kantō region surrounding Tokyo experienced frequent power outages over the following months.
3. MAIN ACCIDENTS BY INDUSTRIAL SECTOR
17
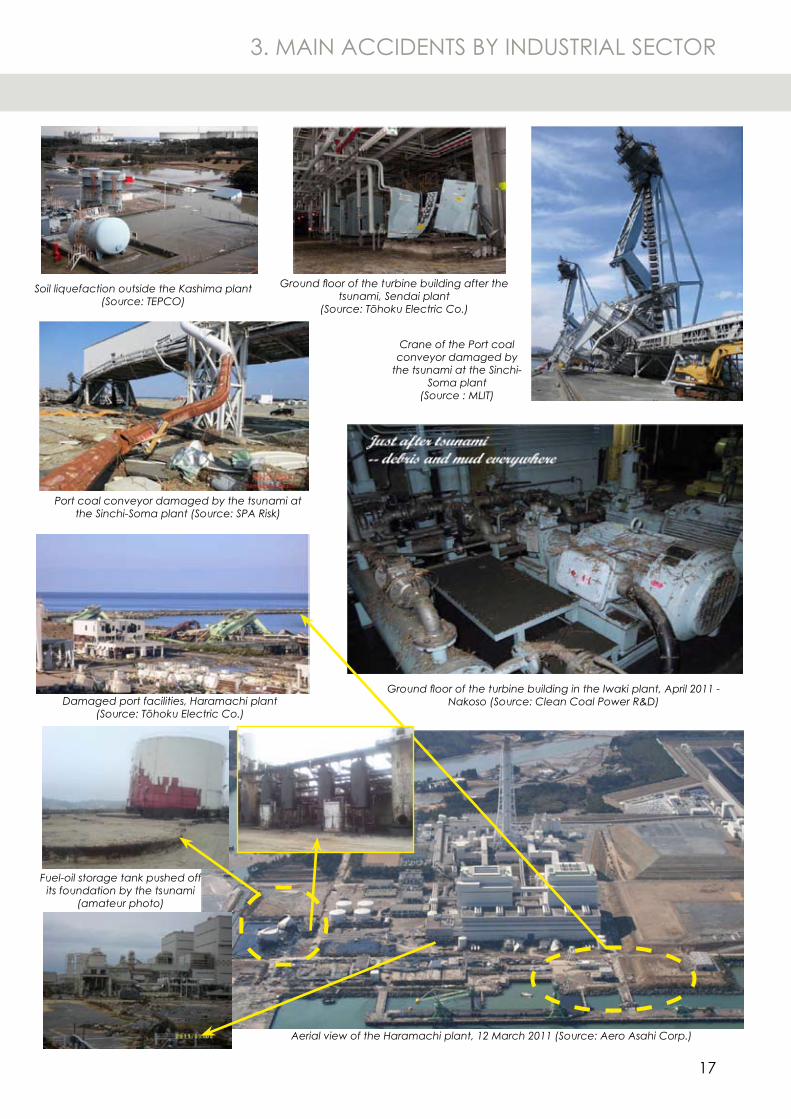
Damaged port facilities, Haramachi plant (Source: Tōhoku Electric Co.)
Soil liquefaction outside the Kashima plant (Source: TEPCO)
Fuel-oil storage tank pushed off its foundation by the tsunami
(amateur photo)
Ground floor of the turbine building after the tsunami, Sendai plant
(Source: Tōhoku Electric Co.)
Ground floor of the turbine building in the Iwaki plant, April 2011 - Nakoso (Source: Clean Coal Power R&D)
Aerial view of the Haramachi plant, 12 March 2011 (Source: Aero Asahi Corp.)
Port coal conveyor damaged by the tsunami at the Sinchi-Soma plant (Source: SPA Risk)
Crane of the Port coal conveyor damaged by
the tsunami at the Sinchi-Soma plant
(Source : MLIT)
3. MAIN ACCIDENTS BY INDUSTRIAL SECTOR
18
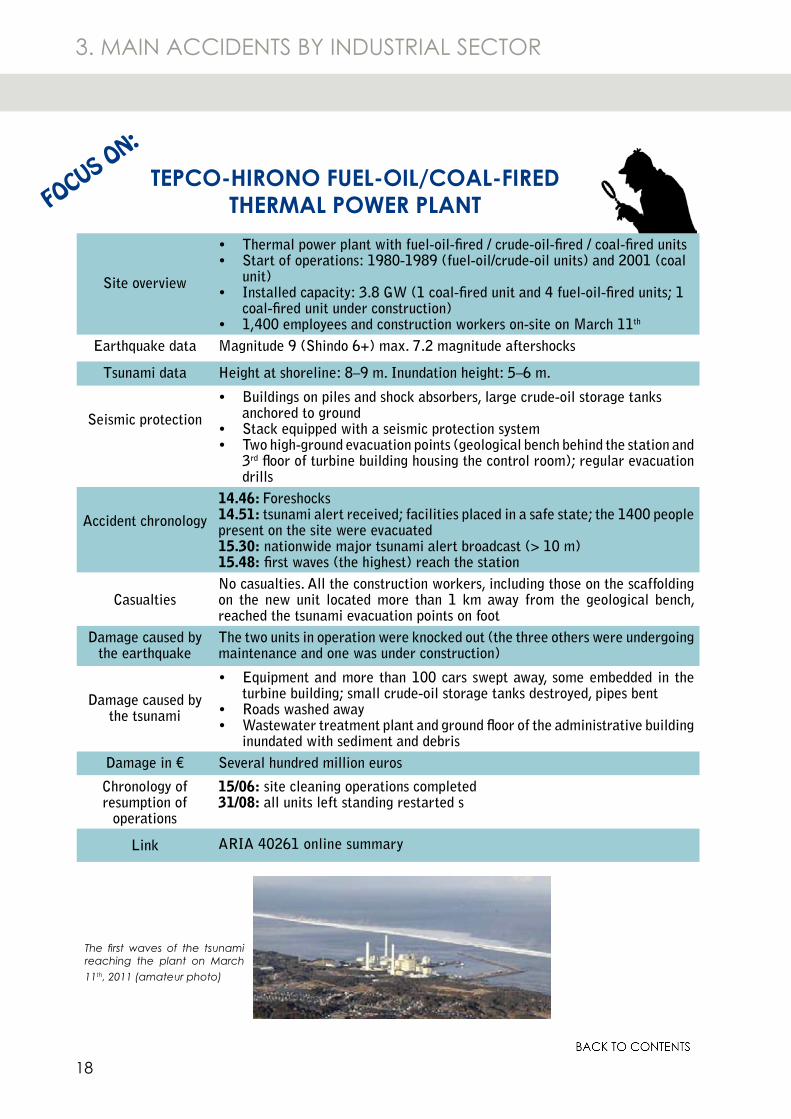
The first waves of the tsunami reaching the plant on March 11th, 2011 (amateur photo)
3. MAIN ACCIDENTS BY INDUSTRIAL SECTOR
Site overview
Thermal power plant with fuel-oil-fired / crude-oil-fired / coal-fired units•Start of operations: 1980-1989 (fuel-oil/crude-oil units) and 2001 (coal •unit)Installed capacity: 3.8 GW (1 coal-fired unit and 4 fuel-oil-fired units; 1 •coal-fired unit under construction)1,400 employees and construction workers on-site on March 11• th
Earthquake data Magnitude 9 (Shindo 6+) max. 7.2 magnitude aftershocks
Tsunami data Height at shoreline: 8–9 m. Inundation height: 5–6 m.
Seismic protection
Buildings on piles and shock absorbers, large crude-oil storage tanks •anchored to groundStack equipped with a seismic protection system•Two high-ground evacuation points (geological bench behind the station and •3rd floor of turbine building housing the control room); regular evacuation drills
Accident chronology
14.46: Foreshocks14.51: tsunami alert received; facilities placed in a safe state; the 1400 people present on the site were evacuated15.30: nationwide major tsunami alert broadcast (> 10 m)15.48: first waves (the highest) reach the station
CasualtiesNo casualties. All the construction workers, including those on the scaffolding on the new unit located more than 1 km away from the geological bench, reached the tsunami evacuation points on foot
Damage caused by the earthquake
The two units in operation were knocked out (the three others were undergoing maintenance and one was under construction)
Damage caused by the tsunami
Equipment and more than 100 cars swept away, some embedded in the •turbine building; small crude-oil storage tanks destroyed, pipes bentRoads washed away•Wastewater treatment plant and ground floor of the administrative building •inundated with sediment and debris
Damage in € Several hundred million euros
Chronology of resumption of
operations
15/06: site cleaning operations completed31/08: all units left standing restarted s
Link ARIA 40261 online summary
TEPCO-HIRONO FUEL-OIL/COAL-FIRED THERMAL POWER PLANT FOCUS ON:
19
3. MAIN ACCIDENTS BY INDUSTRIAL SECTOR
Aerial view of the plant on March 12th, 2011 (Source : Aero Asahi corp.)
Wastewater treatment plant after the tsunami (Source : TEPCO)
Ground floor of the turbine building after the tsunami (Source : TEPCO)
Vue de la centrale le 14 mars 2011 (source: aero asahi corp.)
HIRONO THERMAL POWER PLANT
20
3. MAIN ACCIDENTS BY INDUSTRIAL SECTOR
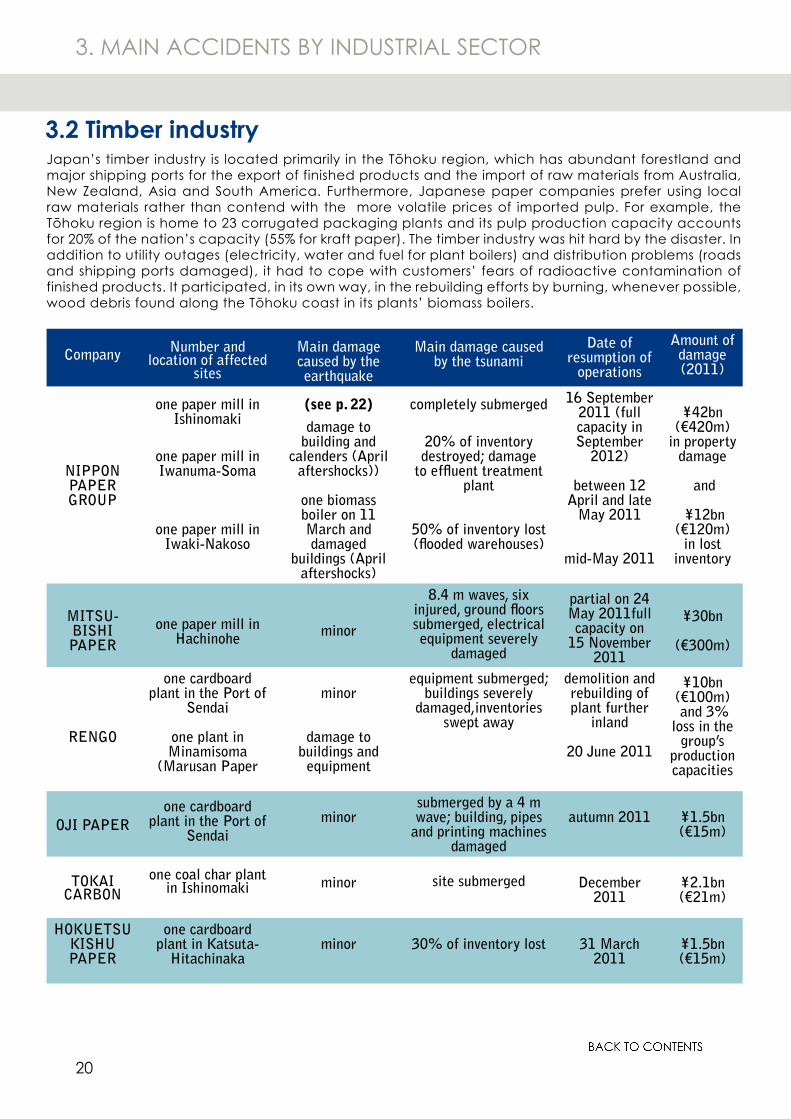
Japan’s timber industry is located primarily in the Tōhoku region, which has abundant forestland and major shipping ports for the export of finished products and the import of raw materials from Australia, New Zealand, Asia and South America. Furthermore, Japanese paper companies prefer using local raw materials rather than contend with the more volatile prices of imported pulp. For example, the Tōhoku region is home to 23 corrugated packaging plants and its pulp production capacity accounts for 20% of the nation’s capacity (55% for kraft paper). The timber industry was hit hard by the disaster. In addition to utility outages (electricity, water and fuel for plant boilers) and distribution problems (roads and shipping ports damaged), it had to cope with customers’ fears of radioactive contamination of finished products. It participated, in its own way, in the rebuilding efforts by burning, whenever possible, wood debris found along the Tōhoku coast in its plants’ biomass boilers.
Company Number and location of affected
sites
Main damage caused by the earthquake
Main damage caused by the tsunami
Date of resumption of
operations
Amount of damage (2011)
NIPPON PAPERGROUP
one paper mill in Ishinomaki
one paper mill in Iwanuma-Soma
one paper mill in Iwaki-Nakoso
(see p. 22)
damage to building and
calenders (April aftershocks))
one biomass boiler on 11 March and damaged
buildings (April aftershocks)
completely submerged
20% of inventory destroyed; damage
to effluent treatment plant
50% of inventory lost (flooded warehouses)
16 September 2011 (full capacity in September
2012)
between 12 April and late
May 2011
mid-May 2011
¥42bn(€420m)
in property damage
and
¥12bn (€120m)
in lost inventory
MITSU-BISHIPAPER
one paper mill in Hachinohe minor
8.4 m waves, six injured, ground floors submerged, electrical equipment severely
damaged
partial on 24 May 2011full capacity on
15 November 2011
¥30bn
(€300m)
RENGO
one cardboard plant in the Port of
Sendai
one plant in Minamisoma
(Marusan Paper
minor
damage to buildings and
equipment
equipment submerged; buildings severely
damaged,inventories swept away
demolition and rebuilding of plant further
inland
20 June 2011
¥10bn (€100m) and 3%
loss in the group’s
production capacities
OJI PAPERone cardboard
plant in the Port of Sendai
minorsubmerged by a 4 m wave; building, pipes
and printing machines damaged
autumn 2011 ¥1.5bn(€15m)
TOKAI CARBON
one coal char plant in Ishinomaki minor site submerged December
2011¥2.1bn(€21m)
HOKUETSU KISHU PAPER
one cardboard plant in Katsuta-
Hitachinakaminor 30% of inventory lost 31 March
2011¥1.5bn(€15m)
3.2 Timber industry
21
3. MAIN ACCIDENTS BY INDUSTRIAL SECTOR
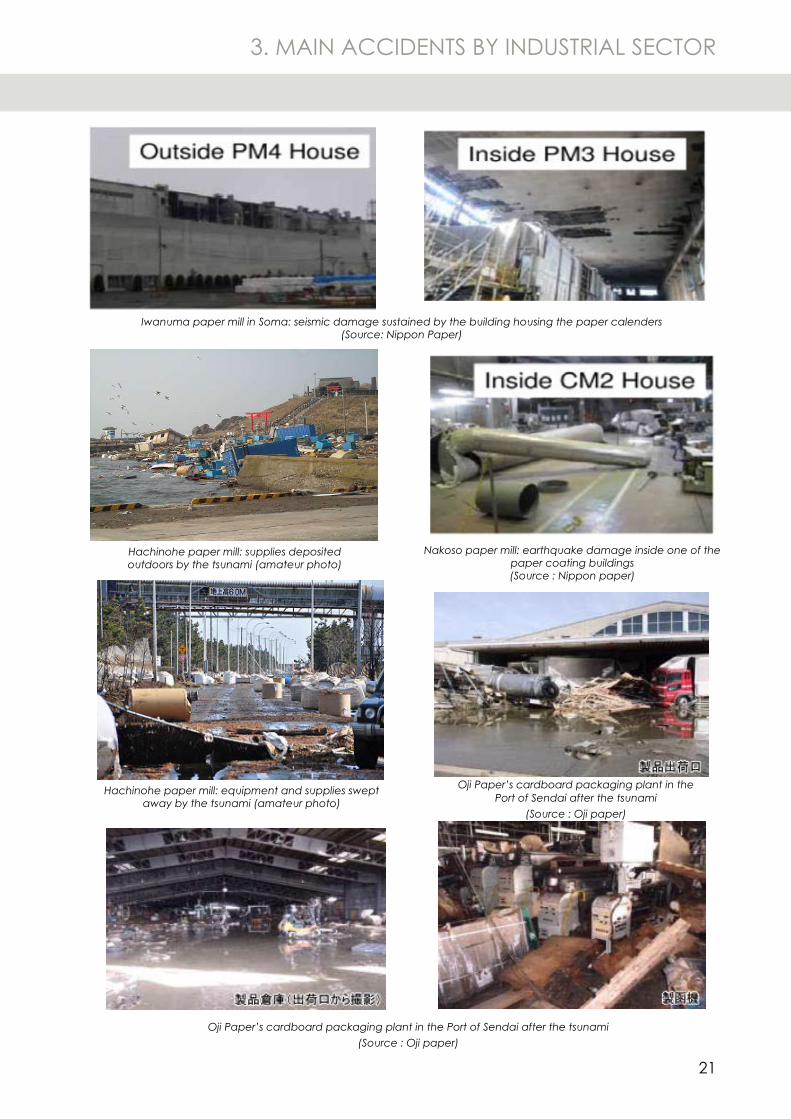
Iwanuma paper mill in Soma: seismic damage sustained by the building housing the paper calenders (Source: Nippon Paper)
Nakoso paper mill: earthquake damage inside one of the paper coating buildings(Source : Nippon paper)
Oji Paper’s cardboard packaging plant in the Port of Sendai after the tsunami
(Source : Oji paper)
Hachinohe paper mill: supplies deposited outdoors by the tsunami (amateur photo)
Hachinohe paper mill: equipment and supplies swept away by the tsunami (amateur photo)
Oji Paper’s cardboard packaging plant in the Port of Sendai after the tsunami (Source : Oji paper)
22
3. MAIN ACCIDENTS BY INDUSTRIAL SECTOR
Site overview
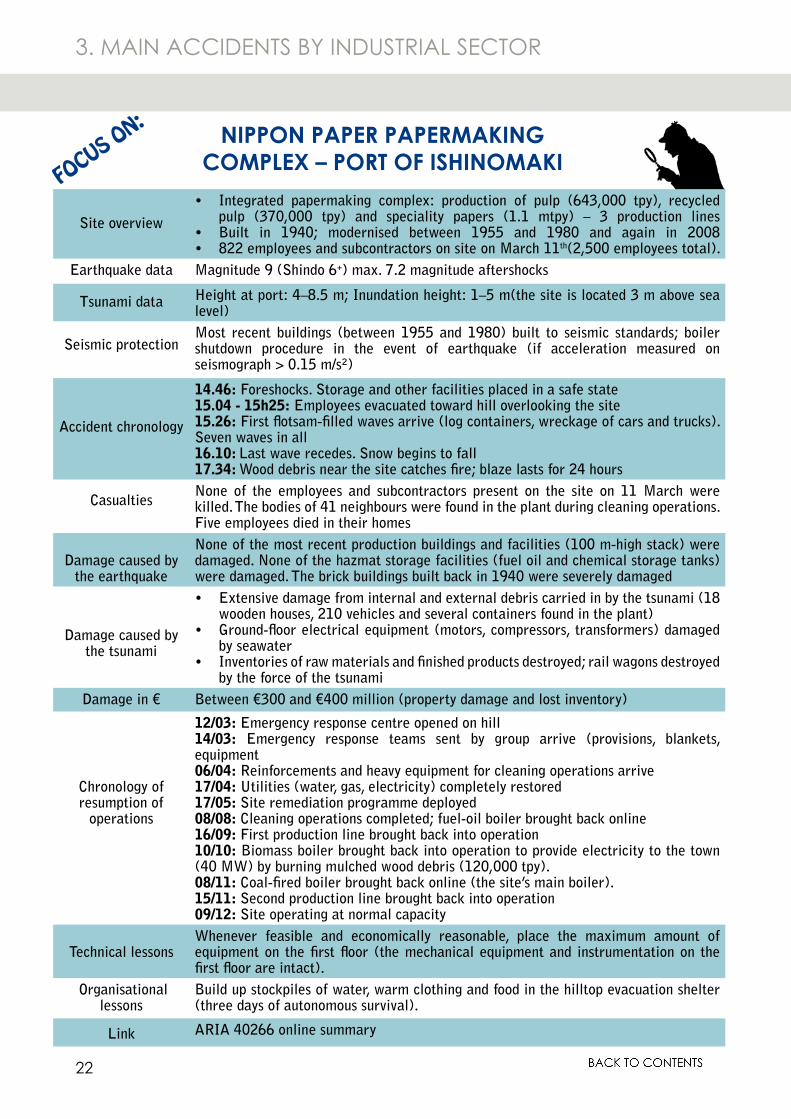
Integrated papermaking complex: production of pulp (643,000 tpy), recycled •pulp (370,000 tpy) and speciality papers (1.1 mtpy) – 3 production linesBuilt in 1940; modernised between 1955 and 1980 and again in 2008•822 employees and subcontractors on site on March 11• th(2,500 employees total).
Earthquake data Magnitude 9 (Shindo 6+) max. 7.2 magnitude aftershocks
Tsunami data Height at port: 4–8.5 m; Inundation height: 1–5 m(the site is located 3 m above sea level)
Seismic protectionMost recent buildings (between 1955 and 1980) built to seismic standards; boiler shutdown procedure in the event of earthquake (if acceleration measured on seismograph > 0.15 m/s²)
Accident chronology
14.46: Foreshocks. Storage and other facilities placed in a safe state15.04 - 15h25: Employees evacuated toward hill overlooking the site15.26: First flotsam-filled waves arrive (log containers, wreckage of cars and trucks). Seven waves in all16.10: Last wave recedes. Snow begins to fall17.34: Wood debris near the site catches fire; blaze lasts for 24 hours
CasualtiesNone of the employees and subcontractors present on the site on 11 March were killed. The bodies of 41 neighbours were found in the plant during cleaning operations. Five employees died in their homes
Damage caused by the earthquake
None of the most recent production buildings and facilities (100 m-high stack) were damaged. None of the hazmat storage facilities (fuel oil and chemical storage tanks) were damaged. The brick buildings built back in 1940 were severely damaged
Damage caused by the tsunami
Extensive damage from internal and external debris carried in by the tsunami (18 •wooden houses, 210 vehicles and several containers found in the plant)Ground-floor electrical equipment (motors, compressors, transformers) damaged •by seawaterInventories of raw materials and finished products destroyed; rail wagons destroyed •by the force of the tsunami
Damage in € Between €300 and €400 million (property damage and lost inventory)
Chronology of resumption of
operations
12/03: Emergency response centre opened on hill 14/03: Emergency response teams sent by group arrive (provisions, blankets, equipment06/04: Reinforcements and heavy equipment for cleaning operations arrive17/04: Utilities (water, gas, electricity) completely restored17/05: Site remediation programme deployed08/08: Cleaning operations completed; fuel-oil boiler brought back online16/09: First production line brought back into operation10/10: Biomass boiler brought back into operation to provide electricity to the town (40 MW) by burning mulched wood debris (120,000 tpy).08/11: Coal-fired boiler brought back online (the site’s main boiler).15/11: Second production line brought back into operation09/12: Site operating at normal capacity
Technical lessonsWhenever feasible and economically reasonable, place the maximum amount of equipment on the first floor (the mechanical equipment and instrumentation on the first floor are intact).
Organisational lessons
Build up stockpiles of water, warm clothing and food in the hilltop evacuation shelter (three days of autonomous survival).
Link ARIA 40266 online summary
NIPPON PAPER PAPERMAKING COMPLEX – PORT OF ISHINOMAKI
FOCUS ON:
23
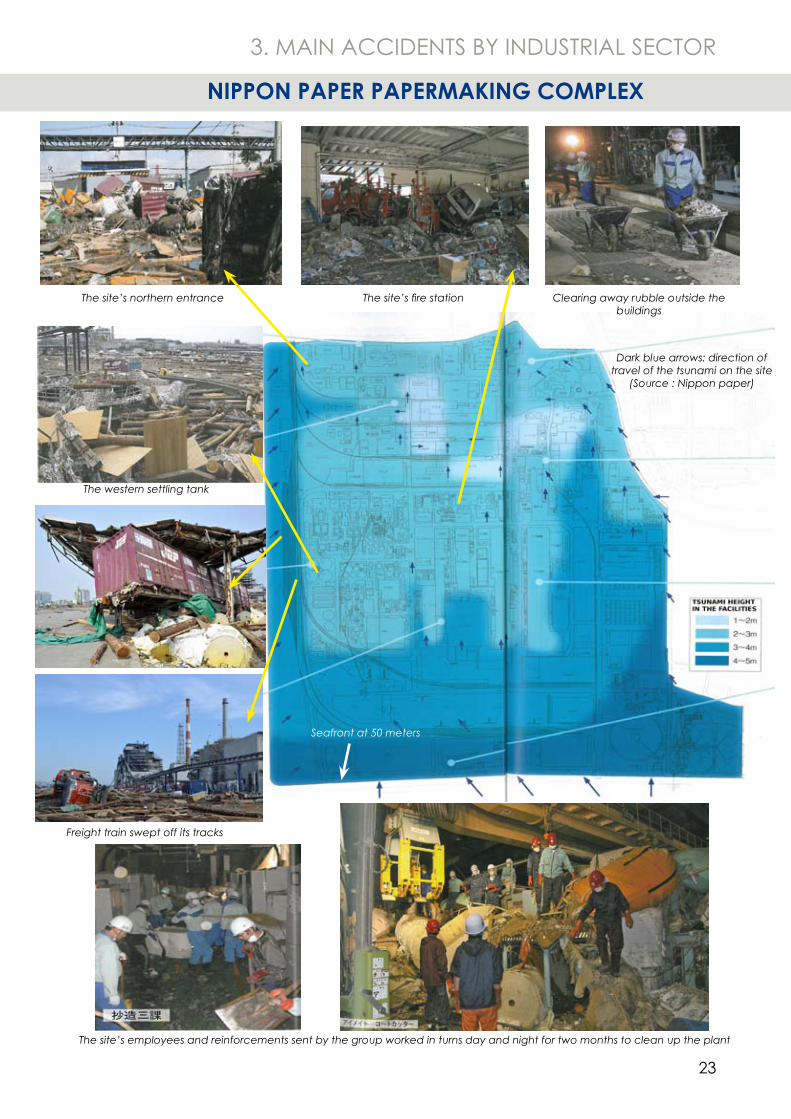
3. MAIN ACCIDENTS BY INDUSTRIAL SECTOR
The site’s fire station
The site’s employees and reinforcements sent by the group worked in turns day and night for two months to clean up the plant
The site’s northern entrance
The western settling tank
Seafront at 50 meters
NIPPON PAPER PAPERMAKING COMPLEX
Freight train swept off its tracks
Clearing away rubble outside the buildings
Dark blue arrows: direction of travel of the tsunami on the site
(Source : Nippon paper)
24
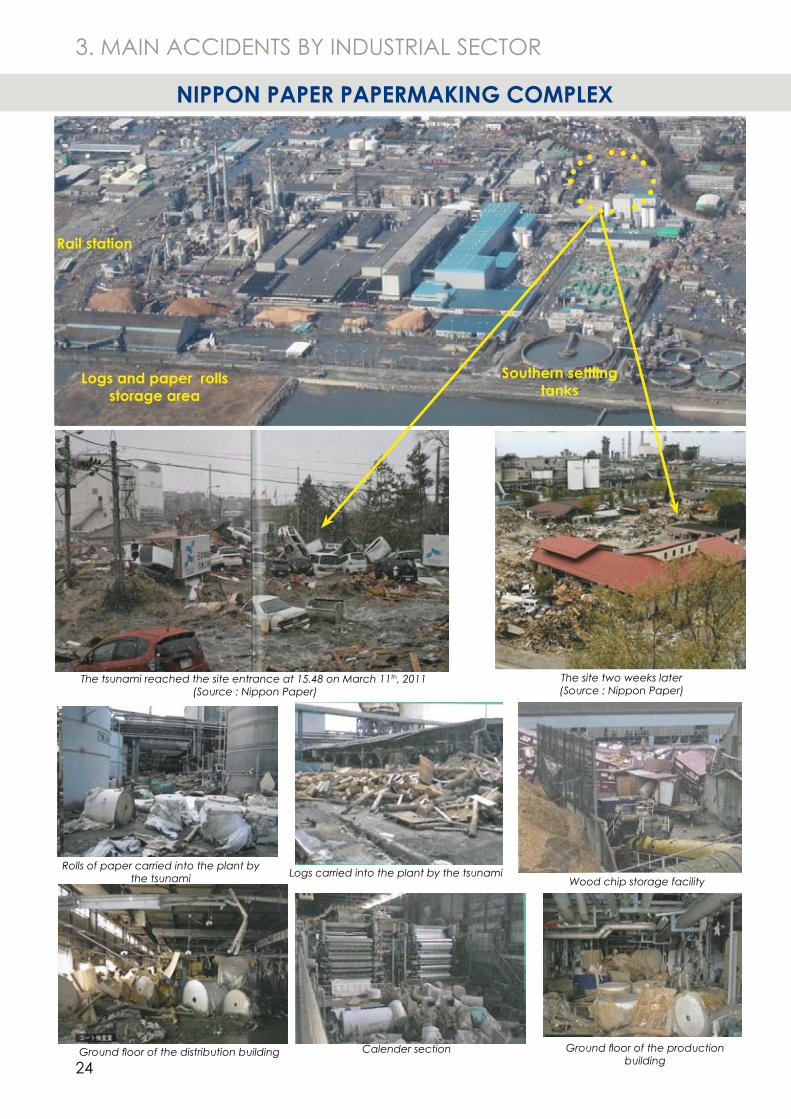
3. MAIN ACCIDENTS BY INDUSTRIAL SECTOR
The tsunami reached the site entrance at 15.48 on March 11th, 2011 (Source : Nippon Paper)
Logs carried into the plant by the tsunami
Calender section Ground floor of the production building
Ground floor of the distribution building
Wood chip storage facility
NIPPON PAPER PAPERMAKING COMPLEX
Logs and paper rolls storage area
Rail station
Southern settling tanks
Rolls of paper carried into the plant by the tsunami
The site two weeks later(Source : Nippon Paper)
25
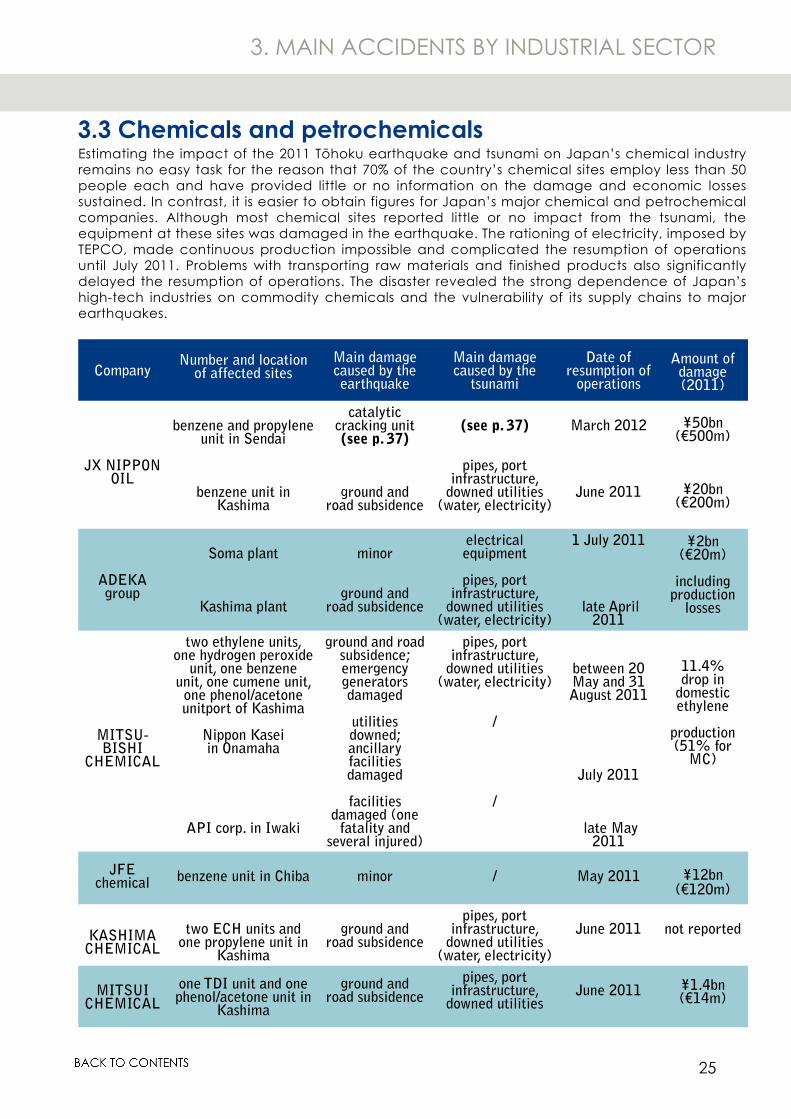
Estimating the impact of the 2011 Tōhoku earthquake and tsunami on Japan’s chemical industry remains no easy task for the reason that 70% of the country’s chemical sites employ less than 50 people each and have provided little or no information on the damage and economic losses sustained. In contrast, it is easier to obtain figures for Japan’s major chemical and petrochemical companies. Although most chemical sites reported little or no impact from the tsunami, the equipment at these sites was damaged in the earthquake. The rationing of electricity, imposed by TEPCO, made continuous production impossible and complicated the resumption of operations until July 2011. Problems with transporting raw materials and finished products also significantly delayed the resumption of operations. The disaster revealed the strong dependence of Japan’s high-tech industries on commodity chemicals and the vulnerability of its supply chains to major earthquakes.
CompanyNumber and location
of affected sitesMain damage caused by the earthquake
Main damage caused by the
tsunami
Date of resumption of
operations
Amount of damage(2011)
JX NIPPON OIL
benzene and propylene unit in Sendai
benzene unit in Kashima
catalytic cracking unit (see p. 37)
ground and road subsidence
(see p. 37)
pipes, port infrastructure,
downed utilities (water, electricity)
March 2012
June 2011
¥50bn(€500m)
¥20bn(€200m)
ADEKA group
Soma plant
Kashima plant
minor
ground and road subsidence
electrical equipment
pipes, port infrastructure,
downed utilities (water, electricity)
1 July 2011
late April 2011
¥2bn(€20m)
including production
losses
MITSU-BISHI
CHEMICAL
two ethylene units, one hydrogen peroxide
unit, one benzene unit, one cumene unit, one phenol/acetone unitport of Kashima
Nippon Kasei in Onamaha
API corp. in Iwaki
ground and road subsidence; emergency generators damaged
utilities downed; ancillary facilities damaged
facilities damaged (one
fatality and several injured)
pipes, port infrastructure,
downed utilities (water, electricity)
/
/
between 20 May and 31 August 2011
July 2011
late May 2011
11.4% drop in
domestic ethylene
production(51% for
MC)
JFE chemical benzene unit in Chiba minor / May 2011 ¥12bn
(€120m)
KASHIMA CHEMICAL
two ECH units and one propylene unit in
Kashima
ground and road subsidence
pipes, port infrastructure,
downed utilities (water, electricity)
June 2011 not reported
MITSUICHEMICAL
one TDI unit and one phenol/acetone unit in
Kashima
ground and road subsidence
pipes, port infrastructure,
downed utilitiesJune 2011 ¥1.4bn
(€14m)
3.3 Chemicals and petrochemicals
3. MAIN ACCIDENTS BY INDUSTRIAL SECTOR
26
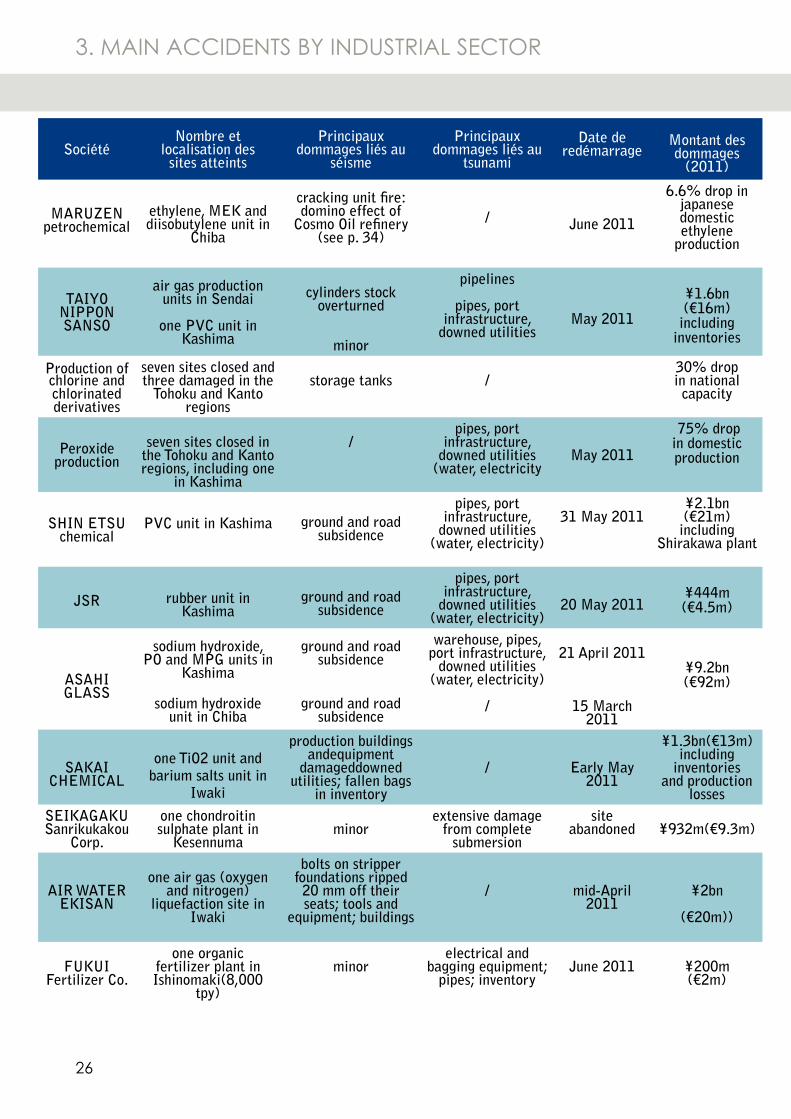
SociétéNombre et
localisation des sites atteints
Principaux dommages liés au
séisme
Principaux dommages liés au
tsunami
Date de redémarrage
Montant des dommages
(2011)
MARUZENpetrochemical
ethylene, MEK and diisobutylene unit in
Chiba
cracking unit fire: domino effect of
Cosmo Oil refinery (see p. 34)
/ June 2011
6.6% drop in japanesedomestic ethylene
production
TAIYO NIPPON SANSO
air gas production units in Sendai
one PVC unit in Kashima
cylinders stock overturned
minor
pipelines
pipes, port infrastructure,
downed utilitiesMay 2011
¥1.6bn(€16m)
including inventories
Production of chlorine and chlorinated derivatives
seven sites closed and three damaged in the
Tohoku and Kanto regions
storage tanks /30% drop in national capacity
Peroxide production
seven sites closed in the Tohoku and Kanto regions, including one
in Kashima
/pipes, port
infrastructure, downed utilities
(water, electricityMay 2011
75% drop in domestic production
SHIN ETSUchemical
PVC unit in Kashima ground and road subsidence
pipes, port infrastructure,
downed utilities (water, electricity)
31 May 2011¥2.1bn(€21m)
including Shirakawa plant
JSR rubber unit in Kashima
ground and road subsidence
pipes, port infrastructure,
downed utilities (water, electricity)
20 May 2011¥444m(€4.5m)
ASAHI GLASS
sodium hydroxide, PO and MPG units in
Kashima
sodium hydroxide unit in Chiba
ground and road subsidence
ground and road subsidence
warehouse, pipes, port infrastructure,
downed utilities (water, electricity)
/
21 April 2011
15 March 2011
¥9.2bn(€92m)
SAKAICHEMICAL
one TiO2 unit and barium salts unit in
Iwaki
production buildings andequipment
damageddowned utilities; fallen bags
in inventory
/ Early May 2011
¥1.3bn(€13m)including
inventories and production
lossesSEIKAGAKUSanrikukakou
Corp.
one chondroitin sulphate plant in
Kesennumaminor
extensive damage from complete
submersion
site abandoned ¥932m(€9.3m)
AIR WATEREKISAN
one air gas (oxygen and nitrogen)
liquefaction site in Iwaki
bolts on stripper foundations ripped 20 mm off their seats; tools and
equipment; buildings
/ mid-April 2011
¥2bn
(€20m))
FUKUI Fertilizer Co.
one organic fertilizer plant in Ishinomaki(8,000
tpy)
minorelectrical and
bagging equipment; pipes; inventory
June 2011
¥200m(€2m)
3. MAIN ACCIDENTS BY INDUSTRIAL SECTOR
27
3. MAIN ACCIDENTS BY INDUSTRIAL SECTOR
Site overview
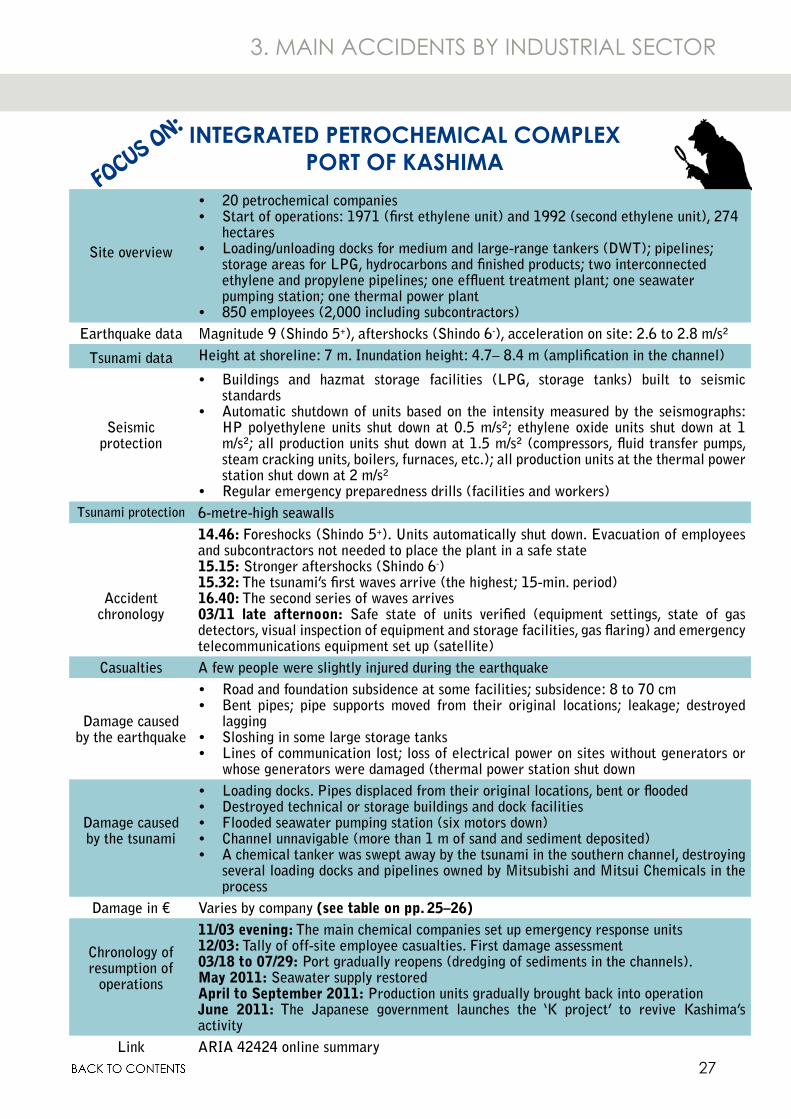
20 petrochemical companies •Start of operations: 1971 (first ethylene unit) and 1992 (second ethylene unit), 274 •hectaresLoading/unloading docks for medium and large-range tankers (DWT); pipelines; •storage areas for LPG, hydrocarbons and finished products; two interconnected ethylene and propylene pipelines; one effluent treatment plant; one seawater pumping station; one thermal power plant850 employees (2,000 including subcontractors)•
Earthquake data Magnitude 9 (Shindo 5+), aftershocks (Shindo 6-), acceleration on site: 2.6 to 2.8 m/s²
Tsunami data Height at shoreline: 7 m. Inundation height: 4.7– 8.4 m (amplification in the channel)
Seismic protection
Buildings and hazmat storage facilities (LPG, storage tanks) built to seismic •standardsAutomatic shutdown of units based on the intensity measured by the seismographs: •HP polyethylene units shut down at 0.5 m/s²; ethylene oxide units shut down at 1 m/s²; all production units shut down at 1.5 m/s² (compressors, fluid transfer pumps, steam cracking units, boilers, furnaces, etc.); all production units at the thermal power station shut down at 2 m/s² Regular emergency preparedness drills (facilities and workers)•
Tsunami protection 6-metre-high seawalls
Accident chronology
14.46: Foreshocks (Shindo 5+). Units automatically shut down. Evacuation of employees and subcontractors not needed to place the plant in a safe state15.15: Stronger aftershocks (Shindo 6-)15.32: The tsunami’s first waves arrive (the highest; 15-min. period)16.40: The second series of waves arrives03/11 late afternoon: Safe state of units verified (equipment settings, state of gas detectors, visual inspection of equipment and storage facilities, gas flaring) and emergency telecommunications equipment set up (satellite)
Casualties A few people were slightly injured during the earthquake
Damage caused by the earthquake
Road and foundation subsidence at some facilities; subsidence: 8 to 70 cm•Bent pipes; pipe supports moved from their original locations; leakage; destroyed •laggingSloshing in some large storage tanks•Lines of communication lost; loss of electrical power on sites without generators or •whose generators were damaged (thermal power station shut down
Damage caused by the tsunami
Loading docks. Pipes displaced from their original locations, bent or flooded•Destroyed technical or storage buildings and dock facilities•Flooded seawater pumping station (six motors down)•Channel unnavigable (more than 1 m of sand and sediment deposited)•A chemical tanker was swept away by the tsunami in the southern channel, destroying •several loading docks and pipelines owned by Mitsubishi and Mitsui Chemicals in the process
Damage in € Varies by company (see table on pp. 25–26)
Chronology ofresumption of
operations
11/03 evening: The main chemical companies set up emergency response units12/03: Tally of off-site employee casualties. First damage assessment03/18 to 07/29: Port gradually reopens (dredging of sediments in the channels).May 2011: Seawater supply restoredApril to September 2011: Production units gradually brought back into operationJune 2011: The Japanese government launches the ‘K project’ to revive Kashima’s activity
Link ARIA 42424 online summary
INTEGRATED PETROCHEMICAL COMPLEXPORT OF KASHIMA
FOCUS ON:
28
3. MAIN ACCIDENTS BY INDUSTRIAL SECTOR
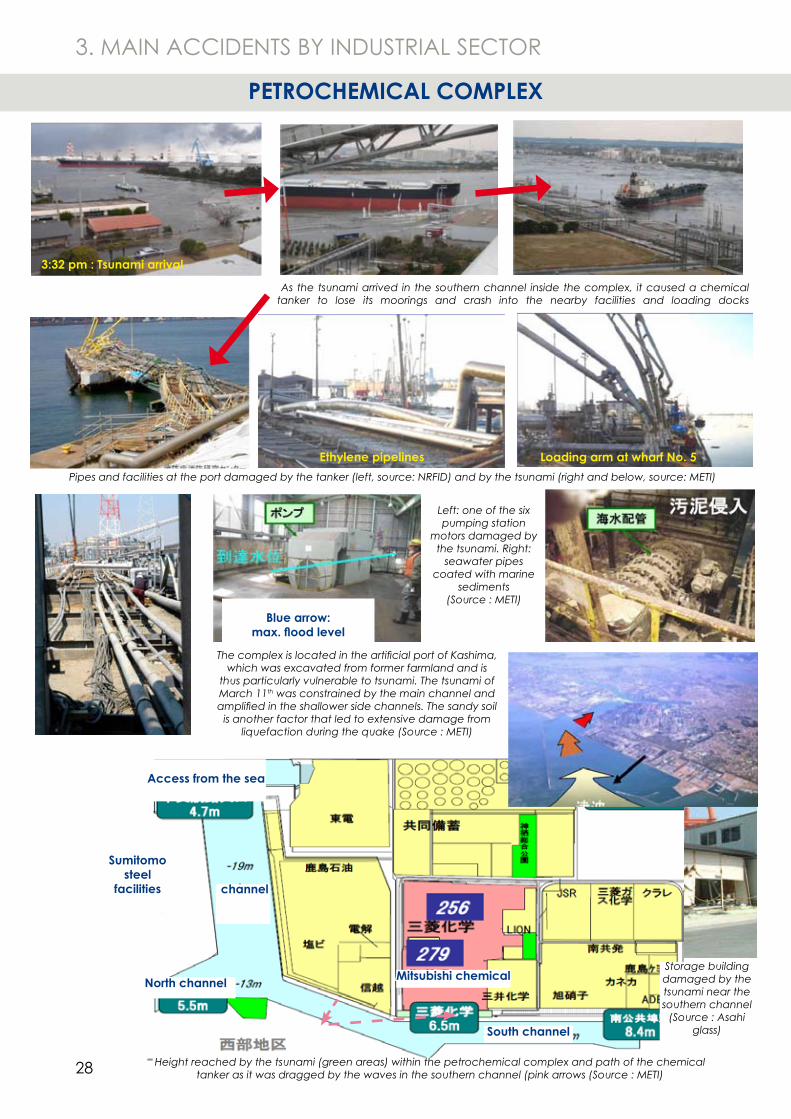
PETROCHEMICAL COMPLEX
As the tsunami arrived in the southern channel inside the complex, it caused a chemical tanker to lose its moorings and crash into the nearby facilities and loading docks
Pipes and facilities at the port damaged by the tanker (left, source: NRFID) and by the tsunami (right and below, source: METI)
Left: one of the six pumping station
motors damaged by the tsunami. Right:
seawater pipes coated with marine
sediments(Source : METI)
Ethylene pipelines Loading arm at wharf No. 5
Blue arrow:max. flood level
3:32 pm : Tsunami arrival
South channel
channel
Mitsubishi chemical
Access from the sea
Height reached by the tsunami (green areas) within the petrochemical complex and path of the chemical tanker as it was dragged by the waves in the southern channel (pink arrows (Source : METI)
The complex is located in the artificial port of Kashima, which was excavated from former farmland and is
thus particularly vulnerable to tsunami. The tsunami of March 11th was constrained by the main channel and amplified in the shallower side channels. The sandy soil
is another factor that led to extensive damage from liquefaction during the quake (Source : METI)
North channel
Sumitomo steel
facilities
Storage building damaged by the tsunami near the southern channel
(Source : Asahi glass)
29
3. MAIN ACCIDENTS BY INDUSTRIAL SECTOR
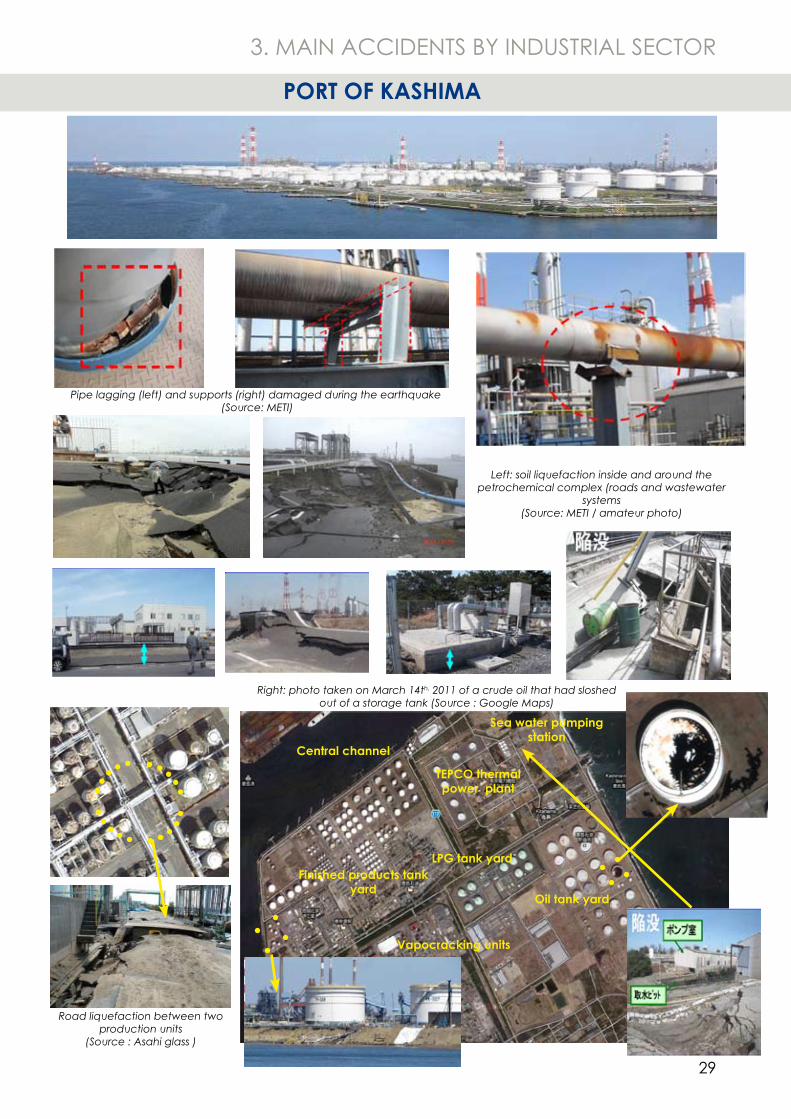
PORT OF KASHIMA
TEPCO thermal power plant
Vapocracking units
Oil tank yard
Sea water pumping station
Central channel
Pipe lagging (left) and supports (right) damaged during the earthquake (Source: METI)
Left: soil liquefaction inside and around the petrochemical complex (roads and wastewater
systems(Source: METI / amateur photo)
Road liquefaction between two production units
(Source : Asahi glass )
Right: photo taken on March 14th, 2011 of a crude oil that had sloshed out of a storage tank (Source : Google Maps)
LPG tank yardFinished products tank
yard
30
3. MAIN ACCIDENTS BY INDUSTRIAL SECTOR
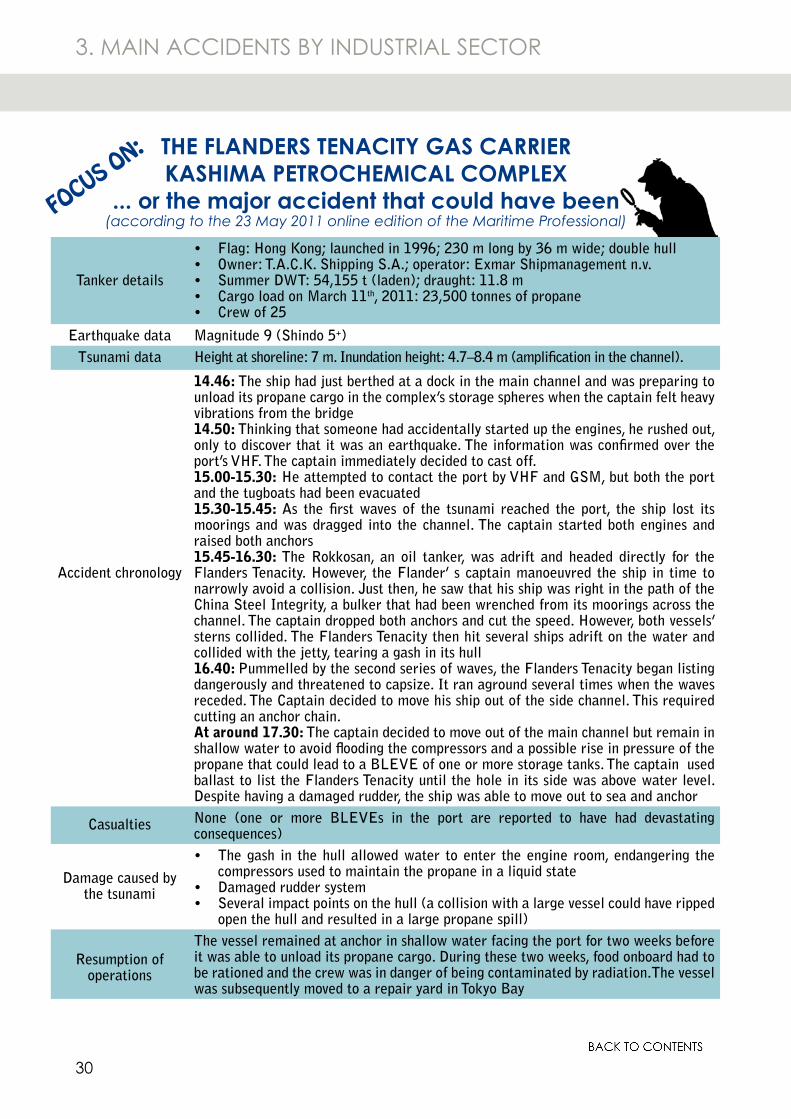
Tanker details
Flag: Hong Kong; launched in 1996; 230 m long by 36 m wide; double hull•Owner: T.A.C.K. Shipping S.A.; operator: Exmar Shipmanagement n.v. •Summer DWT: 54,155 t (laden); draught: 11.8 m•Cargo load on March 11• th, 2011: 23,500 tonnes of propane Crew of 25 •
Earthquake data Magnitude 9 (Shindo 5+)Tsunami data Height at shoreline: 7 m. Inundation height: 4.7–8.4 m (amplification in the channel).
Accident chronology
14.46: The ship had just berthed at a dock in the main channel and was preparing to unload its propane cargo in the complex’s storage spheres when the captain felt heavy vibrations from the bridge14.50: Thinking that someone had accidentally started up the engines, he rushed out, only to discover that it was an earthquake. The information was confirmed over the port’s VHF. The captain immediately decided to cast off.15.00-15.30: He attempted to contact the port by VHF and GSM, but both the port and the tugboats had been evacuated15.30-15.45: As the first waves of the tsunami reached the port, the ship lost its moorings and was dragged into the channel. The captain started both engines and raised both anchors15.45-16.30: The Rokkosan, an oil tanker, was adrift and headed directly for the Flanders Tenacity. However, the Flander’ s captain manoeuvred the ship in time to narrowly avoid a collision. Just then, he saw that his ship was right in the path of the China Steel Integrity, a bulker that had been wrenched from its moorings across the channel. The captain dropped both anchors and cut the speed. However, both vessels’ sterns collided. The Flanders Tenacity then hit several ships adrift on the water and collided with the jetty, tearing a gash in its hull16.40: Pummelled by the second series of waves, the Flanders Tenacity began listing dangerously and threatened to capsize. It ran aground several times when the waves receded. The Captain decided to move his ship out of the side channel. This required cutting an anchor chain.At around 17.30: The captain decided to move out of the main channel but remain in shallow water to avoid flooding the compressors and a possible rise in pressure of the propane that could lead to a BLEVE of one or more storage tanks. The captain used ballast to list the Flanders Tenacity until the hole in its side was above water level. Despite having a damaged rudder, the ship was able to move out to sea and anchor
Casualties None (one or more BLEVEs in the port are reported to have had devastating consequences)
Damage caused by the tsunami
The gash in the hull allowed water to enter the engine room, endangering the •compressors used to maintain the propane in a liquid stateDamaged rudder system•Several impact points on the hull (a collision with a large vessel could have ripped •open the hull and resulted in a large propane spill)
Resumption of operations
The vessel remained at anchor in shallow water facing the port for two weeks before it was able to unload its propane cargo. During these two weeks, food onboard had to be rationed and the crew was in danger of being contaminated by radiation.The vessel was subsequently moved to a repair yard in Tokyo Bay
THE FLANDERS TENACITY GAS CARRIERKASHIMA PETROCHEMICAL COMPLEX
... or the major accident that could have been (according to the 23 May 2011 online edition of the Maritime Professional)
FOCUS ON:
31
3. MAIN ACCIDENTS BY INDUSTRIAL SECTOR
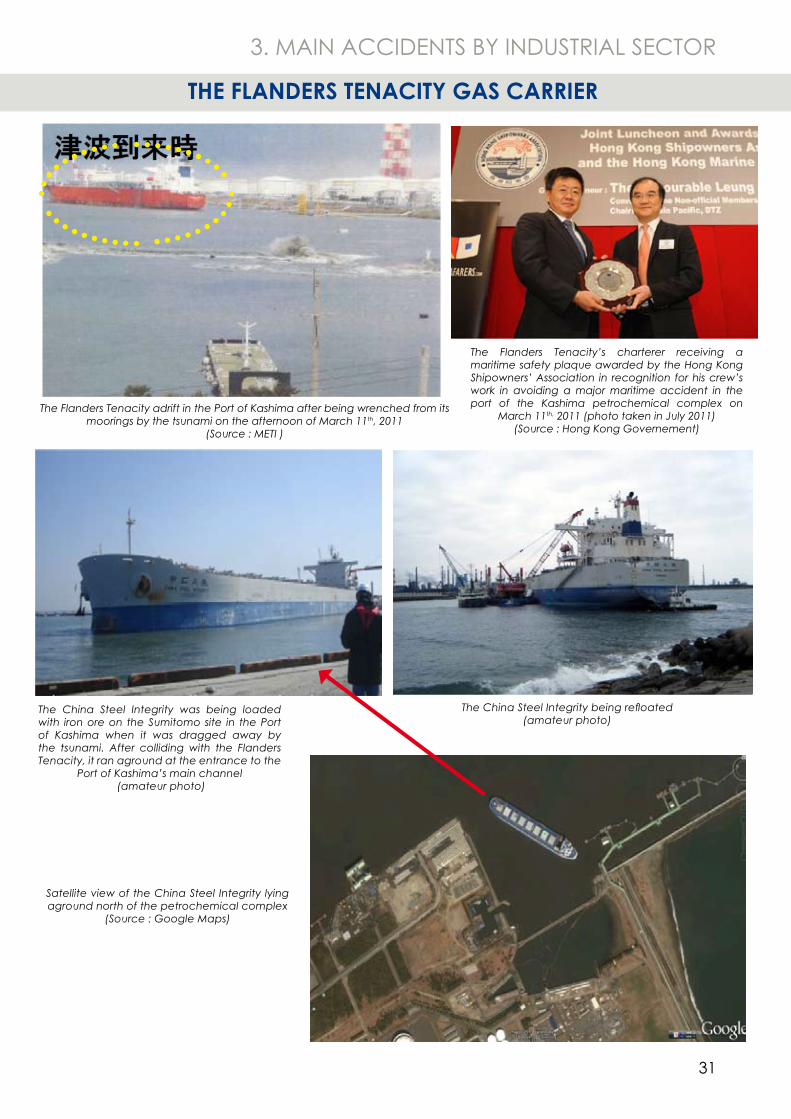
The Flanders Tenacity adrift in the Port of Kashima after being wrenched from its moorings by the tsunami on the afternoon of March 11th, 2011
(Source : METI )
The Flanders Tenacity’s charterer receiving a maritime safety plaque awarded by the Hong Kong Shipowners’ Association in recognition for his crew’s work in avoiding a major maritime accident in the port of the Kashima petrochemical complex on
March 11th, 2011 (photo taken in July 2011)(Source : Hong Kong Governement)
The China Steel Integrity was being loaded with iron ore on the Sumitomo site in the Port of Kashima when it was dragged away by the tsunami. After colliding with the Flanders Tenacity, it ran aground at the entrance to the
Port of Kashima’s main channel (amateur photo)
THE FLANDERS TENACITY GAS CARRIER
Satellite view of the China Steel Integrity lying aground north of the petrochemical complex
(Source : Google Maps)
The China Steel Integrity being refloated (amateur photo)
32
3. MAIN ACCIDENTS BY INDUSTRIAL SECTOR
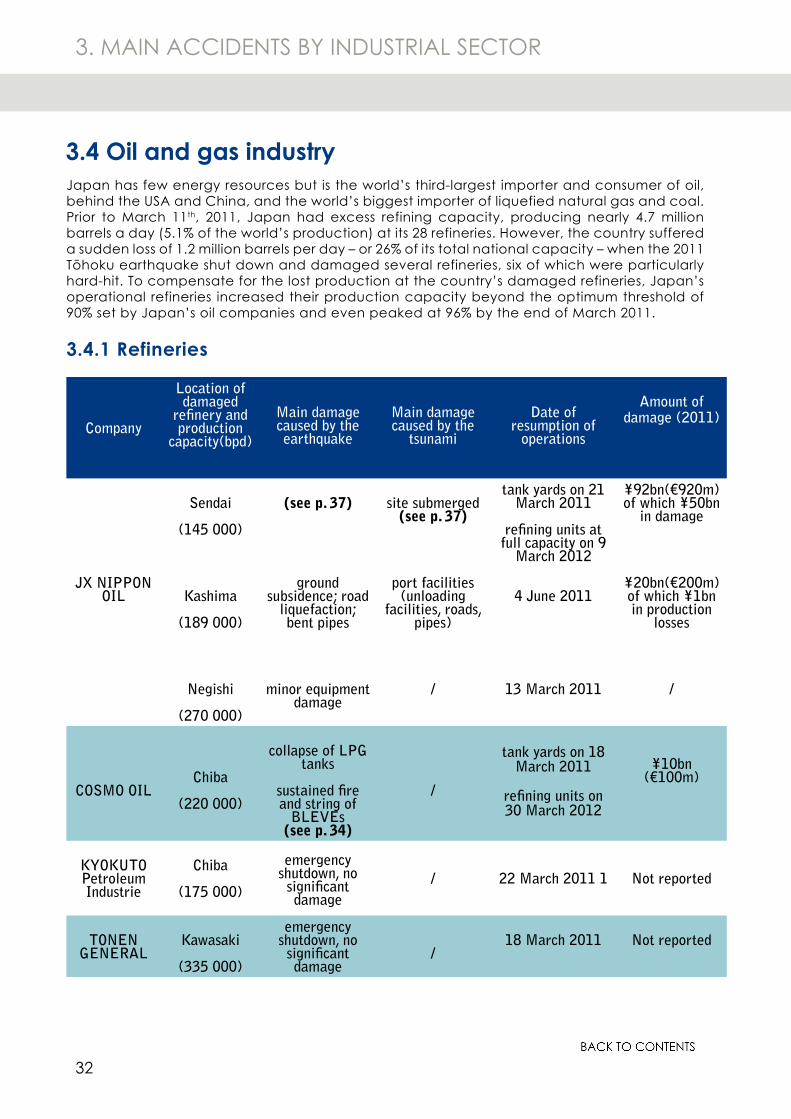
Japan has few energy resources but is the world’s third-largest importer and consumer of oil, behind the USA and China, and the world’s biggest importer of liquefied natural gas and coal. Prior to March 11th, 2011, Japan had excess refining capacity, producing nearly 4.7 million barrels a day (5.1% of the world’s production) at its 28 refineries. However, the country suffered a sudden loss of 1.2 million barrels per day – or 26% of its total national capacity – when the 2011 Tōhoku earthquake shut down and damaged several refineries, six of which were particularly hard-hit. To compensate for the lost production at the country’s damaged refineries, Japan’s operational refineries increased their production capacity beyond the optimum threshold of 90% set by Japan’s oil companies and even peaked at 96% by the end of March 2011.
3.4.1 Refineries
Company
Location of damaged
refinery and production
capacity(bpd)
Main damage caused by the earthquake
Main damage caused by the
tsunami
Date of resumption of
operations
Amount of damage (2011)
JX NIPPON OIL
Sendai
(145 000)
Kashima
(189 000)
Negishi
(270 000)
(see p. 37)
ground subsidence; road
liquefaction; bent pipes
minor equipment damage
site submerged(see p. 37)
port facilities (unloading
facilities, roads, pipes)
/
tank yards on 21 March 2011
refining units at full capacity on 9
March 2012
4 June 2011
13 March 2011
¥92bn(€920m)of which ¥50bn
in damage
¥20bn(€200m)of which ¥1bn in production
losses
/
COSMO OILChiba
(220 000)
collapse of LPG tanks
sustained fire and string of
BLEVEs(see p. 34)
/
tank yards on 18 March 2011
refining units on 30 March 2012
¥10bn(€100m)
KYOKUTO Petroleum Industrie
Chiba
(175 000)
emergency shutdown, no
significant damage
/ 22 March 2011 1 Not reported
TONENGENERAL
Kawasaki
(335 000)
emergency shutdown, no
significant damage
/18 March 2011 Not reported
3.4 Oil and gas industry
33
3. MAIN ACCIDENTS BY INDUSTRIAL SECTOR
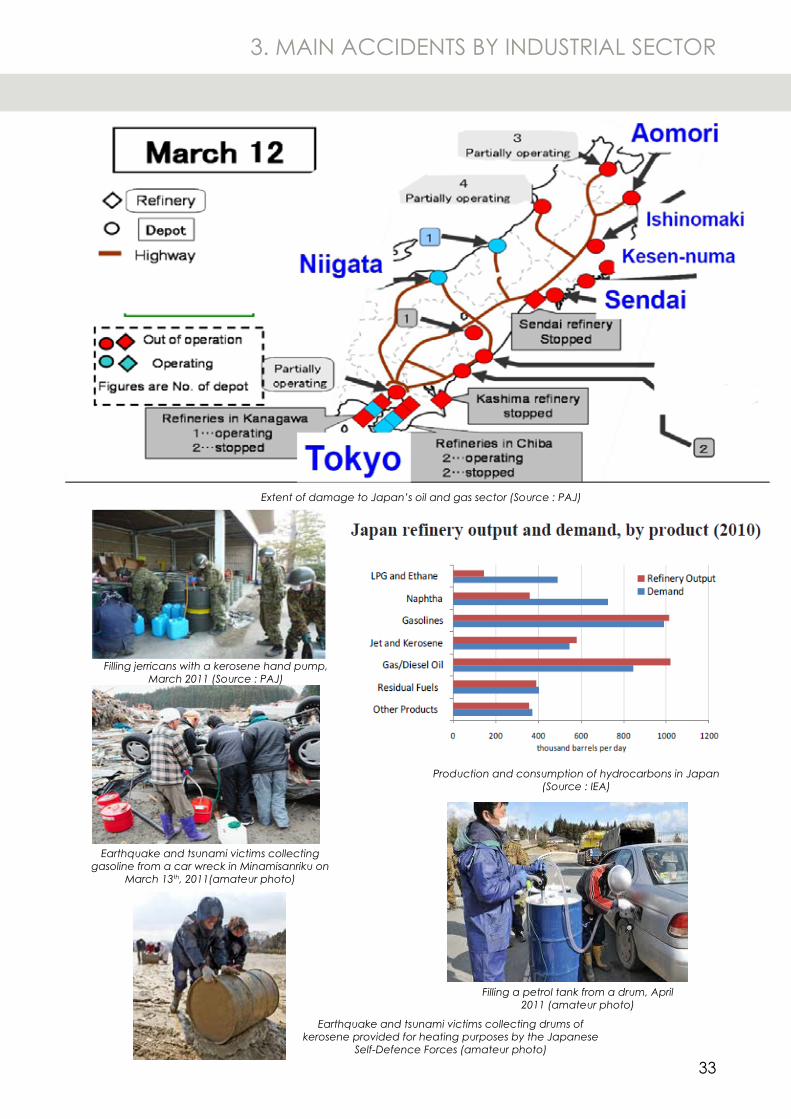
Extent of damage to Japan’s oil and gas sector (Source : PAJ)
Filling jerricans with a kerosene hand pump, March 2011 (Source : PAJ)
Earthquake and tsunami victims collecting gasoline from a car wreck in Minamisanriku on
March 13th, 2011(amateur photo)
Filling a petrol tank from a drum, April 2011 (amateur photo)
Earthquake and tsunami victims collecting drums of kerosene provided for heating purposes by the Japanese
Self-Defence Forces (amateur photo)
Production and consumption of hydrocarbons in Japan (Source : IEA)
34
3. MAIN ACCIDENTS BY INDUSTRIAL SECTOR
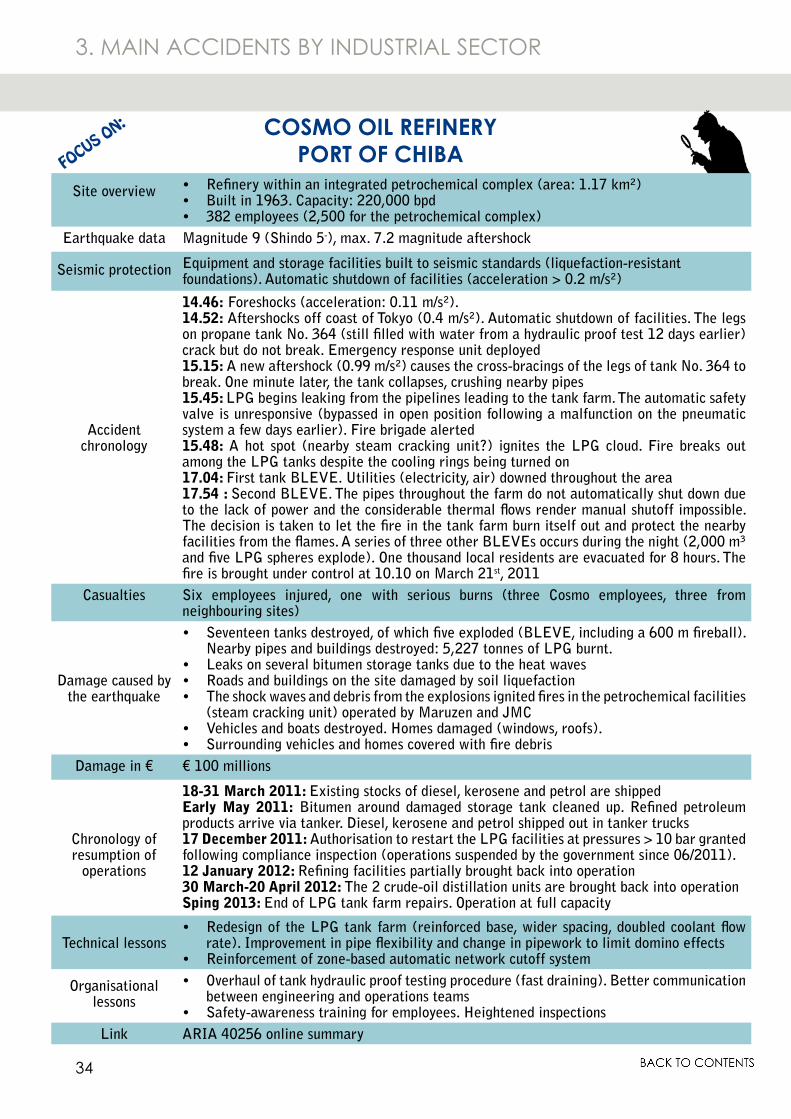
Site overview Refinery within an integrated petrochemical complex (area: 1.17 km²)•Built in 1963. Capacity: 220,000 bpd•382 employees (2,500 for the petrochemical complex)•
Earthquake data Magnitude 9 (Shindo 5-), max. 7.2 magnitude aftershock
Seismic protection Equipment and storage facilities built to seismic standards (liquefaction-resistant foundations). Automatic shutdown of facilities (acceleration > 0.2 m/s²)
Accident chronology
14.46: Foreshocks (acceleration: 0.11 m/s²).14.52: Aftershocks off coast of Tokyo (0.4 m/s²). Automatic shutdown of facilities. The legs on propane tank No. 364 (still filled with water from a hydraulic proof test 12 days earlier) crack but do not break. Emergency response unit deployed15.15: A new aftershock (0.99 m/s²) causes the cross-bracings of the legs of tank No. 364 to break. One minute later, the tank collapses, crushing nearby pipes15.45: LPG begins leaking from the pipelines leading to the tank farm. The automatic safety valve is unresponsive (bypassed in open position following a malfunction on the pneumatic system a few days earlier). Fire brigade alerted 15.48: A hot spot (nearby steam cracking unit?) ignites the LPG cloud. Fire breaks out among the LPG tanks despite the cooling rings being turned on17.04: First tank BLEVE. Utilities (electricity, air) downed throughout the area17.54 : Second BLEVE. The pipes throughout the farm do not automatically shut down due to the lack of power and the considerable thermal flows render manual shutoff impossible. The decision is taken to let the fire in the tank farm burn itself out and protect the nearby facilities from the flames. A series of three other BLEVEs occurs during the night (2,000 m³ and five LPG spheres explode). One thousand local residents are evacuated for 8 hours. The fire is brought under control at 10.10 on March 21st, 2011
Casualties Six employees injured, one with serious burns (three Cosmo employees, three from neighbouring sites)
Damage caused by the earthquake
Seventeen tanks destroyed, of which five exploded (BLEVE, including a 600 m fireball). •Nearby pipes and buildings destroyed: 5,227 tonnes of LPG burnt.Leaks on several bitumen storage tanks due to the heat waves•Roads and buildings on the site damaged by soil liquefaction•The shock waves and debris from the explosions ignited fires in the petrochemical facilities •(steam cracking unit) operated by Maruzen and JMCVehicles and boats destroyed. Homes damaged (windows, roofs).•Surrounding vehicles and homes covered with fire debris•
Damage in € € 100 millions
Chronology of resumption of
operations
18-31 March 2011: Existing stocks of diesel, kerosene and petrol are shippedEarly May 2011: Bitumen around damaged storage tank cleaned up. Refined petroleum products arrive via tanker. Diesel, kerosene and petrol shipped out in tanker trucks17 December 2011: Authorisation to restart the LPG facilities at pressures > 10 bar granted following compliance inspection (operations suspended by the government since 06/2011).12 January 2012: Refining facilities partially brought back into operation30 March-20 April 2012: The 2 crude-oil distillation units are brought back into operationSping 2013: End of LPG tank farm repairs. Operation at full capacity
Technical lessonsRedesign of the LPG tank farm (reinforced base, wider spacing, doubled coolant flow •rate). Improvement in pipe flexibility and change in pipework to limit domino effectsReinforcement of zone-based automatic network cutoff system•
Organisational lessons
Overhaul of tank hydraulic proof testing procedure (fast draining). Better communication •between engineering and operations teamsSafety-awareness training for employees. Heightened inspections•
Link ARIA 40256 online summary
COSMO OIL REFINERYPORT OF CHIBAFOCUS ON:
35
3. MAIN ACCIDENTS BY INDUSTRIAL SECTOR
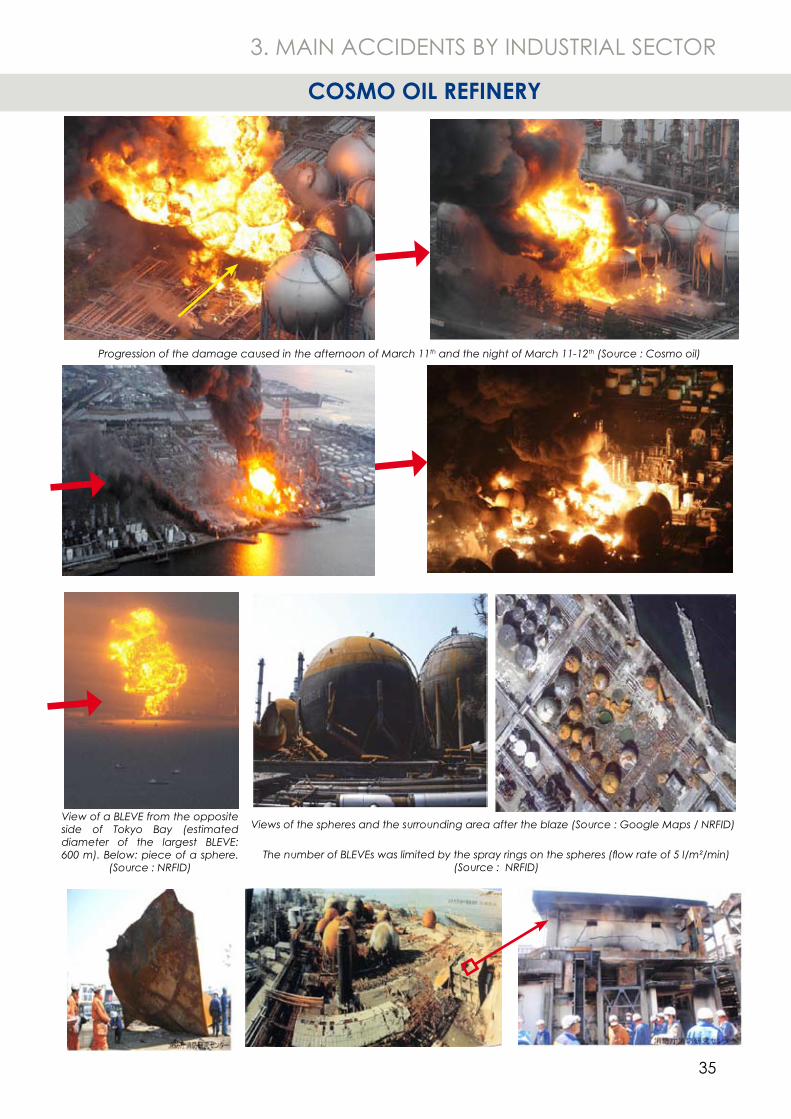
Views of the spheres and the surrounding area after the blaze (Source : Google Maps / NRFID)
Progression of the damage caused in the afternoon of March 11th and the night of March 11-12th (Source : Cosmo oil)
View of a BLEVE from the opposite side of Tokyo Bay (estimated diameter of the largest BLEVE: 600 m). Below: piece of a sphere.
(Source : NRFID)The number of BLEVEs was limited by the spray rings on the spheres (flow rate of 5 l/m²/min)
(Source : NRFID)
COSMO OIL REFINERY
36
3. MAIN ACCIDENTS BY INDUSTRIAL SECTOR
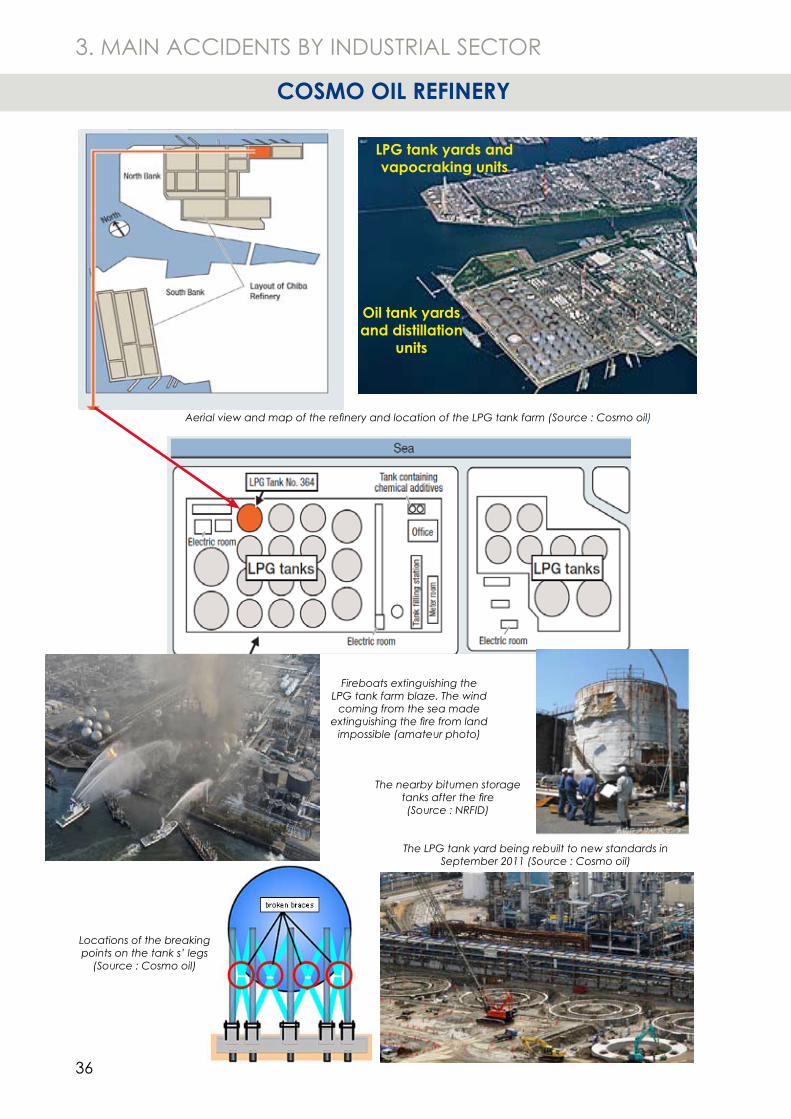
The LPG tank yard being rebuilt to new standards in September 2011 (Source : Cosmo oil)
Fireboats extinguishing the LPG tank farm blaze. The wind
coming from the sea made extinguishing the fire from land
impossible (amateur photo)
Locations of the breaking points on the tank s’ legs
(Source : Cosmo oil)
Aerial view and map of the refinery and location of the LPG tank farm (Source : Cosmo oil)
The nearby bitumen storage tanks after the fire (Source : NRFID)
LPG tank yards and vapocraking units
Oil tank yards and distillation
units
COSMO OIL REFINERY
37
3. MAIN ACCIDENTS BY INDUSTRIAL SECTOR
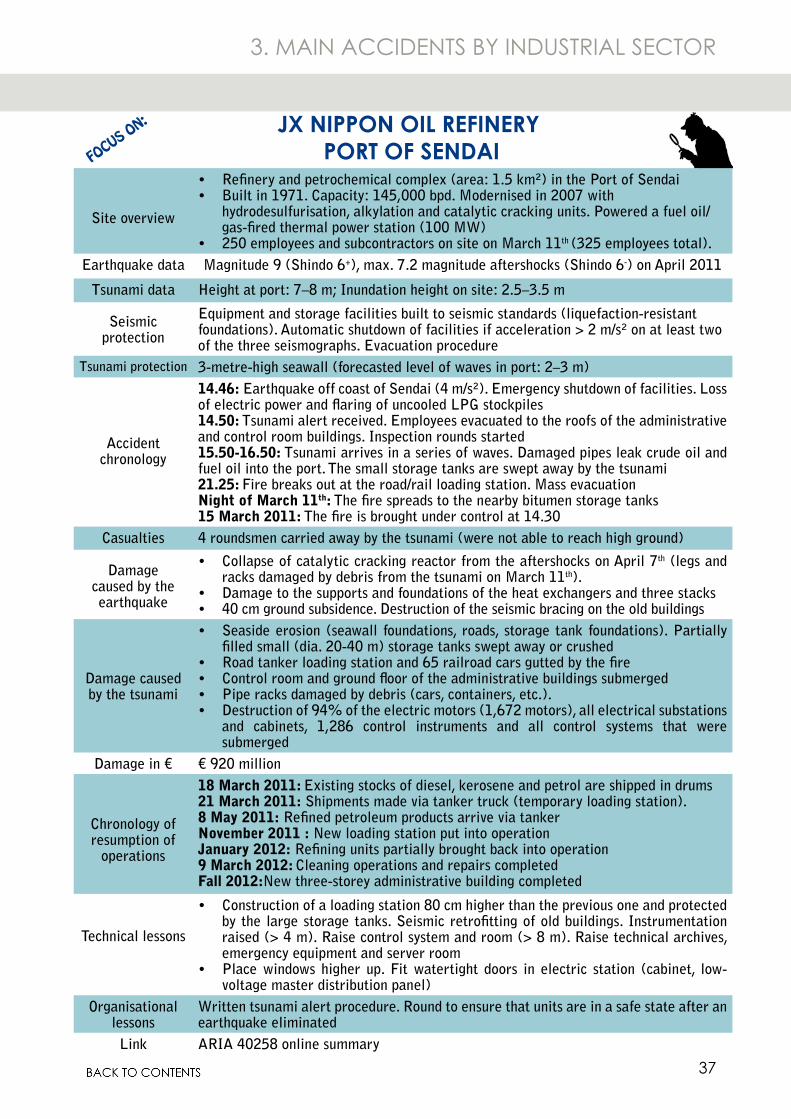
Site overview
Refinery and petrochemical complex (area: 1.5 km²) in the Port of Sendai•Built in 1971. Capacity: 145,000 bpd. Modernised in 2007 with •hydrodesulfurisation, alkylation and catalytic cracking units. Powered a fuel oil/gas-fired thermal power station (100 MW)250 employees and subcontractors on site on March 11• th (325 employees total).
Earthquake data Magnitude 9 (Shindo 6+), max. 7.2 magnitude aftershocks (Shindo 6-) on April 2011
Tsunami data Height at port: 7–8 m; Inundation height on site: 2.5–3.5 m
Seismic protection
Equipment and storage facilities built to seismic standards (liquefaction-resistant foundations). Automatic shutdown of facilities if acceleration > 2 m/s² on at least two of the three seismographs. Evacuation procedure
Tsunami protection 3-metre-high seawall (forecasted level of waves in port: 2–3 m)
Accident chronology
14.46: Earthquake off coast of Sendai (4 m/s²). Emergency shutdown of facilities. Loss of electric power and flaring of uncooled LPG stockpiles14.50: Tsunami alert received. Employees evacuated to the roofs of the administrative and control room buildings. Inspection rounds started15.50-16.50: Tsunami arrives in a series of waves. Damaged pipes leak crude oil and fuel oil into the port. The small storage tanks are swept away by the tsunami21.25: Fire breaks out at the road/rail loading station. Mass evacuationNight of March 11th: The fire spreads to the nearby bitumen storage tanks15 March 2011: The fire is brought under control at 14.30
Casualties 4 roundsmen carried away by the tsunami (were not able to reach high ground)
Damage caused by the earthquake
Collapse of catalytic cracking reactor from the aftershocks on April 7• th (legs and racks damaged by debris from the tsunami on March 11th).Damage to the supports and foundations of the heat exchangers and three stacks•40 cm ground subsidence. Destruction of the seismic bracing on the old buildings•
Damage caused by the tsunami
Seaside erosion (seawall foundations, roads, storage tank foundations). Partially •filled small (dia. 20-40 m) storage tanks swept away or crushedRoad tanker loading station and 65 railroad cars gutted by the fire•Control room and ground floor of the administrative buildings submerged•Pipe racks damaged by debris (cars, containers, etc.).•Destruction of 94% of the electric motors (1,672 motors), all electrical substations •and cabinets, 1,286 control instruments and all control systems that were submerged
Damage in € € 920 million
Chronology of resumption of
operations
18 March 2011: Existing stocks of diesel, kerosene and petrol are shipped in drums21 March 2011: Shipments made via tanker truck (temporary loading station).8 May 2011: Refined petroleum products arrive via tankerNovember 2011 : New loading station put into operationJanuary 2012: Refining units partially brought back into operation9 March 2012: Cleaning operations and repairs completedFall 2012:New three-storey administrative building completed
Technical lessons
Construction of a loading station 80 cm higher than the previous one and protected •by the large storage tanks. Seismic retrofitting of old buildings. Instrumentation raised (> 4 m). Raise control system and room (> 8 m). Raise technical archives, emergency equipment and server roomPlace windows higher up. Fit watertight doors in electric station (cabinet, low-•voltage master distribution panel)
Organisational lessons
Written tsunami alert procedure. Round to ensure that units are in a safe state after an earthquake eliminated
Link ARIA 40258 online summary
JX NIPPON OIL REFINERY PORT OF SENDAIFOCUS ON:
38
3. MAIN ACCIDENTS BY INDUSTRIAL SECTOR
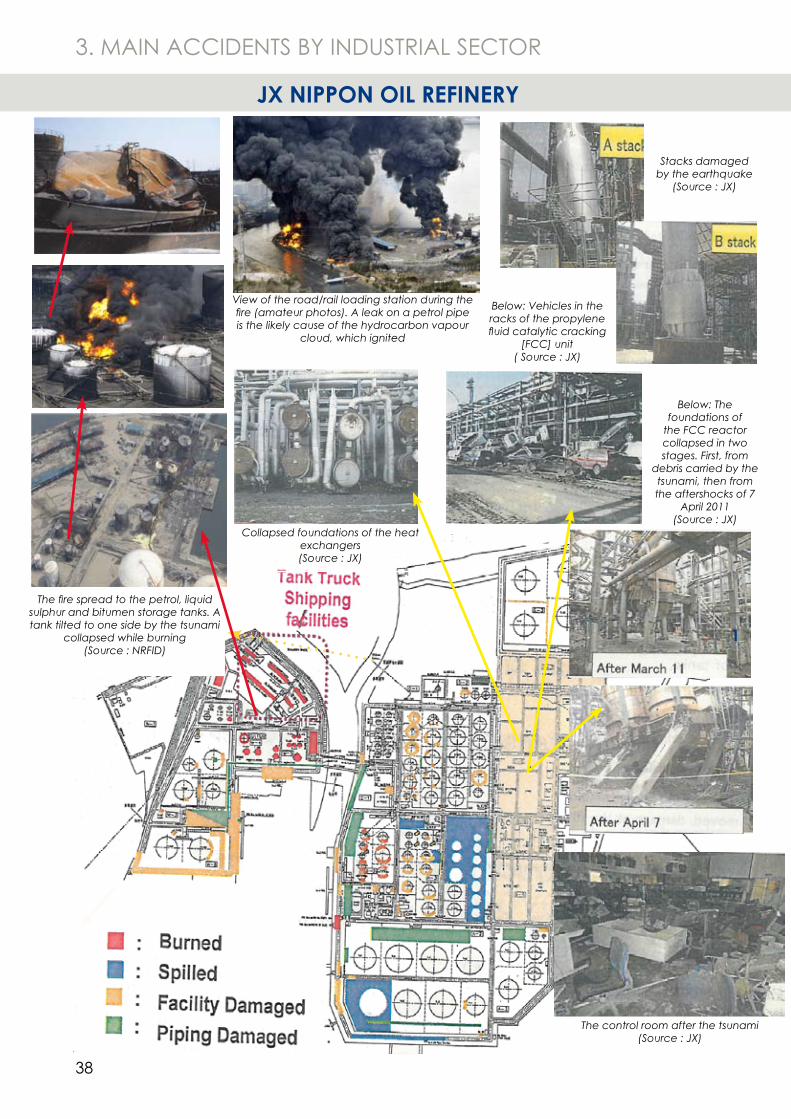
Below: Vehicles in the racks of the propylene fluid catalytic cracking
[FCC] unit ( Source : JX)
Collapsed foundations of the heat exchangers (Source : JX)
Below: The foundations of
the FCC reactor collapsed in two stages. First, from
debris carried by the tsunami, then from the aftershocks of 7
April 2011(Source : JX)
Stacks damaged by the earthquake
(Source : JX)
View of the road/rail loading station during the fire (amateur photos). A leak on a petrol pipe is the likely cause of the hydrocarbon vapour
cloud, which ignited
1
The control room after the tsunami(Source : JX)
JX NIPPON OIL REFINERY
The fire spread to the petrol, liquid sulphur and bitumen storage tanks. A tank tilted to one side by the tsunami
collapsed while burning(Source : NRFID)
39
3. MAIN ACCIDENTS BY INDUSTRIAL SECTOR
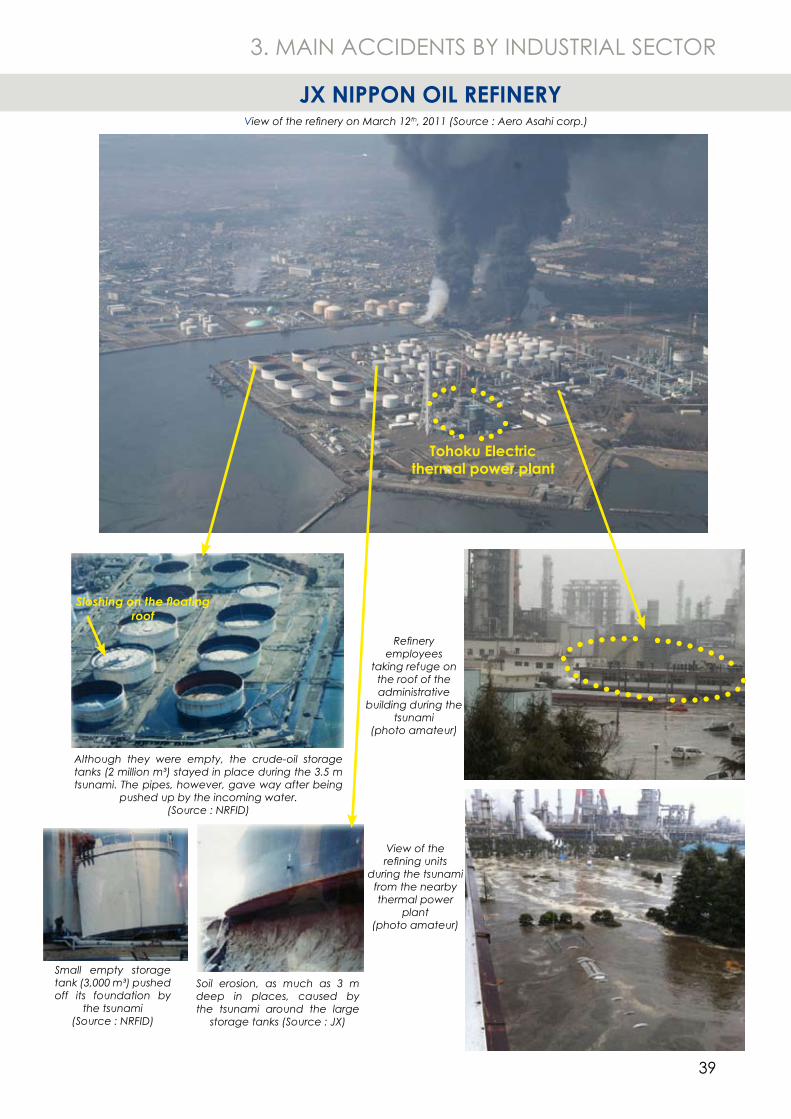
Refinery employees
taking refuge on the roof of the administrative
building during the tsunami
(photo amateur)
Although they were empty, the crude-oil storage tanks (2 million m³) stayed in place during the 3.5 m tsunami. The pipes, however, gave way after being
pushed up by the incoming water.(Source : NRFID)
Small empty storage tank (3,000 m³) pushed off its foundation by
the tsunami(Source : NRFID)
Soil erosion, as much as 3 m deep in places, caused by the tsunami around the large
storage tanks (Source : JX)
Sloshing on the floating roof
View of the refinery on March 12th, 2011 (Source : Aero Asahi corp.)
Tohoku Electric thermal power plant
View of the refining units
during the tsunami from the nearby thermal power
plant(photo amateur)
JX NIPPON OIL REFINERY
40
3. MAIN ACCIDENTS BY INDUSTRIAL SECTOR
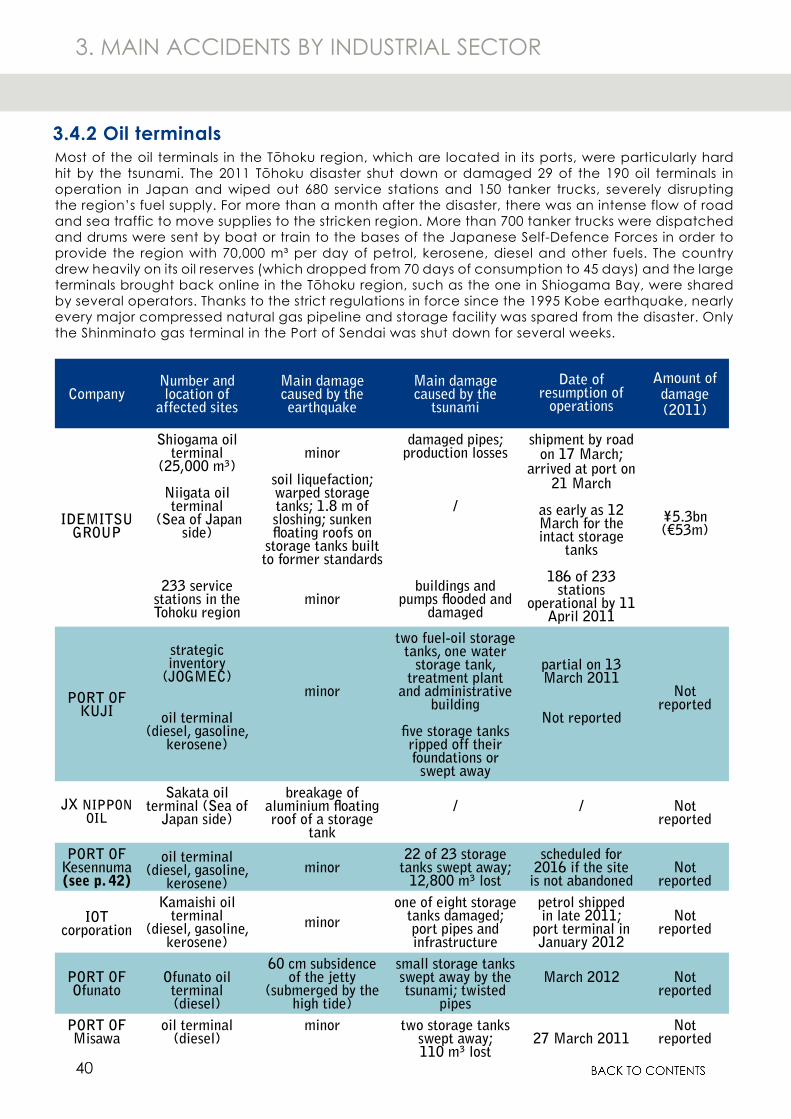
Most of the oil terminals in the Tōhoku region, which are located in its ports, were particularly hard hit by the tsunami. The 2011 Tōhoku disaster shut down or damaged 29 of the 190 oil terminals in operation in Japan and wiped out 680 service stations and 150 tanker trucks, severely disrupting the region’s fuel supply. For more than a month after the disaster, there was an intense flow of road and sea traffic to move supplies to the stricken region. More than 700 tanker trucks were dispatched and drums were sent by boat or train to the bases of the Japanese Self-Defence Forces in order to provide the region with 70,000 m³ per day of petrol, kerosene, diesel and other fuels. The country drew heavily on its oil reserves (which dropped from 70 days of consumption to 45 days) and the large terminals brought back online in the Tōhoku region, such as the one in Shiogama Bay, were shared by several operators. Thanks to the strict regulations in force since the 1995 Kobe earthquake, nearly every major compressed natural gas pipeline and storage facility was spared from the disaster. Only the Shinminato gas terminal in the Port of Sendai was shut down for several weeks.
CompanyNumber and location of
affected sites
Main damage caused by the earthquake
Main damage caused by the
tsunami
Date of resumption of
operations
Amount of damage(2011)
IDEMITSU GROUP
Shiogama oil terminal
(25,000 m³)
Niigata oil terminal
(Sea of Japan side)
233 service stations in the Tohoku region
minor
soil liquefaction; warped storage tanks; 1.8 m of sloshing; sunken floating roofs on
storage tanks built to former standards
minor
damaged pipes; production losses
/
buildings and pumps flooded and
damaged
shipment by road on 17 March;
arrived at port on 21 March
as early as 12 March for the intact storage
tanks
186 of 233 stations
operational by 11 April 2011
¥5.3bn(€53m)
PORT OF KUJI
strategic inventory
(JOGMEC)
oil terminal (diesel, gasoline,
kerosene)
minor
two fuel-oil storage tanks, one water
storage tank, treatment plant
and administrative building
five storage tanks ripped off their foundations or
swept away
partial on 13 March 2011
Not reported
Not reported
JX NIPPON OIL
Sakata oil terminal (Sea of
Japan side)
breakage of aluminium floating roof of a storage
tank
/ / Not reported
PORT OFKesennuma(see p. 42)
oil terminal(diesel, gasoline,
kerosene)minor
22 of 23 storage tanks swept away;
12,800 m³ lost
scheduled for 2016 if the site
is not abandonedNot
reported
IOTcorporation
Kamaishi oil terminal
(diesel, gasoline, kerosene)
minor
one of eight storage tanks damaged; port pipes and infrastructure
petrol shipped in late 2011;
port terminal in January 2012
Not reported
PORT OFOfunato
Ofunato oil terminal(diesel)
60 cm subsidence of the jetty
(submerged by the high tide)
small storage tanks swept away by the tsunami; twisted
pipes
March 2012 Not reported
PORT OFMisawa
oil terminal (diesel)
minor two storage tanks swept away; 110 m³ lost
27 March 2011Not
reported
3.4.2 Oil terminals
41
3. MAIN ACCIDENTS BY INDUSTRIAL SECTOR
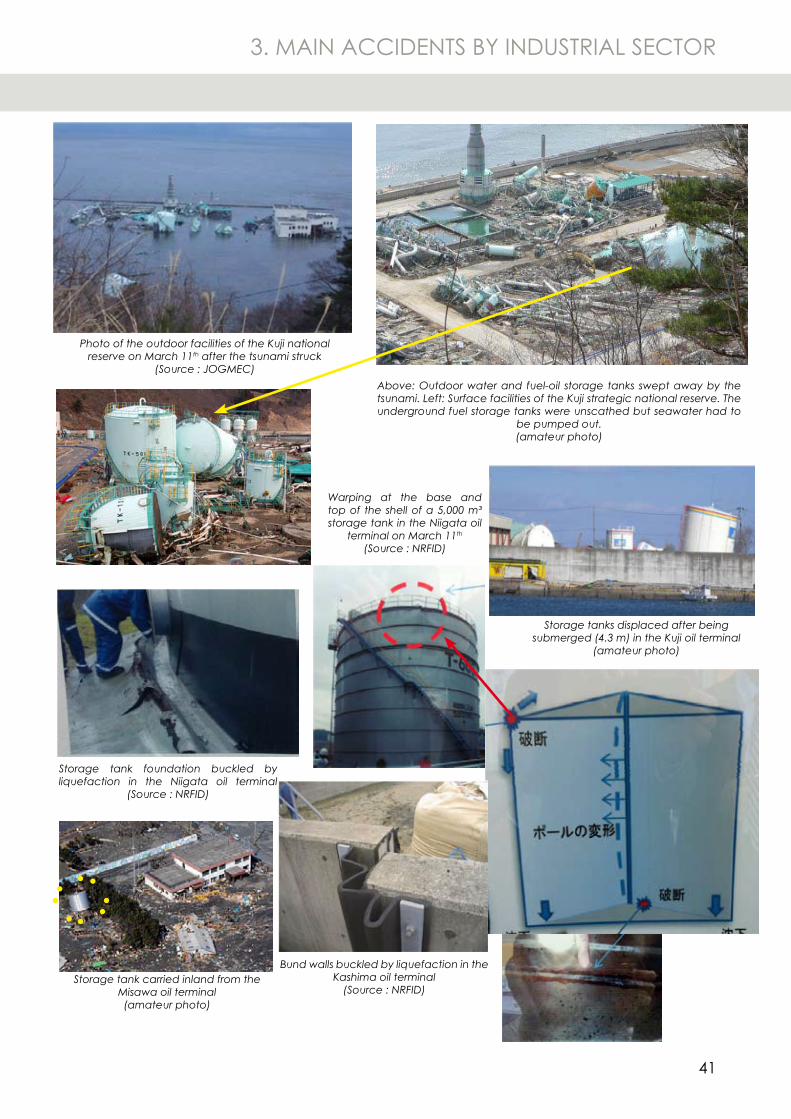
Above: Outdoor water and fuel-oil storage tanks swept away by the tsunami. Left: Surface facilities of the Kuji strategic national reserve. The underground fuel storage tanks were unscathed but seawater had to
be pumped out. (amateur photo)
Warping at the base and top of the shell of a 5,000 m³ storage tank in the Niigata oil
terminal on March 11th
(Source : NRFID)
Bund walls buckled by liquefaction in the Kashima oil terminal
(Source : NRFID)
Photo of the outdoor facilities of the Kuji national reserve on March 11th after the tsunami struck
(Source : JOGMEC)
Storage tanks displaced after being submerged (4.3 m) in the Kuji oil terminal
(amateur photo)
Storage tank carried inland from the Misawa oil terminal(amateur photo)
Storage tank foundation buckled by liquefaction in the Niigata oil terminal
(Source : NRFID)
42
3. MAIN ACCIDENTS BY INDUSTRIAL SECTOR
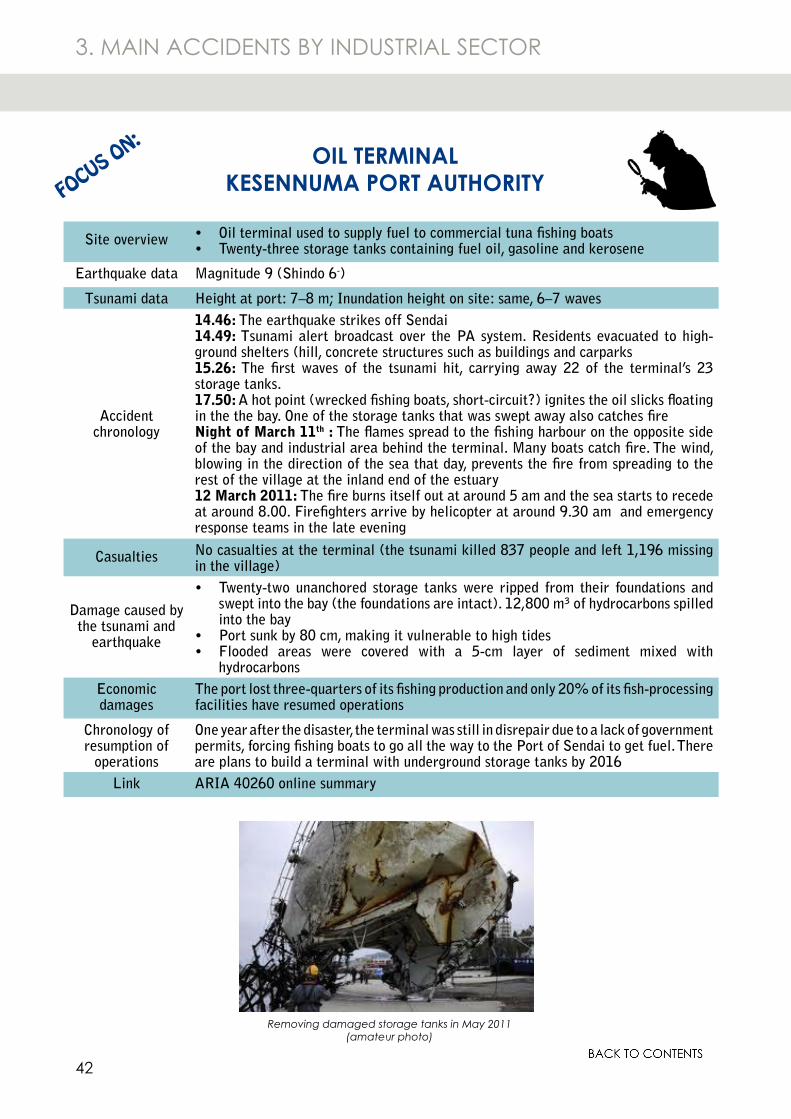
Site overview Oil terminal used to supply fuel to commercial tuna fishing boats•Twenty-three storage tanks containing fuel oil, gasoline and kerosene•
Earthquake data Magnitude 9 (Shindo 6-)
Tsunami data Height at port: 7–8 m; Inundation height on site: same, 6–7 waves
Accident chronology
14.46: The earthquake strikes off Sendai14.49: Tsunami alert broadcast over the PA system. Residents evacuated to high-ground shelters (hill, concrete structures such as buildings and carparks15.26: The first waves of the tsunami hit, carrying away 22 of the terminal’s 23 storage tanks.17.50: A hot point (wrecked fishing boats, short-circuit?) ignites the oil slicks floating in the the bay. One of the storage tanks that was swept away also catches fireNight of March 11th : The flames spread to the fishing harbour on the opposite side of the bay and industrial area behind the terminal. Many boats catch fire. The wind, blowing in the direction of the sea that day, prevents the fire from spreading to the rest of the village at the inland end of the estuary12 March 2011: The fire burns itself out at around 5 am and the sea starts to recede at around 8.00. Firefighters arrive by helicopter at around 9.30 am and emergency response teams in the late evening
Casualties No casualties at the terminal (the tsunami killed 837 people and left 1,196 missing in the village)
Damage caused by the tsunami and
earthquake
Twenty-two unanchored storage tanks were ripped from their foundations and •swept into the bay (the foundations are intact). 12,800 m³ of hydrocarbons spilled into the bayPort sunk by 80 cm, making it vulnerable to high tides•Flooded areas were covered with a 5-cm layer of sediment mixed with •hydrocarbons
Economic damages
The port lost three-quarters of its fishing production and only 20% of its fish-processing facilities have resumed operations
Chronology of resumption of
operations
One year after the disaster, the terminal was still in disrepair due to a lack of government permits, forcing fishing boats to go all the way to the Port of Sendai to get fuel. There are plans to build a terminal with underground storage tanks by 2016
Link ARIA 40260 online summary
OIL TERMINALKESENNUMA PORT AUTHORITYFOCUS ON:
Removing damaged storage tanks in May 2011(amateur photo)
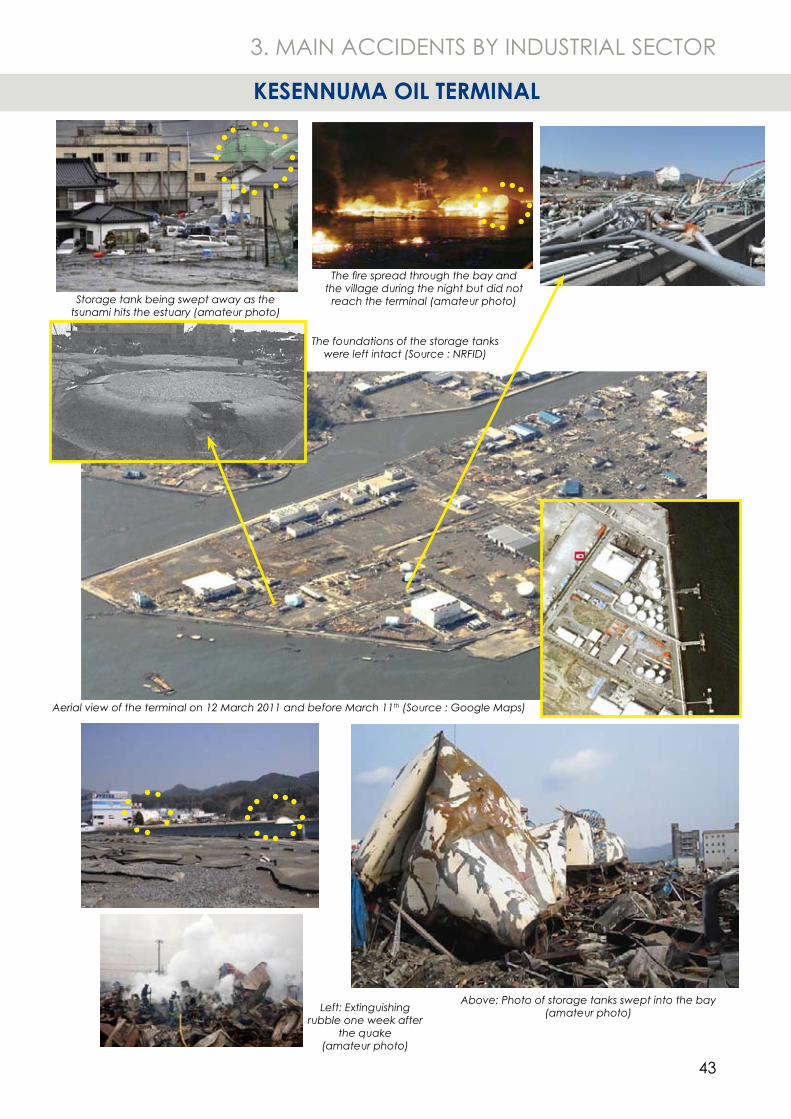
43
3. MAIN ACCIDENTS BY INDUSTRIAL SECTOR
Aerial view of the terminal on 12 March 2011 and before March 11th (Source : Google Maps)
The foundations of the storage tanks were left intact (Source : NRFID)
Storage tank being swept away as the tsunami hits the estuary (amateur photo)
The fire spread through the bay and the village during the night but did not
reach the terminal (amateur photo)
Above: Photo of storage tanks swept into the bay(amateur photo)Left: Extinguishing
rubble one week after the quake
(amateur photo)
KESENNUMA OIL TERMINAL
44
3. MAIN ACCIDENTS BY INDUSTRIAL SECTOR
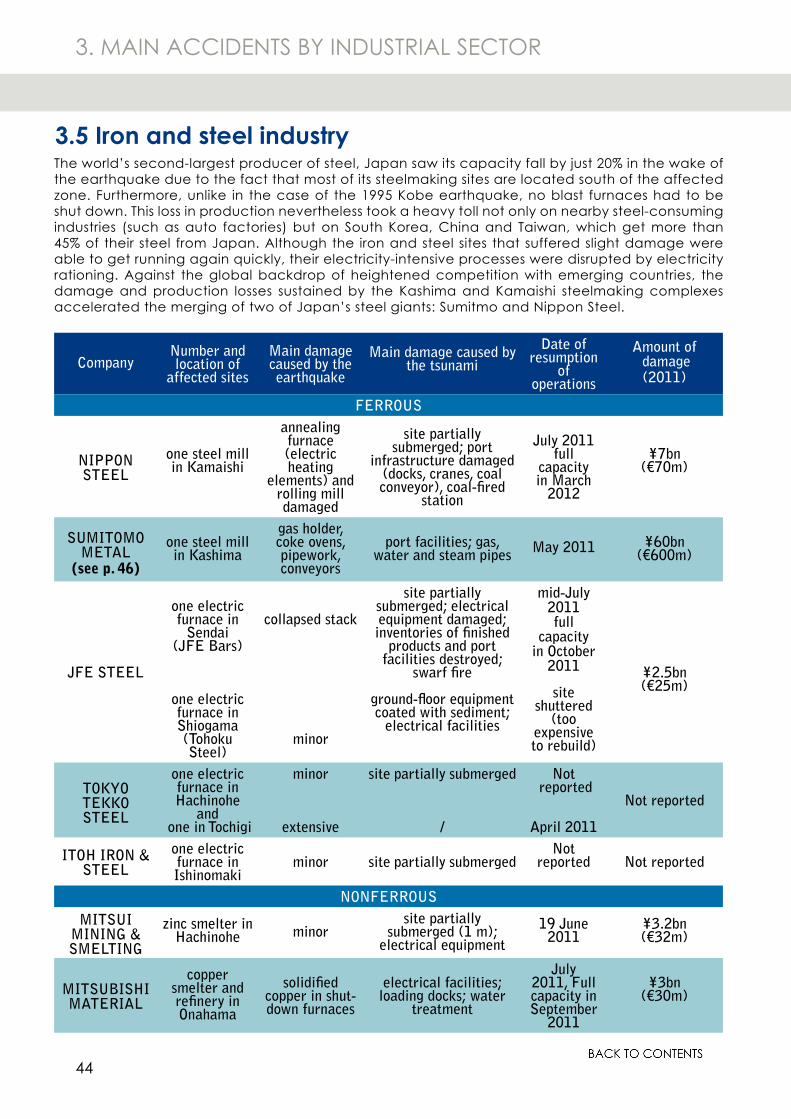
The world’s second-largest producer of steel, Japan saw its capacity fall by just 20% in the wake of the earthquake due to the fact that most of its steelmaking sites are located south of the affected zone. Furthermore, unlike in the case of the 1995 Kobe earthquake, no blast furnaces had to be shut down. This loss in production nevertheless took a heavy toll not only on nearby steel-consuming industries (such as auto factories) but on South Korea, China and Taiwan, which get more than 45% of their steel from Japan. Although the iron and steel sites that suffered slight damage were able to get running again quickly, their electricity-intensive processes were disrupted by electricity rationing. Against the global backdrop of heightened competition with emerging countries, the damage and production losses sustained by the Kashima and Kamaishi steelmaking complexes accelerated the merging of two of Japan’s steel giants: Sumitmo and Nippon Steel.
CompanyNumber and location of
affected sites
Main damage caused by the earthquake
Main damage caused by the tsunami
Date of resumption
of operations
Amount of damage(2011)
FERROUS
NIPPON STEEL
one steel mill in Kamaishi
annealing furnace (electric heating
elements) and rolling mill damaged
site partially submerged; port
infrastructure damaged (docks, cranes, coal conveyor), coal-fired
station
July 2011full
capacity in March
2012
¥7bn(€70m)
SUMITOMOMETAL
(see p. 46)
one steel mill in Kashima
gas holder, coke ovens, pipework, conveyors
port facilities; gas, water and steam pipes May 2011 ¥60bn
(€600m)
JFE STEEL
one electric furnace in
Sendai(JFE Bars)
one electric furnace in Shiogama (Tohoku Steel)
collapsed stack
minor
site partially submerged; electrical equipment damaged; inventories of finished
products and port facilities destroyed;
swarf fire
ground-floor equipment coated with sediment;
electrical facilities
mid-July 2011full
capacity in October
2011
site shuttered
(too expensive to rebuild)
¥2.5bn(€25m)
TOKYO TEKKO STEEL
one electric furnace in Hachinohe
and one in Tochigi
minor
extensive
site partially submerged
/
Not reported
April 2011
Not reported
ITOH IRON & STEEL
one electric furnace in Ishinomaki
minor site partially submerged Not
reported Not reported
NONFERROUS
MITSUI MINING & SMELTING
zinc smelter in Hachinohe minor
site partially submerged (1 m);
electrical equipment19 June
2011¥3.2bn(€32m)
MITSUBISHI MATERIAL
copper smelter and refinery in Onahama
solidified copper in shut-down furnaces
electrical facilities; loading docks; water
treatment
July 2011, Full capacity in September
2011
¥3bn(€30m)
3.5 Iron and steel industry
45
Stocks de poutrelles endommagées par
l’eau de mer
3. MAIN ACCIDENTS BY INDUSTRIAL SECTOR
CompanyNumber and location of
affected sites
Main damage caused by the earthquake
Main damage caused by the tsunami
Date of resumption
of operations
Amount of damage(2011)
SUMITOMO METAL MINING
copper smelter in Toyo
damaged furnace site partially submerged (1 m)
June 2011
¥442m(€4.4m)
PACIFIC METALS
nickel-iron smelter in Hachinohe
minorpartially submerged
inventories of finished products; port
facilities
mid-June 2011
¥20bn(€200m)including
production losses
TOYO ZINCzinc and copper
smelter in Onahama
solidification du solidified copper
in shut-down furnaces
none on site; damage to port infrastructure
partial on 10 June
2011 Not reported
JX NIPPON mining & metal
works inIsohara
works in Hitachi
buildings; production
equipment (falls or displacement)
/
partial, mid-April 2011
full capacity in summer
2011
¥8bn(€80m)
of which ¥1bn in production
losses
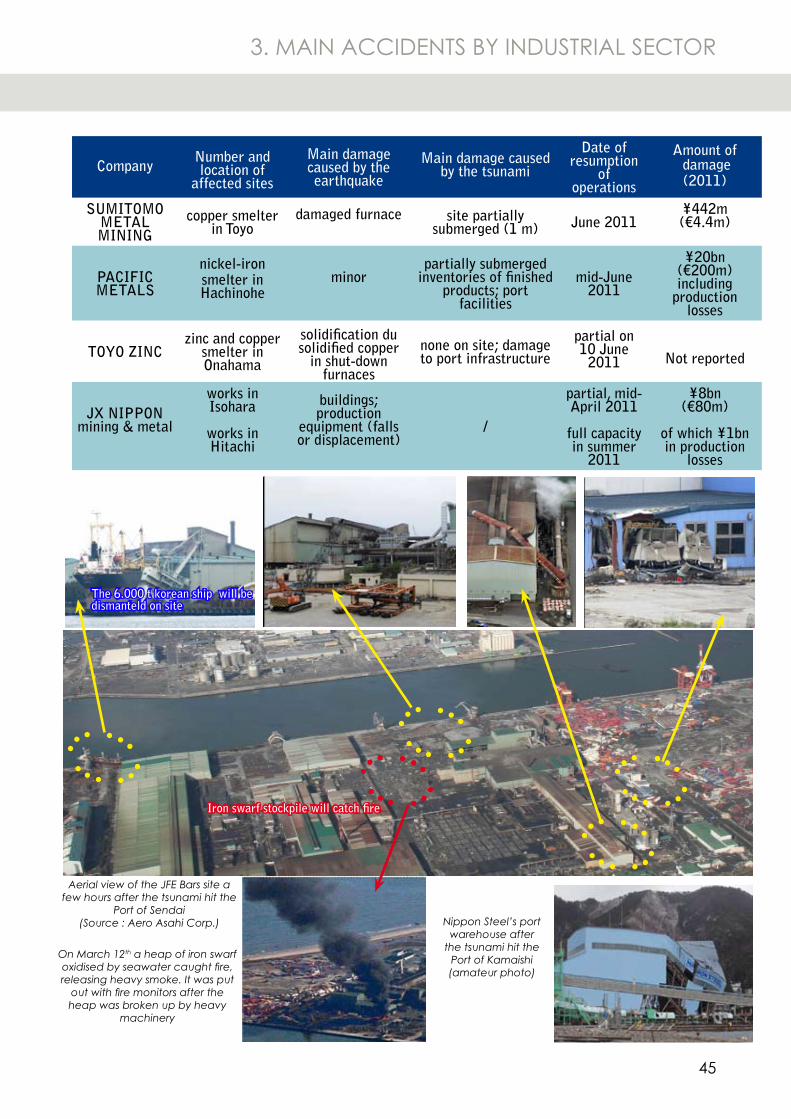
Aerial view of the JFE Bars site a few hours after the tsunami hit the
Port of Sendai(Source : Aero Asahi Corp.)
Iron swarf stockpile will catch fire
The 6.000 t korean ship will be dismanteld on site
Nippon Steel’s port warehouse after
the tsunami hit the Port of Kamaishi(amateur photo)
On March 12th a heap of iron swarf oxidised by seawater caught fire, releasing heavy smoke. It was put
out with fire monitors after the heap was broken up by heavy
machinery
46
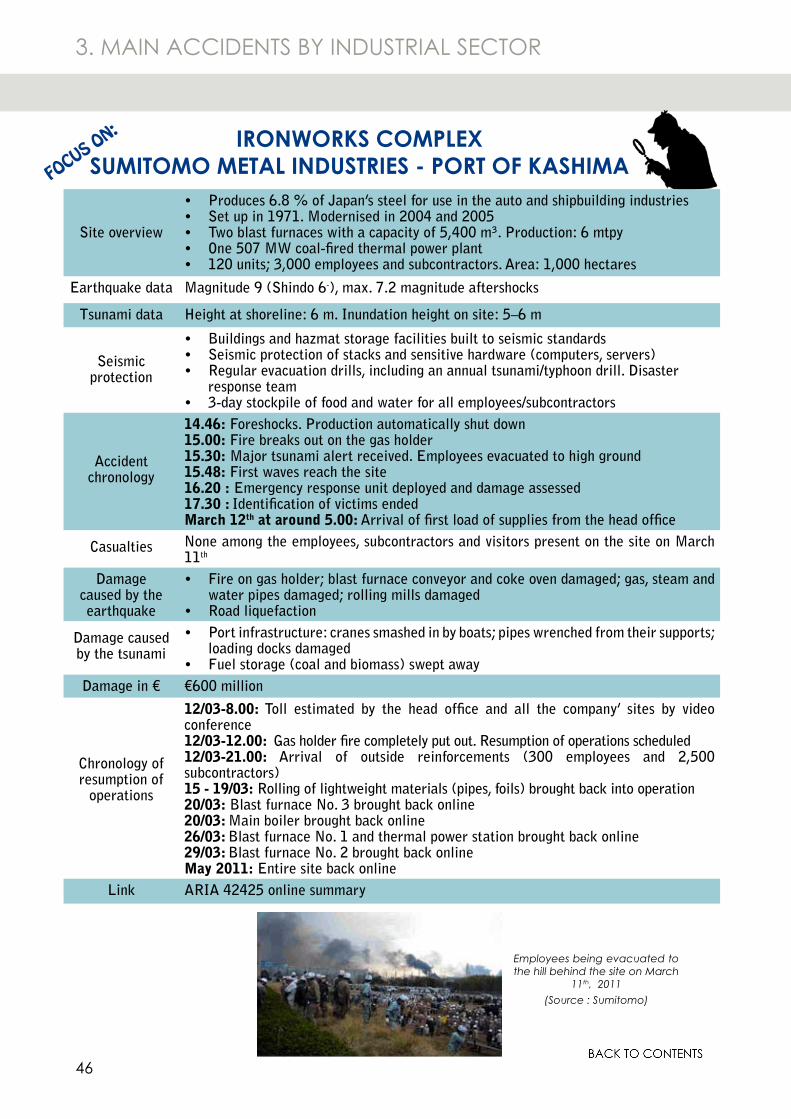
Employees being evacuated to the hill behind the site on March
11th, 2011(Source : Sumitomo)
3. MAIN ACCIDENTS BY INDUSTRIAL SECTOR
Site overview
Produces 6.8 % of Japan’s steel for use in the auto and shipbuilding industries•Set up in 1971. Modernised in 2004 and 2005•Two blast furnaces with a capacity of 5,400 m³. Production: 6 mtpy •One 507 MW coal-fired thermal power plant•120 units; 3,000 employees and subcontractors. Area: 1,000 hectares•
Earthquake data Magnitude 9 (Shindo 6-), max. 7.2 magnitude aftershocks
Tsunami data Height at shoreline: 6 m. Inundation height on site: 5–6 m
Seismic protection
Buildings and hazmat storage facilities built to seismic standards•Seismic protection of stacks and sensitive hardware (computers, servers)•Regular evacuation drills, including an annual tsunami/typhoon drill. Disaster •response team3-day stockpile of food and water for all employees/subcontractors •
Accident chronology
14.46: Foreshocks. Production automatically shut down15.00: Fire breaks out on the gas holder15.30: Major tsunami alert received. Employees evacuated to high ground15.48: First waves reach the site 16.20 : Emergency response unit deployed and damage assessed17.30 : Identification of victims endedMarch 12th at around 5.00: Arrival of first load of supplies from the head office
Casualties None among the employees, subcontractors and visitors present on the site on March 11th
Damage caused by the earthquake
Fire on gas holder; blast furnace conveyor and coke oven damaged; gas, steam and •water pipes damaged; rolling mills damagedRoad liquefaction•
Damage caused by the tsunami
Port infrastructure: cranes smashed in by boats; pipes wrenched from their supports; •loading docks damagedFuel storage (coal and biomass) swept away•
Damage in € €600 million
Chronology of resumption of
operations
12/03-8.00: Toll estimated by the head office and all the company’ sites by video conference12/03-12.00: Gas holder fire completely put out. Resumption of operations scheduled12/03-21.00: Arrival of outside reinforcements (300 employees and 2,500 subcontractors)15 - 19/03: Rolling of lightweight materials (pipes, foils) brought back into operation20/03: Blast furnace No. 3 brought back online 20/03: Main boiler brought back online26/03: Blast furnace No. 1 and thermal power station brought back online29/03: Blast furnace No. 2 brought back onlineMay 2011: Entire site back online
Link ARIA 42425 online summary
IRONWORKS COMPLEXSUMITOMO METAL INDUSTRIES - PORT OF KASHIMAFOCUS ON:
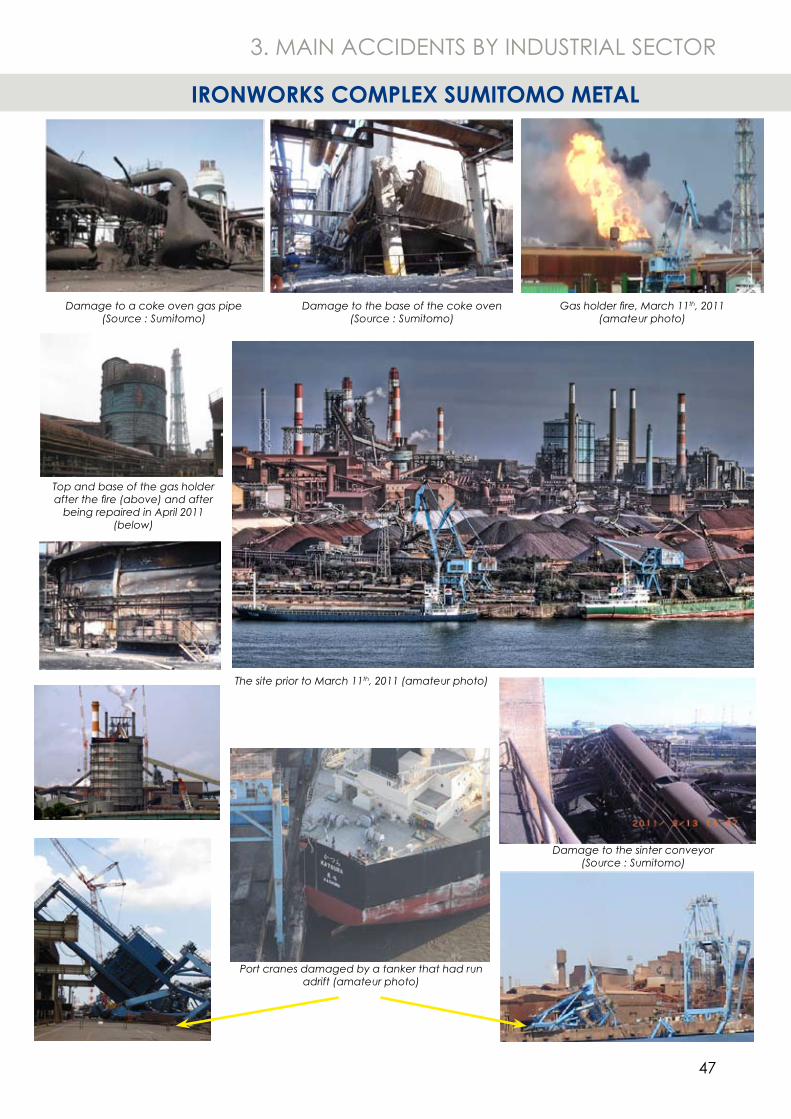
47
Port cranes damaged by a tanker that had run adrift (amateur photo)
Damage to the sinter conveyor (Source : Sumitomo)
Top and base of the gas holder after the fire (above) and after
being repaired in April 2011 (below)
Gas holder fire, March 11th, 2011 (amateur photo)
Damage to the base of the coke oven (Source : Sumitomo)
Damage to a coke oven gas pipe (Source : Sumitomo)
3. MAIN ACCIDENTS BY INDUSTRIAL SECTOR
The site prior to March 11th, 2011 (amateur photo)
IRONWORKS COMPLEX SUMITOMO METAL
48
3. MAIN ACCIDENTS BY INDUSTRIAL SECTOR
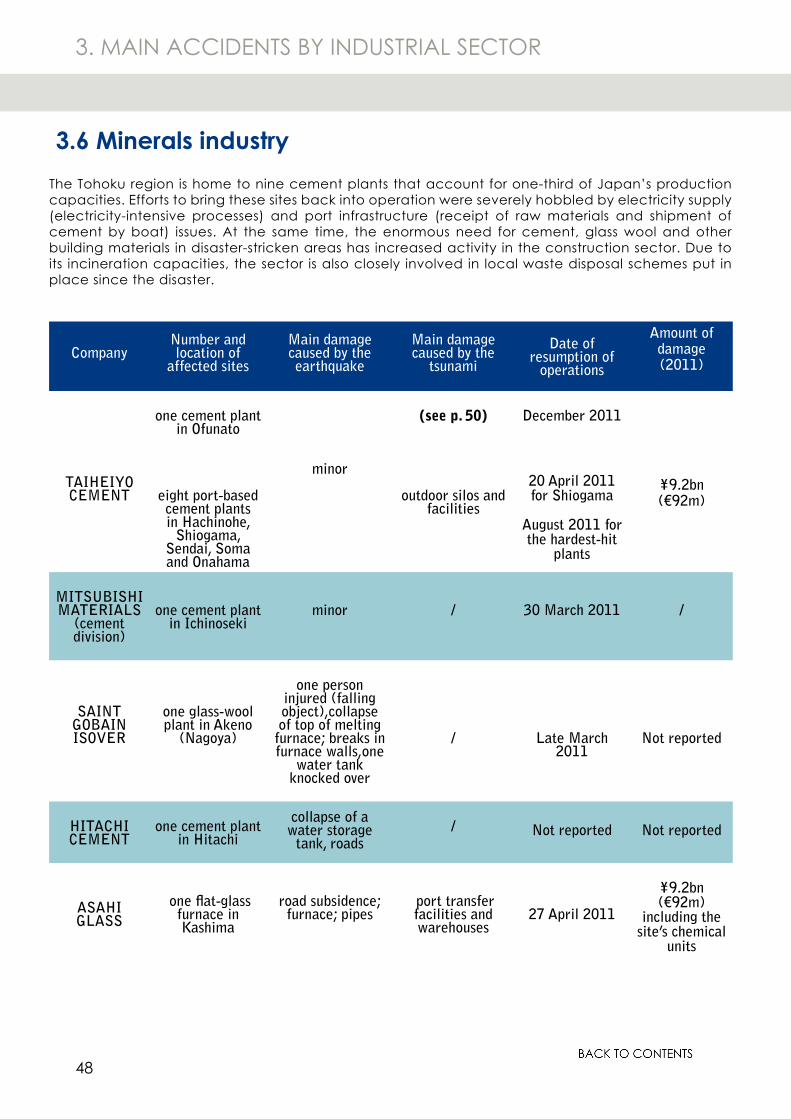
The Tohoku region is home to nine cement plants that account for one-third of Japan’s production capacities. Efforts to bring these sites back into operation were severely hobbled by electricity supply (electricity-intensive processes) and port infrastructure (receipt of raw materials and shipment of cement by boat) issues. At the same time, the enormous need for cement, glass wool and other building materials in disaster-stricken areas has increased activity in the construction sector. Due to its incineration capacities, the sector is also closely involved in local waste disposal schemes put in place since the disaster.
CompanyNumber and location of
affected sites
Main damage caused by the earthquake
Main damage caused by the
tsunami
Date of resumption of
operations
Amount of damage(2011)
TAIHEIYO CEMENT
one cement plant in Ofunato
eight port-based cement plants in Hachinohe,
Shiogama, Sendai, Soma and Onahama
minor
(see p. 50)
outdoor silos and facilities
December 2011
20 April 2011 for Shiogama
August 2011 for the hardest-hit
plants
¥9.2bn(€92m)
MITSUBISHI MATERIALS
(cement division)
one cement plant in Ichinoseki
minor / 30 March 2011 /
SAINT GOBAIN ISOVER
one glass-wool plant in Akeno
(Nagoya)
one person injured (falling object),collapse of top of melting
furnace; breaks in furnace walls,one
water tank knocked over
/ Late March 2011
Not reported
HITACHI CEMENT
one cement plant in Hitachi
collapse of a water storage
tank, roads / Not reported Not reported
ASAHI GLASS
one flat-glass furnace in Kashima
road subsidence; furnace; pipes
port transferfacilities and warehouses
27 April 2011
¥9.2bn(€92m)
including the site’s chemical
units
3.6 Minerals industry
49
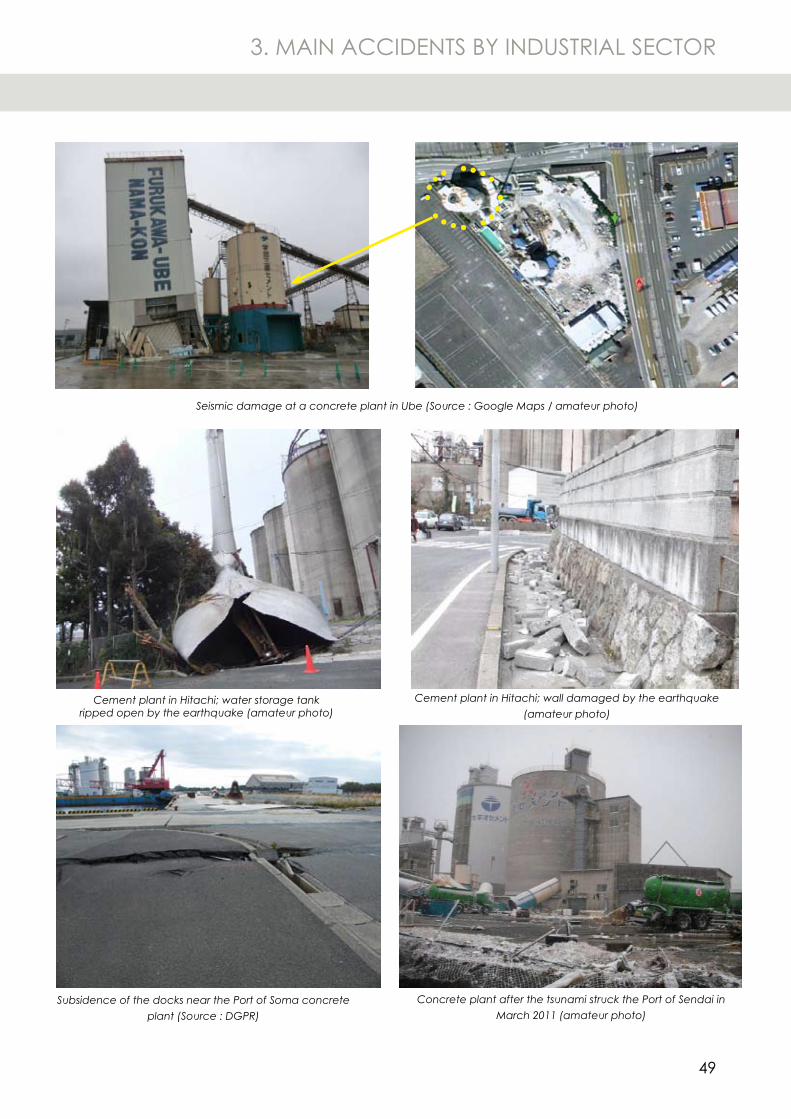
Cement plant in Hitachi; water storage tank ripped open by the earthquake (amateur photo)
Seismic damage at a concrete plant in Ube (Source : Google Maps / amateur photo)
Concrete plant after the tsunami struck the Port of Sendai in March 2011 (amateur photo)
Subsidence of the docks near the Port of Soma concrete plant (Source : DGPR)
Cement plant in Hitachi; wall damaged by the earthquake (amateur photo)
3. MAIN ACCIDENTS BY INDUSTRIAL SECTOR
50
3. MAIN ACCIDENTS BY INDUSTRIAL SECTOR
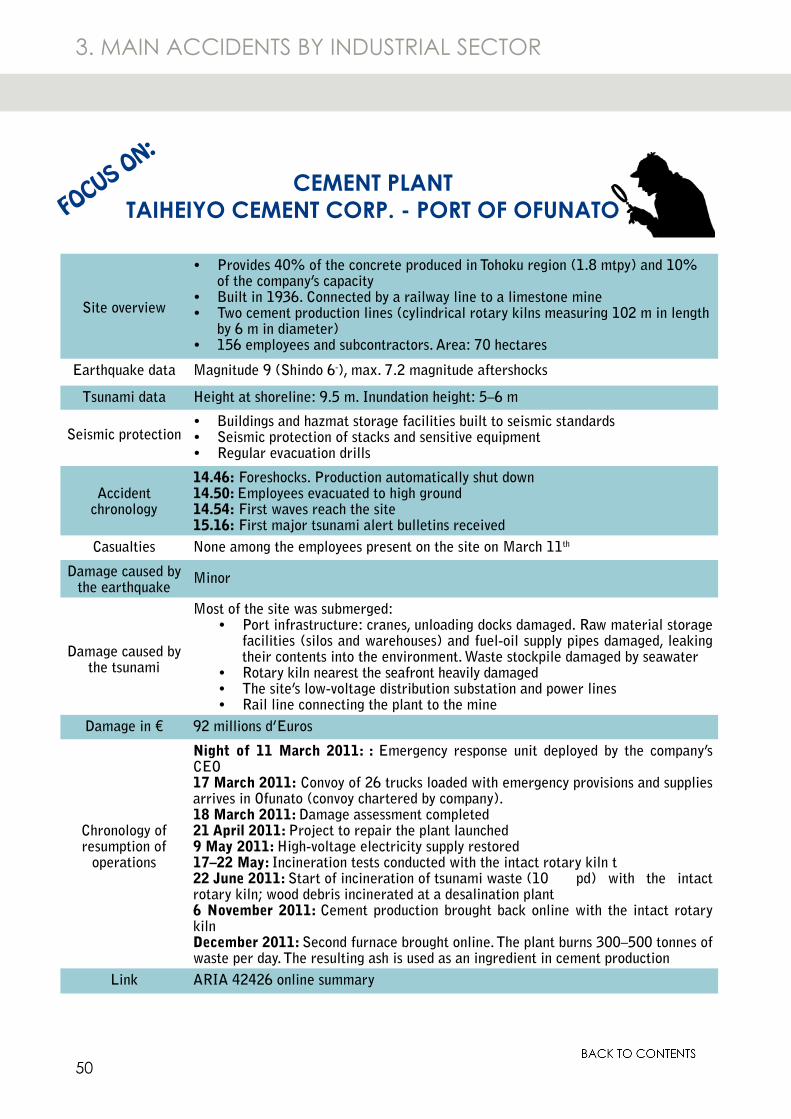
Site overview
Provides 40% of the concrete produced in Tohoku region (1.8 mtpy) and 10% •of the company’s capacityBuilt in 1936. Connected by a railway line to a limestone mine•Two cement production lines (cylindrical rotary kilns measuring 102 m in length •by 6 m in diameter)156 employees and subcontractors. Area: 70 hectares•
Earthquake data Magnitude 9 (Shindo 6-), max. 7.2 magnitude aftershocks
Tsunami data Height at shoreline: 9.5 m. Inundation height: 5–6 m
Seismic protectionBuildings and hazmat storage facilities built to seismic standards•Seismic protection of stacks and sensitive equipment •Regular evacuation drills •
Accident chronology
14.46: Foreshocks. Production automatically shut down14.50: Employees evacuated to high ground14.54: First waves reach the site15.16: First major tsunami alert bulletins received
Casualties None among the employees present on the site on March 11th
Damage caused by the earthquake
Minor
Damage caused by the tsunami
Most of the site was submerged:Port infrastructure: cranes, unloading docks damaged. Raw material storage •facilities (silos and warehouses) and fuel-oil supply pipes damaged, leaking their contents into the environment. Waste stockpile damaged by seawaterRotary kiln nearest the seafront heavily damaged•The site’s low-voltage distribution substation and power lines•Rail line connecting the plant to the mine•
Damage in € 92 millions d’Euros
Chronology of resumption of
operations
Night of 11 March 2011: : Emergency response unit deployed by the company’s CEO17 March 2011: Convoy of 26 trucks loaded with emergency provisions and supplies arrives in Ofunato (convoy chartered by company).18 March 2011: Damage assessment completed21 April 2011: Project to repair the plant launched9 May 2011: High-voltage electricity supply restored17–22 May: Incineration tests conducted with the intact rotary kiln t 22 June 2011: Start of incineration of tsunami waste (10 pd) with the intact rotary kiln; wood debris incinerated at a desalination plant6 November 2011: Cement production brought back online with the intact rotary kilnDecember 2011: Second furnace brought online. The plant burns 300–500 tonnes of waste per day. The resulting ash is used as an ingredient in cement production
Link ARIA 42426 online summary
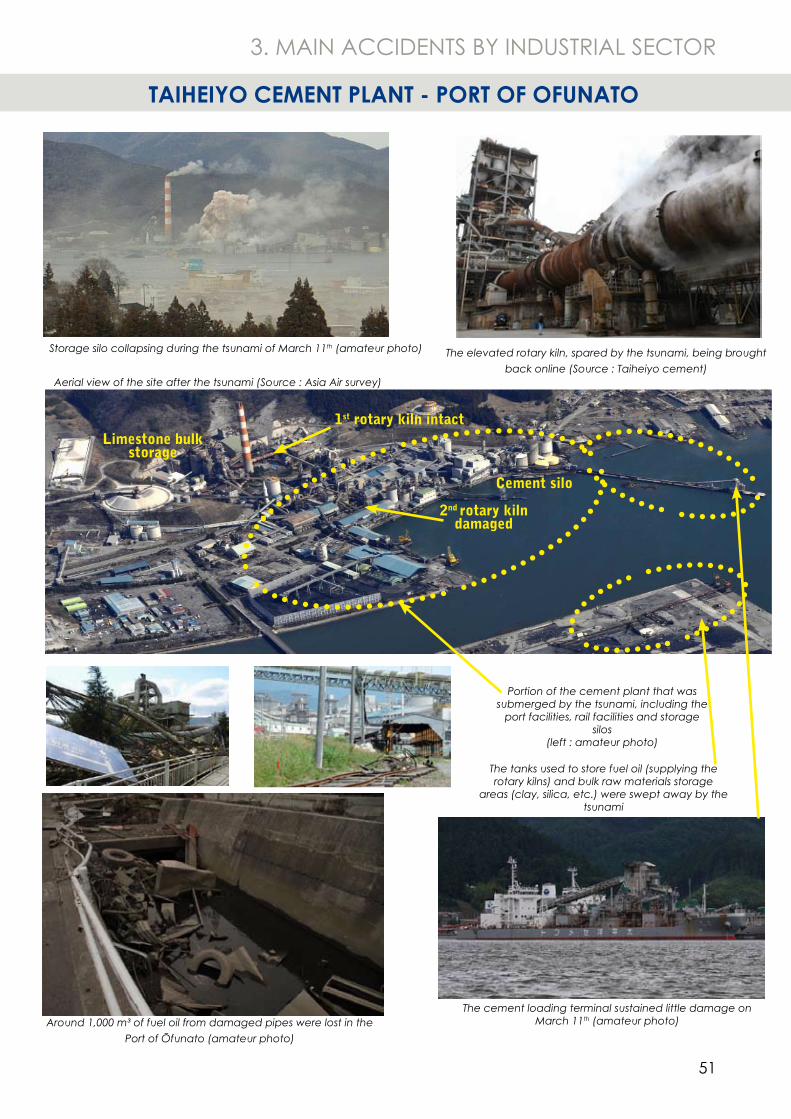
CEMENT PLANTTAIHEIYO CEMENT CORP. - PORT OF OFUNATOFOCUS ON:
51
The elevated rotary kiln, spared by the tsunami, being brought back online (Source : Taiheiyo cement)
The tanks used to store fuel oil (supplying the rotary kilns) and bulk raw materials storage
areas (clay, silica, etc.) were swept away by the tsunami
Portion of the cement plant that was submerged by the tsunami, including the
port facilities, rail facilities and storage silos
(left : amateur photo)
Storage silo collapsing during the tsunami of March 11th (amateur photo)
Around 1,000 m³ of fuel oil from damaged pipes were lost in the Port of Ōfunato (amateur photo)
The cement loading terminal sustained little damage on March 11th (amateur photo)
Stock de calcaire et broyeur
Silos de ciment
Aerial view of the site after the tsunami (Source : Asia Air survey)
2ème four rotatifendommagé
1ier four rotatifintact
3. MAIN ACCIDENTS BY INDUSTRIAL SECTOR
TAIHEIYO CEMENT PLANT - PORT OF OFUNATO
1st rotary kiln intact
2nd rotary kiln damaged
Limestone bulk storage
Cement silo
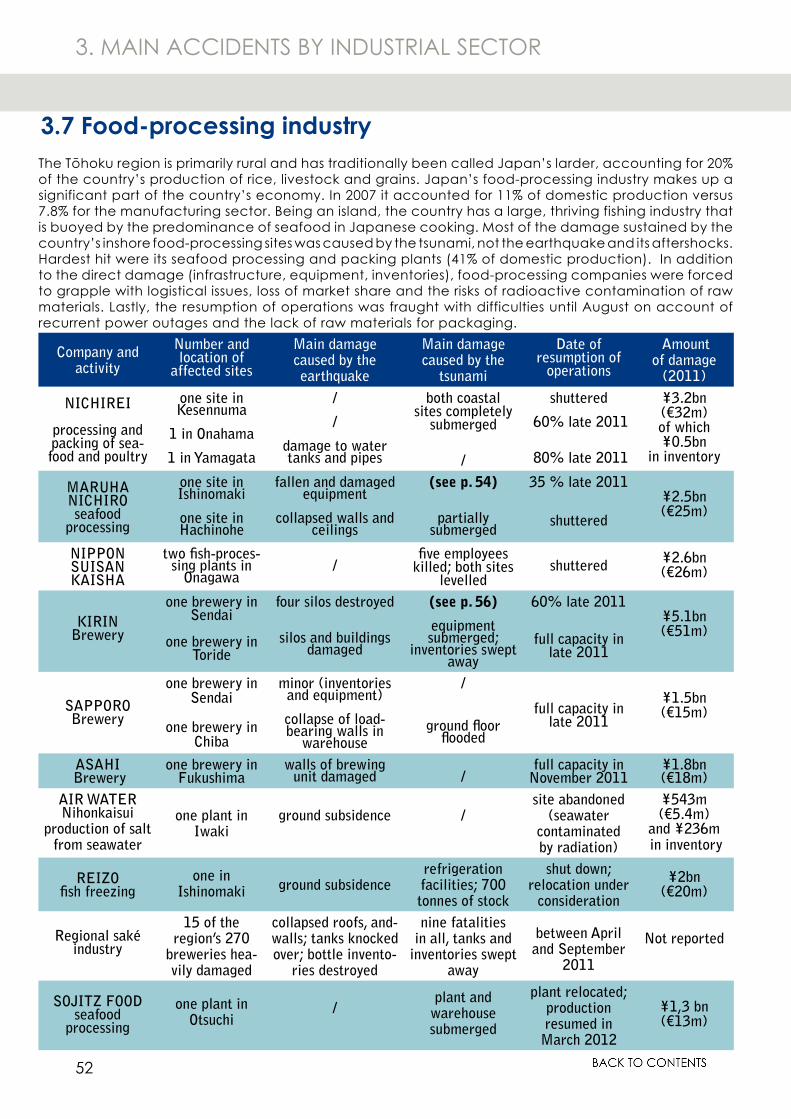
52
3.7 Food-processing industry
3. MAIN ACCIDENTS BY INDUSTRIAL SECTOR
The Tōhoku region is primarily rural and has traditionally been called Japan’s larder, accounting for 20% of the country’s production of rice, livestock and grains. Japan’s food-processing industry makes up a significant part of the country’s economy. In 2007 it accounted for 11% of domestic production versus 7.8% for the manufacturing sector. Being an island, the country has a large, thriving fishing industry that is buoyed by the predominance of seafood in Japanese cooking. Most of the damage sustained by the country’s inshore food-processing sites was caused by the tsunami, not the earthquake and its aftershocks. Hardest hit were its seafood processing and packing plants (41% of domestic production). In addition to the direct damage (infrastructure, equipment, inventories), food-processing companies were forced to grapple with logistical issues, loss of market share and the risks of radioactive contamination of raw materials. Lastly, the resumption of operations was fraught with difficulties until August on account of recurrent power outages and the lack of raw materials for packaging.
Company and activity
Number and location of
affected sites
Main damage caused by the earthquake
Main damage caused by the
tsunami
Date of resumption of
operations
Amount of damage
(2011)
NICHIREI
processing and packing of sea-food and poultry
one site in Kesennuma
1 in Onahama
1 in Yamagata
/
/
damage to water tanks and pipes
both coastal sites completely
submerged
/
shuttered
60% late 2011
80% late 2011
¥3.2bn(€32m)of which ¥0.5bn
in inventory
MARUHA NICHIROseafood
processing
one site in Ishinomaki
one site in Hachinohe
fallen and damaged equipment
collapsed walls and ceilings
(see p. 54)
partially submerged
35 % late 2011
shuttered
¥2.5bn(€25m)
NIPPON SUISAN KAISHA
two fish-proces-sing plants in
Onagawa
/
five employees killed; both sites
levelledshuttered ¥2.6bn
(€26m)
KIRIN Brewery
one brewery in Sendai
one brewery in Toride
four silos destroyed
silos and buildings damaged
(see p. 56)
equipment submerged;
inventories swept away
60% late 2011
full capacity in late 2011
¥5.1bn(€51m)
SAPPORO Brewery
one brewery in Sendai
one brewery in Chiba
minor (inventories and equipment)
collapse of load-bearing walls in
warehouse
/
ground floor flooded
full capacity in
late 2011
¥1.5bn(€15m)
ASAHI Brewery
one brewery in Fukushima
walls of brewing unit damaged /
full capacity in November 2011
¥1.8bn(€18m)
AIR WATERNihonkaisui
production of salt from seawater
one plant in Iwaki
ground subsidence /site abandoned
(seawater contaminated by radiation)
¥543m(€5.4m)
and ¥236m in inventory
REIZOfish freezing
one in Ishinomaki ground subsidence
refrigeration facilities; 700 tonnes of stock
shut down; relocation under
consideration
¥2bn(€20m)
Regional saké industry
15 of the region’s 270
breweries hea-vily damaged
collapsed roofs, and-walls; tanks knocked over; bottle invento-
ries destroyed
nine fatalities in all, tanks and
inventories swept away
between April and September
2011
Not reported
SOJITZ FOODseafood
processing
one plant in Otsuchi
/plant and
warehouse submerged
plant relocated; production resumed in
March 2012
¥1,3 bn(€13m)
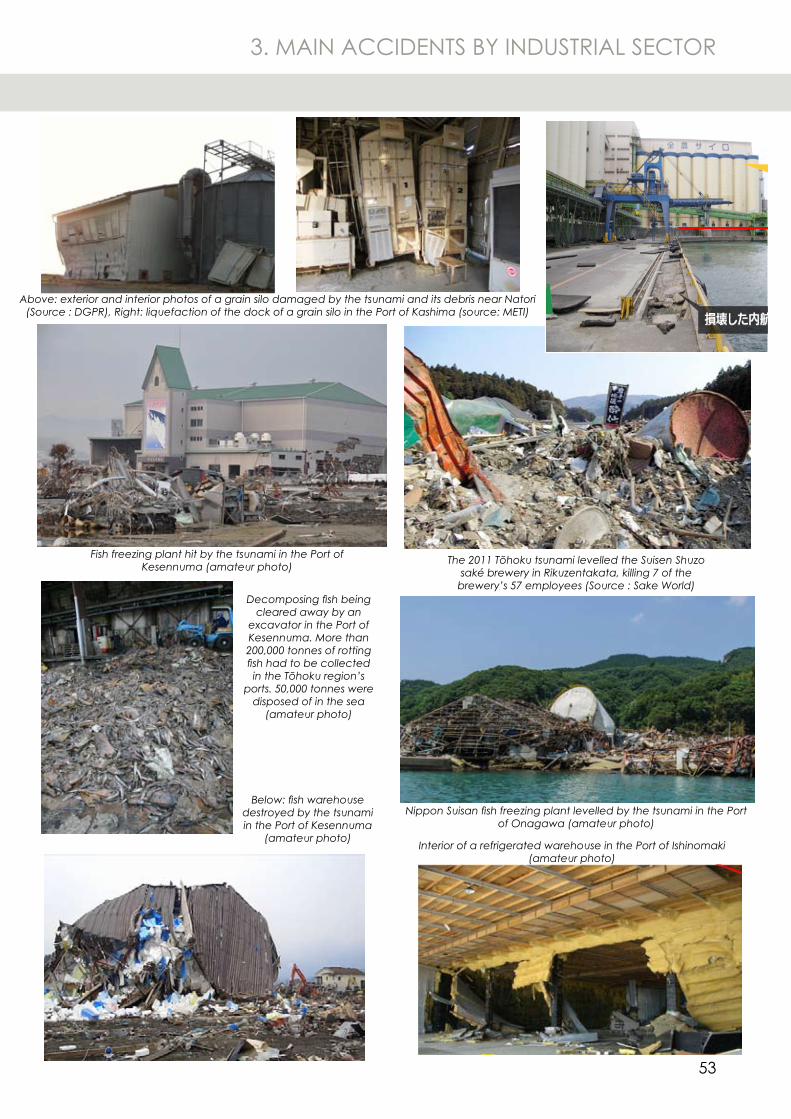
53
3. MAIN ACCIDENTS BY INDUSTRIAL SECTOR
Fish freezing plant hit by the tsunami in the Port of Kesennuma (amateur photo)
Above: exterior and interior photos of a grain silo damaged by the tsunami and its debris near Natori (Source : DGPR), Right: liquefaction of the dock of a grain silo in the Port of Kashima (source: METI)
Decomposing fish being cleared away by an
excavator in the Port of Kesennuma. More than 200,000 tonnes of rotting fish had to be collected in the Tōhoku region’s
ports. 50,000 tonnes were disposed of in the sea
(amateur photo)
The 2011 Tōhoku tsunami levelled the Suisen Shuzo saké brewery in Rikuzentakata, killing 7 of the
brewery’s 57 employees (Source : Sake World)
Nippon Suisan fish freezing plant levelled by the tsunami in the Port of Onagawa (amateur photo)
Below: fish warehouse destroyed by the tsunami in the Port of Kesennuma
(amateur photo)Interior of a refrigerated warehouse in the Port of Ishinomaki
(amateur photo)
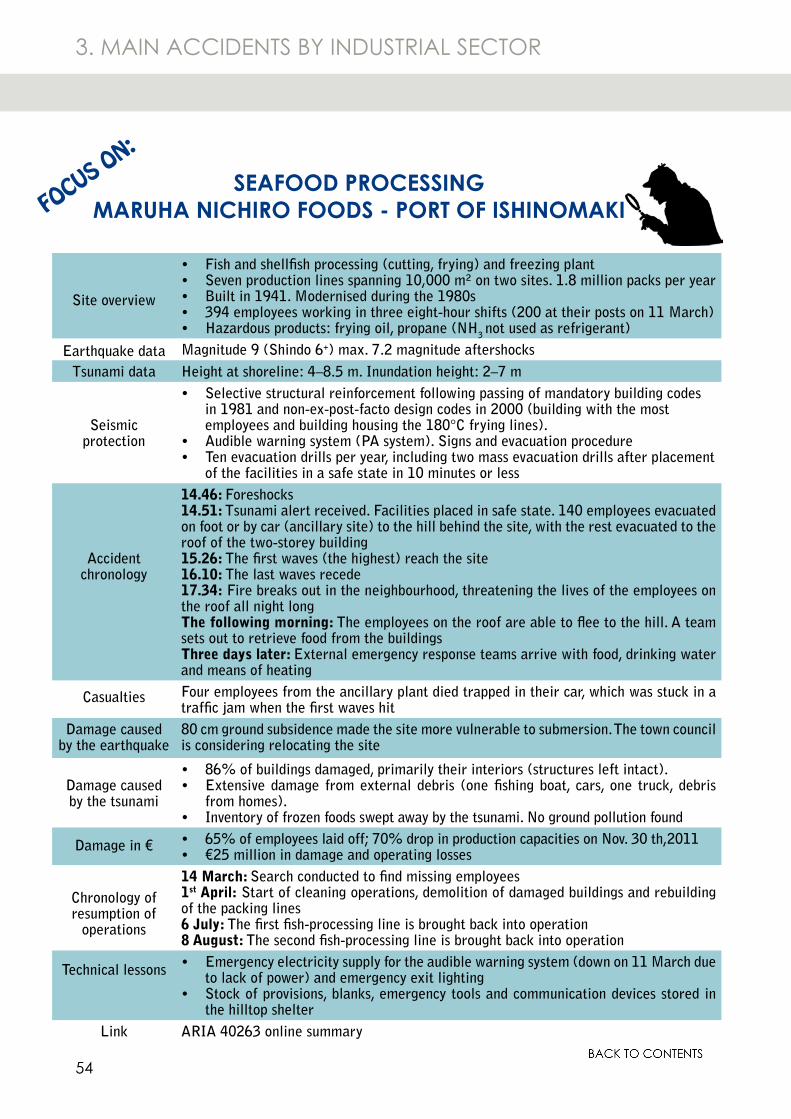
54
3. MAIN ACCIDENTS BY INDUSTRIAL SECTOR
Site overview
Fish and shellfish processing (cutting, frying) and freezing plant•Seven production lines spanning 10,000 m² on two sites. 1.8 million packs per year•Built in 1941. Modernised during the 1980s•394 employees working in three eight-hour shifts (200 at their posts on 11 March)•Hazardous products: frying oil, propane (NH• 3 not used as refrigerant)
Earthquake data Magnitude 9 (Shindo 6+) max. 7.2 magnitude aftershocks Tsunami data Height at shoreline: 4–8.5 m. Inundation height: 2–7 m
Seismic protection
Selective structural reinforcement following passing of mandatory building codes •in 1981 and non-ex-post-facto design codes in 2000 (building with the most employees and building housing the 180°C frying lines).Audible warning system (PA system). Signs and evacuation procedure•Ten evacuation drills per year, including two mass evacuation drills after placement •of the facilities in a safe state in 10 minutes or less
Accident chronology
14.46: Foreshocks 14.51: Tsunami alert received. Facilities placed in safe state. 140 employees evacuated on foot or by car (ancillary site) to the hill behind the site, with the rest evacuated to the roof of the two-storey building15.26: The first waves (the highest) reach the site16.10: The last waves recede17.34: Fire breaks out in the neighbourhood, threatening the lives of the employees on the roof all night longThe following morning: The employees on the roof are able to flee to the hill. A team sets out to retrieve food from the buildingsThree days later: External emergency response teams arrive with food, drinking water and means of heating
Casualties Four employees from the ancillary plant died trapped in their car, which was stuck in a traffic jam when the first waves hit
Damage caused by the earthquake
80 cm ground subsidence made the site more vulnerable to submersion. The town council is considering relocating the site
Damage caused by the tsunami
86% of buildings damaged, primarily their interiors (structures left intact).•Extensive damage from external debris (one fishing boat, cars, one truck, debris •from homes).Inventory of frozen foods swept away by the tsunami. No ground pollution found•
Damage in € 65% of employees laid off; 70% drop in production capacities on Nov. 30 th,2011•€25 million in damage and operating losses•
Chronology of resumption of
operations
14 March: Search conducted to find missing employees1st April: Start of cleaning operations, demolition of damaged buildings and rebuilding of the packing lines6 July: The first fish-processing line is brought back into operation8 August: The second fish-processing line is brought back into operation
Technical lessons Emergency electricity supply for the audible warning system (down on 11 March due •to lack of power) and emergency exit lightingStock of provisions, blanks, emergency tools and communication devices stored in •the hilltop shelter
Link ARIA 40263 online summary
SEAFOOD PROCESSINGMARUHA NICHIRO FOODS - PORT OF ISHINOMAKI FOCUS ON:
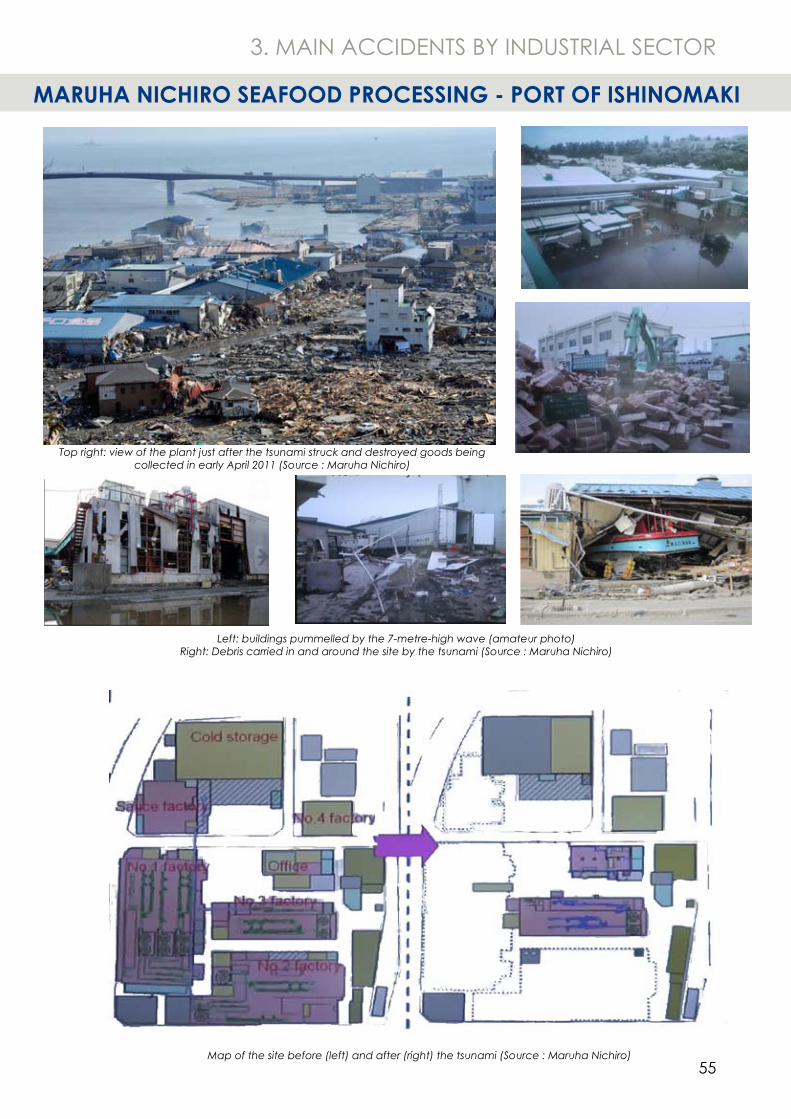
55
3. MAIN ACCIDENTS BY INDUSTRIAL SECTOR
Map of the site before (left) and after (right) the tsunami (Source : Maruha Nichiro)
Top right: view of the plant just after the tsunami struck and destroyed goods being collected in early April 2011 (Source : Maruha Nichiro)
Left: buildings pummelled by the 7-metre-high wave (amateur photo)Right: Debris carried in and around the site by the tsunami (Source : Maruha Nichiro)
MARUHA NICHIRO SEAFOOD PROCESSING - PORT OF ISHINOMAKI
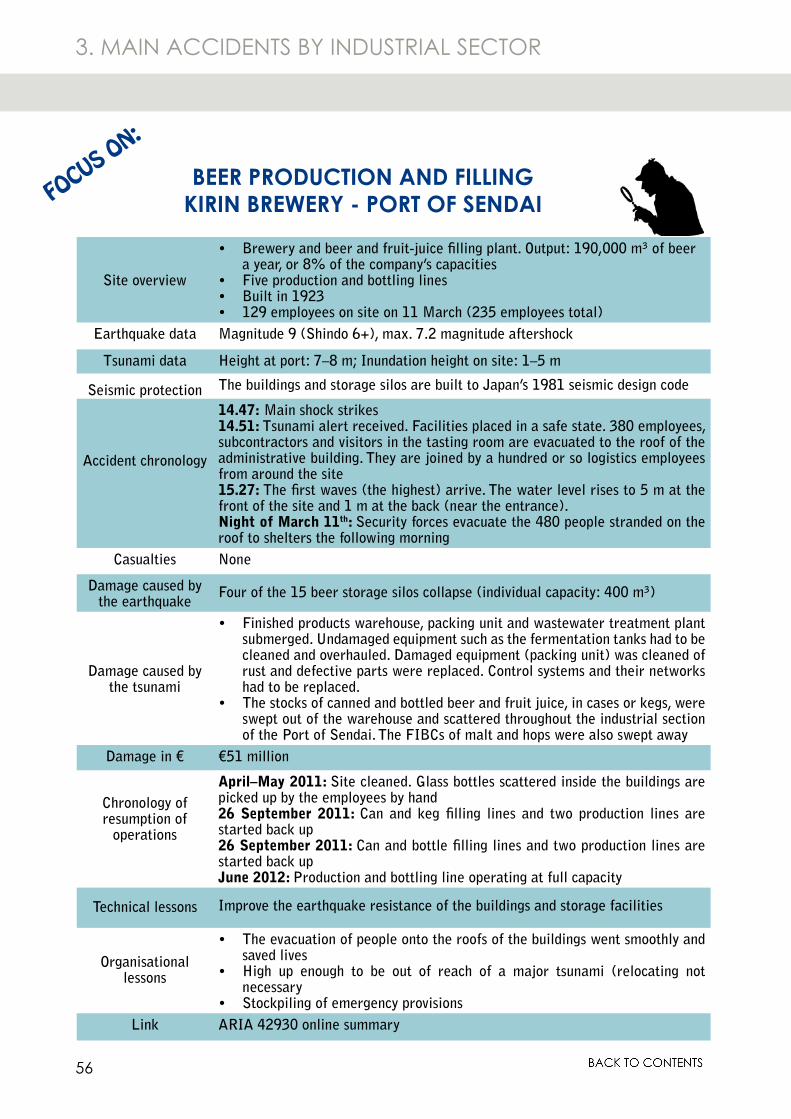
56
3. MAIN ACCIDENTS BY INDUSTRIAL SECTOR
Site overview
Brewery and beer and fruit-juice filling plant. Output: 190,000 m³ of beer •a year, or 8% of the company’s capacitiesFive production and bottling lines•Built in 1923•129 employees on site on 11 March (235 employees total)•
Earthquake data Magnitude 9 (Shindo 6+), max. 7.2 magnitude aftershock
Tsunami data Height at port: 7–8 m; Inundation height on site: 1–5 m
Seismic protection The buildings and storage silos are built to Japan’s 1981 seismic design code
Accident chronology
14.47: Main shock strikes14.51: Tsunami alert received. Facilities placed in a safe state. 380 employees, subcontractors and visitors in the tasting room are evacuated to the roof of the administrative building. They are joined by a hundred or so logistics employees from around the site15.27: The first waves (the highest) arrive. The water level rises to 5 m at the front of the site and 1 m at the back (near the entrance).Night of March 11th: Security forces evacuate the 480 people stranded on the roof to shelters the following morning
Casualties None
Damage caused by the earthquake
Four of the 15 beer storage silos collapse (individual capacity: 400 m³)
Damage caused by the tsunami
Finished products warehouse, packing unit and wastewater treatment plant •submerged. Undamaged equipment such as the fermentation tanks had to be cleaned and overhauled. Damaged equipment (packing unit) was cleaned of rust and defective parts were replaced. Control systems and their networks had to be replaced.The stocks of canned and bottled beer and fruit juice, in cases or kegs, were •swept out of the warehouse and scattered throughout the industrial section of the Port of Sendai. The FIBCs of malt and hops were also swept away
Damage in € €51 million
Chronology of resumption of
operations
April–May 2011: Site cleaned. Glass bottles scattered inside the buildings are picked up by the employees by hand26 September 2011: Can and keg filling lines and two production lines are started back up26 September 2011: Can and bottle filling lines and two production lines are started back upJune 2012: Production and bottling line operating at full capacity
Technical lessons Improve the earthquake resistance of the buildings and storage facilities
Organisational lessons
The evacuation of people onto the roofs of the buildings went smoothly and •saved livesHigh up enough to be out of reach of a major tsunami (relocating not •necessaryStockpiling of emergency provisions•
Link ARIA 42930 online summary
BEER PRODUCTION AND FILLINGKIRIN BREWERY - PORT OF SENDAIFOCUS ON:
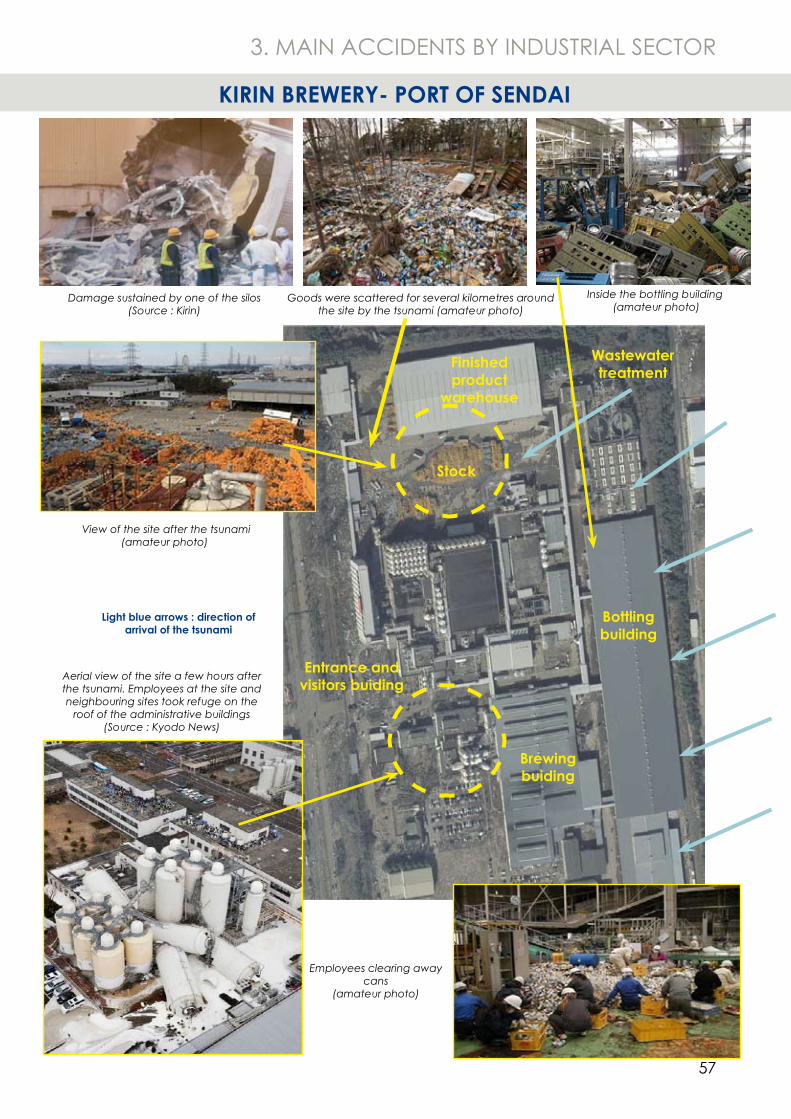
57
Stock
Bottling building
Brewing buiding
Wastewater treatment
Finished product
warehouse
Entrance and visitors buiding
3. MAIN ACCIDENTS BY INDUSTRIAL SECTOR
Aerial view of the site a few hours after the tsunami. Employees at the site and neighbouring sites took refuge on the
roof of the administrative buildings(Source : Kyodo News)
Light blue arrows : direction of arrival of the tsunami
Goods were scattered for several kilometres around the site by the tsunami (amateur photo)
Damage sustained by one of the silos (Source : Kirin)
View of the site after the tsunami (amateur photo)
Employees clearing away cans
(amateur photo)
Inside the bottling building (amateur photo)
KIRIN BREWERY- PORT OF SENDAI
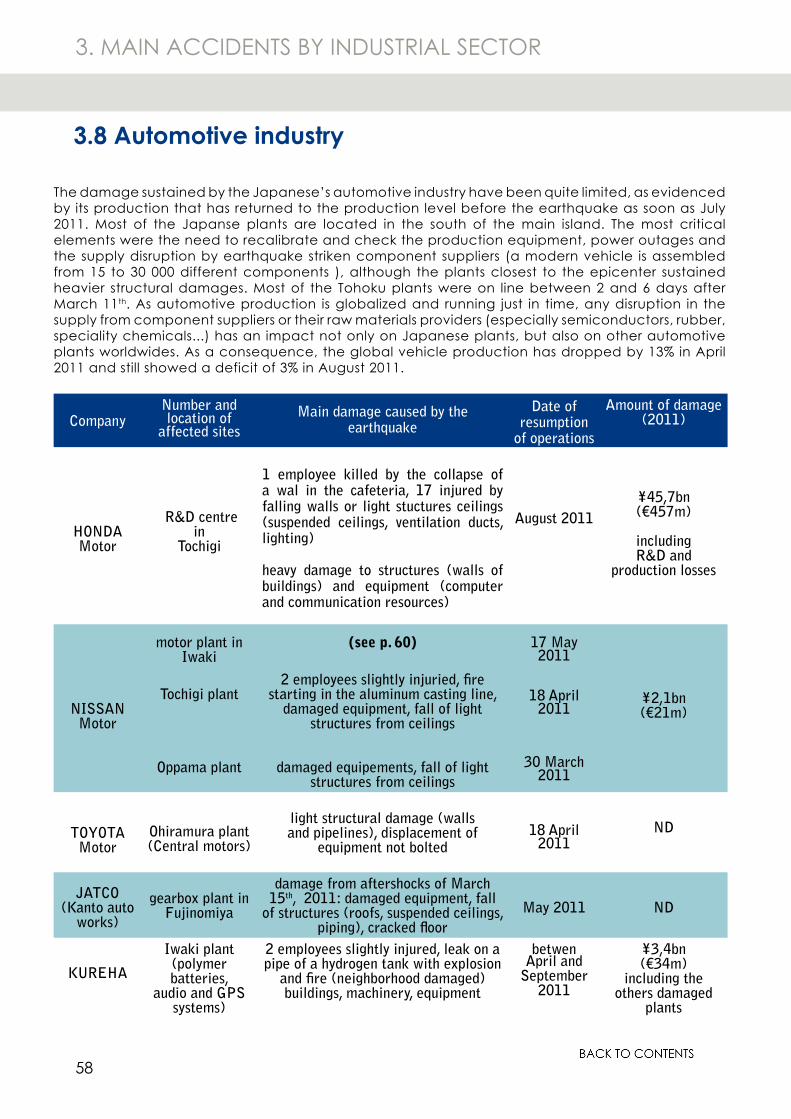
58
The damage sustained by the Japanese’s automotive industry have been quite limited, as evidenced by its production that has returned to the production level before the earthquake as soon as July 2011. Most of the Japanse plants are located in the south of the main island. The most critical elements were the need to recalibrate and check the production equipment, power outages and the supply disruption by earthquake striken component suppliers (a modern vehicle is assembled from 15 to 30 000 different components ), although the plants closest to the epicenter sustained heavier structural damages. Most of the Tohoku plants were on line between 2 and 6 days after March 11th. As automotive production is globalized and running just in time, any disruption in the supply from component suppliers or their raw materials providers (especially semiconductors, rubber, speciality chemicals...) has an impact not only on Japanese plants, but also on other automotive plants worldwides. As a consequence, the global vehicle production has dropped by 13% in April 2011 and still showed a deficit of 3% in August 2011.
CompanyNumber and location of
affected sitesMain damage caused by the
earthquakeDate of
resumption of operations
Amount of damage (2011)
HONDAMotor
R&D centrein
Tochigi
1 employee killed by the collapse of a wal in the cafeteria, 17 injured by falling walls or light stuctures ceilings (suspended ceilings, ventilation ducts, lighting)
heavy damage to structures (walls of buildings) and equipment (computer and communication resources)
August 2011¥45,7bn(€457m)
including R&D and
production losses
NISSANMotor
motor plant in Iwaki
Tochigi plant
Oppama plant
(see p. 60)
2 employees slightly injuried, fire starting in the aluminum casting line,
damaged equipment, fall of light structures from ceilings
damaged equipements, fall of light structures from ceilings
17 May 2011
18 April 2011
30 March 2011
¥2,1bn(€21m)
TOYOTAMotor
Ohiramura plant(Central motors)
light structural damage (wallsand pipelines), displacement of
equipment not bolted18 April
2011ND
JATCO(Kanto auto
works)
gearbox plant in Fujinomiya
damage from aftershocks of March 15th, 2011: damaged equipment, fall
of structures (roofs, suspended ceilings, piping), cracked floor
May 2011 ND
KUREHA
Iwaki plant(polymer batteries,
audio and GPS systems)
2 employees slightly injured, leak on a pipe of a hydrogen tank with explosion
and fire (neighborhood damaged)buildings, machinery, equipment
betwen April and
September 2011
¥3,4bn(€34m)
including the others damaged
plants
3.8 Automotive industry
3. MAIN ACCIDENTS BY INDUSTRIAL SECTOR
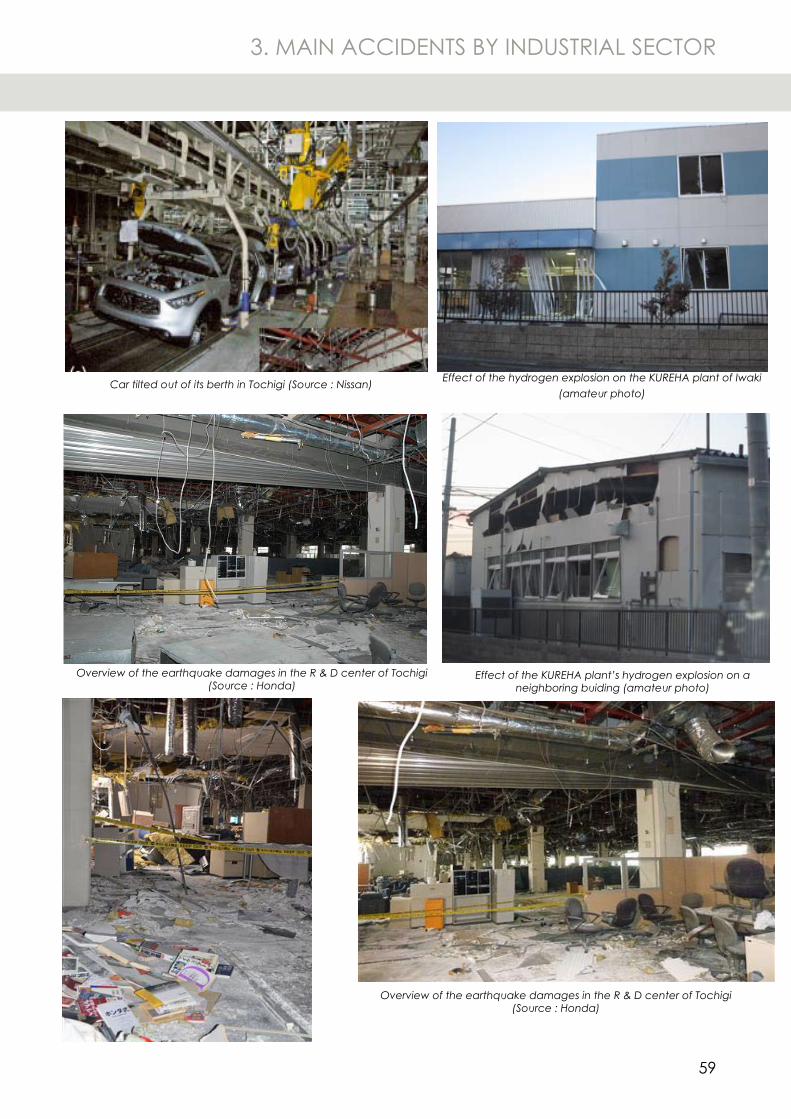
59
Car tilted out of its berth in Tochigi (Source : Nissan) Effect of the hydrogen explosion on the KUREHA plant of Iwaki (amateur photo)
Overview of the earthquake damages in the R & D center of Tochigi (Source : Honda)
Effect of the KUREHA plant’s hydrogen explosion on a neighboring buiding (amateur photo)
Overview of the earthquake damages in the R & D center of Tochigi (Source : Honda)
3. MAIN ACCIDENTS BY INDUSTRIAL SECTOR
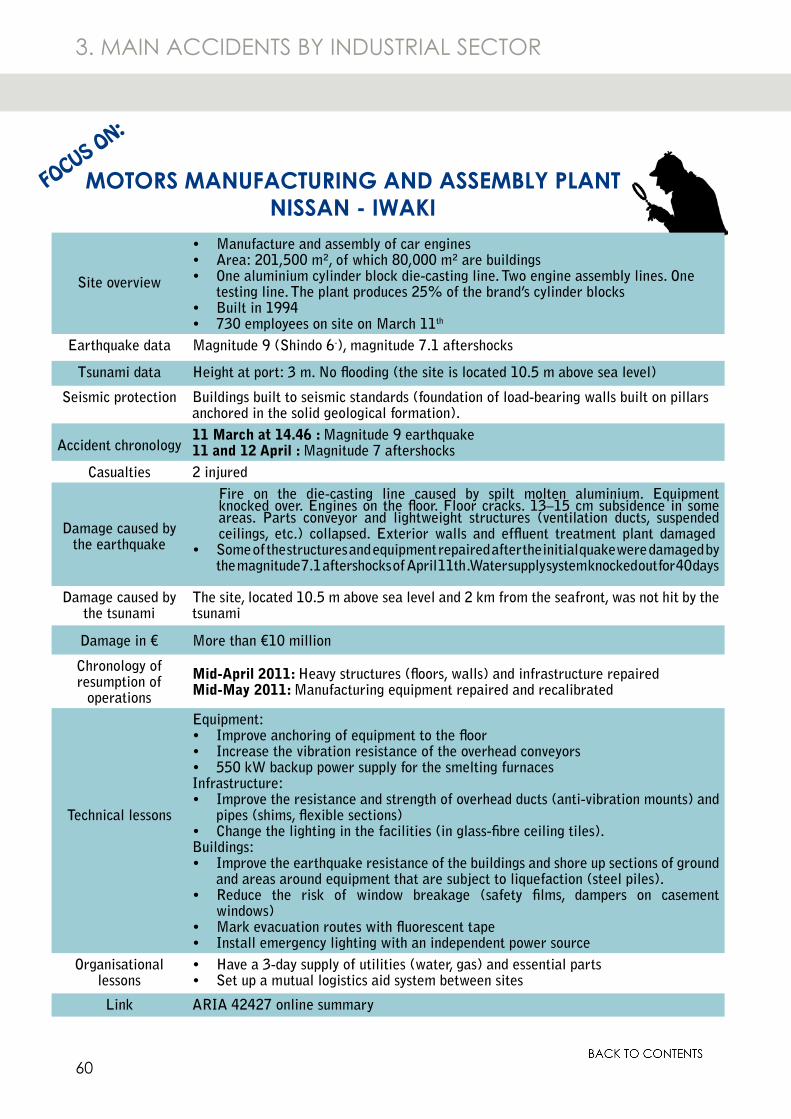
60
MOTORS MANUFACTURING AND ASSEMBLY PLANTNISSAN - IWAKI
FOCUS ON:
3. MAIN ACCIDENTS BY INDUSTRIAL SECTOR
Site overview
Manufacture and assembly of car engines•Area: 201,500 m², of which 80,000 m² are buildings•One aluminium cylinder block die-casting line. Two engine assembly lines. One •testing line. The plant produces 25% of the brand’s cylinder blocks Built in 1994•730 employees on site on March 11• th
Earthquake data Magnitude 9 (Shindo 6-), magnitude 7.1 aftershocks
Tsunami data Height at port: 3 m. No flooding (the site is located 10.5 m above sea level)
Seismic protection Buildings built to seismic standards (foundation of load-bearing walls built on pillars anchored in the solid geological formation).
Accident chronology11 March at 14.46 : Magnitude 9 earthquake11 and 12 April : Magnitude 7 aftershocks
Casualties 2 injured
Damage caused by the earthquake
Fire on the die-casting line caused by spilt molten aluminium. Equipment knocked over. Engines on the floor. Floor cracks. 13–15 cm subsidence in some areas. Parts conveyor and lightweight structures (ventilation ducts, suspended ceilings, etc.) collapsed. Exterior walls and effluent treatment plant damagedSome of the structures and equipment repaired after the initial quake were damaged by •the magnitude 7.1 aftershocks of April 11th . Water supply system knocked out for 40 days
Damage caused by the tsunami
The site, located 10.5 m above sea level and 2 km from the seafront, was not hit by the tsunami
Damage in € More than €10 million
Chronology of resumption of
operations
Mid-April 2011: Heavy structures (floors, walls) and infrastructure repairedMid-May 2011: Manufacturing equipment repaired and recalibrated
Technical lessons
Equipment:Improve anchoring of equipment to the floor •Increase the vibration resistance of the overhead conveyors•550 kW backup power supply for the smelting furnaces•
Infrastructure:Improve the resistance and strength of overhead ducts (anti-vibration mounts) and •pipes (shims, flexible sections)Change the lighting in the facilities (in glass-fibre ceiling tiles).•
Buildings:Improve the earthquake resistance of the buildings and shore up sections of ground •and areas around equipment that are subject to liquefaction (steel piles).Reduce the risk of window breakage (safety films, dampers on casement •windows)Mark evacuation routes with fluorescent tape•Install emergency lighting with an independent power source •
Organisational lessons
Have a 3-day supply of utilities (water, gas) and essential parts•Set up a mutual logistics aid system between sites•
Link ARIA 42427 online summary
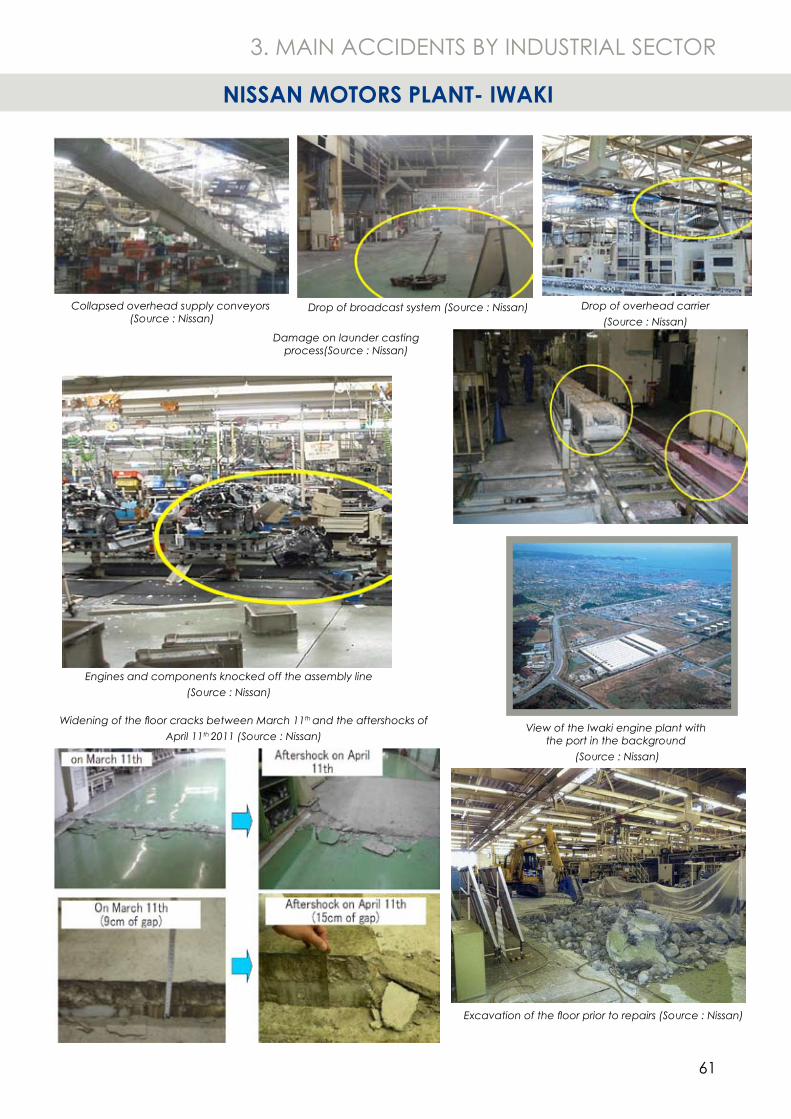
61
Excavation of the floor prior to repairs (Source : Nissan)
View of the Iwaki engine plant with the port in the background
(Source : Nissan)
3. MAIN ACCIDENTS BY INDUSTRIAL SECTOR
Collapsed overhead supply conveyors (Source : Nissan)
Engines and components knocked off the assembly line (Source : Nissan)
Damage on launder casting process(Source : Nissan)
Drop of overhead carrier(Source : Nissan)
Widening of the floor cracks between March 11th and the aftershocks of April 11th 2011 (Source : Nissan)
Drop of broadcast system (Source : Nissan)
NISSAN MOTORS PLANT- IWAKI
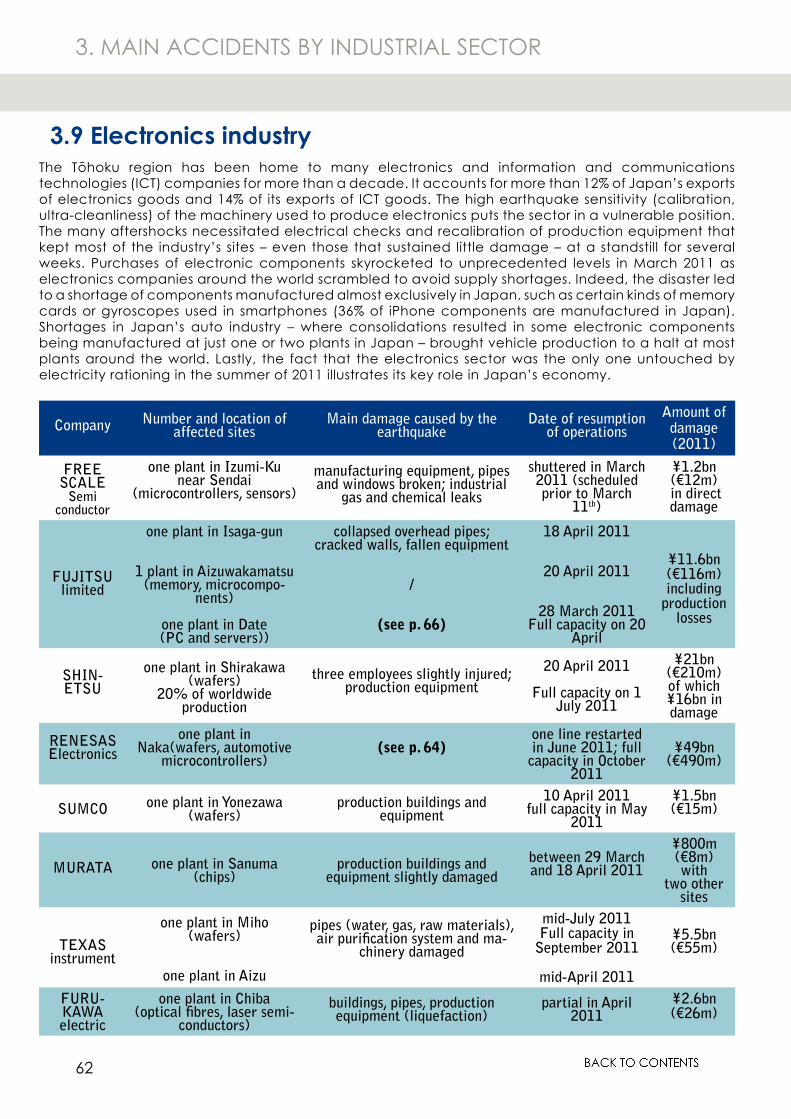
62
3. MAIN ACCIDENTS BY INDUSTRIAL SECTOR
The Tōhoku region has been home to many electronics and information and communications technologies (ICT) companies for more than a decade. It accounts for more than 12% of Japan’s exports of electronics goods and 14% of its exports of ICT goods. The high earthquake sensitivity (calibration, ultra-cleanliness) of the machinery used to produce electronics puts the sector in a vulnerable position. The many aftershocks necessitated electrical checks and recalibration of production equipment that kept most of the industry’s sites – even those that sustained little damage – at a standstill for several weeks. Purchases of electronic components skyrocketed to unprecedented levels in March 2011 as electronics companies around the world scrambled to avoid supply shortages. Indeed, the disaster led to a shortage of components manufactured almost exclusively in Japan, such as certain kinds of memory cards or gyroscopes used in smartphones (36% of iPhone components are manufactured in Japan). Shortages in Japan’s auto industry – where consolidations resulted in some electronic components being manufactured at just one or two plants in Japan – brought vehicle production to a halt at most plants around the world. Lastly, the fact that the electronics sector was the only one untouched by electricity rationing in the summer of 2011 illustrates its key role in Japan’s economy.
Company Number and location of affected sites
Main damage caused by the earthquake
Date of resumption of operations
Amount of damage (2011)
FREESCALE
Semiconductor
one plant in Izumi-Ku near Sendai
(microcontrollers, sensors)
manufacturing equipment, pipes and windows broken; industrial
gas and chemical leaks
shuttered in March 2011 (scheduled prior to March
11th)
¥1.2bn(€12m) in direct damage
FUJITSUlimited
one plant in Isaga-gun
1 plant in Aizuwakamatsu(memory, microcompo-
nents)
one plant in Date(PC and servers))
collapsed overhead pipes; cracked walls, fallen equipment
/
(see p. 66)
18 April 2011
20 April 2011
28 March 2011Full capacity on 20
April
¥11.6bn(€116m)including
production losses
SHIN-ETSU
one plant in Shirakawa (wafers)
20% of worldwide production
three employees slightly injured; production equipment
20 April 2011
Full capacity on 1 July 2011
¥21bn(€210m)of which ¥16bn in damage
RENESAS Electronics
one plant in Naka(wafers, automotive
microcontrollers)(see p. 64)
one line restarted in June 2011; full
capacity in October 2011
¥49bn
(€490m)
SUMCO one plant in Yonezawa (wafers)
production buildings and equipment
10 April 2011full capacity in May
2011
¥1.5bn(€15m)
MURATA one plant in Sanuma (chips)
production buildings and equipment slightly damaged
between 29 March and 18 April 2011
¥800m(€8m)with
two other sites
TEXAS instrument
one plant in Miho(wafers)
one plant in Aizu
pipes (water, gas, raw materials), air purification system and ma-
chinery damaged
mid-July 2011Full capacity in
September 2011
mid-April 2011
¥5.5bn(€55m)
FURU-KAWA electric
one plant in Chiba(optical fibres, laser semi-
conductors)
buildings, pipes, production equipment (liquefaction)
partial in April 2011
¥2.6bn(€26m)
3.9 Electronics industry
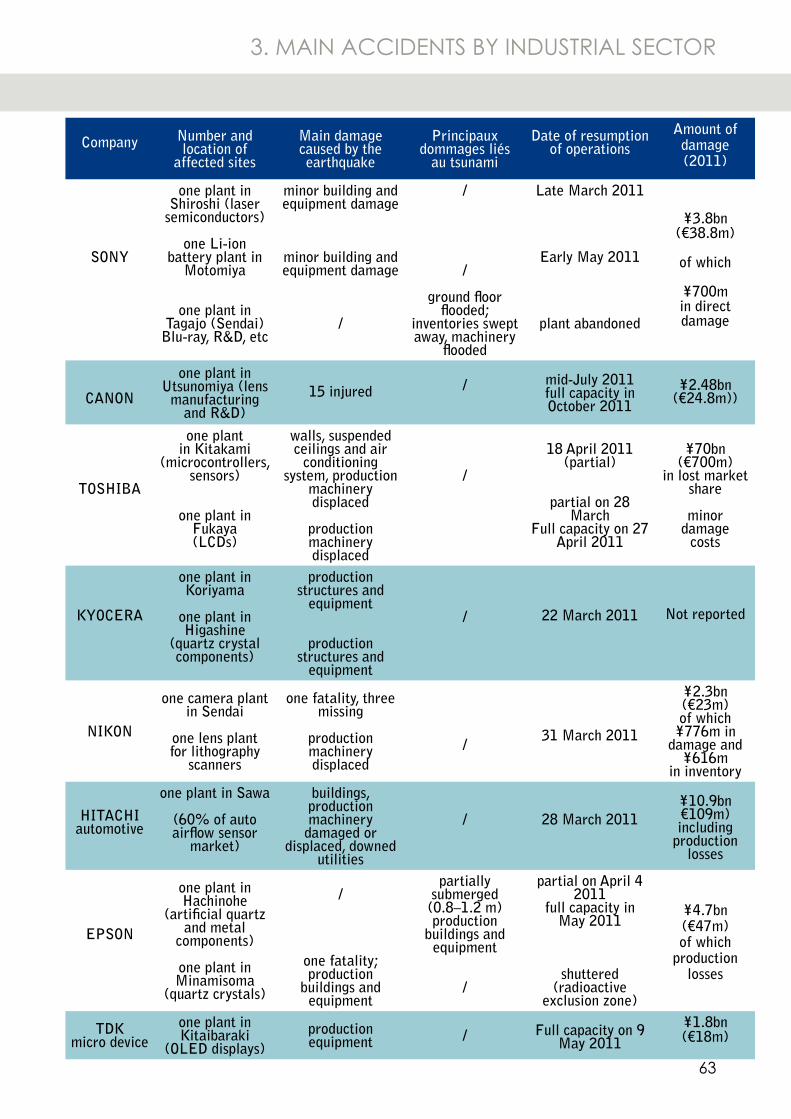
63
3. MAIN ACCIDENTS BY INDUSTRIAL SECTOR
Company Number and location of
affected sites
Main damage caused by the earthquake
Principaux dommages liés
au tsunami
Date of resumption of operations
Amount of damage (2011)
SONY
one plant in Shiroshi (laser
semiconductors)
one Li-ion battery plant in
Motomiya
one plant in Tagajo (Sendai)
Blu-ray, R&D, etc
minor building and equipment damage
minor building and equipment damage
/
/
/
ground floor flooded;
inventories swept away, machinery
flooded
Late March 2011
Early May 2011
plant abandoned
¥3.8bn(€38.8m)
of which
¥700m in direct damage
CANON
one plant in Utsunomiya (lens
manufacturing and R&D)
15 injured / mid-July 2011full capacity in October 2011
¥2.48bn(€24.8m))
TOSHIBA
one plant in Kitakami
(microcontrollers, sensors)
one plant in Fukaya(LCDs)
walls, suspended ceilings and air
conditioning system, production
machinery displaced
production machinery displaced
/
18 April 2011 (partial)
partial on 28 March
Full capacity on 27 April 2011
¥70bn(€700m)
in lost market share
minor damage
costs
KYOCERA
one plant in Koriyama
one plant in Higashine
(quartz crystal components)
production structures and
equipment
production structures and
equipment
/ 22 March 2011 Not reported
NIKON
one camera plant in Sendai
one lens plant for lithography
scanners
one fatality, three missing
production machinery displaced
/31 March 2011
¥2.3bn(€23m)of which
¥776m indamage and
¥616m in inventory
HITACHI automotive
one plant in Sawa
(60% of auto airflow sensor
market)
buildings, production machinery
damaged or displaced, downed
utilities
/ 28 March 2011¥10.9bn€109m)including
production losses
EPSON
one plant in Hachinohe
(artificial quartz and metal
components)
one plant in Minamisoma
(quartz crystals)
/
one fatality; production
buildings and equipment
partially submerged (0.8–1.2 m) production
buildings and equipment
/
partial on April 4 2011
full capacity in May 2011
shuttered(radioactive
exclusion zone)
¥4.7bn(€47m)of which
production losses
TDK micro device
one plant in Kitaibaraki
(OLED displays)production equipment / Full capacity on 9
May 2011¥1.8bn(€18m)
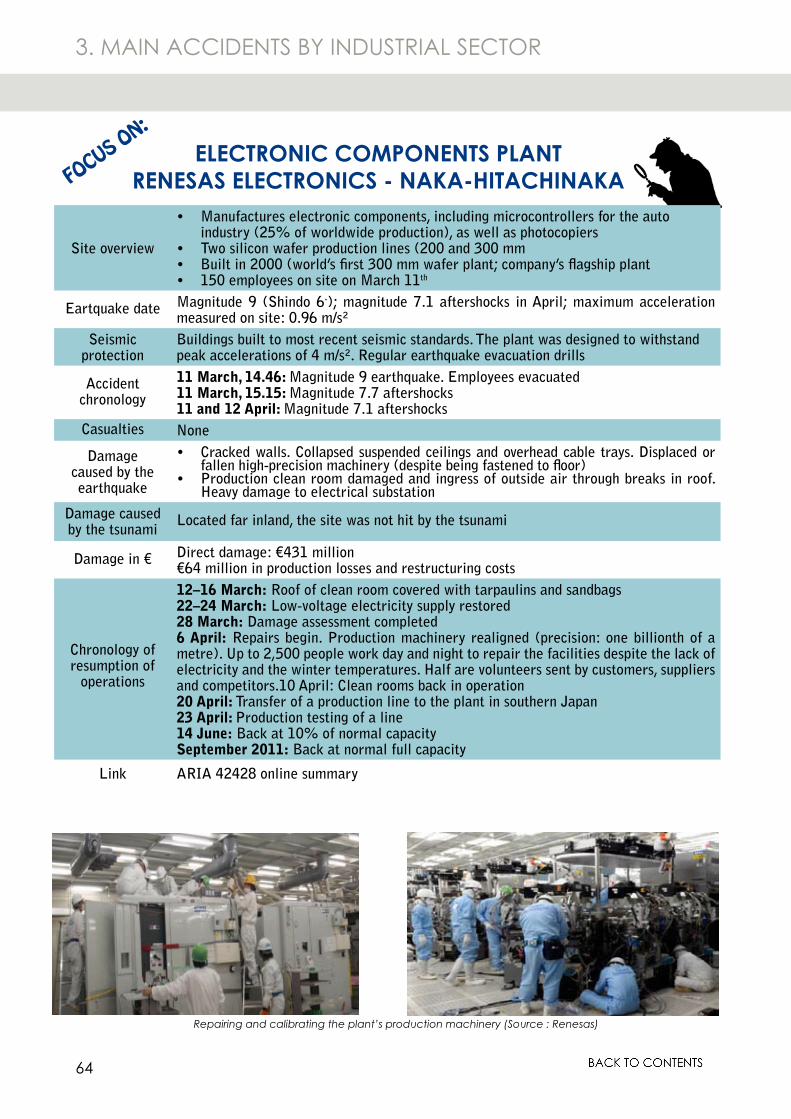
64
3. MAIN ACCIDENTS BY INDUSTRIAL SECTOR
Site overview
Manufactures electronic components, including microcontrollers for the auto •industry (25% of worldwide production), as well as photocopiersTwo silicon wafer production lines (200 and 300 mm•Built in 2000 (world’s first 300 mm wafer plant; company’s flagship plant•150 employees on site on March 11• th
Eartquake date Magnitude 9 (Shindo 6-); magnitude 7.1 aftershocks in April; maximum acceleration measured on site: 0.96 m/s²
Seismic protection
Buildings built to most recent seismic standards. The plant was designed to withstand peak accelerations of 4 m/s². Regular earthquake evacuation drills
Accident chronology
11 March, 14.46: Magnitude 9 earthquake. Employees evacuated11 March, 15.15: Magnitude 7.7 aftershocks11 and 12 April: Magnitude 7.1 aftershocks
Casualties None
Damage caused by the earthquake
Cracked walls. Collapsed suspended ceilings and overhead cable trays. Displaced or •fallen high-precision machinery (despite being fastened to floor)Production clean room damaged and ingress of outside air through breaks in roof. •Heavy damage to electrical substation
Damage caused by the tsunami
Located far inland, the site was not hit by the tsunami
Damage in € Direct damage: €431 million€64 million in production losses and restructuring costs
Chronology of resumption of
operations
12–16 March: Roof of clean room covered with tarpaulins and sandbags22–24 March: Low-voltage electricity supply restored28 March: Damage assessment completed6 April: Repairs begin. Production machinery realigned (precision: one billionth of a metre). Up to 2,500 people work day and night to repair the facilities despite the lack of electricity and the winter temperatures. Half are volunteers sent by customers, suppliers and competitors.10 April: Clean rooms back in operation20 April: Transfer of a production line to the plant in southern Japan23 April: Production testing of a line14 June: Back at 10% of normal capacitySeptember 2011: Back at normal full capacity
Link ARIA 42428 online summary
ELECTRONIC COMPONENTS PLANT RENESAS ELECTRONICS - NAKA-HITACHINAKA FOCUS ON:
Repairing and calibrating the plant’s production machinery (Source : Renesas)
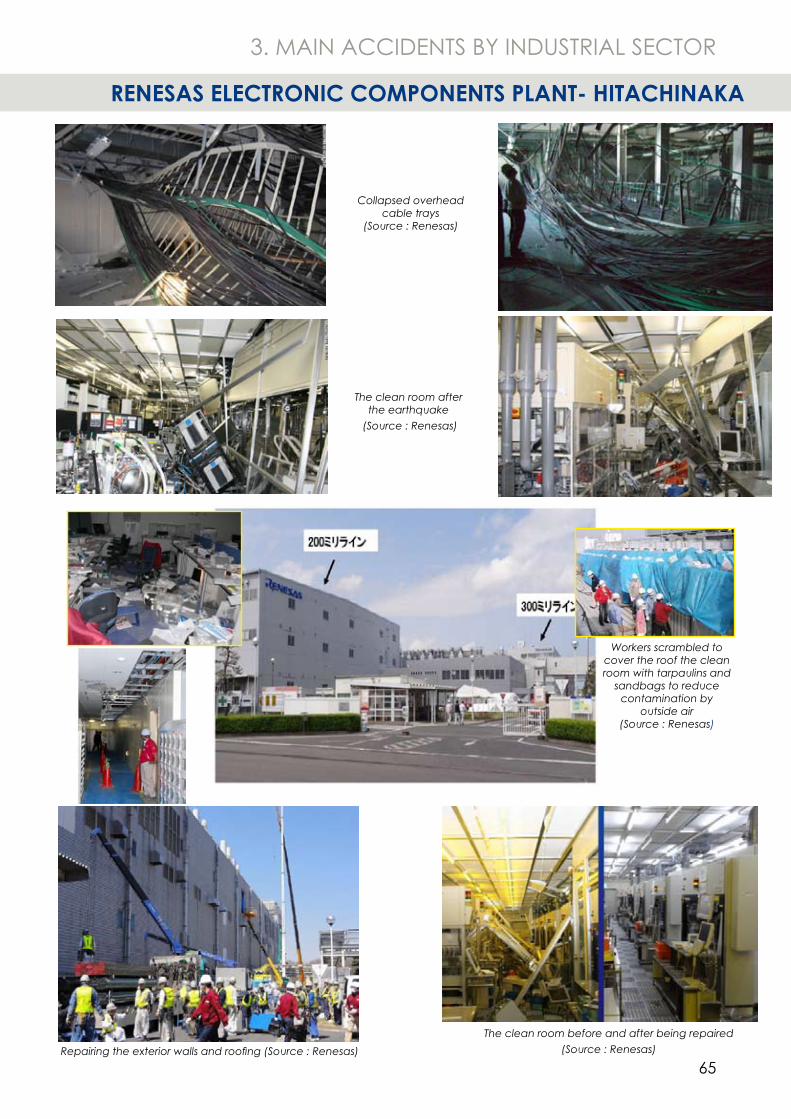
65
Collapsed overhead cable trays
(Source : Renesas)
The clean room after the earthquake
(Source : Renesas)
Repairing the exterior walls and roofing (Source : Renesas)
Workers scrambled to cover the roof the clean room with tarpaulins and
sandbags to reduce contamination by
outside air(Source : Renesas)
3. MAIN ACCIDENTS BY INDUSTRIAL SECTOR
The clean room before and after being repaired(Source : Renesas)
RENESAS ELECTRONIC COMPONENTS PLANT- HITACHINAKA
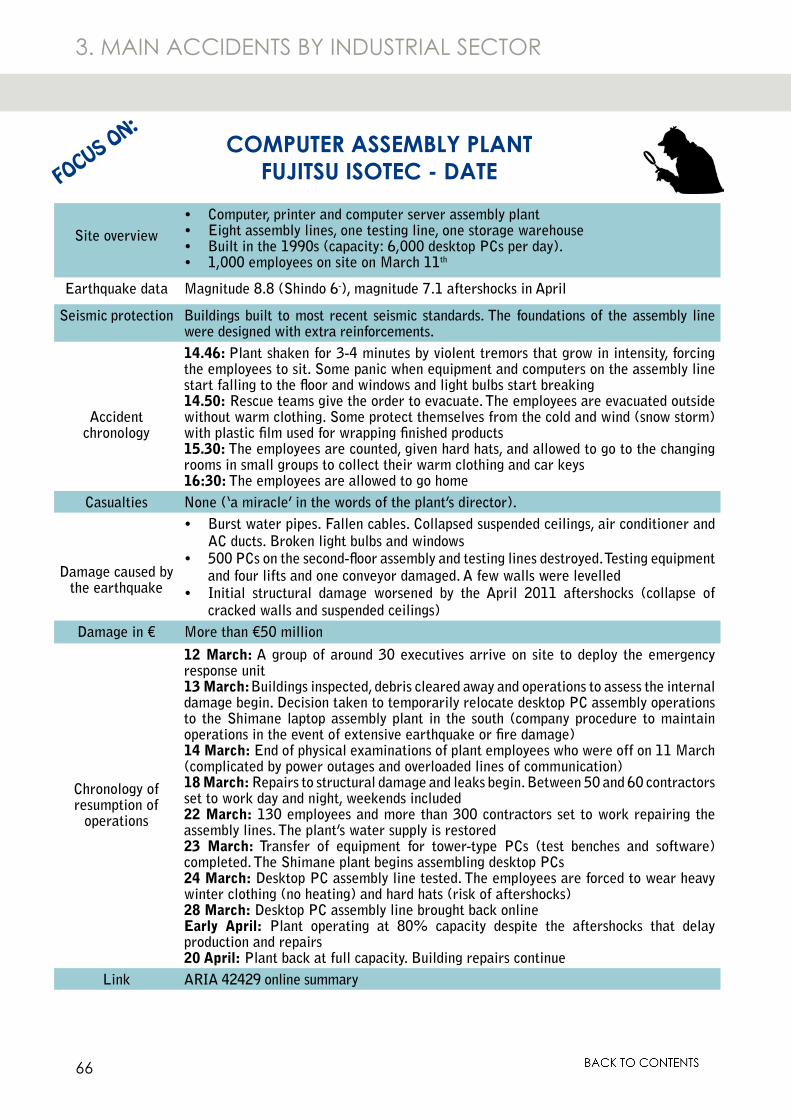
66
3. MAIN ACCIDENTS BY INDUSTRIAL SECTOR
Site overviewComputer, printer and computer server assembly plant•Eight assembly lines, one testing line, one storage warehouse •Built in the 1990s (capacity: 6,000 desktop PCs per day).•1,000 employees on site on March 11• th
Earthquake data Magnitude 8.8 (Shindo 6-), magnitude 7.1 aftershocks in April
Seismic protection Buildings built to most recent seismic standards. The foundations of the assembly line were designed with extra reinforcements.
Accident chronology
14.46: Plant shaken for 3-4 minutes by violent tremors that grow in intensity, forcing the employees to sit. Some panic when equipment and computers on the assembly line start falling to the floor and windows and light bulbs start breaking14.50: Rescue teams give the order to evacuate. The employees are evacuated outside without warm clothing. Some protect themselves from the cold and wind (snow storm) with plastic film used for wrapping finished products15.30: The employees are counted, given hard hats, and allowed to go to the changing rooms in small groups to collect their warm clothing and car keys16:30: The employees are allowed to go home
Casualties None (‘a miracle’ in the words of the plant’s director).
Damage caused by the earthquake
Burst water pipes. Fallen cables. Collapsed suspended ceilings, air conditioner and •AC ducts. Broken light bulbs and windows500 PCs on the second-floor assembly and testing lines destroyed. Testing equipment •and four lifts and one conveyor damaged. A few walls were levelledInitial structural damage worsened by the April 2011 aftershocks (collapse of •cracked walls and suspended ceilings)
Damage in € More than €50 million
Chronology of resumption of
operations
12 March: A group of around 30 executives arrive on site to deploy the emergency response unit13 March: Buildings inspected, debris cleared away and operations to assess the internal damage begin. Decision taken to temporarily relocate desktop PC assembly operations to the Shimane laptop assembly plant in the south (company procedure to maintain operations in the event of extensive earthquake or fire damage)14 March: End of physical examinations of plant employees who were off on 11 March (complicated by power outages and overloaded lines of communication)18 March: Repairs to structural damage and leaks begin. Between 50 and 60 contractors set to work day and night, weekends included22 March: 130 employees and more than 300 contractors set to work repairing the assembly lines. The plant’s water supply is restored23 March: Transfer of equipment for tower-type PCs (test benches and software) completed. The Shimane plant begins assembling desktop PCs24 March: Desktop PC assembly line tested. The employees are forced to wear heavy winter clothing (no heating) and hard hats (risk of aftershocks)28 March: Desktop PC assembly line brought back onlineEarly April: Plant operating at 80% capacity despite the aftershocks that delay production and repairs20 April: Plant back at full capacity. Building repairs continue
Link ARIA 42429 online summary
COMPUTER ASSEMBLY PLANTFUJITSU ISOTEC - DATE FOCUS ON:
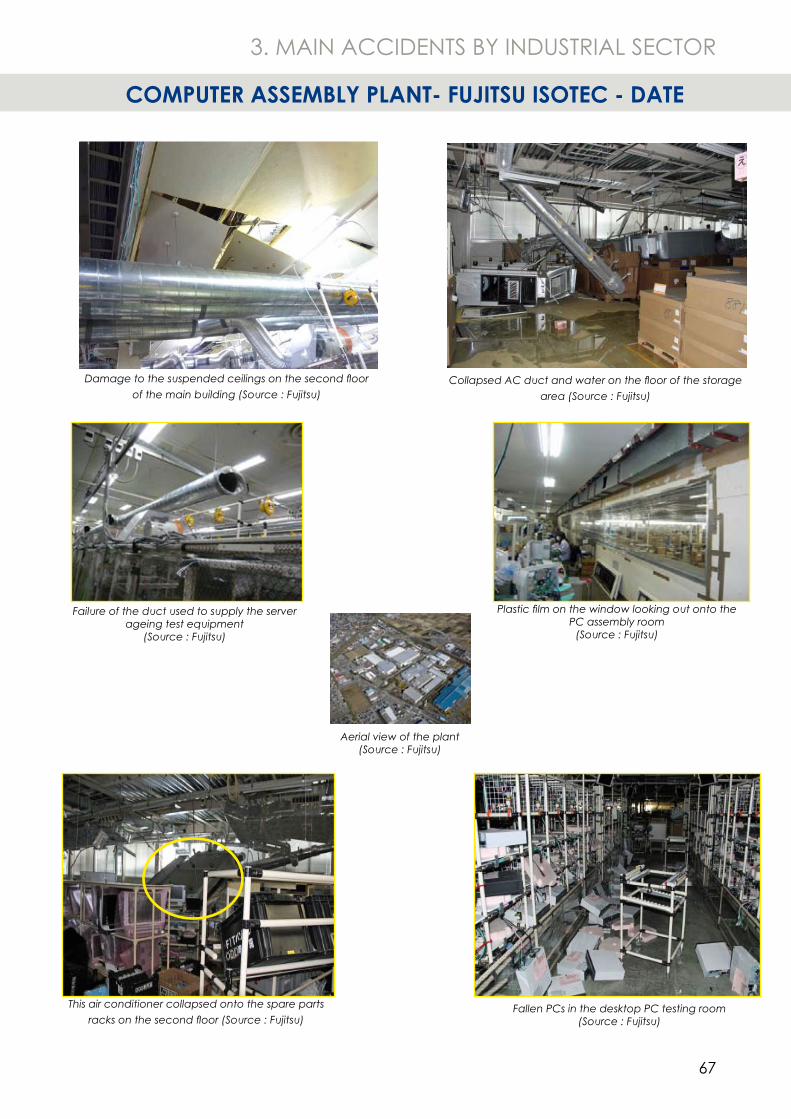
67
Fallen PCs in the desktop PC testing room (Source : Fujitsu)
This air conditioner collapsed onto the spare parts racks on the second floor (Source : Fujitsu)
Damage to the suspended ceilings on the second floor of the main building (Source : Fujitsu)
Plastic film on the window looking out onto the PC assembly room
(Source : Fujitsu)
3. MAIN ACCIDENTS BY INDUSTRIAL SECTOR
Collapsed AC duct and water on the floor of the storage area (Source : Fujitsu)
Aerial view of the plant (Source : Fujitsu)
Failure of the duct used to supply the server ageing test equipment
(Source : Fujitsu)
COMPUTER ASSEMBLY PLANT- FUJITSU ISOTEC - DATE
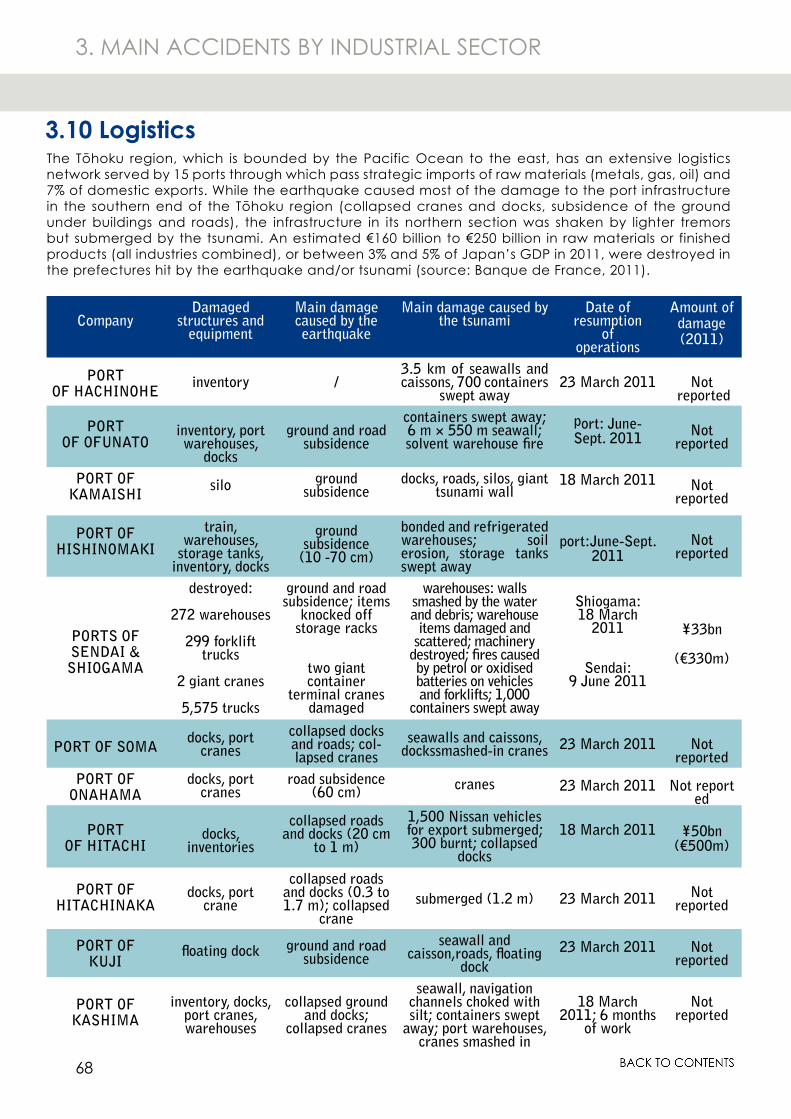
68
3. MAIN ACCIDENTS BY INDUSTRIAL SECTOR
The Tōhoku region, which is bounded by the Pacific Ocean to the east, has an extensive logistics network served by 15 ports through which pass strategic imports of raw materials (metals, gas, oil) and 7% of domestic exports. While the earthquake caused most of the damage to the port infrastructure in the southern end of the Tōhoku region (collapsed cranes and docks, subsidence of the ground under buildings and roads), the infrastructure in its northern section was shaken by lighter tremors but submerged by the tsunami. An estimated €160 billion to €250 billion in raw materials or finished products (all industries combined), or between 3% and 5% of Japan’s GDP in 2011, were destroyed in the prefectures hit by the earthquake and/or tsunami (source: Banque de France, 2011).
CompanyDamaged
structures and equipment
Main damage caused by the earthquake
Main damage caused by the tsunami
Date of resumption
of operations
Amount of damage(2011)
PORT OF HACHINOHE
inventory /3.5 km of seawalls and caissons, 700 containers
swept away23 March 2011 Not
reported
PORT OF OFUNATO
inventory, port warehouses,
docks
ground and road subsidence
containers swept away; 6 m × 550 m seawall; solvent warehouse fire
port: June-Sept. 2011 Not
reported
PORT OFKAMAISHI
silo ground subsidence
docks, roads, silos, giant tsunami wall
18 March 2011 Not reported
PORT OFHISHINOMAKI
train, warehouses,
storage tanks, inventory, docks
ground subsidence
(10 -70 cm)
bonded and refrigerated warehouses; soil erosion, storage tanks swept away
port:June-Sept. 2011
Not reported
PORTS OF SENDAI &SHIOGAMA
destroyed:
272 warehouses
299 forklift trucks
2 giant cranes
5,575 trucks
ground and road subsidence; items
knocked off storage racks
two giant container
terminal cranes damaged
warehouses: walls smashed by the water and debris; warehouse
items damaged and scattered; machinery
destroyed; fires caused by petrol or oxidised batteries on vehicles and forklifts; 1,000
containers swept away
Shiogama:18 March
2011
Sendai:9 June 2011
¥33bn
(€330m)
PORT OF SOMAdocks, port
cranescollapsed docks and roads; col-lapsed cranes
seawalls and caissons, dockssmashed-in cranes 23 March 2011 Not
reportedPORT OF
ONAHAMAdocks, port
cranesroad subsidence
(60 cm) cranes 23 March 2011 Not reported
PORTOF HITACHI
docks, inventories
collapsed roads and docks (20 cm
to 1 m)
1,500 Nissan vehicles for export submerged; 300 burnt; collapsed
docks
18 March 2011 ¥50bn(€500m)
PORT OF HITACHINAKA
docks, port crane
collapsed roads and docks (0.3 to 1.7 m); collapsed
cranesubmerged (1.2 m) 23 March 2011 Not
reported
PORT OFKUJI
floating dock ground and road subsidence
seawall and caisson,roads, floating
dock23 March 2011 Not
reported
PORT OF KASHIMA
inventory, docks, port cranes, warehouses
collapsed ground and docks;
collapsed cranes
seawall, navigation channels choked with silt; containers swept
away; port warehouses, cranes smashed in
18 March 2011; 6 months
of work
Not reported
3.10 Logistics
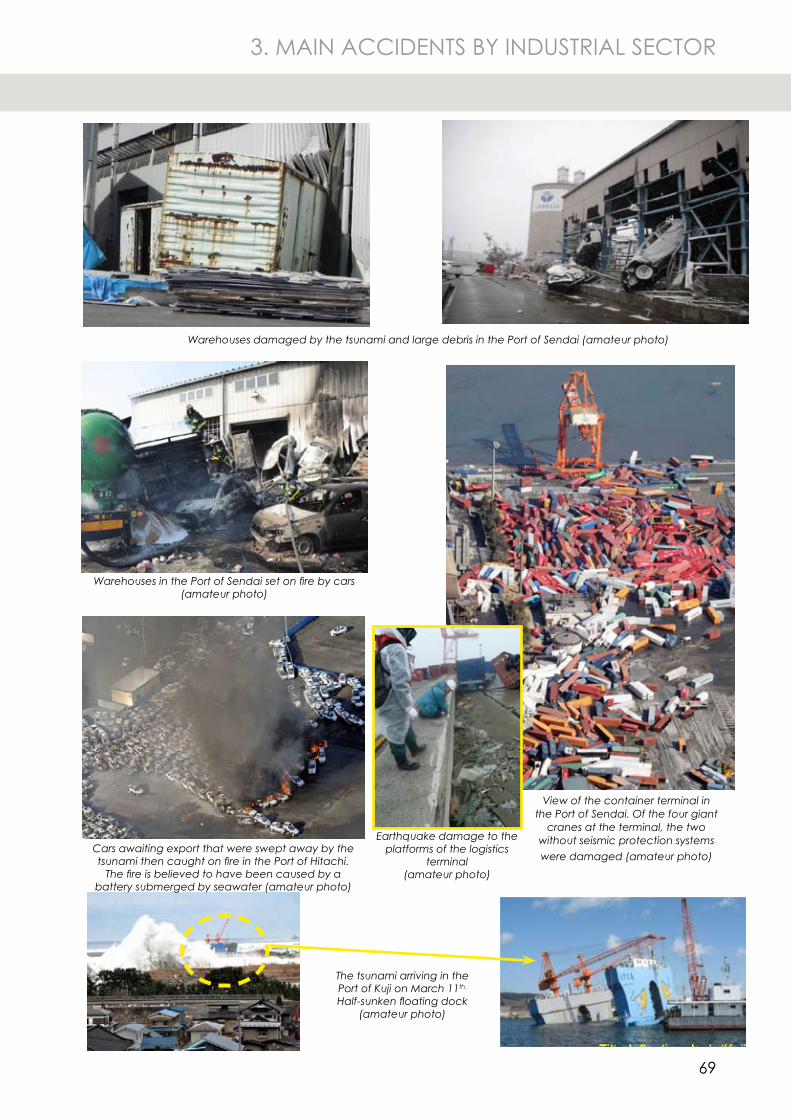
69
Warehouses in the Port of Sendai set on fire by cars (amateur photo)
Warehouses damaged by the tsunami and large debris in the Port of Sendai (amateur photo)
Cars awaiting export that were swept away by the tsunami then caught on fire in the Port of Hitachi.
The fire is believed to have been caused by a battery submerged by seawater (amateur photo)
The tsunami arriving in the Port of Kuji on March 11th. Half-sunken floating dock
(amateur photo)
View of the container terminal in the Port of Sendai. Of the four giant
cranes at the terminal, the two without seismic protection systems were damaged (amateur photo)
Earthquake damage to the platforms of the logistics
terminal(amateur photo)
3. MAIN ACCIDENTS BY INDUSTRIAL SECTOR
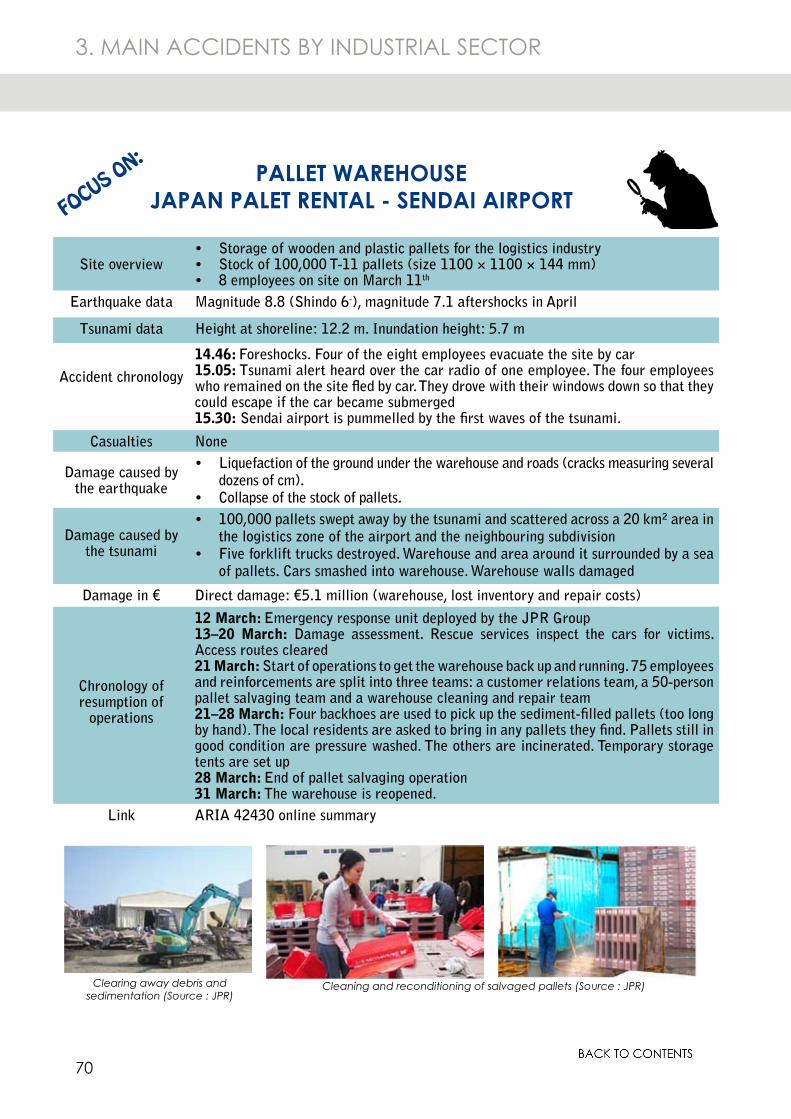
70
Clearing away debris and sedimentation (Source : JPR)
Cleaning and reconditioning of salvaged pallets (Source : JPR)
3. MAIN ACCIDENTS BY INDUSTRIAL SECTOR
Site overviewStorage of wooden and plastic pallets for the logistics industry•Stock of 100,000 T-11 pallets (size 1100 × 1100 × 144 mm)•8 employees on site on March 11• th
Earthquake data Magnitude 8.8 (Shindo 6-), magnitude 7.1 aftershocks in April
Tsunami data Height at shoreline: 12.2 m. Inundation height: 5.7 m
Accident chronology
14.46: Foreshocks. Four of the eight employees evacuate the site by car15.05: Tsunami alert heard over the car radio of one employee. The four employees who remained on the site fled by car. They drove with their windows down so that they could escape if the car became submerged15.30: Sendai airport is pummelled by the first waves of the tsunami.
Casualties None
Damage caused by the earthquake
Liquefaction of the ground under the warehouse and roads (cracks measuring several •dozens of cm).Collapse of the stock of pallets.•
Damage caused by the tsunami
100,000 pallets swept away by the tsunami and scattered across a 20 km² area in •the logistics zone of the airport and the neighbouring subdivisionFive forklift trucks destroyed. Warehouse and area around it surrounded by a sea •of pallets. Cars smashed into warehouse. Warehouse walls damaged
Damage in € Direct damage: €5.1 million (warehouse, lost inventory and repair costs)
Chronology of resumption of
operations
12 March: Emergency response unit deployed by the JPR Group13–20 March: Damage assessment. Rescue services inspect the cars for victims. Access routes cleared21 March: Start of operations to get the warehouse back up and running. 75 employees and reinforcements are split into three teams: a customer relations team, a 50-person pallet salvaging team and a warehouse cleaning and repair team21–28 March: Four backhoes are used to pick up the sediment-filled pallets (too long by hand). The local residents are asked to bring in any pallets they find. Pallets still in good condition are pressure washed. The others are incinerated. Temporary storage tents are set up28 March: End of pallet salvaging operation31 March: The warehouse is reopened.
Link ARIA 42430 online summary
PALLET WAREHOUSE JAPAN PALET RENTAL - SENDAI AIRPORTFOCUS ON:
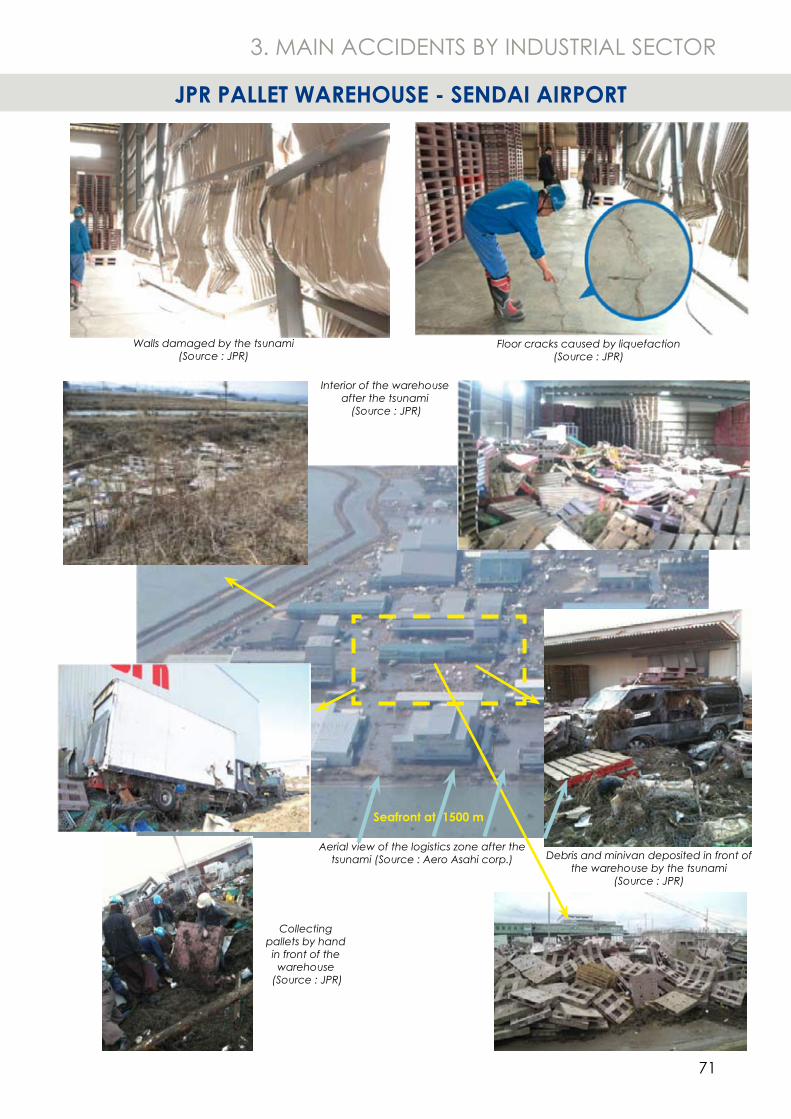
71
Walls damaged by the tsunami (Source : JPR)
Floor cracks caused by liquefaction (Source : JPR)
Aerial view of the logistics zone after the tsunami (Source : Aero Asahi corp.)
Interior of the warehouse after the tsunami
(Source : JPR)
Debris and minivan deposited in front of the warehouse by the tsunami
(Source : JPR)
Collecting pallets by hand in front of the warehouse
(Source : JPR)
Seafront at 1500 m
JPR PALLET WAREHOUSE - SENDAI AIRPORT
3. MAIN ACCIDENTS BY INDUSTRIAL SECTOR
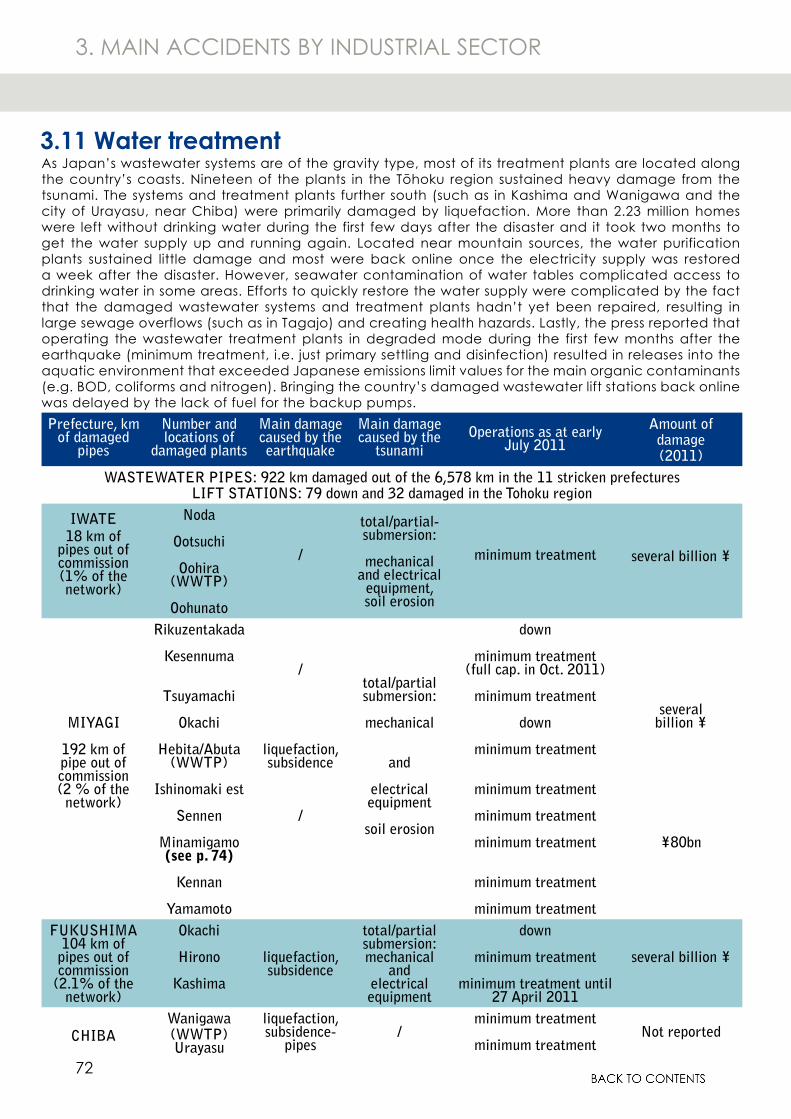
72
3. MAIN ACCIDENTS BY INDUSTRIAL SECTOR
3.11 Water treatmentAs Japan’s wastewater systems are of the gravity type, most of its treatment plants are located along the country’s coasts. Nineteen of the plants in the Tōhoku region sustained heavy damage from the tsunami. The systems and treatment plants further south (such as in Kashima and Wanigawa and the city of Urayasu, near Chiba) were primarily damaged by liquefaction. More than 2.23 million homes were left without drinking water during the first few days after the disaster and it took two months to get the water supply up and running again. Located near mountain sources, the water purification plants sustained little damage and most were back online once the electricity supply was restored a week after the disaster. However, seawater contamination of water tables complicated access to drinking water in some areas. Efforts to quickly restore the water supply were complicated by the fact that the damaged wastewater systems and treatment plants hadn’t yet been repaired, resulting in large sewage overflows (such as in Tagajo) and creating health hazards. Lastly, the press reported that operating the wastewater treatment plants in degraded mode during the first few months after the earthquake (minimum treatment, i.e. just primary settling and disinfection) resulted in releases into the aquatic environment that exceeded Japanese emissions limit values for the main organic contaminants (e.g. BOD, coliforms and nitrogen). Bringing the country’s damaged wastewater lift stations back online was delayed by the lack of fuel for the backup pumps.Prefecture, km
of damaged pipes
Number and locations of
damaged plants
Main damage caused by the earthquake
Main damage caused by the
tsunamiOperations as at early
July 2011Amount of damage(2011)
WASTEWATER PIPES: 922 km damaged out of the 6,578 km in the 11 stricken prefecturesLIFT STATIONS: 79 down and 32 damaged in the Tohoku region
IWATE18 km of
pipes out of commission(1% of the network)
Noda
Ootsuchi
Oohira (WWTP)
Oohunato
/
total/partial-submersion:
mechanical and electrical
equipment,soil erosion
minimum treatment several billion ¥
MIYAGI
192 km of pipe out of commission(2 % of the network)
Rikuzentakada
Kesennuma
Tsuyamachi
Okachi
Hebita/Abuta (WWTP)
Ishinomaki est
Sennen
Minamigamo(see p. 74)
Kennan
Yamamoto
/
liquefaction, subsidence
/
total/partial submersion:
mechanical
and
electrical equipment
soil erosion
down
minimum treatment(full cap. in Oct. 2011)
minimum treatment
down
minimum treatment
minimum treatment
minimum treatment
minimum treatment
minimum treatment
minimum treatment
several billion ¥
¥80bn
FUKUSHIMA 104 km of
pipes out of commission
(2.1% of the network)
Okachi
Hirono
Kashima
liquefaction, subsidence
total/partial submersion:mechanical
and electrical equipment
down
minimum treatment
minimum treatment until 27 April 2011
several billion ¥
CHIBAWanigawa(WWTP)Urayasu
liquefaction, subsidence-
pipes/
minimum treatment
minimum treatmentNot reported
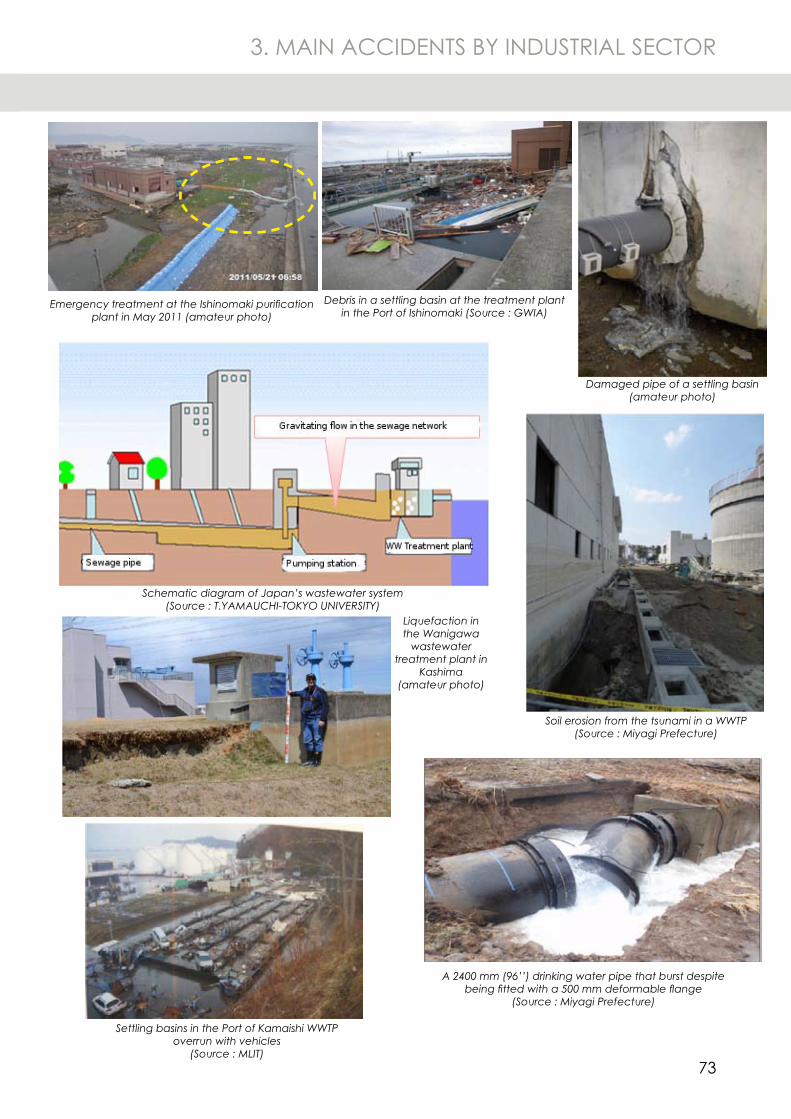
73
Emergency treatment at the Ishinomaki purification plant in May 2011 (amateur photo)
Debris in a settling basin at the treatment plant in the Port of Ishinomaki (Source : GWIA)
Damaged pipe of a settling basin (amateur photo)
Schematic diagram of Japan’s wastewater system(Source : T.YAMAUCHI-TOKYO UNIVERSITY)
Soil erosion from the tsunami in a WWTP (Source : Miyagi Prefecture)
A 2400 mm (96’’) drinking water pipe that burst despite being fitted with a 500 mm deformable flange
(Source : Miyagi Prefecture)
Liquefaction in the Wanigawa
wastewater treatment plant in
Kashima (amateur photo)
Settling basins in the Port of Kamaishi WWTP overrun with vehicles
(Source : MLIT)
3. MAIN ACCIDENTS BY INDUSTRIAL SECTOR
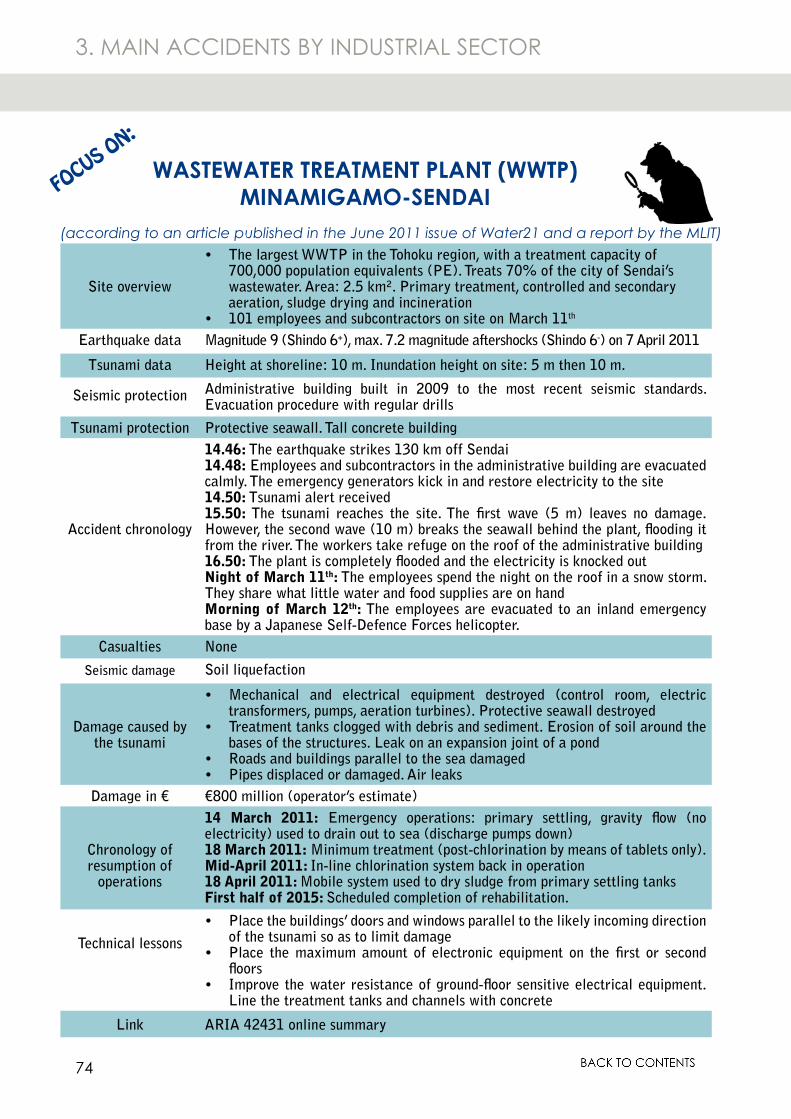
74
WASTEWATER TREATMENT PLANT (WWTP)MINAMIGAMO-SENDAI FOCUS ON:
(according to an article published in the June 2011 issue of Water21 and a report by the MLIT)
Site overview
The largest WWTP in the Tohoku region, with a treatment capacity of •700,000 population equivalents (PE). Treats 70% of the city of Sendai’s wastewater. Area: 2.5 km². Primary treatment, controlled and secondary aeration, sludge drying and incineration101 employees and subcontractors on site on March 11• th
Earthquake data Magnitude 9 (Shindo 6+), max. 7.2 magnitude aftershocks (Shindo 6-) on 7 April 2011
Tsunami data Height at shoreline: 10 m. Inundation height on site: 5 m then 10 m.
Seismic protection Administrative building built in 2009 to the most recent seismic standards. Evacuation procedure with regular drills
Tsunami protection Protective seawall. Tall concrete building
Accident chronology
14.46: The earthquake strikes 130 km off Sendai14.48: Employees and subcontractors in the administrative building are evacuated calmly. The emergency generators kick in and restore electricity to the site14.50: Tsunami alert received15.50: The tsunami reaches the site. The first wave (5 m) leaves no damage.However, the second wave (10 m) breaks the seawall behind the plant, flooding it from the river. The workers take refuge on the roof of the administrative building16.50: The plant is completely flooded and the electricity is knocked outNight of March 11th: The employees spend the night on the roof in a snow storm. They share what little water and food supplies are on handMorning of March 12th: The employees are evacuated to an inland emergency base by a Japanese Self-Defence Forces helicopter.
Casualties None
Seismic damage Soil liquefaction
Damage caused by the tsunami
Mechanical and electrical equipment destroyed (control room, electric •transformers, pumps, aeration turbines). Protective seawall destroyedTreatment tanks clogged with debris and sediment. Erosion of soil around the •bases of the structures. Leak on an expansion joint of a pondRoads and buildings parallel to the sea damaged•Pipes displaced or damaged. Air leaks•
Damage in € €800 million (operator’s estimate)
Chronology of resumption of
operations
14 March 2011: Emergency operations: primary settling, gravity flow (no electricity) used to drain out to sea (discharge pumps down)18 March 2011: Minimum treatment (post-chlorination by means of tablets only).Mid-April 2011: In-line chlorination system back in operation18 April 2011: Mobile system used to dry sludge from primary settling tanksFirst half of 2015: Scheduled completion of rehabilitation.
Technical lessons
Place the buildings’ doors and windows parallel to the likely incoming direction •of the tsunami so as to limit damagePlace the maximum amount of electronic equipment on the first or second •floorsImprove the water resistance of ground-floor sensitive electrical equipment.•Line the treatment tanks and channels with concrete
Link ARIA 42431 online summary
3. MAIN ACCIDENTS BY INDUSTRIAL SECTOR
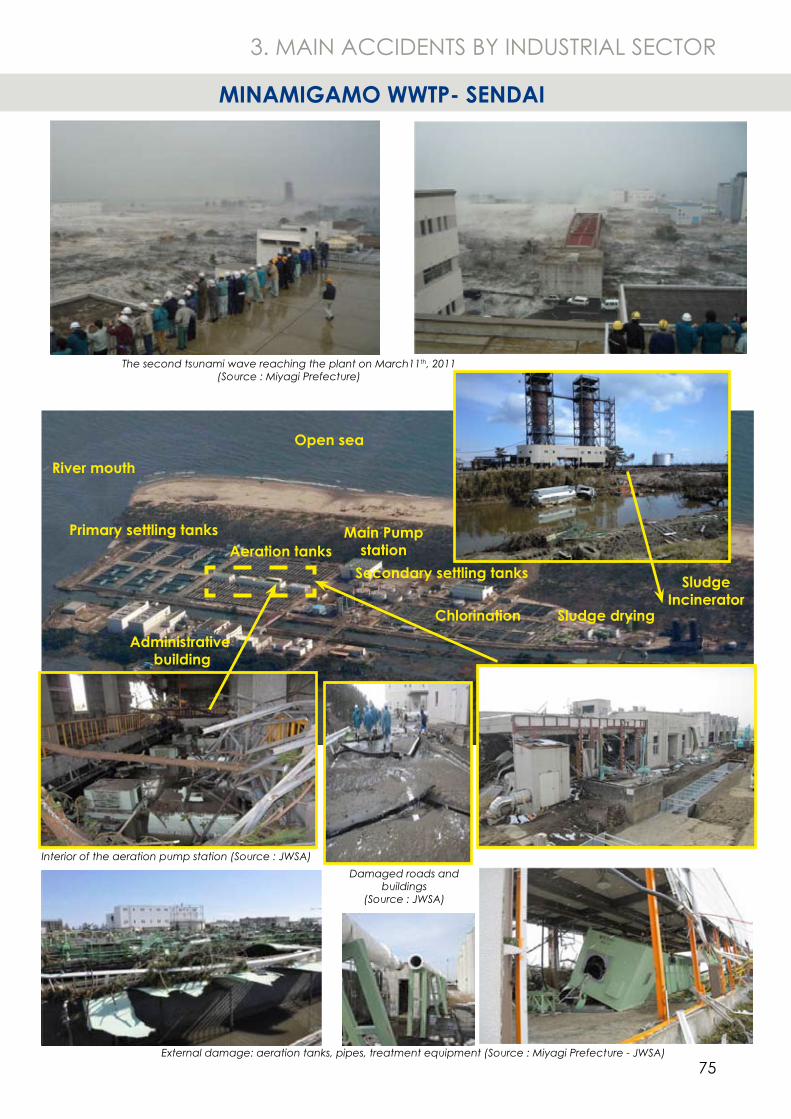
75
Sludge Incinerator
Primary settling tanks
Open sea
River mouth
Sludge drying
Aeration tanks
Administrative building
Chlorination
The second tsunami wave reaching the plant on March11th, 2011 (Source : Miyagi Prefecture)
Damaged roads and buildings
(Source : JWSA)
External damage: aeration tanks, pipes, treatment equipment (Source : Miyagi Prefecture - JWSA)
Secondary settling tanks
Interior of the aeration pump station (Source : JWSA)
MINAMIGAMO WWTP- SENDAI
Main Pump station
3. MAIN ACCIDENTS BY INDUSTRIAL SECTOR
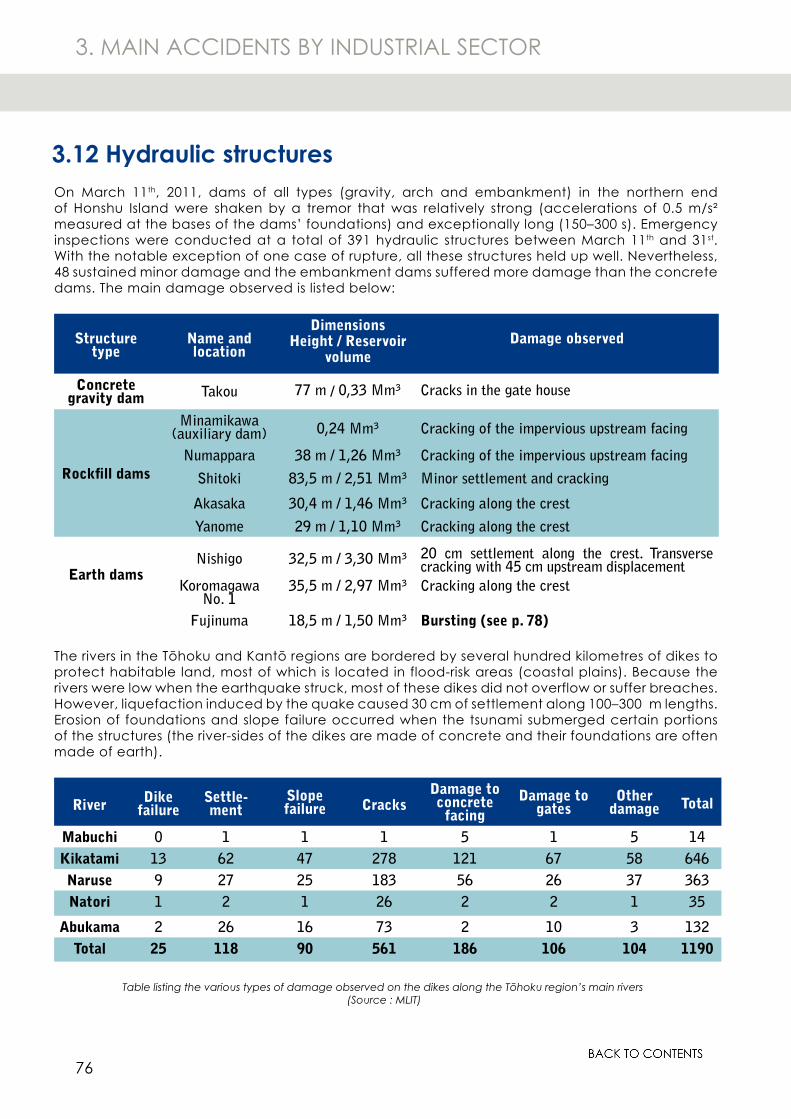
76
3. MAIN ACCIDENTS BY INDUSTRIAL SECTOR
3.12 Hydraulic structuresOn March 11th, 2011, dams of all types (gravity, arch and embankment) in the northern end of Honshu Island were shaken by a tremor that was relatively strong (accelerations of 0.5 m/s² measured at the bases of the dams’ foundations) and exceptionally long (150–300 s). Emergency inspections were conducted at a total of 391 hydraulic structures between March 11th and 31st. With the notable exception of one case of rupture, all these structures held up well. Nevertheless, 48 sustained minor damage and the embankment dams suffered more damage than the concrete dams. The main damage observed is listed below:
Structure type
Name and location
DimensionsHeight / Reservoir
volume Damage observed
Concrete gravity dam Takou 77 m / 0,33 Mm³ Cracks in the gate house
Rockfill dams
Minamikawa (auxiliary dam) 0,24 Mm³ Cracking of the impervious upstream facing
Numappara 38 m / 1,26 Mm³ Cracking of the impervious upstream facing
Shitoki 83,5 m / 2,51 Mm³ Minor settlement and cracking
Akasaka 30,4 m / 1,46 Mm³ Cracking along the crest
Yanome 29 m / 1,10 Mm³ Cracking along the crest
Earth damsNishigo 32,5 m / 3,30 Mm³ 20 cm settlement along the crest. Transverse
cracking with 45 cm upstream displacementKoromagawa
No. 135,5 m / 2,97 Mm³ Cracking along the crest
Fujinuma 18,5 m / 1,50 Mm³ Bursting (see p. 78)
The rivers in the Tōhoku and Kantō regions are bordered by several hundred kilometres of dikes to protect habitable land, most of which is located in flood-risk areas (coastal plains). Because the rivers were low when the earthquake struck, most of these dikes did not overflow or suffer breaches. However, liquefaction induced by the quake caused 30 cm of settlement along 100–300_m lengths. Erosion of foundations and slope failure occurred when the tsunami submerged certain portions of the structures (the river-sides of the dikes are made of concrete and their foundations are often made of earth).
River Dike failure
Settle-ment
Slope failure Cracks
Damage to concrete
facingDamage to
gatesOther
damage Total
Mabuchi 0 1 1 1 5 1 5 14Kikatami 13 62 47 278 121 67 58 646Naruse 9 27 25 183 56 26 37 363Natori 1 2 1 26 2 2 1 35
Abukama 2 26 16 73 2 10 3 132Total 25 118 90 561 186 106 104 1190
Table listing the various types of damage observed on the dikes along the Tōhoku region’s main rivers (Source : MLIT)
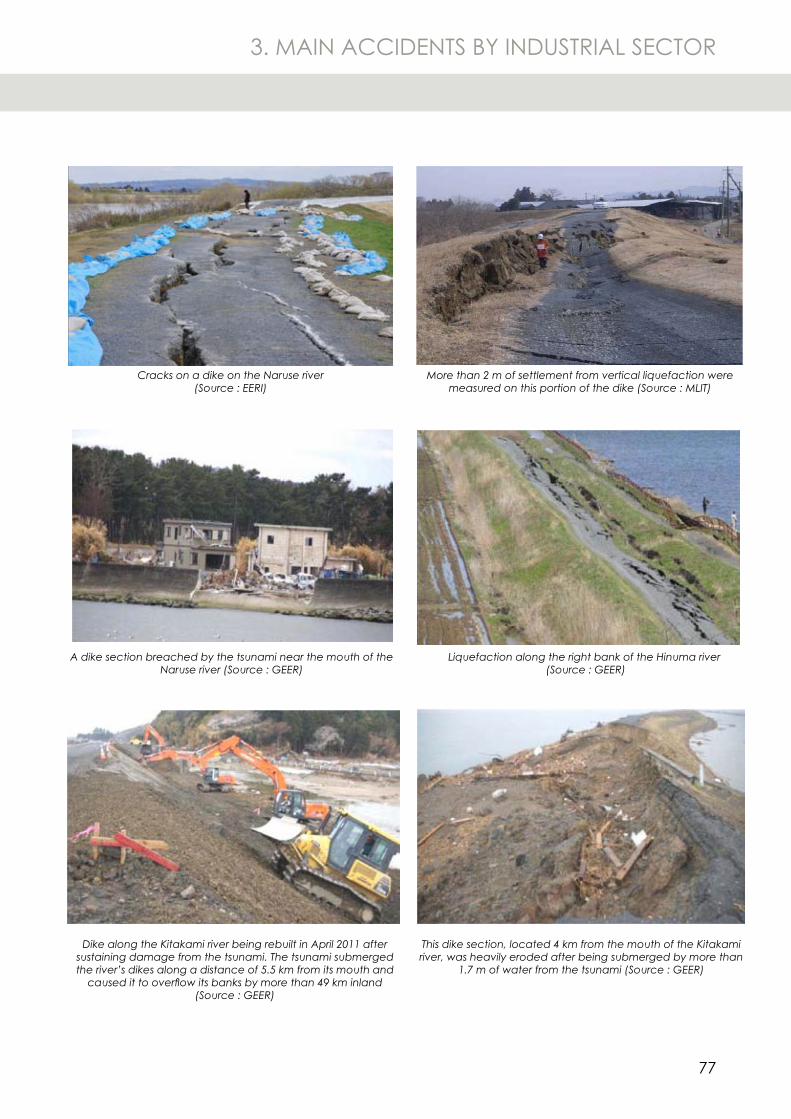
77
Cracks on a dike on the Naruse river(Source : EERI)
Dike along the Kitakami river being rebuilt in April 2011 after sustaining damage from the tsunami. The tsunami submerged the river’s dikes along a distance of 5.5 km from its mouth and
caused it to overflow its banks by more than 49 km inland (Source : GEER)
A dike section breached by the tsunami near the mouth of the Naruse river (Source : GEER)
More than 2 m of settlement from vertical liquefaction were measured on this portion of the dike (Source : MLIT)
This dike section, located 4 km from the mouth of the Kitakami river, was heavily eroded after being submerged by more than
1.7 m of water from the tsunami (Source : GEER)
Liquefaction along the right bank of the Hinuma river (Source : GEER)
3. MAIN ACCIDENTS BY INDUSTRIAL SECTOR
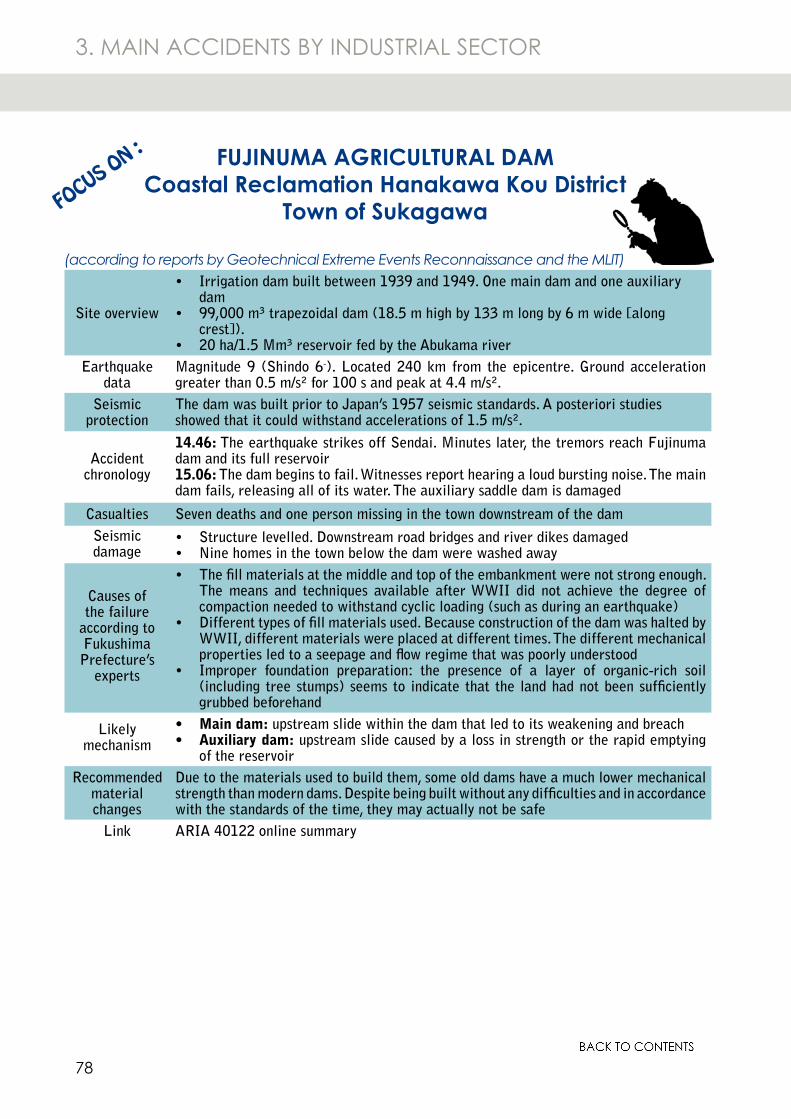
78
FUJINUMA AGRICULTURAL DAMCoastal Reclamation Hanakawa Kou District
Town of SukagawaFOCUS ON :
(according to reports by Geotechnical Extreme Events Reconnaissance and the MLIT)
Site overview
Irrigation dam built between 1939 and 1949. One main dam and one auxiliary •dam99,000 m³ trapezoidal dam (18.5 m high by 133 m long by 6 m wide [along •crest]).20 ha/1.5 Mm³ reservoir fed by the Abukama river•
Earthquake data
Magnitude 9 (Shindo 6-). Located 240 km from the epicentre. Ground acceleration greater than 0.5 m/s² for 100 s and peak at 4.4 m/s².
Seismic protection
The dam was built prior to Japan’s 1957 seismic standards. A posteriori studies showed that it could withstand accelerations of 1.5 m/s².
Accident chronology
14.46: The earthquake strikes off Sendai. Minutes later, the tremors reach Fujinuma dam and its full reservoir15.06: The dam begins to fail. Witnesses report hearing a loud bursting noise. The main dam fails, releasing all of its water. The auxiliary saddle dam is damaged
Casualties Seven deaths and one person missing in the town downstream of the damSeismic damage
Structure levelled. Downstream road bridges and river dikes damaged•Nine homes in the town below the dam were washed away•
Causes of the failure
according to Fukushima
Prefecture’s experts
The fill materials at the middle and top of the embankment were not strong enough. •The means and techniques available after WWII did not achieve the degree of compaction needed to withstand cyclic loading (such as during an earthquake)Different types of fill materials used. Because construction of the dam was halted by •WWII, different materials were placed at different times. The different mechanical properties led to a seepage and flow regime that was poorly understoodImproper foundation preparation: the presence of a layer of organic-rich soil •(including tree stumps) seems to indicate that the land had not been sufficiently grubbed beforehand
Likely mechanism
Main dam:• upstream slide within the dam that led to its weakening and breachAuxiliary dam:• upstream slide caused by a loss in strength or the rapid emptying of the reservoir
Recommended material changes
Due to the materials used to build them, some old dams have a much lower mechanical strength than modern dams. Despite being built without any difficulties and in accordance with the standards of the time, they may actually not be safe
Link ARIA 40122 online summary
3. MAIN ACCIDENTS BY INDUSTRIAL SECTOR
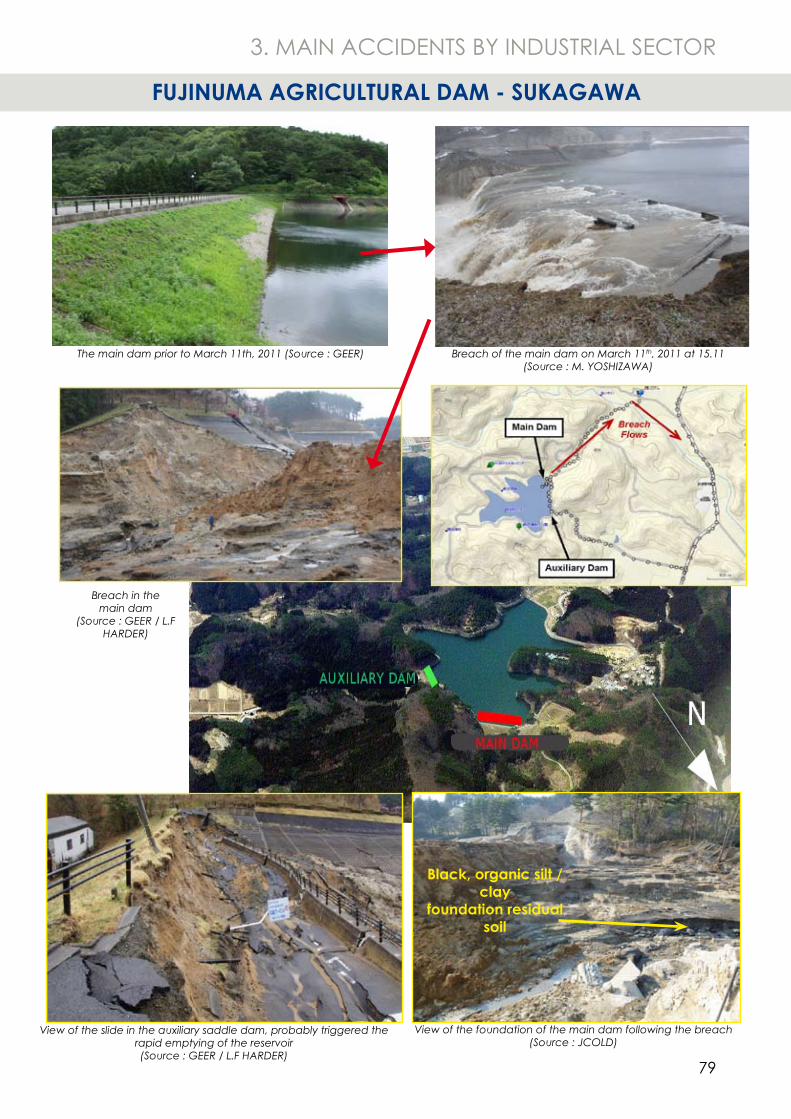
79
The main dam prior to March 11th, 2011 (Source : GEER)
Black, organic silt / clay
foundation residual soil
View of the foundation of the main dam following the breach(Source : JCOLD)
Breach of the main dam on March 11th, 2011 at 15.11(Source : M. YOSHIZAWA)
Breach in the main dam
(Source : GEER / L.F HARDER)
View of the slide in the auxiliary saddle dam, probably triggered the rapid emptying of the reservoir(Source : GEER / L.F HARDER)
FUJINUMA AGRICULTURAL DAM - SUKAGAWA
3. MAIN ACCIDENTS BY INDUSTRIAL SECTOR
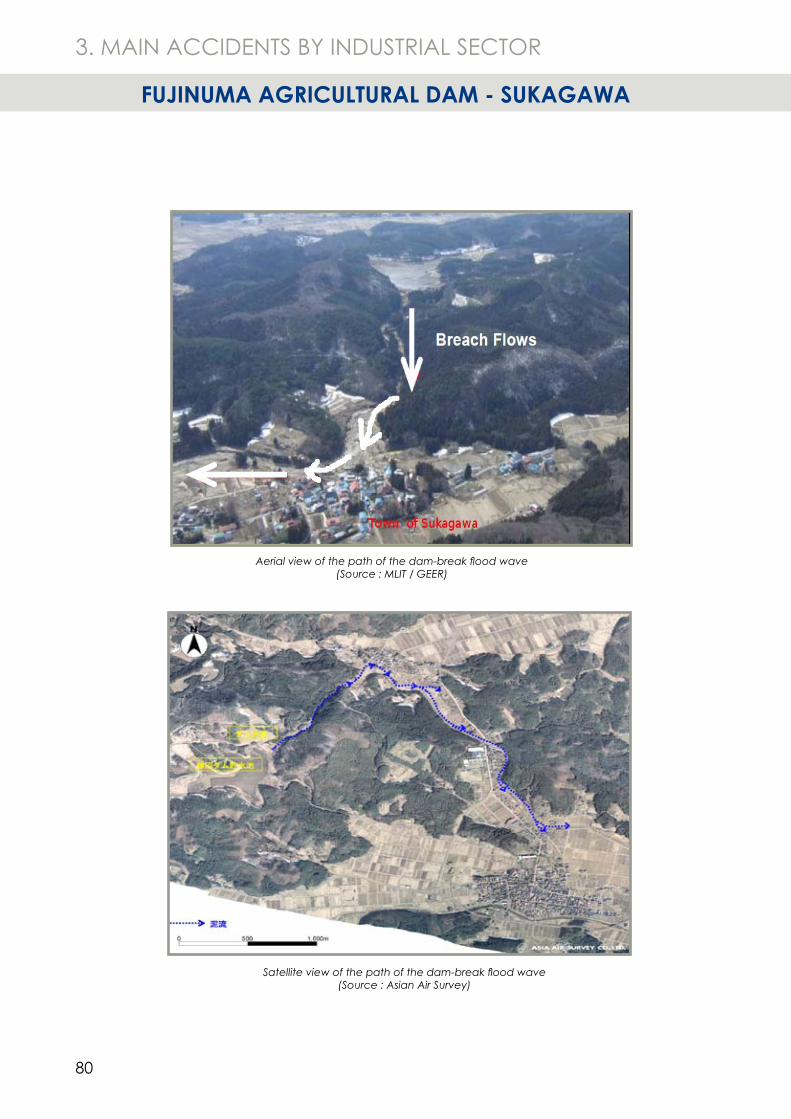
80
Aerial view of the path of the dam-break flood wave(Source : MLIT / GEER)
FUJINUMA AGRICULTURAL DAM - SUKAGAWA
Satellite view of the path of the dam-break flood wave(Source : Asian Air Survey)
3. MAIN ACCIDENTS BY INDUSTRIAL SECTOR
81
CHAPTER 4
POLLUTION AND WASTE
MANAGEMENT
82
4. POLLUTION AND WASTE MANAGEMENT
The pollution events caused by the 2011 Tōhoku earthquake and tsunami can be split into the following categories:
Pollution events directly related to industrial activities:• such pollution events were generally caused by hazardous or polluting substances that leaked out of storage tanks and pipes breached by the earthquake or tsunami. According to the limited information in the tables on the following pages, these pollution events occurred at specific places and were limited in size. A few pollution events involving hydrocarbons or mine tailings and up to a few dozen km² in size are exceptions. Lastly, many micro-pollution events were caused by packaged products that were swept away by the tsunami and damaged (e.g. cylinders of chemicals in the Port of Sendai, fish and bags of fertilizer in the Port of Ishinomaki)...
Pollution events indirectly related to former industrial activities: • several years of measurements will be necessary to determine whether several decades’ worth of accumulated industrial pollutants (heavy metals, persistent organic pollutants) may have leached from coastal marine sediments deposited by the tsunami. An initial study from Tōhoku University and published in July 2011 suggests a rise in arsenic levels in several areas of Iwate and Miyagi prefectures that is probably related to mining operations in these same areas.
Pollution events caused by the tsunami and debris carried by tsunami: • vast swaths of coastal farmland were salinised by the tsunami and will have to be desalinated before they can be reused. Water tables contaminated by seawater seepage have become unfit for consumption and must be desalinated. Wrecked vehicles and boats leaked out hydrocarbons, causing scores of micro-pollution events. PCB-contaminated dielectric oils from old electrical transformers and capacitors destroyed by the disaster were another source of localised pollution.
Pollution events caused by waste disposal: • due to limited space, incineration has historically been the primary means of waste disposal in Japan. However, the incineration of seawater-soaked debris without any preliminary treatment creates health hazards (release of dioxin-filled smoke) and the risk of corrosion of facilities due to the formation of hydrochloric acid. The storage and handling of hazardous waste (asbestos, PCBs, chemicals packaging) also poses the problem of soil and groundwater in and around storage sites becoming contaminated through leaching. Lastly, there are the usual nuisances of windblown litter and odours from temporary waste storage sites.
4.1 Pollution
Needless to say, the days and weeks that followed the 2011 Tōhoku earthquake and tsunami were spent rescuing survivors, getting utilities back up and running and sending emergency provisions and equipment where needed. However, the enormity of the consequences that the Japanese authorities and operators of industrial sites would have to manage rapidly became clear. In the first few months after the disaster, priority was on managing so-called ‘chronic’ risks. Although less dramatic than fires or explosions, the challenges they posed for Japan’s population and environment in the short, medium and long terms were no less significant. This chapter presents the pollution events recorded in the Tōhoku region and the challenge of the overall management of the waste resulting from the tsunami. The example of the Nippon Paper papermaking complex, overrun by a mountain of debris from the surrounding area (see p. 22), illustrates well that both industrial sites and local communities were confronted by this challenge, which included incinerating as much waste as feasibly possible.
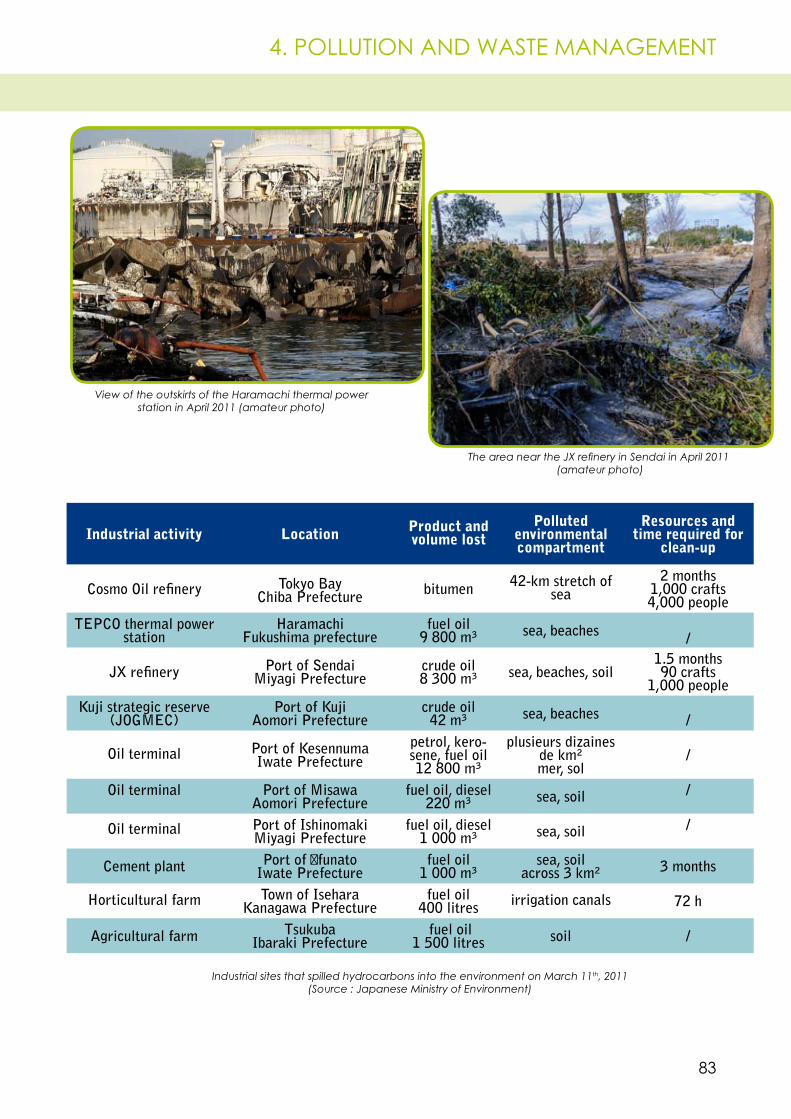
83
4. POLLUTION AND WASTE MANAGEMENT
The area near the JX refinery in Sendai in April 2011 (amateur photo)
Industrial activity Location Product and volume lost
Polluted environmental compartment
Resources and time required for
clean-up
Cosmo Oil refinery Tokyo BayChiba Prefecture bitumen 42-km stretch of
sea2 months
1,000 crafts4,000 people
TEPCO thermal power station
HaramachiFukushima prefecture
fuel oil9 800 m³ sea, beaches /
JX refinery Port of SendaiMiyagi Prefecture
crude oil8 300 m³ sea, beaches, soil
1.5 months90 crafts
1,000 peopleKuji strategic reserve
(JOGMEC)Port of Kuji
Aomori Prefecturecrude oil42 m³ sea, beaches /
Oil terminal Port of KesennumaIwate Prefecture
petrol, kero-sene, fuel oil12 800 m³
plusieurs dizaines de km²mer, sol
/
Oil terminal Port of MisawaAomori Prefecture
fuel oil, diesel220 m³ sea, soil /
Oil terminal Port of IshinomakiMiyagi Prefecture
fuel oil, diesel1 000 m³ sea, soil /
Cement plant Port of ŌfunatoIwate Prefecture
fuel oil1 000 m³
sea, soilacross 3 km² 3 months
Horticultural farm Town of IseharaKanagawa Prefecture
fuel oil400 litres irrigation canals 72 h
Agricultural farm TsukubaIbaraki Prefecture
fuel oil1 500 litres soil /
View of the outskirts of the Haramachi thermal power station in April 2011 (amateur photo)
Industrial sites that spilled hydrocarbons into the environment on March 11th, 2011(Source : Japanese Ministry of Environment)
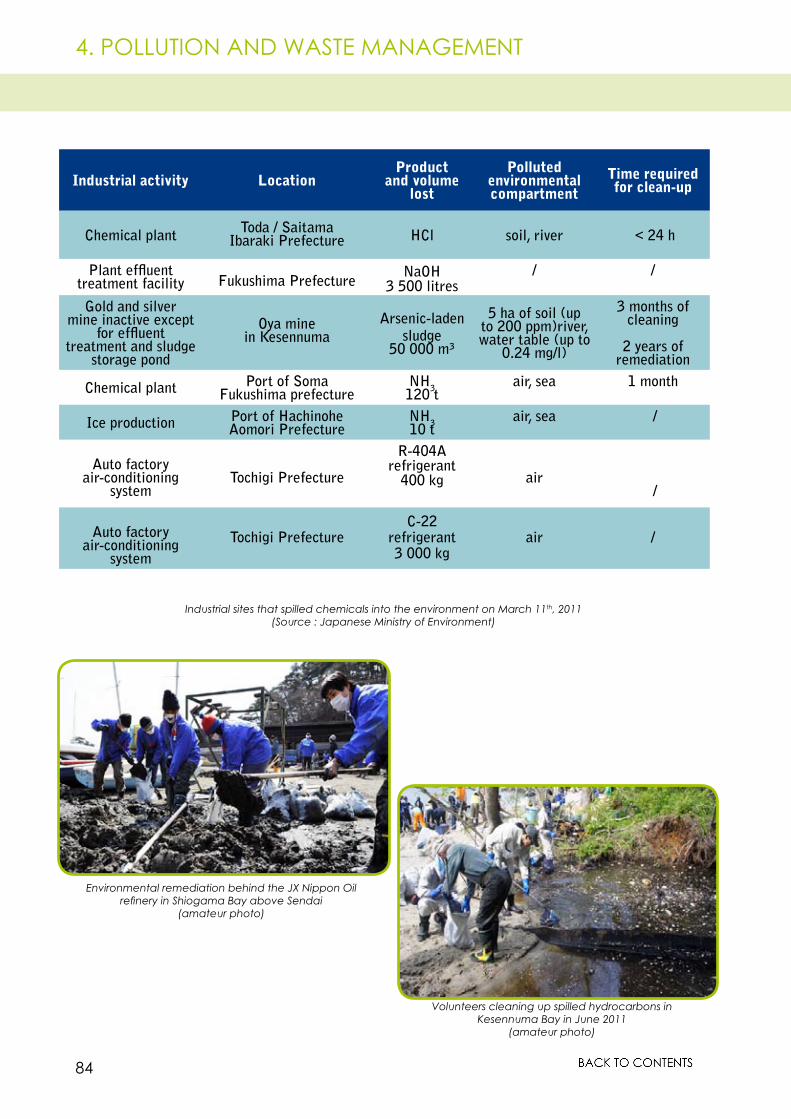
84
Environmental remediation behind the JX Nippon Oil refinery in Shiogama Bay above Sendai
(amateur photo)
4. POLLUTION AND WASTE MANAGEMENT
Industrial activity LocationProduct
and volume lost
Polluted environmental compartment
Time required for clean-up
Chemical plant Toda / SaitamaIbaraki Prefecture HCl soil, river < 24 h
Plant effluent treatment facility Fukushima Prefecture
NaOH3 500 litres
/ /
Gold and silver mine inactive except
for effluent treatment and sludge
storage pond
Oya minein Kesennuma
Arsenic-laden sludge
50 000 m³
5 ha of soil (up to 200 ppm)river, water table (up to
0.24 mg/l)
3 months of cleaning
2 years of remediation
Chemical plant Port of SomaFukushima prefecture
NH3 120 tair, sea 1 month
Ice production Port of HachinoheAomori Prefecture
NH310 t air, sea /
Auto factoryair-conditioning
systemTochigi Prefecture
R-404A refrigerant
400 kg air /
Auto factoryair-conditioning
systemTochigi Prefecture
C-22 refrigerant3 000 kg
air /
Volunteers cleaning up spilled hydrocarbons in Kesennuma Bay in June 2011
(amateur photo)
Industrial sites that spilled chemicals into the environment on March 11th, 2011(Source : Japanese Ministry of Environment)
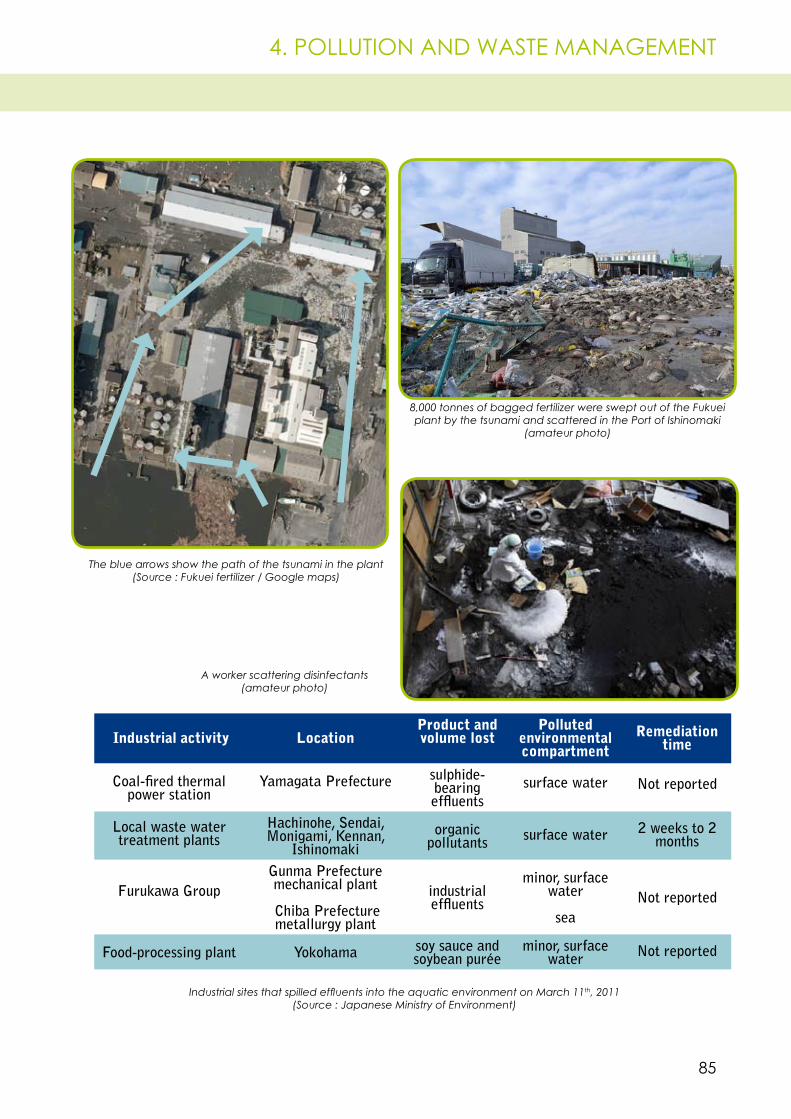
85
8,000 tonnes of bagged fertilizer were swept out of the Fukuei plant by the tsunami and scattered in the Port of Ishinomaki
(amateur photo)
The blue arrows show the path of the tsunami in the plant(Source : Fukuei fertilizer / Google maps)
A worker scattering disinfectants(amateur photo)
4. POLLUTION AND WASTE MANAGEMENT
Industrial activity LocationProduct and volume lost
Polluted environmental compartment
Remediation time
Coal-fired thermal power station
Yamagata Prefecture sulphide-bearing effluents
surface water Not reported
Local waste water treatment plants
Hachinohe, Sendai, Monigami, Kennan,
Ishinomakiorganic
pollutants surface water 2 weeks to 2 months
Furukawa GroupGunma Prefecturemechanical plant
Chiba Prefecturemetallurgy plant
industrial effluents
minor, surface water
seaNot reported
Food-processing plant Yokohama soy sauce and soybean purée
minor, surface water Not reported
Industrial sites that spilled effluents into the aquatic environment on March 11th, 2011(Source : Japanese Ministry of Environment)
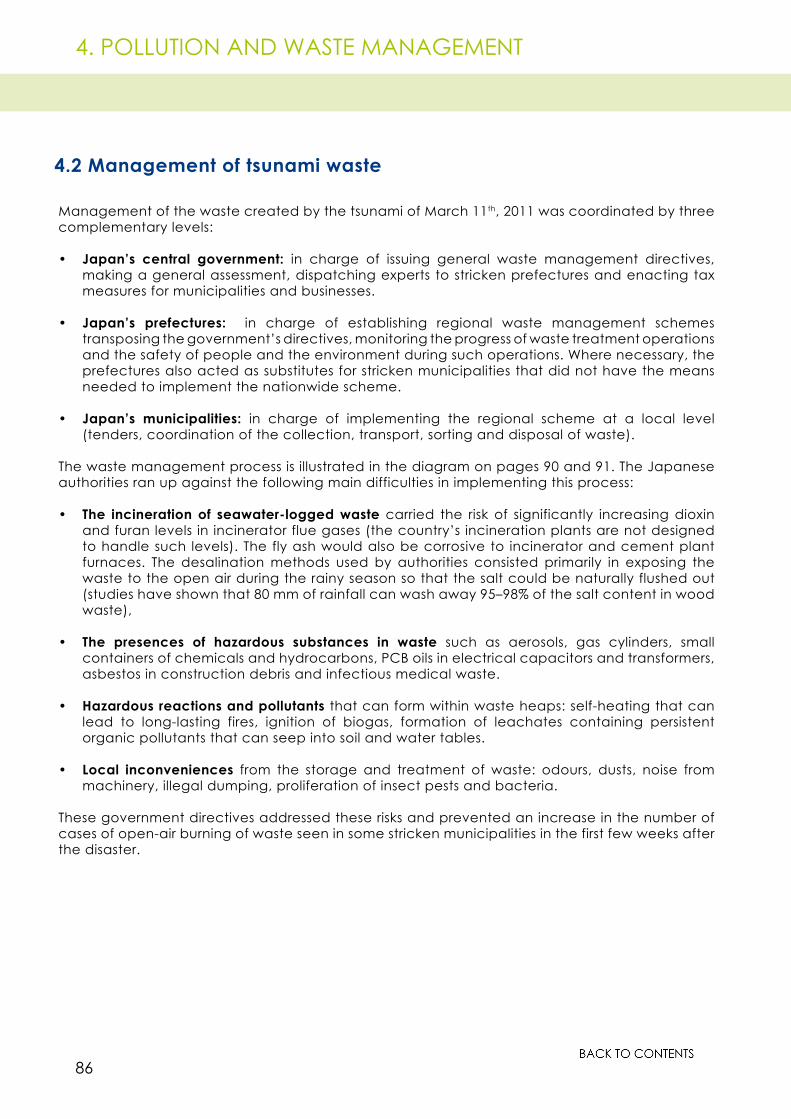
86
4. POLLUTION AND WASTE MANAGEMENT
4.2 Management of tsunami waste
Management of the waste created by the tsunami of March 11th, 2011 was coordinated by three complementary levels:
Japan’s central government: • in charge of issuing general waste management directives, making a general assessment, dispatching experts to stricken prefectures and enacting tax measures for municipalities and businesses.
Japan’s prefectures:• in charge of establishing regional waste management schemes transposing the government’s directives, monitoring the progress of waste treatment operations and the safety of people and the environment during such operations. Where necessary, the prefectures also acted as substitutes for stricken municipalities that did not have the means needed to implement the nationwide scheme.
Japan’s municipalities: • in charge of implementing the regional scheme at a local level (tenders, coordination of the collection, transport, sorting and disposal of waste).
The waste management process is illustrated in the diagram on pages 90 and 91. The Japanese authorities ran up against the following main difficulties in implementing this process:
The incineration of seawater-logged waste • carried the risk of significantly increasing dioxin and furan levels in incinerator flue gases (the country’s incineration plants are not designed to handle such levels). The fly ash would also be corrosive to incinerator and cement plant furnaces. The desalination methods used by authorities consisted primarily in exposing the waste to the open air during the rainy season so that the salt could be naturally flushed out (studies have shown that 80 mm of rainfall can wash away 95–98% of the salt content in wood waste),
The presences of hazardous substances in waste• such as aerosols, gas cylinders, small containers of chemicals and hydrocarbons, PCB oils in electrical capacitors and transformers, asbestos in construction debris and infectious medical waste.
Hazardous reactions and pollutants • that can form within waste heaps: self-heating that can lead to long-lasting fires, ignition of biogas, formation of leachates containing persistent organic pollutants that can seep into soil and water tables.
Local inconveniences • from the storage and treatment of waste: odours, dusts, noise from machinery, illegal dumping, proliferation of insect pests and bacteria.
These government directives addressed these risks and prevented an increase in the number of cases of open-air burning of waste seen in some stricken municipalities in the first few weeks after the disaster.

87
4. POLLUTION AND WASTE MANAGEMENT
Tsunami waste distribution among stricken prefectures(Source : Japanese Ministry of Environment) Types of waste collected in Iwate Prefecture after the disaster
(Source : Iwate Prefecture)
The volume of waste to be treated was officially estimated at 25 million tonnes, a level that far exceeded the annual treatment capacities of the disaster-stricken prefectures (see table on p. 88). The transfer of sorted waste to incineration facilities in other prefectures was complicated by the fact that citizens of these prefectures often refused to have this potentially radioactive waste incinerated near their homes. A petition to this effect was signed by thousands of Kyoto residents in the summer of 2011. Furthermore, large volumes had to be carried and the road infrastructure in some prefectures is not designed to cope with heavy truck traffic (narrow, steep coastal roads). As a result, waste had to be carried by boat. Experts at the University of Tokyo have estimated that it will take at least 5 years to treat and dispose of all this waste and that disposal will cost ¥6.8 billion (€68 billion).
Combustible materials (wood, plastic, etc.) make up the bulk of this waste. In addition to the incineration facilities already in place before the disaster and those specifically built afterward (in under 3 months for some), furnaces in cement plants and biomass boilers at chemical, paper mill and food-processing sites in Japan have been put to great use to burn the desalted waste (see chapter 3). The considerable amount of wood debris and the vast forest land in the Tōhoku region have spawned projects to build biomass plants to reduce the dependence of Japan’s energy sector on imported raw materials (fuel oil, LPG, etc).
Lastly, the authorities are faced with the other huge problem of dealing with the more than 10 million m³ of sedimentation estimated to have been deposited by the tsunami and which may be partially contaminated.
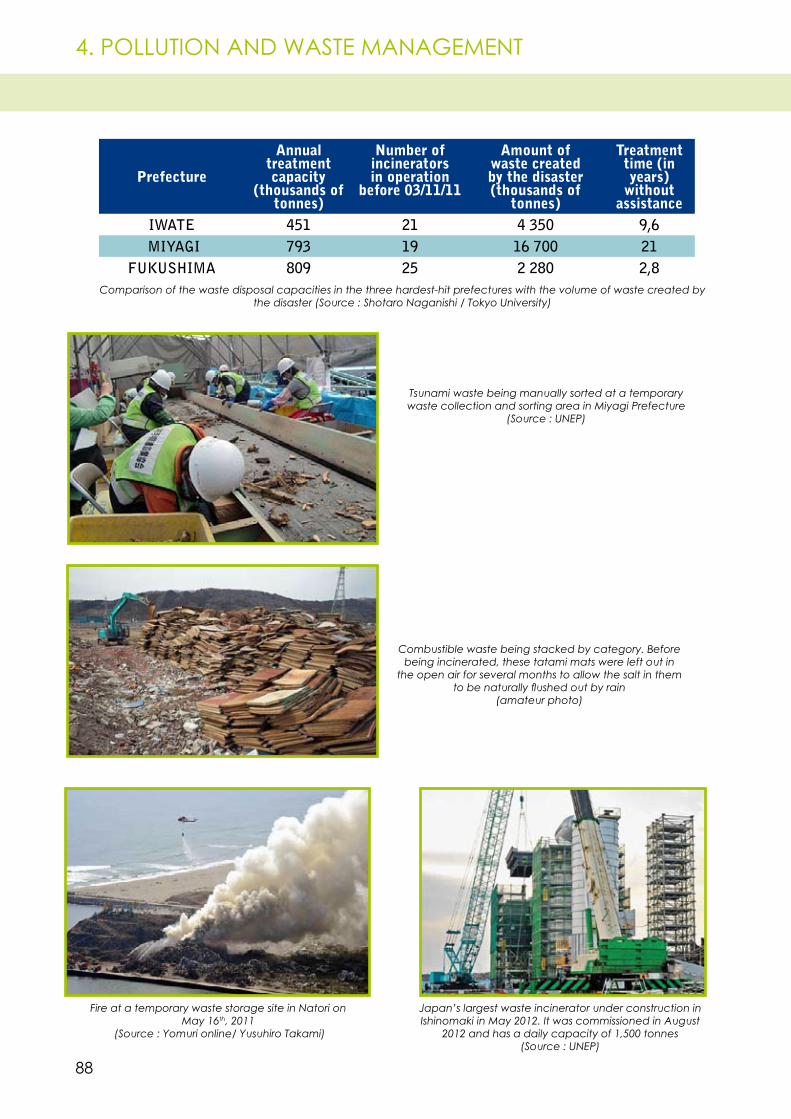
88
4. POLLUTION AND WASTE MANAGEMENT
Prefecture
Annual treatment capacity
(thousands of tonnes)
Number of incinerators in operation
before 03/11/11
Amount of waste created by the disaster (thousands of
tonnes)
Treatment time (in years)
without assistance
IWATE 451 21 4 350 9,6 MIYAGI 793 19 16 700 21
FUKUSHIMA 809 25 2 280 2,8
Fire at a temporary waste storage site in Natori on May 16th, 2011
(Source : Yomuri online/ Yusuhiro Takami)
Japan’s largest waste incinerator under construction in Ishinomaki in May 2012. It was commissioned in August
2012 and has a daily capacity of 1,500 tonnes (Source : UNEP)
Comparison of the waste disposal capacities in the three hardest-hit prefectures with the volume of waste created by the disaster (Source : Shotaro Naganishi / Tokyo University)
Tsunami waste being manually sorted at a temporary waste collection and sorting area in Miyagi Prefecture
(Source : UNEP)
Combustible waste being stacked by category. Before being incinerated, these tatami mats were left out in
the open air for several months to allow the salt in them to be naturally flushed out by rain
(amateur photo)
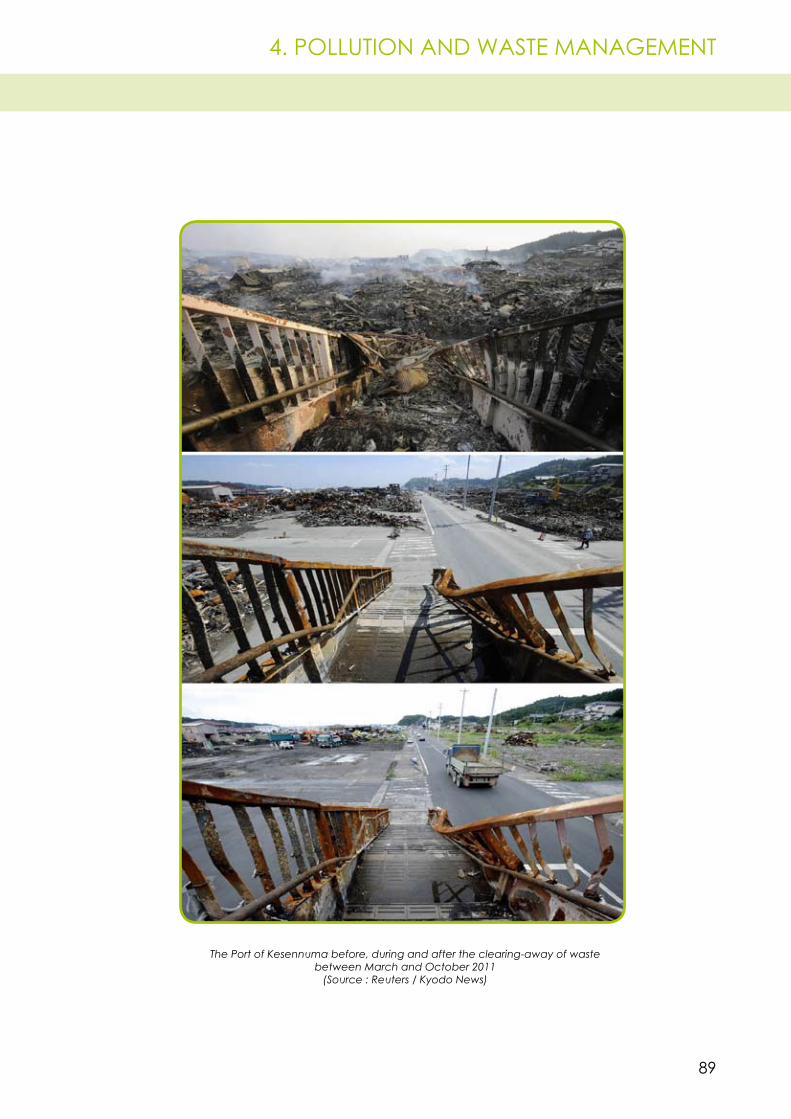
89
4. POLLUTION AND WASTE MANAGEMENT
The Port of Kesennuma before, during and after the clearing-away of waste between March and October 2011
(Source : Reuters / Kyodo News)
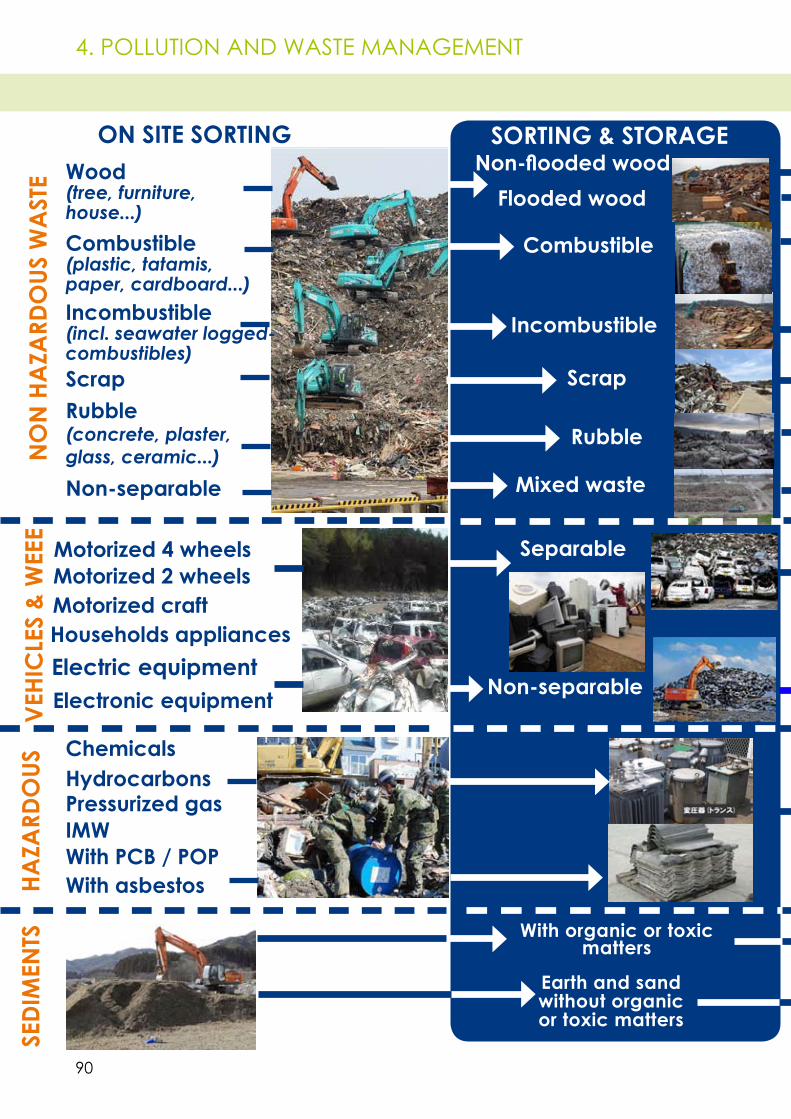
90
4. POLLUTION AND WASTE MANAGEMENT
ON SITE SORTING
NO
N H
AZA
RDO
US W
AST
E H
AZA
RDO
USVE
HIC
LES
& W
EEE
SED
IMEN
TS
Combustible (plastic, tatamis,paper, cardboard...)
Wood (tree, furniture,house...)
ScrapRubble (concrete, plaster, glass, ceramic...)
Incombustible (incl. seawater logged-combustibles)
ChemicalsHydrocarbons
With PCB / POPWith asbestos
Motorized 4 wheelsMotorized 2 wheelsMotorized craftHouseholds appliancesElectric equipmentElectronic equipment
Flooded wood
Non-separable Mixed waste
Rubble
Combustible
Scrap
Separable
Non-separable
With organic or toxic matters
Earth and sandwithout organic or toxic matters
Non-flooded wood
Incombustible
SORTING & STORAGE
Pressurized gasIMW
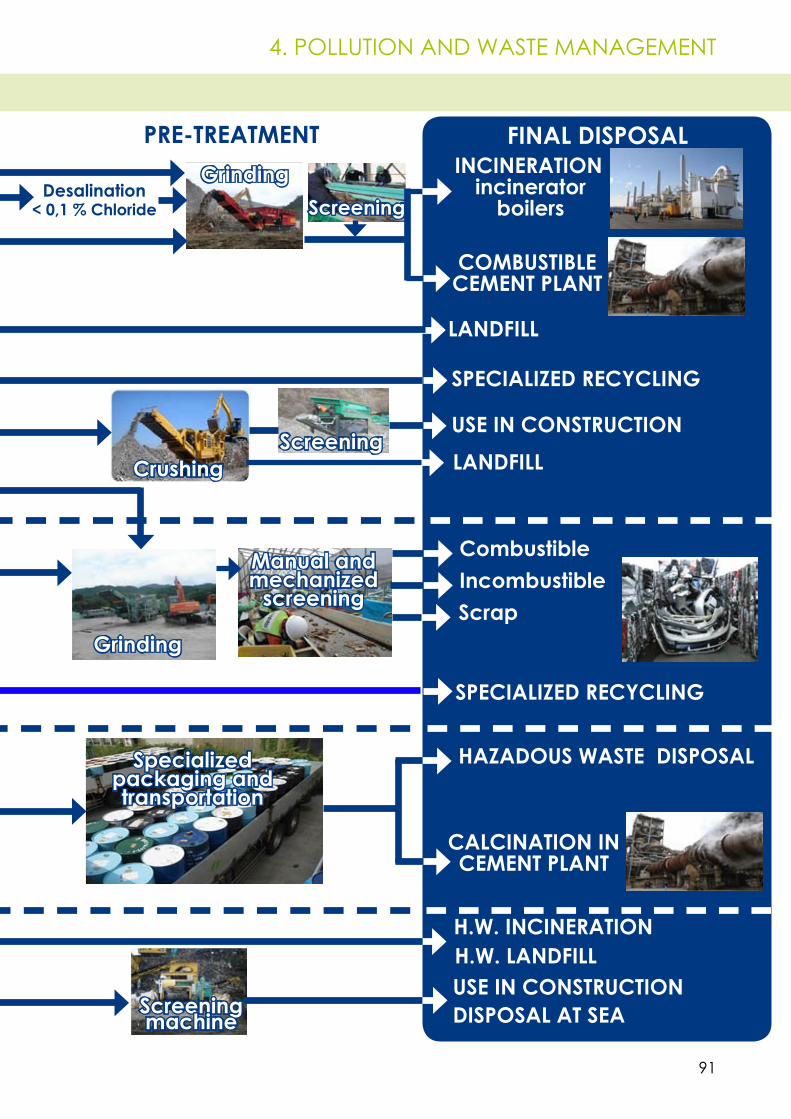
91
4. POLLUTION AND WASTE MANAGEMENT
PRE-TREATMENT
Manual and mechanized
screening
Grinding
Crushing
Screening machine
ScreeningDesalination
< 0,1 % Chloride
FINAL DISPOSAL
LANDFILL
DISPOSAL AT SEA
USE IN CONSTRUCTION
USE IN CONSTRUCTIONH.W. LANDFILLH.W. INCINERATION
HAZADOUS WASTE DISPOSAL
SPECIALIZED RECYCLING
CombustibleIncombustibleScrap
COMBUSTIBLECEMENT PLANT
CALCINATION IN CEMENT PLANT
Specialized packaging and transportation
Grinding INCINERATIONincinerator
boilers
LANDFILLScreening
SPECIALIZED RECYCLING
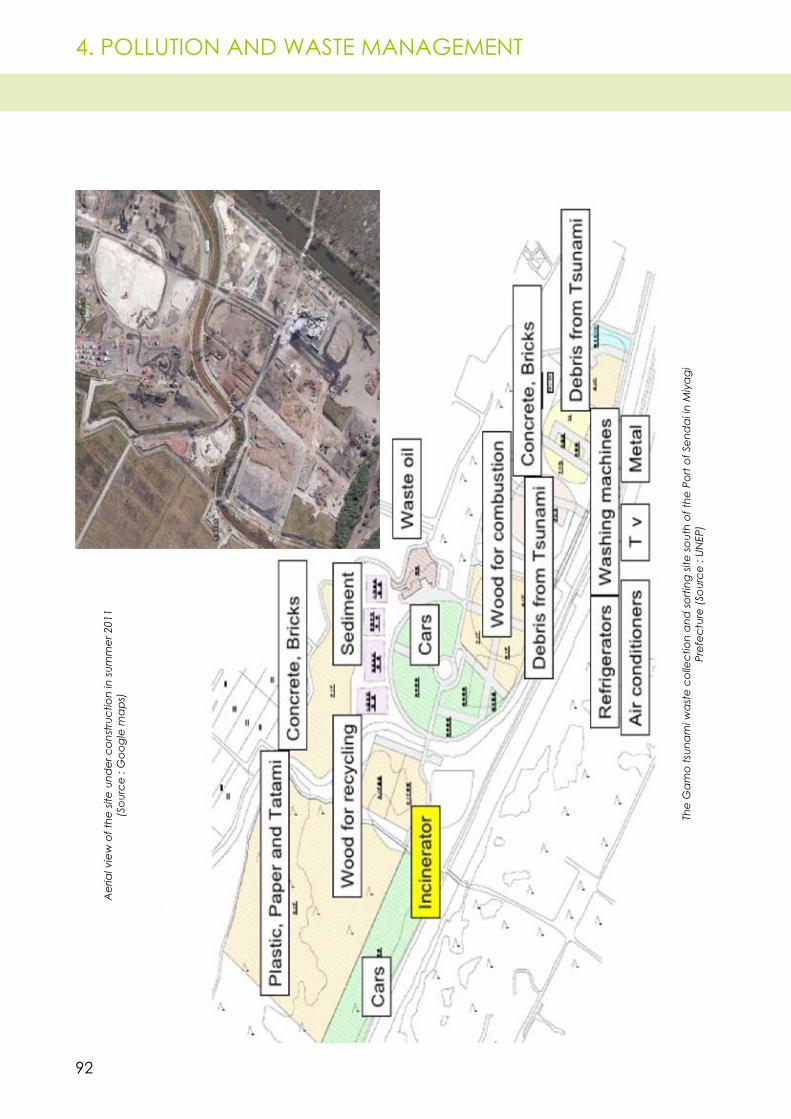
92
4. POLLUTION AND WASTE MANAGEMENT
The
Gam
o ts
unam
i was
te c
olle
ctio
n an
d so
rting
site
sout
h of
the
Port
of S
end
ai in
Miy
agi
Pref
ectu
re (S
ourc
e : U
NEP
)
Aer
ial v
iew
of t
he si
te u
nder
con
stru
ctio
n in
sum
mer
201
1(S
ourc
e : G
oogl
e m
aps)

93
CHAPTER 5
LESSONS LEARNT

94
5. LESSONS LEARNT
Given that earthquakes are much less strong in continental Europe than in Japan, one can legitimately question the usefulness of drawing lessons from the major natural and technological disaster of March 11th, 2011 and applying them to France or Europe in general. And yet, the earthquake that struck Italy’s Emilia-Romagna region in May and June 2012 (see p. 109) serves as a reminder that although Europe is much less prone to earthquakes than Japan, the continent is not necessarily less vulnerable to seismic activity. For example, 10 Japanese workers were killed while on the job during the magnitude 9.0 Tōhoku earthquake, whereas 12 Italian workers were crushed to death by collapsing factories and warehouses during the 5.8 magnitude Emilia-Romagna earthquake of 29 May 2012. Furthermore, earthquakes with a magnitude greater than 5 generally cause damage to unprotected buildings and structures. Seismologists estimate that earthquakes with a maximum magnitude of 6 to 6.5 occur in mainland France once every 100 years.
The diagram on page 95 is followed by descriptions of a few general lessons learnt from the analysis of this disaster. These lessons aim to stimulate discussion on the management of natural and technological risks by highlighting not just the failures observed and avenues for improvement, but also the preventive measures used to mitigate the consequences of these accidents (positive feedback is represented by a plus sign + ).
For ease of reading, these lessons are split into three categories:brown for lessons in seismic risk management;• blue for lessons in flood risk management;• green for lessons in NaTech risk management in general.•
Likewise, although the risk of a tsunami along the coasts of continental Europe is rather small, it presents similarities with the risk of flash flooding that became a reality along Europe’s coastlines during cyclones Lothar and Martin in December 1999 and cyclone Xynthia in February 2010. Inland waterways can also break their banks; more than 100 reports of flooded industrial sites are registered in the ARIA database.
The southern French village of Lambesc was levelled by a 6.2 magnitude earthquake that struck at 9.19 on June 11th, 1909. It is the strongest earthquake to ever hit mainland France. It killed 46 people, seriously injured 250, destroyed or rendered thousands of buildings uninhabitable and caused €800 million to €1.200 million in damage [2009 rate] (Source : Le Petit Journal / ENS Lyon)
Lastly, it must be pointed out that although Japan is one of the world’s countries most exposed to natural hazards and ranks among the most industrialised despite its very small size, it is also one of the best prepared to confront and manage natural disasters. An analysis of the accidents that occurred on March 11th, 2011 can only be beneficial in improving the preparedness of France and other European countries for NaTech risks.
Each lesson is detailed on the following pages and may be applied to improve NaTech risk prevention and protection measures implemented on other industrial sites («directly applicable lessons» upper half of the diagram on page 95) or provide food for discussion on how to improve overall management of technological risks («Lessons indirectly applicable» lower half of the diagram).
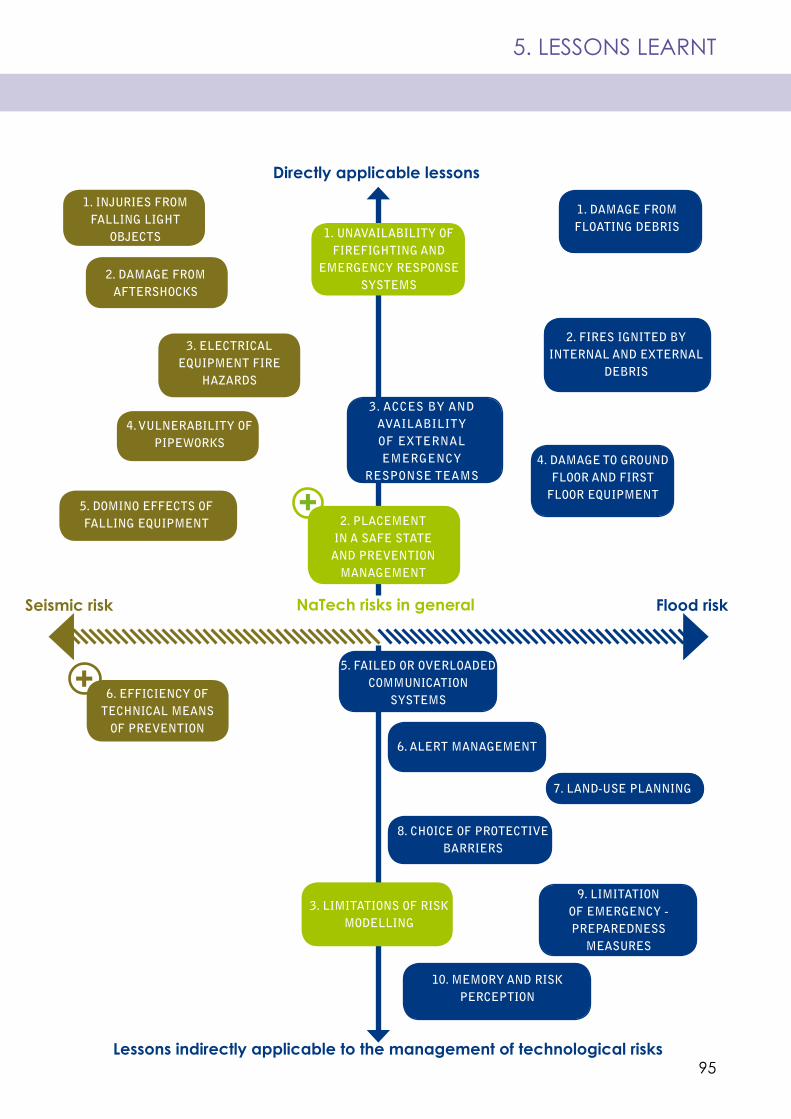
95
5. LESSONS LEARNT
Flood risk Seismic risk
Directly applicable lessons
Lessons indirectly applicable to the management of technological risks
3. ACCES BY AND AVAILABILITY OF EXTERNAL EMERGENCY
RESPONSE TEAMS
1. DAMAGE FROM FLOATING DEBRIS1. UNAVAILABILITY OF
FIREFIGHTING AND EMERGENCY RESPONSE
SYSTEMS
2. PLACEMENT IN A SAFE STATE
AND PREVENTION MANAGEMENT
2. FIRES IGNITED BY INTERNAL AND EXTERNAL
DEBRIS
1. INJURIES FROM FALLING LIGHT
OBJECTS
3. ELECTRICAL EQUIPMENT FIRE
HAZARDS
NaTech risks in general
2. DAMAGE FROM AFTERSHOCKS
5. FAILED OR OVERLOADED COMMUNICATION
SYSTEMS
6. ALERT MANAGEMENT
9. LIMITATION OF EMERGENCY - PREPAREDNESS
MEASURES
7. LAND-USE PLANNING
10. MEMORY AND RISK PERCEPTION
8. CHOICE OF PROTECTIVE BARRIERS
3. LIMITATIONS OF RISK MODELLING
6. EFFICIENCY OF TECHNICAL MEANS
OF PREVENTION
4. DAMAGE TO GROUND FLOOR AND FIRST
FLOOR EQUIPMENT
4. VULNERABILITY OF PIPEWORKS
5. DOMINO EFFECTS OF FALLING EQUIPMENT
+
+
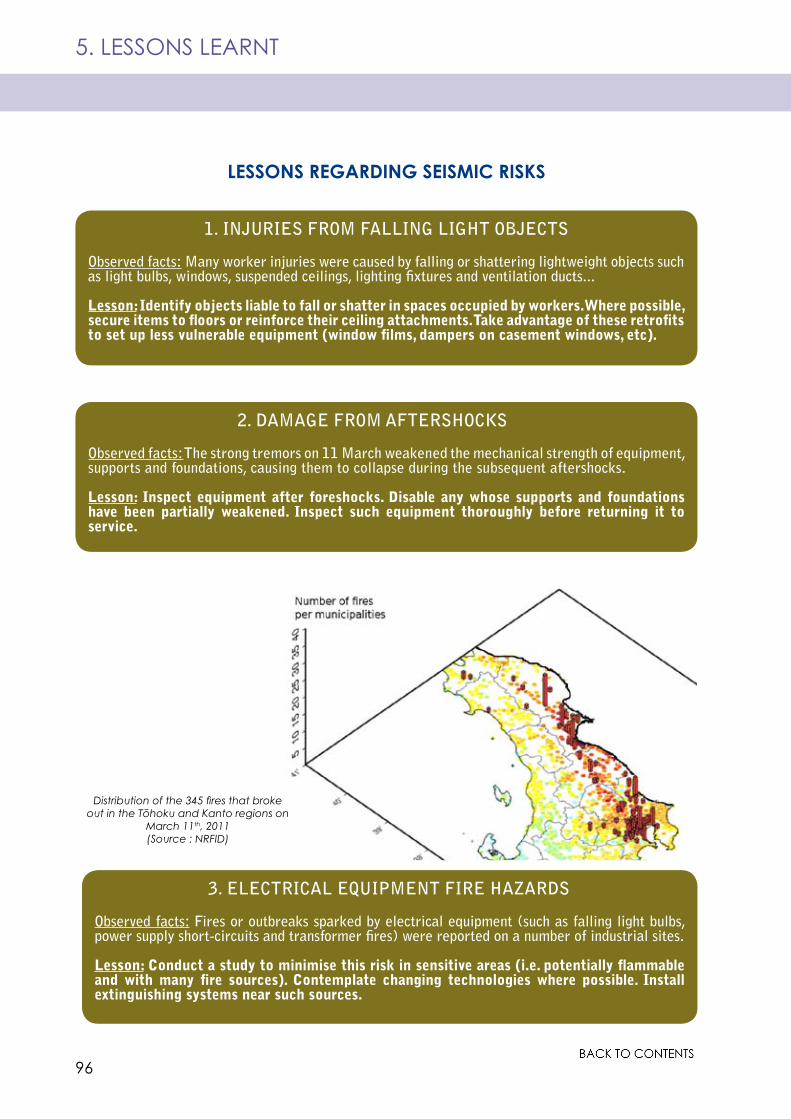
96
5. LESSONS LEARNT
1. INJURIES FROM FALLING LIGHT OBJECTS
Observed facts: Many worker injuries were caused by falling or shattering lightweight objects such as light bulbs, windows, suspended ceilings, lighting fixtures and ventilation ducts...
Lesson: Identify objects liable to fall or shatter in spaces occupied by workers. Where possible, secure items to floors or reinforce their ceiling attachments. Take advantage of these retrofits to set up less vulnerable equipment (window films, dampers on casement windows, etc).
2. DAMAGE FROM AFTERSHOCKS
Observed facts: The strong tremors on 11 March weakened the mechanical strength of equipment, supports and foundations, causing them to collapse during the subsequent aftershocks.
Lesson: Inspect equipment after foreshocks. Disable any whose supports and foundations have been partially weakened. Inspect such equipment thoroughly before returning it to service.
3. ELECTRICAL EQUIPMENT FIRE HAZARDS
Observed facts: Fires or outbreaks sparked by electrical equipment (such as falling light bulbs, power supply short-circuits and transformer fires) were reported on a number of industrial sites.
Lesson: Conduct a study to minimise this risk in sensitive areas (i.e. potentially flammable and with many fire sources). Contemplate changing technologies where possible. Install extinguishing systems near such sources.
LESSONS REGARDING SEISMIC RISKS
Distribution of the 345 fires that broke out in the Tōhoku and Kanto regions on
March 11th, 2011 (Source : NRFID)
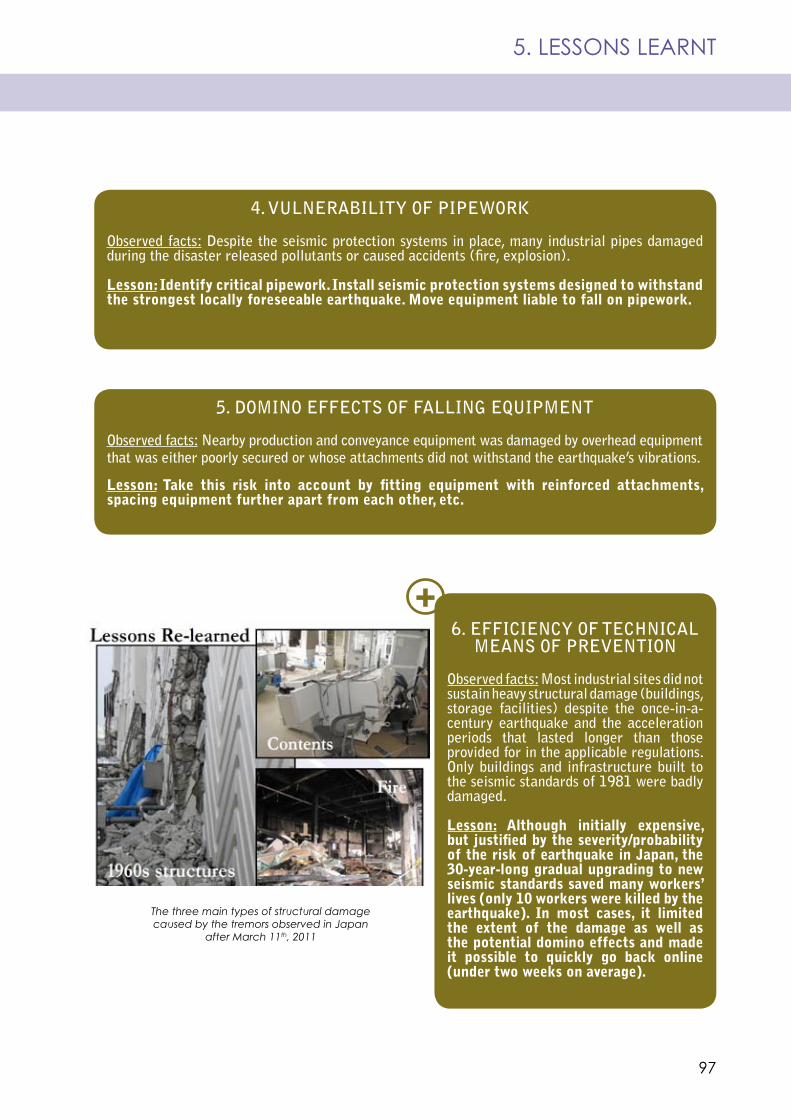
97
5. LESSONS LEARNT
4. VULNERABILITY OF PIPEWORK
Observed facts: Despite the seismic protection systems in place, many industrial pipes damaged during the disaster released pollutants or caused accidents (fire, explosion).
Lesson: Identify critical pipework. Install seismic protection systems designed to withstand the strongest locally foreseeable earthquake. Move equipment liable to fall on pipework.
5. DOMINO EFFECTS OF FALLING EQUIPMENT
Observed facts: Nearby production and conveyance equipment was damaged by overhead equipment that was either poorly secured or whose attachments did not withstand the earthquake’s vibrations.
Lesson: Take this risk into account by fitting equipment with reinforced attachments, spacing equipment further apart from each other, etc.
6. EFFICIENCY OF TECHNICAL MEANS OF PREVENTION
Observed facts: Most industrial sites did not sustain heavy structural damage (buildings, storage facilities) despite the once-in-a-century earthquake and the acceleration periods that lasted longer than those provided for in the applicable regulations. Only buildings and infrastructure built to the seismic standards of 1981 were badly damaged.
Lesson: Although initially expensive, but justified by the severity/probability of the risk of earthquake in Japan, the 30-year-long gradual upgrading to new seismic standards saved many workers’ lives (only 10 workers were killed by the earthquake). In most cases, it limited the extent of the damage as well as the potential domino effects and made it possible to quickly go back online (under two weeks on average).
The three main types of structural damage caused by the tremors observed in Japan
after March 11th, 2011
+
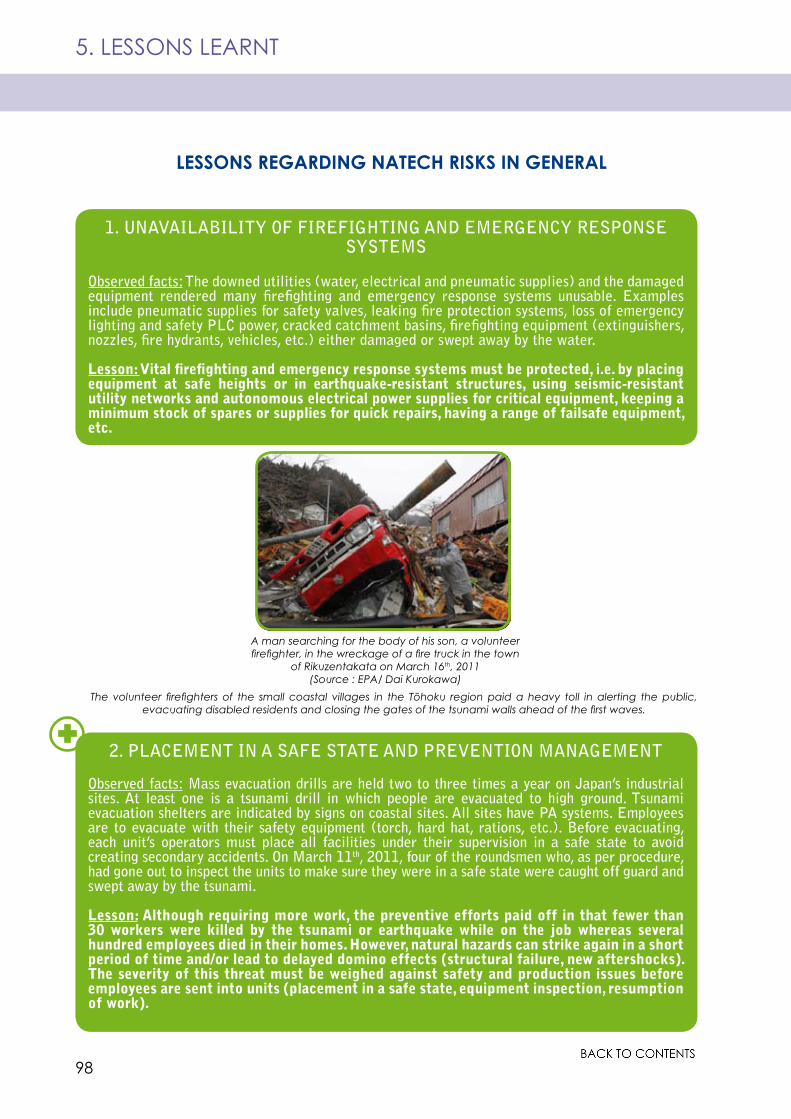
98
5. LESSONS LEARNT
1. UNAVAILABILITY OF FIREFIGHTING AND EMERGENCY RESPONSE SYSTEMS
Observed facts: The downed utilities (water, electrical and pneumatic supplies) and the damaged equipment rendered many firefighting and emergency response systems unusable. Examples include pneumatic supplies for safety valves, leaking fire protection systems, loss of emergency lighting and safety PLC power, cracked catchment basins, firefighting equipment (extinguishers, nozzles, fire hydrants, vehicles, etc.) either damaged or swept away by the water.
Lesson: Vital firefighting and emergency response systems must be protected, i.e. by placing equipment at safe heights or in earthquake-resistant structures, using seismic-resistant utility networks and autonomous electrical power supplies for critical equipment, keeping a minimum stock of spares or supplies for quick repairs, having a range of failsafe equipment, etc.
LESSONS REGARDING NATECH RISKS IN GENERAL
A man searching for the body of his son, a volunteer firefighter, in the wreckage of a fire truck in the town
of Rikuzentakata on March 16th, 2011(Source : EPA/ Dai Kurokawa)
The volunteer firefighters of the small coastal villages in the Tōhoku region paid a heavy toll in alerting the public, evacuating disabled residents and closing the gates of the tsunami walls ahead of the first waves.
+2. PLACEMENT IN A SAFE STATE AND PREVENTION MANAGEMENT
Observed facts: Mass evacuation drills are held two to three times a year on Japan’s industrial sites. At least one is a tsunami drill in which people are evacuated to high ground. Tsunami evacuation shelters are indicated by signs on coastal sites. All sites have PA systems. Employees are to evacuate with their safety equipment (torch, hard hat, rations, etc.). Before evacuating, each unit’s operators must place all facilities under their supervision in a safe state to avoid creating secondary accidents. On March 11th, 2011, four of the roundsmen who, as per procedure, had gone out to inspect the units to make sure they were in a safe state were caught off guard and swept away by the tsunami.
Lesson: Although requiring more work, the preventive efforts paid off in that fewer than 30 workers were killed by the tsunami or earthquake while on the job whereas several hundred employees died in their homes. However, natural hazards can strike again in a short period of time and/or lead to delayed domino effects (structural failure, new aftershocks). The severity of this threat must be weighed against safety and production issues before employees are sent into units (placement in a safe state, equipment inspection, resumption of work).
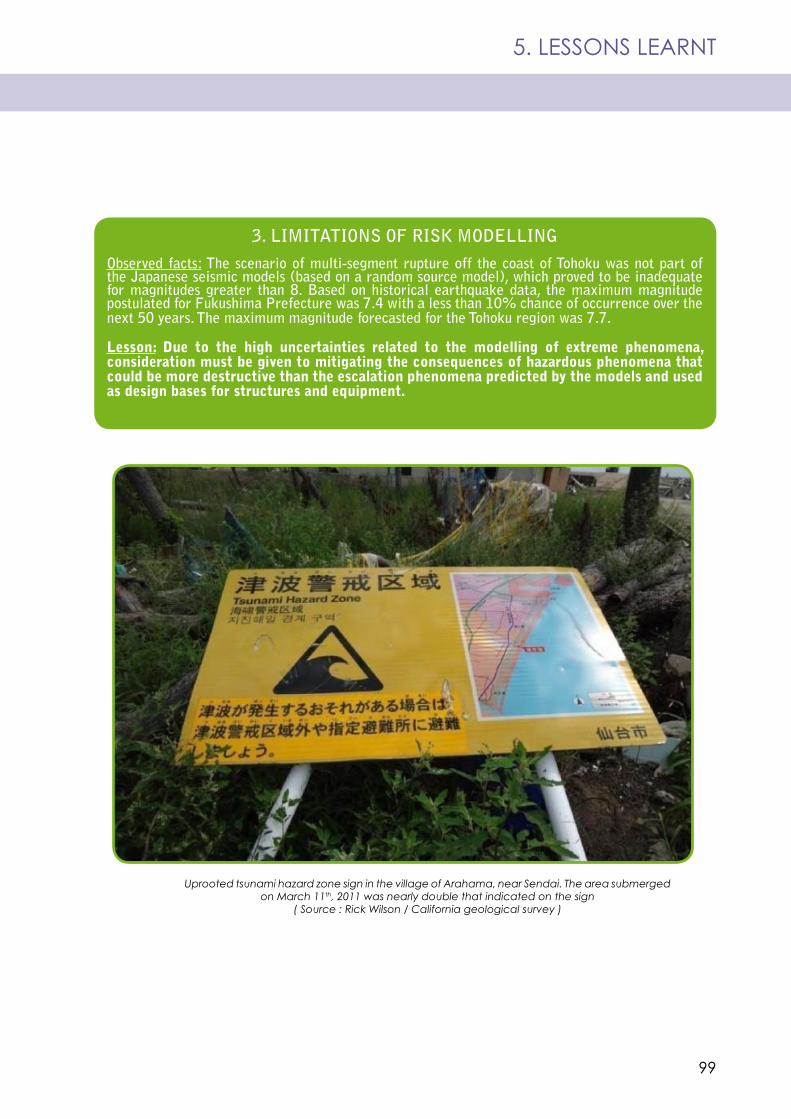
99
5. LESSONS LEARNT
3. LIMITATIONS OF RISK MODELLING
Observed facts: The scenario of multi-segment rupture off the coast of Tohoku was not part of the Japanese seismic models (based on a random source model), which proved to be inadequate for magnitudes greater than 8. Based on historical earthquake data, the maximum magnitude postulated for Fukushima Prefecture was 7.4 with a less than 10% chance of occurrence over the next 50 years. The maximum magnitude forecasted for the Tohoku region was 7.7.
Lesson: Due to the high uncertainties related to the modelling of extreme phenomena, consideration must be given to mitigating the consequences of hazardous phenomena that could be more destructive than the escalation phenomena predicted by the models and used as design bases for structures and equipment.
Uprooted tsunami hazard zone sign in the village of Arahama, near Sendai. The area submerged on March 11th, 2011 was nearly double that indicated on the sign
( Source : Rick Wilson / California geological survey )
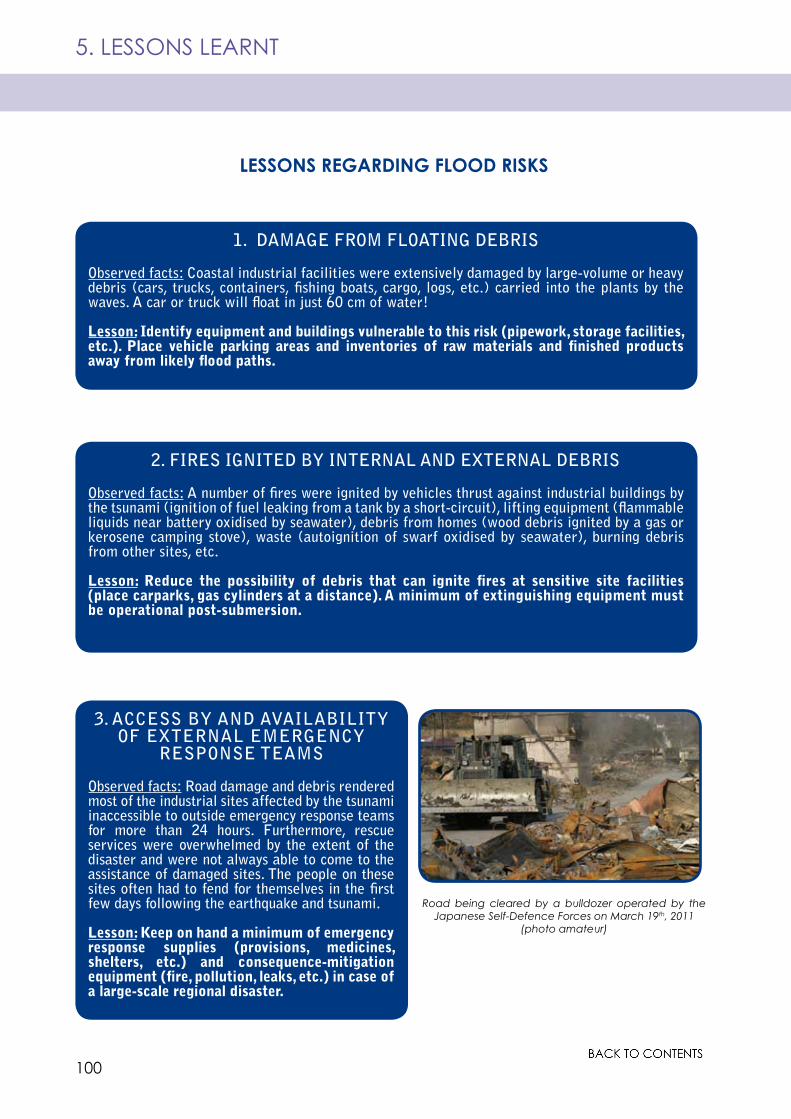
100
5. LESSONS LEARNT
3. ACCESS BY AND AVAILABILITY OF EXTERNAL EMERGENCY
RESPONSE TEAMS
Observed facts: Road damage and debris rendered most of the industrial sites affected by the tsunami inaccessible to outside emergency response teams for more than 24 hours. Furthermore, rescue services were overwhelmed by the extent of the disaster and were not always able to come to the assistance of damaged sites. The people on these sites often had to fend for themselves in the first few days following the earthquake and tsunami.
Lesson: Keep on hand a minimum of emergency response supplies (provisions, medicines, shelters, etc.) and consequence-mitigation equipment (fire, pollution, leaks, etc.) in case of a large-scale regional disaster.
Road being cleared by a bulldozer operated by the Japanese Self-Defence Forces on March 19th, 2011
(photo amateur)
2. FIRES IGNITED BY INTERNAL AND EXTERNAL DEBRIS
Observed facts: A number of fires were ignited by vehicles thrust against industrial buildings by the tsunami (ignition of fuel leaking from a tank by a short-circuit), lifting equipment (flammable liquids near battery oxidised by seawater), debris from homes (wood debris ignited by a gas or kerosene camping stove), waste (autoignition of swarf oxidised by seawater), burning debris from other sites, etc.
Lesson: Reduce the possibility of debris that can ignite fires at sensitive site facilities (place carparks, gas cylinders at a distance). A minimum of extinguishing equipment must be operational post-submersion.
1. DAMAGE FROM FLOATING DEBRIS
Observed facts: Coastal industrial facilities were extensively damaged by large-volume or heavy debris (cars, trucks, containers, fishing boats, cargo, logs, etc.) carried into the plants by the waves. A car or truck will float in just 60 cm of water!
Lesson: Identify equipment and buildings vulnerable to this risk (pipework, storage facilities, etc.). Place vehicle parking areas and inventories of raw materials and finished products away from likely flood paths.
LESSONS REGARDING FLOOD RISKS
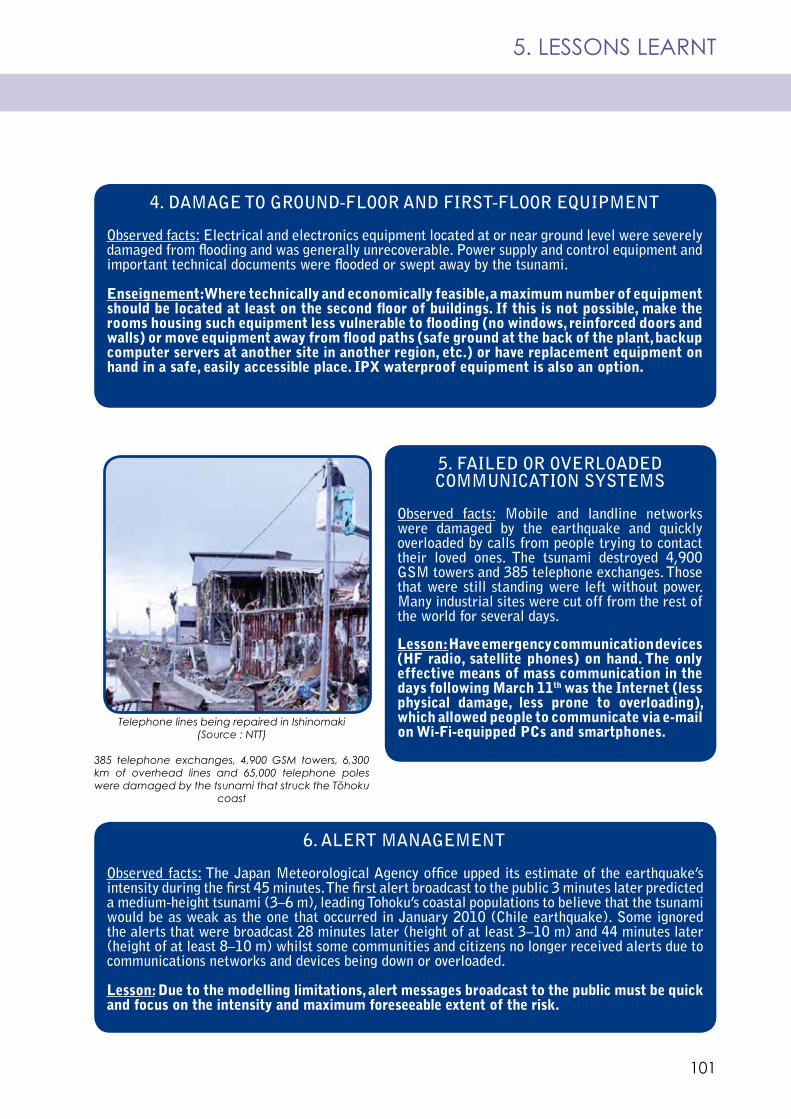
101
5. LESSONS LEARNT
4. DAMAGE TO GROUND-FLOOR AND FIRST-FLOOR EQUIPMENT
Observed facts: Electrical and electronics equipment located at or near ground level were severely damaged from flooding and was generally unrecoverable. Power supply and control equipment and important technical documents were flooded or swept away by the tsunami.
Enseignement: Where technically and economically feasible, a maximum number of equipment should be located at least on the second floor of buildings. If this is not possible, make the rooms housing such equipment less vulnerable to flooding (no windows, reinforced doors and walls) or move equipment away from flood paths (safe ground at the back of the plant, backup computer servers at another site in another region, etc.) or have replacement equipment on hand in a safe, easily accessible place. IPX waterproof equipment is also an option.
5. FAILED OR OVERLOADED COMMUNICATION SYSTEMS
Observed facts: Mobile and landline networks were damaged by the earthquake and quickly overloaded by calls from people trying to contact their loved ones. The tsunami destroyed 4,900 GSM towers and 385 telephone exchanges. Those that were still standing were left without power. Many industrial sites were cut off from the rest of the world for several days.
Lesson: Have emergency communication devices (HF radio, satellite phones) on hand. The only effective means of mass communication in the days following March 11th was the Internet (less physical damage, less prone to overloading), which allowed people to communicate via e-mail on Wi-Fi-equipped PCs and smartphones.
6. ALERT MANAGEMENT
Observed facts: The Japan Meteorological Agency office upped its estimate of the earthquake’s intensity during the first 45 minutes. The first alert broadcast to the public 3 minutes later predicted a medium-height tsunami (3–6 m), leading Tohoku’s coastal populations to believe that the tsunami would be as weak as the one that occurred in January 2010 (Chile earthquake). Some ignored the alerts that were broadcast 28 minutes later (height of at least 3–10 m) and 44 minutes later (height of at least 8–10 m) whilst some communities and citizens no longer received alerts due to communications networks and devices being down or overloaded.
Lesson: Due to the modelling limitations, alert messages broadcast to the public must be quick and focus on the intensity and maximum foreseeable extent of the risk.
Telephone lines being repaired in Ishinomaki(Source : NTT)
385 telephone exchanges, 4,900 GSM towers, 6,300 km of overhead lines and 65,000 telephone poles were damaged by the tsunami that struck the Tōhoku
coast
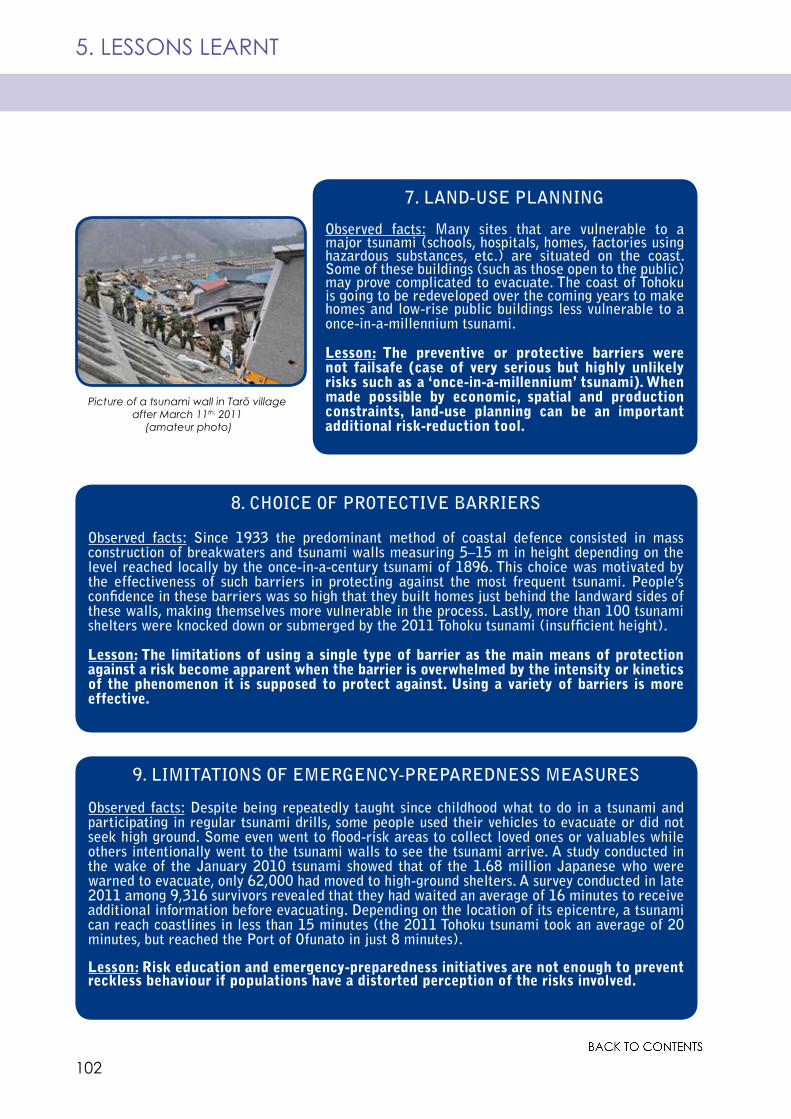
102
5. LESSONS LEARNT
7. LAND-USE PLANNING
Observed facts: Many sites that are vulnerable to a major tsunami (schools, hospitals, homes, factories using hazardous substances, etc.) are situated on the coast. Some of these buildings (such as those open to the public) may prove complicated to evacuate. The coast of Tohoku is going to be redeveloped over the coming years to make homes and low-rise public buildings less vulnerable to a once-in-a-millennium tsunami.
Lesson: The preventive or protective barriers were not failsafe (case of very serious but highly unlikely risks such as a ‘once-in-a-millennium’ tsunami). When made possible by economic, spatial and production constraints, land-use planning can be an important additional risk-reduction tool.
8. CHOICE OF PROTECTIVE BARRIERS
Observed facts: Since 1933 the predominant method of coastal defence consisted in mass construction of breakwaters and tsunami walls measuring 5–15 m in height depending on the level reached locally by the once-in-a-century tsunami of 1896. This choice was motivated by the effectiveness of such barriers in protecting against the most frequent tsunami. People’s confidence in these barriers was so high that they built homes just behind the landward sides of these walls, making themselves more vulnerable in the process. Lastly, more than 100 tsunami shelters were knocked down or submerged by the 2011 Tohoku tsunami (insufficient height).
Lesson: The limitations of using a single type of barrier as the main means of protection against a risk become apparent when the barrier is overwhelmed by the intensity or kinetics of the phenomenon it is supposed to protect against. Using a variety of barriers is more effective.
Picture of a tsunami wall in Tarō village after March 11th, 2011
(amateur photo)
9. LIMITATIONS OF EMERGENCY-PREPAREDNESS MEASURES
Observed facts: Despite being repeatedly taught since childhood what to do in a tsunami and participating in regular tsunami drills, some people used their vehicles to evacuate or did not seek high ground. Some even went to flood-risk areas to collect loved ones or valuables while others intentionally went to the tsunami walls to see the tsunami arrive. A study conducted in the wake of the January 2010 tsunami showed that of the 1.68 million Japanese who were warned to evacuate, only 62,000 had moved to high-ground shelters. A survey conducted in late 2011 among 9,316 survivors revealed that they had waited an average of 16 minutes to receive additional information before evacuating. Depending on the location of its epicentre, a tsunami can reach coastlines in less than 15 minutes (the 2011 Tohoku tsunami took an average of 20 minutes, but reached the Port of Ofunato in just 8 minutes).
Lesson: Risk education and emergency-preparedness initiatives are not enough to prevent reckless behaviour if populations have a distorted perception of the risks involved.
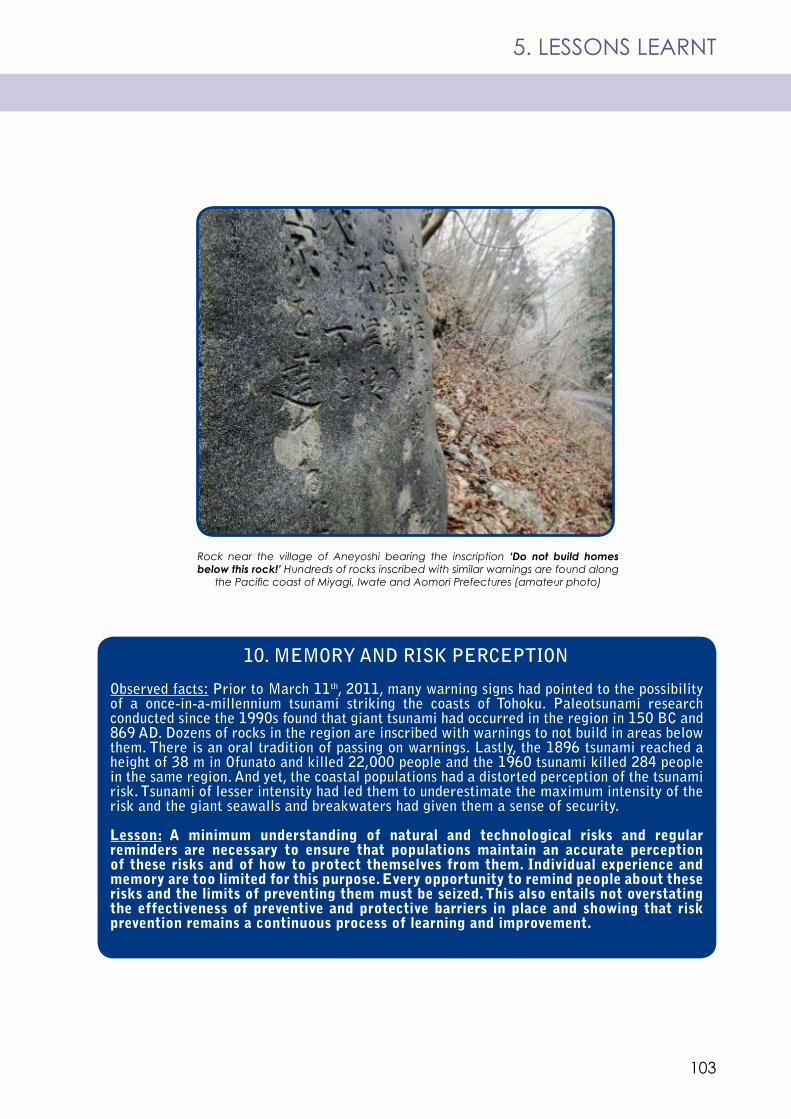
103
5. LESSONS LEARNT
10. MEMORY AND RISK PERCEPTION
Observed facts: Prior to March 11th, 2011, many warning signs had pointed to the possibility of a once-in-a-millennium tsunami striking the coasts of Tohoku. Paleotsunami research conducted since the 1990s found that giant tsunami had occurred in the region in 150 BC and 869 AD. Dozens of rocks in the region are inscribed with warnings to not build in areas below them. There is an oral tradition of passing on warnings. Lastly, the 1896 tsunami reached a height of 38 m in Ofunato and killed 22,000 people and the 1960 tsunami killed 284 people in the same region. And yet, the coastal populations had a distorted perception of the tsunami risk. Tsunami of lesser intensity had led them to underestimate the maximum intensity of the risk and the giant seawalls and breakwaters had given them a sense of security.
Lesson: A minimum understanding of natural and technological risks and regular reminders are necessary to ensure that populations maintain an accurate perception of these risks and of how to protect themselves from them. Individual experience and memory are too limited for this purpose. Every opportunity to remind people about these risks and the limits of preventing them must be seized. This also entails not overstating the effectiveness of preventive and protective barriers in place and showing that risk prevention remains a continuous process of learning and improvement.
Rock near the village of Aneyoshi bearing the inscription ‘Do not build homes below this rock!’ Hundreds of rocks inscribed with similar warnings are found along
the Pacific coast of Miyagi, Iwate and Aomori Prefectures (amateur photo)
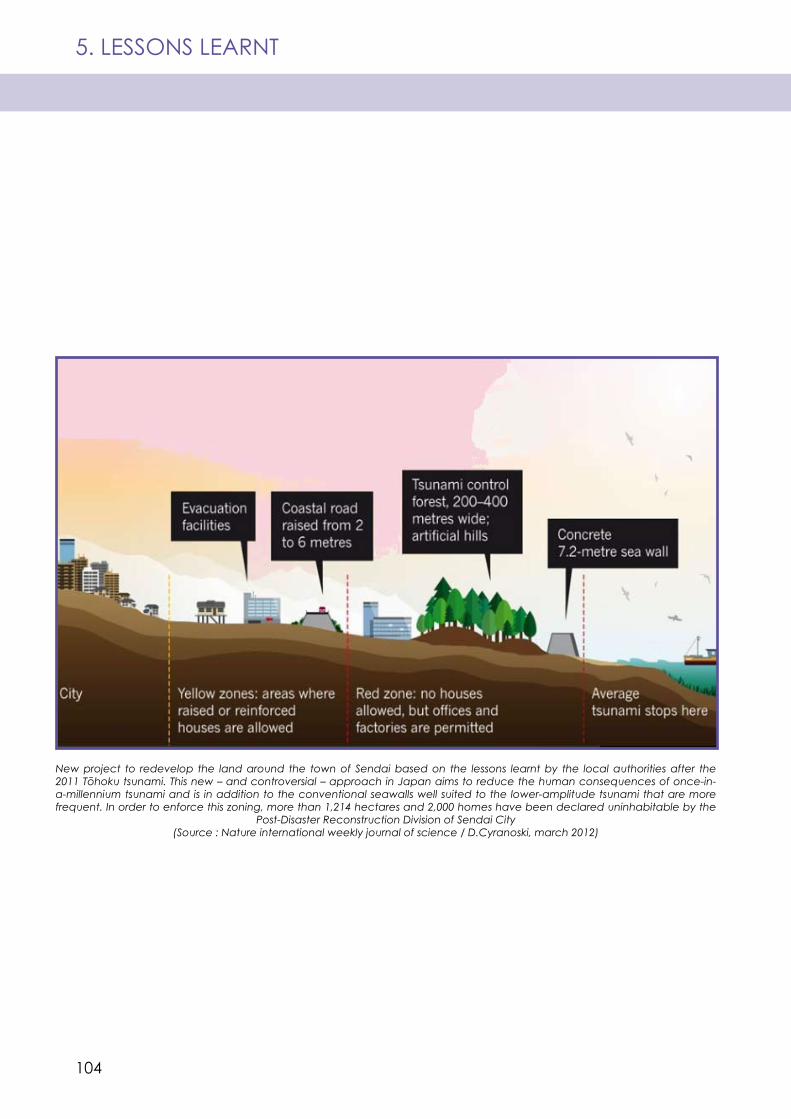
104
5. LESSONS LEARNT
New project to redevelop the land around the town of Sendai based on the lessons learnt by the local authorities after the 2011 Tōhoku tsunami. This new – and controversial – approach in Japan aims to reduce the human consequences of once-in-a-millennium tsunami and is in addition to the conventional seawalls well suited to the lower-amplitude tsunami that are more frequent. In order to enforce this zoning, more than 1,214 hectares and 2,000 homes have been declared uninhabitable by the
Post-Disaster Reconstruction Division of Sendai City (Source : Nature international weekly journal of science / D.Cyranoski, march 2012)
105
APPENDIX
Seismic scales
Japanese regulations and NaTech risks
Glossary
Additional Resources

106
APPENDIX
Seismic scalesThe Japanese shindo scale
The famous Japanese seismologist Fusakichi Omori developed a seismic scale in 1894. The shindo scale is a subjective scale that measures the qualitative effects of an earthquake by assessing the intensity of tremors at a given point along a scale running from 0 (micro: not felt by all or most people) to 7 (exceptional: in most buildings, wall tiles and windowpanes are damaged and fall. In some cases, reinforced concrete-block walls collapse). Thus, two points that experience an earthquake of the same magnitude will experience tremors of different intensities depending on their distance from the epicentre, their topographic features, the types of buildings built on them and the geological nature of the underlying ground. The shindo scale is also used in Taiwan.
The Richter scaleInvented by Charles Richter in 1934 to measure earthquakes in California and brought into widespread use by Hiroo Kanamori in 1997, the Richter magnitude scale is an objective scale that measures the moment magnitude (Mw) of an earthquake, i.e. the energy released at its source (epicentre) along a base-10 logarithmic scale. In other words, each number increase on the scale corresponds to a ten-fold increase in intensity (an earthquake of magnitude 6 is ten times stronger than an earthquake of magnitude 5). Although the Richter scale is less practical for evaluating the effects of tremors at a given point, it has turned out to be more practical for modelling tsunami whose characteristics depend on the energy released at their source. Unlike the shindo scale, the Richter scale theoretically has no upper limit. That said, no earthquakes with a magnitude greater than 9.5 have yet been recorded. The Richter scale is determined from data recorded by seismographs located at various points in relation to an earthquake’s epicentre. Interpreting this data can take time. For example, on March 11th, 2011, several hours passed before the final magnitude was calculated.
Illustrations of the seven points of the shindo scale
(Source : JMA)
The Modified Mercalli Intensity scale (MMI)Invented by the Italian volcanologist Giuseppe Mercalli between 1884 and 1906, and revised by Charles Richter, the MMI is a subjective earthquake intensity scale like the shindo scale. It is divided into 12 degrees of destruction ranging from I (Goes unnoticed. Detected only by sensitive instruments and few people under favourable conditions) to XII (Near-total destruction. The ground moves in waves or ripples. Large amounts of rock move position).
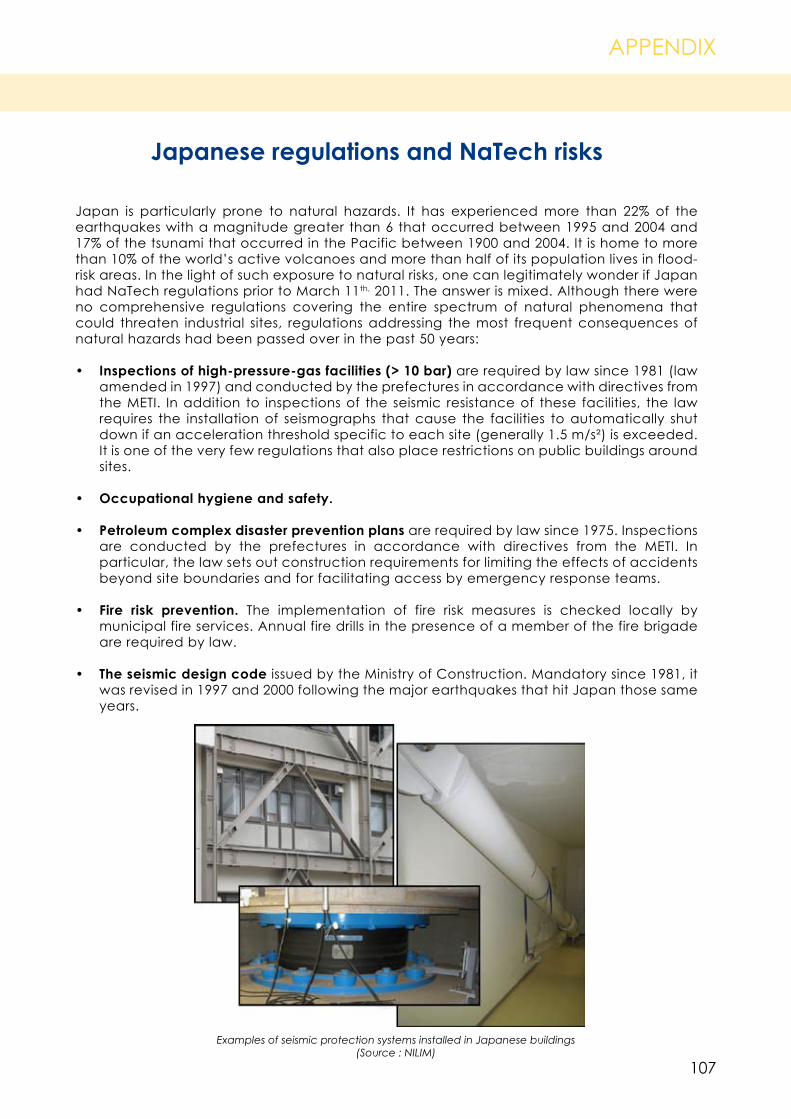
107
APPENDIX
Japanese regulations and NaTech risks
Japan is particularly prone to natural hazards. It has experienced more than 22% of the earthquakes with a magnitude greater than 6 that occurred between 1995 and 2004 and 17% of the tsunami that occurred in the Pacific between 1900 and 2004. It is home to more than 10% of the world’s active volcanoes and more than half of its population lives in flood-risk areas. In the light of such exposure to natural risks, one can legitimately wonder if Japan had NaTech regulations prior to March 11th, 2011. The answer is mixed. Although there were no comprehensive regulations covering the entire spectrum of natural phenomena that could threaten industrial sites, regulations addressing the most frequent consequences of natural hazards had been passed over in the past 50 years:
Inspections of high-pressure-gas facilities (> 10 bar) • are required by law since 1981 (law amended in 1997) and conducted by the prefectures in accordance with directives from the METI. In addition to inspections of the seismic resistance of these facilities, the law requires the installation of seismographs that cause the facilities to automatically shut down if an acceleration threshold specific to each site (generally 1.5 m/s²) is exceeded. It is one of the very few regulations that also place restrictions on public buildings around sites.
Occupational hygiene and safety.•
Petroleum complex disaster prevention plans • are required by law since 1975. Inspections are conducted by the prefectures in accordance with directives from the METI. In particular, the law sets out construction requirements for limiting the effects of accidents beyond site boundaries and for facilitating access by emergency response teams.
Fire risk prevention. • The implementation of fire risk measures is checked locally by municipal fire services. Annual fire drills in the presence of a member of the fire brigade are required by law.
The seismic design code• issued by the Ministry of Construction. Mandatory since 1981, it was revised in 1997 and 2000 following the major earthquakes that hit Japan those same years.
Examples of seismic protection systems installed in Japanese buildings(Source : NILIM)
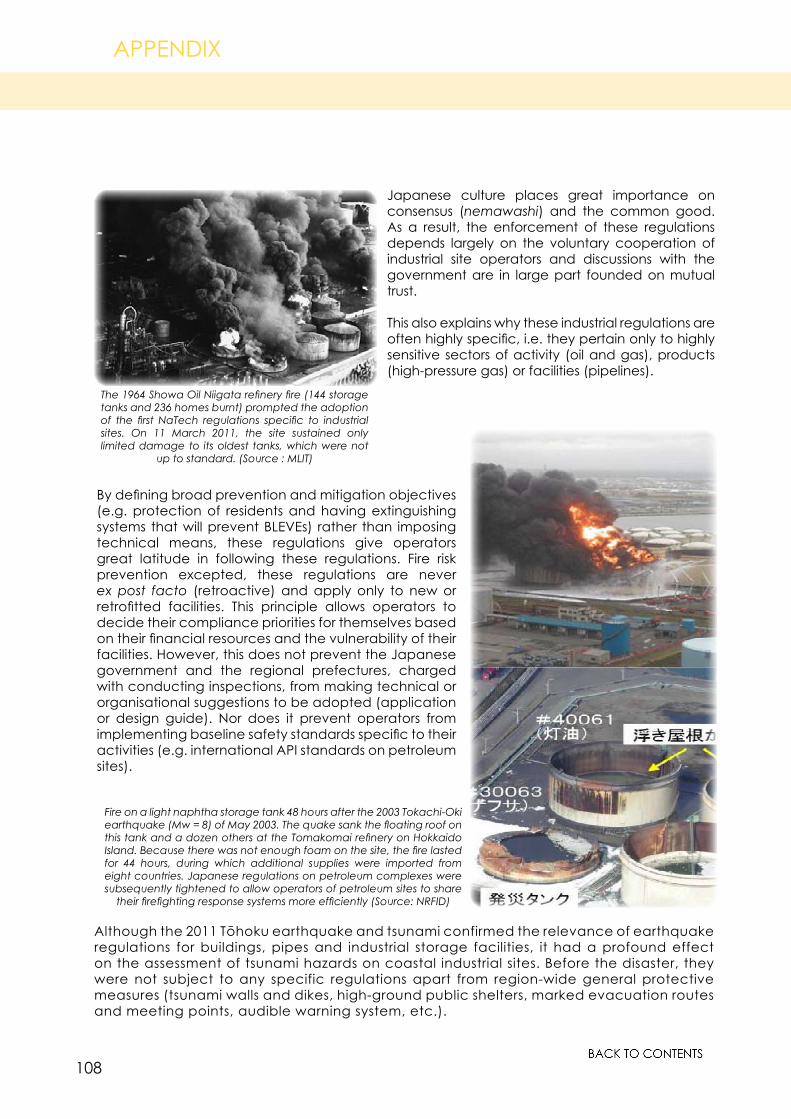
108
APPENDIX
The 1964 Showa Oil Niigata refinery fire (144 storage tanks and 236 homes burnt) prompted the adoption of the first NaTech regulations specific to industrial sites. On 11 March 2011, the site sustained only limited damage to its oldest tanks, which were not
up to standard. (Source : MLIT)
Japanese culture places great importance on consensus (nemawashi) and the common good. As a result, the enforcement of these regulations depends largely on the voluntary cooperation of industrial site operators and discussions with the government are in large part founded on mutual trust.
This also explains why these industrial regulations are often highly specific, i.e. they pertain only to highly sensitive sectors of activity (oil and gas), products (high-pressure gas) or facilities (pipelines).
By defining broad prevention and mitigation objectives (e.g. protection of residents and having extinguishing systems that will prevent BLEVEs) rather than imposing technical means, these regulations give operators great latitude in following these regulations. Fire risk prevention excepted, these regulations are never ex post facto (retroactive) and apply only to new or retrofitted facilities. This principle allows operators to decide their compliance priorities for themselves based on their financial resources and the vulnerability of their facilities. However, this does not prevent the Japanese government and the regional prefectures, charged with conducting inspections, from making technical or organisational suggestions to be adopted (application or design guide). Nor does it prevent operators from implementing baseline safety standards specific to their activities (e.g. international API standards on petroleum sites).
Although the 2011 Tōhoku earthquake and tsunami confirmed the relevance of earthquake regulations for buildings, pipes and industrial storage facilities, it had a profound effect on the assessment of tsunami hazards on coastal industrial sites. Before the disaster, they were not subject to any specific regulations apart from region-wide general protective measures (tsunami walls and dikes, high-ground public shelters, marked evacuation routes and meeting points, audible warning system, etc.).
Fire on a light naphtha storage tank 48 hours after the 2003 Tokachi-Oki earthquake (Mw = 8) of May 2003. The quake sank the floating roof on this tank and a dozen others at the Tomakomai refinery on Hokkaido Island. Because there was not enough foam on the site, the fire lasted for 44 hours, during which additional supplies were imported from eight countries. Japanese regulations on petroleum complexes were subsequently tightened to allow operators of petroleum sites to share
their firefighting response systems more efficiently (Source: NRFID)
109
APPENDIX
IMW : Infectious Medical Waste
METI : Ministry of Economy, Trade and Industry of Japan
MLIT : Ministry of Land, Infrastructure, Transport and Tourism of Japan
PCB : Polychlorinated biphenyls are compounds that were used for their insulating properties, high thermal conductivity and high flash points. They have low water solubilities, do not degrade readily and are toxic to human health.
POP : Persistent organic pollutants are compounds that are toxic to human health and the environment. They bioaccumulate in the fatty tissues of living organisms and are not readily biodegradable.
LPG : Liquefied Petroleum Gas
DGPR : General Directorate for Risk Prevention, part of France’s Ministry of Ecology, Sustainable Development and Energy
JMA : Japan Meteorological Agency, japanese governmental agency
FDMA : Fire and Disaster Management Agency, japanese governmental agency
BLEVE : Boiling Liquid Expanding Vapor Explosion, violent vaporization resulting from the rupture of a tank containing a fluid at a temperature significantly higher than its boiling point at atmospheric pressure.
Readers interested in learning more about NaTech risks will find many freely accessible documents on the ARIA website:
more than 1,000 summaries of industrial accidents caused or compounded by natural • phenomena;
accidentology summary reports on a range of themes: atmospheric precipitations and • flooding, lightning, etc.
breaking news on extremely cold weather, heat waves and periods of unusually warm • weather;
detailed accident sheets: flooding (ARIA 19078 and 35426), lightning (ARIA 18325), heavy • rains (ARIA 33849), earthquakes (ARIA 42563 - 42566).
Glossary
Additional Resources
WEEE : Waste Electronic and Electrical Equipment
WWTP : Waste Water Treatment Plant
What happens when the world’s third-largest economy is simultaneously hit by a once-in-a-century earthquake and once-in-a-millennium tsunami? Two years after the media coverage of the Fukushima Daiichi nuclear power plant accident, this overview provides insight into the primary accidents that occurred on industrial sites in several key sectors of Japan’s economy that were hit by the earthquake and/or the tsunami of March 11th, 2011.
It also sheds light on the environmental consequences of these industrial accidents and the challenge of managing the waste created by the tsunami. Lastly, it presents a series of lessons learned from the disaster that individuals and organisations called on to manage natural and technological risks will find useful.
Date of publication: March 2013
Note: This document does not address accidents at Japanese nuclear power plants or the consequences of such accidents for human life and the environment. The analysis of such accidents
is not within BARPI’s purview.
TECHNOLOGICAL ACCIDENTS ONLINE
Safety and transparency are two legiti-mate requirements of our society. There-fore, since June 2001, the website www.aria.developpement-durable.gouv.fr hosted by the French Ministry of Ecology, Sustainable Development and Energy has been offering to both professionals and the general public lessons drawn from analyses of technological acci-dents. The main sections of the website are available in both French and En-glish.
Under the general sections, the interested user can, for example, inquire for the governmental action programmes, access large excerpts of the ARIA database, discover the presentation of the European scale of industrial accidents, become familiar with the ‘‘dangerous substances index‘‘ used to complete the ‘‘communication on the spot‘‘ in case of accident or incident.
The accident description, which serves as the raw input for any method of feedback, represents a significant share of the site’s resources : when known, event sequencing, consequences, origins, circumstances, proven or presumed causes, actions taken and lessons learnt are compiled.
Over 250 detailed and illustrated technical reports present accidents selected for their particular interest. Numerous analyses, sorted by technical topic or activities, are also available. The section dedicated to technical recommendations develops various topics : fine chemistry, pyrotechnics, surface treatment, silos, tyre depots, hot work permits, waste treatment, material handling, etc. A multicriteria search engine enables getting information about accidents occurring in France or abroad.
The website www.aria.developpement-durable.gouv.fr is continually growing. Currently, more than 40 000 accidents are online, and new theme-based analyses will be regularly added.
The summaries of catalogued events are all available at the site: www.aria.developpement-durable.gouv.fr
BARPI - Bureau for analysis of industrial risks and pollution5 place Jules Ferry69006 Lyon - FRANCEPhone : + 33 426 286 200
Department for technological risksGeneral Directorate for Risk PreventionMinistry of Ecology, Sustainable Development and Energy