CERN Fast Cycled Magnet demonstrator: test station, instrumentation and measurement campaign
HAL Id: hal-00295427https://hal.archives-ouvertes.fr/hal-00295427
Submitted on 27 Apr 2004
HAL is a multi-disciplinary open accessarchive for the deposit and dissemination of sci-entific research documents, whether they are pub-lished or not. The documents may come fromteaching and research institutions in France orabroad, or from public or private research centers.
L’archive ouverte pluridisciplinaire HAL, estdestinée au dépôt et à la diffusion de documentsscientifiques de niveau recherche, publiés ou non,émanant des établissements d’enseignement et derecherche français ou étrangers, des laboratoirespublics ou privés.
Overview of the field measurement campaign inHyytiälä, August 2001 in the framework of the EU
project OSOAM. Boy, T. Petäjä, M. Dal Maso, Ü. Rannik, J. Rinne, P. Aalto, A.
Laaksonen, P. Vaattovaara, J. Joutsensaari, T. Hoffmann, et al.
To cite this version:M. Boy, T. Petäjä, M. Dal Maso, Ü. Rannik, J. Rinne, et al.. Overview of the field measurementcampaign in Hyytiälä, August 2001 in the framework of the EU project OSOA. Atmospheric Chemistryand Physics, European Geosciences Union, 2004, 4 (3), pp.657-678. �hal-00295427�
Atmos. Chem. Phys., 4, 657–678, 2004www.atmos-chem-phys.org/acp/4/657/SRef-ID: 1680-7324/acp/2004-4-657
AtmosphericChemistry
and Physics
Overview of the field measurement campaign in Hyytiala, August2001 in the framework of the EU project OSOA
M. Boy1, T. Petaja1, M. Dal Maso1, U. Rannik1, J. Rinne1, P. Aalto1, A. Laaksonen2, P. Vaattovaara2, J. Joutsensaari2,T. Hoffmann3, J. Warnke3, M. Apostolaki4, E. G. Stephanou4, M. Tsapakis4, A. Kouvarakis4, C. Pio5, A. Carvalho5,A. Rompp6, G. Moortgat6, C. Spirig7, A. Guenther7, J. Greenberg7, P. Ciccioli8, and M. Kulmala1
1Dept. of Physical Sciences, University of Helsinki, P.O. Box 64, FIN-00014, Finland2University of Kuopio, Kuopio, Finland3Institut fur Specktrochemie, Dortmund, Germany4Environmental Chemical Processes Laboratory – School of Sciences and Engineering-University of Crete, GR-71409Heraklion, Greece5Universidade de Aveiro, Departamento de Ambiente e Ordenamento, Portugal6Max-Planck-Institut fur Chemie, Atmospheric Chemistry Division, D-55020, Germany7Atmospheric Chemistry Division, National Centre for Atmospheric Research, Boulder, CO, USA8Instituto di Metodologie Chimiche, Area della Ricerca del CNR di Montelibretti, Italy
Received: 10 April 2003 – Published in Atmos. Chem. Phys. Discuss.: 11 July 2003Revised: 16 March 2004 – Accepted: 13 April 2004 – Published: 27 April 2004
Abstract. As part of the OSOA (Origin and forma-tion of Secondary Organic Aerosols) project, two intensivefield campaigns were conducted in Melpitz, Germany andHyytiala, Finland. This paper gives an overview of the mea-surements made during the Hyytiala campaign, which washeld between 1 and 16 August 2001. Various instrumentaltechniques were used to achieve physical and chemical char-acterisation of aerosols and to investigate possible precursorgases.
During the OSOA campaign in Hyytiala, particle forma-tion was observed on three consecutive days at the beginningof the campaign (1 to 3 August 2001) and on three days lateron. The investigation of the meteorological situation dividedthe campaign into two parts. During the first three days ofAugust, relatively cold and clean air masses from northwestpassed over the station (condensation sink – CS:<0.002 s−1,NOx: <0.5 ppb). Daily particle bursts of one fraction of thenucleation mode aerosols (3–10 nm) with number concentra-tions between 600–1200 particles cm−3 were observed. Af-ter this period, warmer and more polluted air from south-westto south-east arrived at the station (CS: 0.002–0.01 s−1, NOx:0.5–4 ppb) and during these 13 days only three events wereobserved. These events were not as apparent as those that oc-curred during the earlier period of the campaign. The chem-ical analyses from different institutes of PM2, PM2.5 andPM10 particles confirmed the assumption that organic mat-
Correspondence to:M. Boy([email protected])
ter from the oxidation of various terpenes contributed to theformation of secondary organic aerosols (SOA). Concerningthese conclusions among others, the ratio between formic(oxidation product of isoprene and monoterpenes by ozone)and acetic acid (increased by anthropogenic emissions) (ra-tio=1 to 1.5) and concentration of different carboxylic acids(up to 62 ng m−3) were investigated. Gas/particle partition-ing of five photo-oxidation products fromα- andβ-pineneresulted in higher concentrations of pinonic, nor pinonic andpinic acids in the particle phase than in the gas phase, whichindicates a preference to the particle phase for these com-pounds. The average growth factors (GF) from 100 nm par-ticles in water vapour gave a diurnal pattern with a maxi-mum during daytime and values between 1.2 and 1.7. Onaverage, the amount of secondary organic carbon reachedvalues around 19% of the sampled aerosols and we spec-ulate that formation of SOA with the influence of photo-oxidation products from terpenes was the reason for the ob-served particle bursts during the campaign. However, cor-relations between the precursor gases or the favourable con-densing species with the monitored nucleation mode parti-cles were not found. For the investigated time period otherfactors like the condensation sink of newly formed particlesto the pre-existing aerosols, temperature and solar irradianceseem to be more important steering parameters for the pro-duction of new aerosols.
© European Geosciences Union 2004

658 M. Boy et al.: Overview of the field measurement campaign in Hyytiala
Another open question concerns the vertical distributionof the formation of SOA. For this reason measurements wereconducted at different altitudes using a tethered balloon plat-form with particle sampling and particle counting equipment.They were incorporated with eddy covariance (EC) flux mea-surements made at 23 m above ground level. The resultsgive first indications that production of new aerosols happensthroughout the planetary boundary layer (PBL), whereby dif-ferent parameters e.g. temperature, CS, solar irradiance orconcentration of monoterpenes are responsible for the loca-tion of the vertical maximum.
1 Introduction
The purpose of the EU project OSOA (Origin and Formationof Secondary Organic Aerosols) was to quantitatively under-stand the sources and formation mechanisms of secondaryorganic aerosols by applying a combination of laboratorystudies, chemical analysis of particulate matter, modellingand field observations. Within the framework of this projectan extensive field campaign was carried out in Hyytiala, Fin-land between 1 and 16 August 2001. Altogether eight insti-tutes from five different countries participated in this experi-ment with some newly developed analytical instrumentationand methodologies to reach a better scientific knowledge ofthe sources, physical properties and chemical composition ofthis organic fraction of atmospheric aerosols.
It is known that the total organic carbon can comprise 25–65% of the fine aerosol (diameter<2.5µm) mass in some re-gions (Chow et al., 1994; Novakov et al., 1997) and that theemission by vegetation of volatile organic compounds (VOC)is approximately 1150 C Tg per year (Guenther et al., 1995).Furthermore, we know that bursts of newly formed aerosolsappear in various rural areas (i.e. continental boundary layer:Kavouras et al., 1998; Kulmala et al., 2001a; Nilsson et al.,2001a; Birmili et al., 2002). However, the exact understand-ing of the pathways from emission of VOCs to the particulatephase still includes far too many unknowns to draw final con-clusions.
Secondary organic aerosols are formed, when the satu-ration vapour pressure of the gas-phase oxidation productsis sufficiently low so that these species can condense onpre-existing particles or even form new particles throughhomogeneous nucleation. Hoppel et al. (2001) observedin Calspan’s 600 m3 environmental chamber aerosol forma-tion and growth from the reaction products ofα-pineneand ozone, utilizing relatively low mixing ratios ofα-pinene (15 ppb) and ozone (100 ppb). Nucleation in thisα-pinene/ozone system could not be explained by classical nu-cleation theory. The authors suggested that the nucleationrate in theα-pinene/ozone system may be limited by theinitial nucleation steps (i.e. dimer, trimer or adduct forma-tion). This would be a possible pathway how organic species
formed out of gas-phase reactions from monoterpenes couldcontribute to the formation of new aerosols by homogeneousnucleation. However, the mixing ratios ofα-pinene used inthis experiment are still one order of magnitude higher thanobserved e.g. in a rural area of central Finland. Another the-ory, which would explain the nucleation events or the timeof particle bursts, is ternary nucleation of H2O, NH3 andH2SO4 (Korhonen et al., 1999). According to the sugges-tions of Kulmala et al. (2000), ternary nucleation can occurat typical tropospheric conditions leading to a reservoir ofthermodynamically stable clusters (TSCs, diameter∼=1 nm),which under certain conditions grow to detectable sizes. Inthis case organic compounds with low volatility could be thecondensing species, which bring the particles to the size of3 nm in diameter, where present state-of-art instrumentationcan detect them.
The aim of the OSOA project and the field campaign inHyytiala was to get more detailed information about theprecursor gases, condensing species and reaction mecha-nisms involved in the formation process of secondary organicaerosols. Out of these reasons, gas-phase and particle phasemeasurements were carried out in a rural area with low an-thropogenic impact.
2 Instrumentation
2.1 SMEAR II
Data were collected at the Station for Measuring ForestEcosystem-Atmosphere Relations (SMEAR II) in Hyytiala,Finland. The station is located in Southern Finland(61◦51′ N, 24◦17′ E, 181 m asl), with extended areas of ScotsPine (Pinus sylvestris) dominated forests. The conditions atthe site are typical for a background location; however, occa-sionally measurements were polluted by the station buildings(0.5 km away) and the city of Tampere (60 km away) bothlocated in a west-south-west direction (215–265◦) from theinstruments.
A Differential Mobility Particle Sizer (DMPS) system (lo-cated in the cottage) monitored aerosol size distributions at2 m height from ground level. This gave a continuous view ofthe distribution and evolution of sub-micrometer aerosol par-ticles. The DMPS system used here actually consists of twosystems. The first system includes a TSI 3025 UFCPC anda Hauke-type short DMA (Differential Mobility Analyzer)and measured particles between 3 and 20 nm in dry diameter.The second system included a TSI 3010 CPC and a Hauke-type medium DMA capable of measuring particles between20 and 500 nm. A particle size distribution is recorded every10 min (Aalto et al., 2001).
Concentrations of H2O, NOx, SO2 and O3 were measuredwith an URAS gas analyzer, chemiluminescence gas ana-lyzer (TEI 42S), fluorescence analyzer (TEI 43BS) and anozone analyser (API 400), respectively. Air samples were
Atmos. Chem. Phys., 4, 657–678, 2004 www.atmos-chem-phys.org/acp/4/657/

M. Boy et al.: Overview of the field measurement campaign in Hyytiala 659
collected from the mast at 4.2 m, 16.8 m and 67.2 m heightlevels every 5 min. Temperature (measured with PT-100-sensors, platinum resistance thermometers) and horizontalwind speed (measured with cup anemometers) were col-lected every 50 s at these three heights as well. Wind direc-tion was measured every 50 s by wind vanes at 16.8 m and50.4 m heights.
A Sensitron AB monostatic 2.3 kHz doppler Sound Detec-tion and Ranging system (SODAR) was used to measure thestability of the air (echo strength) and the means and stan-dard deviations of the horizontal and vertical wind compo-nents as well as wind direction up to a height of 500 m in25 m intervals. Raw echo measurements were achieved in 8-s cycles between three antennas. The vertical antenna echostrength was averaged and stored every 3 min. Averages andstandard deviations of wind speed were then derived and av-eraged over 30 min periods.
Spectral solar irradiance in the range from 280 to 580 nmand a step width of 1 nm was measured with a BenthamDM150 double monochromator. The scans were performedevery half hour and lasted approximately 11 min. A de-tailed description of this instrument is given by Boy and Kul-mala (2002a).
The aerosol particle number fluxes were measured by theeddy covariance (EC) technique at a height of 23 m, approx-imately 10 m above the forest canopy. The fast responsemeasurements (20 Hz) of wind speed and particle numberconcentration were performed by a sonic anemometer (So-lent Research R3, Gill Instruments, Lymington, UK) and amodified condensational particle counter (CPC) TSI model3010 (TSI Incorporated, Shoreview, MN, USA). The parti-cle sizes detected by the EC system included particles in therange of 10 to 500 nm. Lower cut-off size (50% counting ef-ficiency) for the CPC was determined as 14 nm by Buzoriuset al. (2001). Particle fluxes were calculated for half-hour av-eraging periods. More details of the particle eddy covariancesystem and various aspects of its application and operationcan be found in Buzorius et al. (2000).
For a more detailed description of the SMEAR II stationand instrumentation, see Kulmala et al. (2001a) and www.honeybee.helsinki.fi/smear/.
2.2 HTDMA and OTDMA
As a part of the physicochemical characterization of aerosolduring the Hyytiala campaign, hygroscopic properties ofsub-micron particles as well as their ability to absorb ethanolwere monitored using Hygroscopicity and Organic TandemDifferential Mobility Analyzers (HTDMA and OTDMA).They were set up in a container close to the mast and theyused the same sample inlet, which drew air from a height of16 m through a steel tube (diameter 2.5 cm). The flow ratewas approximately 17 L min−1 in order to minimize particlelosses due to a long residence time inside the inlet tube. Thesamples were drawn through 10 mm OD copper tubes from
the main inlet line near the container to the individual instru-ments.
The HTDMA system consists of two Vienna type DMAs(Winklmayr et al., 1991) in series and one TSI-CPC 3010particle counter for concentration measurements. In additionthere is also a humidification unit, which generates the de-sired relative humidity inside the second DMA in two stages.Sheath air and aerosol sample flow are humidified separately.The system is built following the guidelines set by Hameri etal. (2000) to measure also in the ultra-fine size range (10–20 nm). As an output, the HTDMA gives the ratio of particlediameter at elevated RH to that at dry conditions, denoted asgrowth factor (GF).
The hygroscopicity measurements of the particles wereconducted at∼90%±4% relative humidity. Size changes inelevated relative humidity were monitored for the particlesof 20, 30, 50, 100 and 150 nm in diameter. Concentrations inthe HTDMA were not corrected with respect to losses insidethe system and sampling inlet. Fluctuations of RH duringthe measurements were not taken into account either. Thefunctionality of the HTDMA was checked daily by measur-ing the growth factor for a known substance, pure ammoniumsulphate aerosol. It was generated from liquid solution witha TSI 3076 Constant Output Atomizer. Hygroscopicity datawas obtained every 10 min for one dry size. Taking into ac-count the number of dry sizes measured, hygroscopic prop-erties were measured ca. once per hour for each dry size. TheHTDMA was in operation continuously.
The main features of the OTDMA are similar to those ofthe HTDMA with the exception that the humidification unitis used to generate a constant ethanol saturation ratio insidethe second DMA. The details of the instrument and interpre-tation of the OTDMA data are described in Joutsensaari etal. (2001). Ethanol was chosen as organic solvent because1) it dissolves a wide range of organic compounds, and doesnot dissolve most inorganic salts, 2) there’s a lot of data ofthe ethanol solubility of different materials in the literatureand 3) it is fairly convenient to use in practice, i.e. there’s nodanger of explosion, it is not toxic, and its vapour pressureis manageable. Growth of aerosol particles in ethanol vapourdepends on composition of the particles. Particles can beroughly classified based on their growth in ethanol vapour: ahigh GF indicates that particles are composed of well ethanolsoluble material(s), very probably organic, whereas a low GFindicates that particles are composed of material(s) that donot have a very high ethanol solubility (could be organic)or partly of ethanol insoluble and partly of ethanol solublematerial(s). Ethanol insoluble materials include elementarycarbon, minerals, most inorganic salts and also different or-ganics.
In most of the experiments, aerosol particles were onlytreated inside DMA-2 by ethanol-rich sheath air and noaerosol treatment was used before DMA-2. In this paper,only results without aerosol treatment before DMA-2 are pre-sented. Growth in ethanol vapour was mainly determined for
www.atmos-chem-phys.org/acp/4/657/ Atmos. Chem. Phys., 4, 657–678, 2004

660 M. Boy et al.: Overview of the field measurement campaign in Hyytiala
Table 1. Data collected on tethered balloons at Hyytiala during the OSOA campaign 2001.
Date VOC profiles integrative VOC OPC profiles CPC profiles Met. Profiles(Temp./RH)
2 Aug. 1 2 33 Aug. 4 4 8 84 Aug. 2 6 65 Aug. 2 3 46 Aug. 2 1 67 Aug. 3 3 6 28 Aug. 3 4 8 89 Aug. 2 1 8 610 Aug. 412 Aug. 3 2 10
Total 20 20 48 26 76
particles of 20, 30, 50, 80 and 100 nm in diameter. Saturationratio (S) of ethanol vapour was kept at 0.90±0.02 during theexperiments. The OTDMA measurements were mainly car-ried out during daytime (9 a.m.–8 p.m.) because the system isnot fully automatized and supervision is needed during mea-surements. During daytime of the campaign, OTDMA re-sults were obtained for 6 event (1, 2, 3, 7, 10 and 14 August)and 10 non-event days. Only a few nighttime experiments(15, 16 and 17 August) were carried out.
Atmospheric aerosol is often an external mixture, i.e. itconsists of particles which have different chemical composi-tions. Their water and ethanol uptake properties may there-fore vary, which are observed in the HTDMA and OTDMAas distinct peaks.
2.3 Tethered balloon platform measurements
Measurements on tethered balloon platforms can be used toderive gas fluxes averaged over large areas (20 to<200 km2)
(Davis et al., 1994; Greenberg et al., 1999; Helmig et al.,1998). For this purpose, two tethered helium balloons (Vol.:9 m3, Blimp Works, Statesville, NC) were flown at heightsbetween 2 m and 1.2 km above ground during the field cam-paign in Hyytiala. The launch site was the soccer field at theHyytiala station, located 0.9 km southeast of the SMEAR IImast.
VOCs were collected onto adsorbent cartridges (combi-nations of Carbotrap®, and Carbosieve S-III®) by minia-turized air samplers. The sampling packages also includesensors for temperature and pressure measurements, and canbe attached to any position on the tether line. Details aboutthese samplers are given in Greenberg et al. (1999). Analysisof VOC samples was performed in the laboratory at NCAR(Boulder, CO), with gas chromatography and mass spectrom-etry detection (GC-MS). The procedure for the analysis ofthe cartridges is described by Greenberg et al. (1995).
In addition to VOC sampling, in-situ particle counterswere attached to the tethered balloons. Two handheld particlecounters were used, an optical particle counter (OPC) (ABA-CUS, Particle Measurement Systems, Boulder, CO) and acondensation particle counter (CPC) (Model 3007, TSI Inc.,Shoreview, MN). The OPC quantifies particle number con-centrations in 4 size bins (0.3–0.5µm, 0.5–1µm, 1–5µm,and>5µm diameter), the CPC measures the total particlenumber in the size range of 10 nm–1µm. According to cal-ibration measurements by Hameri et al. (2002) the 50% de-tection efficiency for the CPC was 10 nm.
Tethered balloons were flown during daytime from 2 Au-gust to 12 August, in two basic configurations.
1. VOC sampling package and particle sensor attached0.5 m below the balloon with continuous measurementsduring ascent and descent. This setup generates verticalprofiles of temperature, humidity and particles, as wellas an integrative VOC measurement from ground to themaximum height of the balloon. With time resolutionsof 30 s (OPC), 10 s (CPC, averaged data of originally1 Hz) and 2 s (temperature and humidity) at ascent anddescent rates of 0.5–1 m s−1, the resulting vertical reso-lutions were 30 and 10 m for particle measurements and1–2 m for meteorological data, respectively.
2. Three VOC sampling packages attached on the tetherline at heights of about 120, 250 and 550 m. The pack-ages sampled air at those heights during 30 min, deliv-ering a mean VOC vertical profile of the lowest 550 m.
Measuring on tethered balloons was limited by weather con-ditions. Rain and high wind speeds prevent a safe operationand reduced the data coverage during the OSOA campaign.A total of 48 successful balloon flights were performed assummarized in Table 1.
Atmos. Chem. Phys., 4, 657–678, 2004 www.atmos-chem-phys.org/acp/4/657/
M. Boy et al.: Overview of the field measurement campaign in Hyytiala 661
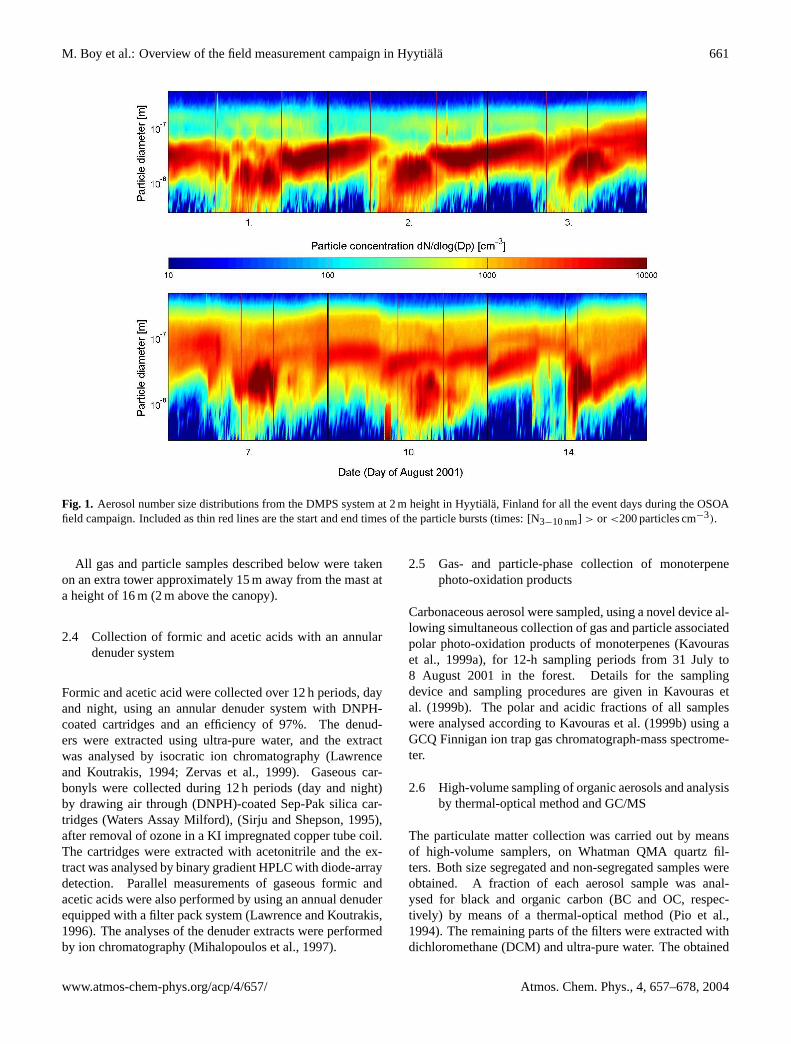
Fig. 1. Aerosol number size distributions from the DMPS system at 2 m height in Hyytiala, Finland for all the event days during the OSOAfield campaign. Included as thin red lines are the start and end times of the particle bursts (times: [N3−10 nm] > or <200 particles cm−3).
All gas and particle samples described below were takenon an extra tower approximately 15 m away from the mast ata height of 16 m (2 m above the canopy).
2.4 Collection of formic and acetic acids with an annulardenuder system
Formic and acetic acid were collected over 12 h periods, dayand night, using an annular denuder system with DNPH-coated cartridges and an efficiency of 97%. The denud-ers were extracted using ultra-pure water, and the extractwas analysed by isocratic ion chromatography (Lawrenceand Koutrakis, 1994; Zervas et al., 1999). Gaseous car-bonyls were collected during 12 h periods (day and night)by drawing air through (DNPH)-coated Sep-Pak silica car-tridges (Waters Assay Milford), (Sirju and Shepson, 1995),after removal of ozone in a KI impregnated copper tube coil.The cartridges were extracted with acetonitrile and the ex-tract was analysed by binary gradient HPLC with diode-arraydetection. Parallel measurements of gaseous formic andacetic acids were also performed by using an annual denuderequipped with a filter pack system (Lawrence and Koutrakis,1996). The analyses of the denuder extracts were performedby ion chromatography (Mihalopoulos et al., 1997).
2.5 Gas- and particle-phase collection of monoterpenephoto-oxidation products
Carbonaceous aerosol were sampled, using a novel device al-lowing simultaneous collection of gas and particle associatedpolar photo-oxidation products of monoterpenes (Kavouraset al., 1999a), for 12-h sampling periods from 31 July to8 August 2001 in the forest. Details for the samplingdevice and sampling procedures are given in Kavouras etal. (1999b). The polar and acidic fractions of all sampleswere analysed according to Kavouras et al. (1999b) using aGCQ Finnigan ion trap gas chromatograph-mass spectrome-ter.
2.6 High-volume sampling of organic aerosols and analysisby thermal-optical method and GC/MS
The particulate matter collection was carried out by meansof high-volume samplers, on Whatman QMA quartz fil-ters. Both size segregated and non-segregated samples wereobtained. A fraction of each aerosol sample was anal-ysed for black and organic carbon (BC and OC, respec-tively) by means of a thermal-optical method (Pio et al.,1994). The remaining parts of the filters were extracted withdichloromethane (DCM) and ultra-pure water. The obtained
www.atmos-chem-phys.org/acp/4/657/ Atmos. Chem. Phys., 4, 657–678, 2004

662 M. Boy et al.: Overview of the field measurement campaign in Hyytiala
Fig. 2. Half hour average values for the number concentration of the nucleation mode particles (3–10 nm) and condensational sink. Theyellow areas mark the periods when bursts of nucleation mode particles were observed.
extracts were analysed by a thermal-chemical method andGC-MS (Alves et al., 2001, 2002; Carvalho et al., 2003).
2.7 High-volume sampling of organic aerosols and analysisby LC-TOF-MS
PM2 aerosol samples were collected on preheated quartzfilters using a Digitel high volume sampler at flow ratesof 1 m3 min−1. Terpene oxidation products were measuredwith 12 h sampling time between 1 and 10 August. The fil-ters were extracted with 10% methanol and were analyzedby LC-TOF-MS (Applied Biosystems, Langen, Germany)(Rompp and Moortgat, 2000).
2.8 PM2.5 sampling on quartz fibre filters and analysis byHPLC-ESI-MS-Analysis
For PM2.5 particle sampling quartz fibre filters with a di-ameter of 70 mm (mounted in stainless steel filter holders)were used. A sampling flow rate of 2.3 m3 h−1 was applied.During the Hyytiala-campaign a backup filter was placed be-hind the front filter to determine possible sampling artifacts(see Kirchstetter et al., 2000, 2001). The duration of thesampling was about 12 h, usually divided in day and nightsamples. Prior to extraction the filters were spiked with astandard (camphoric acid) for determination of the recoveryrate. Afterwards the filters were extracted in an ultrasonicbath using methanol as solvent. The analysis was done by
a capillary-HPLC-ESI-IT-MS system (ThermoFinnigan, SanJose, USA).
3 Results and discussion
The results of the experiments are divided into five sections.Section 3.1 contains the characteristics of the aerosols. InSect. 3.2 precursor measurements of different gases are dis-cussed and Sect. 3.3 presents the chemical characterisation ofphoto-oxidation products of VOCs in the gas- and particle-phase. In Sect. 3.4 chemical aerosol analyses from differentinstitutes are introduced and in Sect. 3.5 we give an overviewof the meteorology including solar radiation during the timeof the field campaign in Hyytiala.
3.1 Characterisation of the aerosols
3.1.1 Time of particle bursts and condensational sink
Nucleation events or particle bursts measured at sizes>3 nmwith the DMPS system were observed on the first threedays in August and in less clear patterns on 7, 10 and14 August (Fig. 1). On all event days apart from 7 and10 August we observed high number concentrations (600–1300 particles cm−3) of small nucleation mode particles (3–10 nm) followed by a continuous growth to the Aitken andsometimes even accumulation mode. 7 and 10 August are
Atmos. Chem. Phys., 4, 657–678, 2004 www.atmos-chem-phys.org/acp/4/657/
M. Boy et al.: Overview of the field measurement campaign in Hyytiala 663
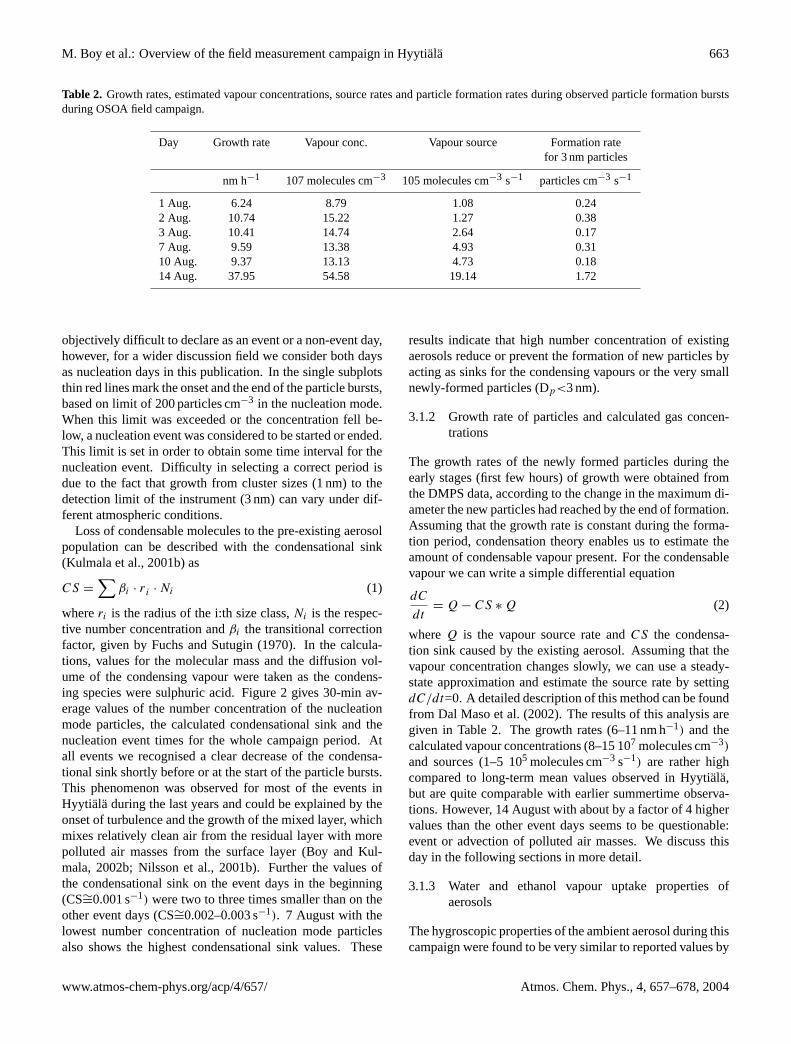
Table 2. Growth rates, estimated vapour concentrations, source rates and particle formation rates during observed particle formation burstsduring OSOA field campaign.
Day Growth rate Vapour conc. Vapour source Formation ratefor 3 nm particles
nm h−1 107 molecules cm−3 105 molecules cm−3 s−1 particles cm−3 s−1
1 Aug. 6.24 8.79 1.08 0.242 Aug. 10.74 15.22 1.27 0.383 Aug. 10.41 14.74 2.64 0.177 Aug. 9.59 13.38 4.93 0.3110 Aug. 9.37 13.13 4.73 0.1814 Aug. 37.95 54.58 19.14 1.72
objectively difficult to declare as an event or a non-event day,however, for a wider discussion field we consider both daysas nucleation days in this publication. In the single subplotsthin red lines mark the onset and the end of the particle bursts,based on limit of 200 particles cm−3 in the nucleation mode.When this limit was exceeded or the concentration fell be-low, a nucleation event was considered to be started or ended.This limit is set in order to obtain some time interval for thenucleation event. Difficulty in selecting a correct period isdue to the fact that growth from cluster sizes (1 nm) to thedetection limit of the instrument (3 nm) can vary under dif-ferent atmospheric conditions.
Loss of condensable molecules to the pre-existing aerosolpopulation can be described with the condensational sink(Kulmala et al., 2001b) as
CS =
∑βi · r i · Ni (1)
whereri is the radius of the i:th size class,Ni is the respec-tive number concentration andβi the transitional correctionfactor, given by Fuchs and Sutugin (1970). In the calcula-tions, values for the molecular mass and the diffusion vol-ume of the condensing vapour were taken as the condens-ing species were sulphuric acid. Figure 2 gives 30-min av-erage values of the number concentration of the nucleationmode particles, the calculated condensational sink and thenucleation event times for the whole campaign period. Atall events we recognised a clear decrease of the condensa-tional sink shortly before or at the start of the particle bursts.This phenomenon was observed for most of the events inHyytiala during the last years and could be explained by theonset of turbulence and the growth of the mixed layer, whichmixes relatively clean air from the residual layer with morepolluted air masses from the surface layer (Boy and Kul-mala, 2002b; Nilsson et al., 2001b). Further the values ofthe condensational sink on the event days in the beginning(CS∼=0.001 s−1) were two to three times smaller than on theother event days (CS∼=0.002–0.003 s−1). 7 August with thelowest number concentration of nucleation mode particlesalso shows the highest condensational sink values. These
results indicate that high number concentration of existingaerosols reduce or prevent the formation of new particles byacting as sinks for the condensing vapours or the very smallnewly-formed particles (Dp<3 nm).
3.1.2 Growth rate of particles and calculated gas concen-trations
The growth rates of the newly formed particles during theearly stages (first few hours) of growth were obtained fromthe DMPS data, according to the change in the maximum di-ameter the new particles had reached by the end of formation.Assuming that the growth rate is constant during the forma-tion period, condensation theory enables us to estimate theamount of condensable vapour present. For the condensablevapour we can write a simple differential equation
dC
dt= Q − CS ∗ Q (2)
whereQ is the vapour source rate andCS the condensa-tion sink caused by the existing aerosol. Assuming that thevapour concentration changes slowly, we can use a steady-state approximation and estimate the source rate by settingdC/dt=0. A detailed description of this method can be foundfrom Dal Maso et al. (2002). The results of this analysis aregiven in Table 2. The growth rates (6–11 nm h−1) and thecalculated vapour concentrations (8–15 107 molecules cm−3)
and sources (1–5 105 molecules cm−3 s−1) are rather highcompared to long-term mean values observed in Hyytiala,but are quite comparable with earlier summertime observa-tions. However, 14 August with about by a factor of 4 highervalues than the other event days seems to be questionable:event or advection of polluted air masses. We discuss thisday in the following sections in more detail.
3.1.3 Water and ethanol vapour uptake properties ofaerosols
The hygroscopic properties of the ambient aerosol during thiscampaign were found to be very similar to reported values by
www.atmos-chem-phys.org/acp/4/657/ Atmos. Chem. Phys., 4, 657–678, 2004

664 M. Boy et al.: Overview of the field measurement campaign in Hyytiala
1.2
1.3
1.4
1.5
1.6
1.7
1.8
1.9
00 02 04 06 08 10 12 14 16 18 20 22 00
Time (h)
Gro
wth
fac
tor
All daysEventNon-event
Fig. 3. Hourly averages of hygroscopic growth factors in watervapour of all days, nucleation event and non-event days (dry par-ticle size 100 nm).
1.1
1.2
1.3
1.4
1.5
00 02 04 06 08 10 12 14 16 18 20 22 00
Time (h)
Gro
wth
fact
or
EventNon-event
Fig. 4. Hourly averages of growth factors in ethanol vapour fornucleation event and non-event days (dry particle size 100 nm).
Hameri et al. (2001) in previous campaigns. On average, theambient aerosol in Hyytiala is quite inert in terms of wateruptake, and it can mostly be classified to the less hygroscopicmode based on their growth factors (GF=1.1–1.4). Accord-ing to laboratory measurements, oxidation products ofα-pinene (biogenic VOC, GF=1.1, Virkkula et al., 1999) andtoluene (anthropogenic VOC, GF=1.2, Petaja et al., 2002)belong to this group.
In order to study diurnal variations in water uptake,concentration weighed averages of measured hygroscopicgrowth factors in water were calculated. For internally mixedaerosol this is just the observed growth factor but in case ofexternally mixed aerosol, averaging ensures that the domi-nant hygroscopic fraction is weighed more and thus affectsthe average hygroscopic properties more. External mixingwith respect to water uptake prevails for sizes larger than50 nm in diameter. Growth factors in ethanol were more in-ternally mixed and only one growth factor was observed mostof the time. This indicates same ethanol uptake for all parti-cles in the ambient aerosol population.
Distinct diurnal variation in the hygroscopic properties ofaerosols is obvious in Hyytiala. Considering hourly averagesof all days of the campaign (Fig. 3), the growth factors areusually larger and more variable during daytime than dur-ing nighttime. Roughly between 8 a.m. and 8 p.m., growth
0.6
0.7
0.8
0.9
1
1.1
1.2
1.3
1.4
1 2 3 4 5 6 7 8 9 10 11 12 13 14 15 16 17
Date (August 2001)
GF(
50 n
m)/G
F(10
0 nm
)
HTDMAOTDMA
Fig. 5. Time series for the fraction of 50 to 100 nm particle growthfactors (GF(50 nm)/GF(100 nm)) in water (HTDMA) and ethanol(OTDMA) vapours.
factors are larger than 1.4 for 100 nm particles. Maximumgrowth factors above 1.6 as hourly averages are observedduring afternoon hours. During nighttime, growth factors arestable and between 1.3 and 1.4.
When nucleation days and the days with no nucleationburst are considered separately (Fig. 3), it can be noticedthat the daily maximum is somewhat higher during nucle-ation days, whereas non-nucleation days exhibit more stablewater uptake throughout the day and night. A slight decreasein water uptake prior to sunrise is present during all days, buthourly averaged growth factors are lower before nucleationbursts than during the days, when nucleation does not takeplace.
Figure 4 shows the average growth factors of 100 nm parti-cles in ethanol vapour with saturation ratios of 0.90±0.02 forevent days and non-event days. A maximum value of around1.3–1.35 is reached in the morning, after which the GF grad-ually decreases to values closer to 1.2 by 8 p.m. There areonly three nighttime measurement series, showing a some-what different behaviour. In one series after a nucleationevent day (14 August 2001) the GF decreases rapidly fromabove 1.35 at midnight to 1.2 at 3.30 a.m. and in the other se-ries after non-event days the GF remains at a nearly constantvalue of 1.15 throughout the night. Figure 4 also reveals that,unlike the hygroscopicity, the daytime behaviour of ethanolGFs is very similar during nucleation event and non-eventdays.
Figure 5 shows two time series which compare thebehaviour of 50 nm and 100 nm particles in both waterand ethanol vapours. The hygroscopic growth factors of50 nm particles are most of the time somewhat smaller thanthose of 100 nm particles with the average of the frac-tion GF(50 nm)/GF(100 nm) close to 0.9. The differenceis mostly too large to be explained (at least solely) by theKelvin effect, indicating that the compositions of the 50 nmand 100 nm particles are usually somewhat different. A fur-ther proof of this is the similar time series for the frac-tion of 50 to 100 nm particle growth factors in ethanol
Atmos. Chem. Phys., 4, 657–678, 2004 www.atmos-chem-phys.org/acp/4/657/

M. Boy et al.: Overview of the field measurement campaign in Hyytiala 665
Fig. 6. Half hour average values of the wind direction. The yellowareas mark the periods when bursts of nucleation mode particleswere observed and the thin black line is the wind-sector from Tam-pere and the station building.
vapour. It can be seen that the 50 nm particles grow morein ethanol than do 100 nm particles, with the average ofGF(50 nm)/GF(100 nm) close to 1.02. Note, that if theKelvin effect could be accounted for, this number shouldbe even slightly higher. A possible explanation for thedata shown in Fig. 5 is that the 100 nm particles contain asomewhat higher fraction of inorganic salts and a somewhatlower fraction of organic materials than do the 50 nm parti-cles. Furthermore, chemical composition of the organic mat-ter can vary in different size ranges. For instance, organiccompounds in larger particles (100 nm) can be more aged(longer residence time in the atmosphere) than smaller parti-cles and thus they can be, e.g. higher oxidized and thus canbe more water soluble and possibly also less ethanol soluble.However, this interpretation cannot be considered conclusivewithout a chemical analysis of the particles.
3.1.4 Aerosol flux measurements
The particle flux measurements were performed through-out the campaign. However, during most of the days un-favourable wind direction conditions for particle flux obser-vation prevailed (see Fig. 6): under South-westerly wind(215–265◦) the forestry field station buildings act as a sourceof aerosol particles and corresponding fluxes do not corre-spond to background conditions (Buzorius et al., 2001). Un-der such conditions the particles emitted from the station willbe seen as upward fluxes accompanied with an erratic patternin the flux time series, in contrast to normal background con-ditions when particle deposition into the forest occurs.
During the first three days in August when particle for-mation was observed the wind direction was different thanthe sector corresponding to field station. During these daysparticle number concentration decreased at night prior to par-
Fig. 7. Half hour average values for the particle number concentra-tion measured by the CPC from the EC system at 23 m and calcu-lated particle fluxes. The yellow areas mark the periods when burstsof nucleation mode particles were observed.
ticle formation (Fig. 7). The nights were moderately stable,but turbulent transport of heat and momentum (friction ve-locity around 0.2 m s−1) did not cease. However, particlefluxes were very small as typically observed at the measure-ment site (Buzorius et al., 2001). During the particle burstsperiods a rapid increase in particle concentration togetherwith very large downward fluxes was observed (PF lux : 30–70 106 particles m−2 s−1). The very high flux values duringparticle formation events result from elevated particle num-ber concentration as well as domination of small nucleationmode particles in size spectrum, which have very high de-position velocities (e.g. Peters and Heiden, 1992). Similarbehaviour but with more variation in fluxes can be seen onthe other three event days. In addition to non-stationary,rapid changes in particle concentration, meteorological rea-sons such as horizontal advection and circulation in the con-vective mixed layer can cause significant variation in ob-served fluxes (Nilsson et al., 2001b).
The fluxes obtained from measurements present averagefluxes of particles larger than 10 nm in diameter. During nu-cleation events these fluxes indicate mainly the vertical mo-tion of small particles: deposition of these particles into theforest was observed. The result also implies the existenceof a higher concentration of these particles up in the atmo-spheric boundary layer.
3.1.5 Vertical aerosol profiles
The optical particle counter (OPC) was operated on the bal-loon as described in Sect. 2 from 2 August through 12 Au-gust, whereas the CPC instrument was flown only from 7August (start 3 p.m.) till 12 August. As a consequence, CPCdata cover exclusively days without obvious particle forma-tion events.
www.atmos-chem-phys.org/acp/4/657/ Atmos. Chem. Phys., 4, 657–678, 2004

666 M. Boy et al.: Overview of the field measurement campaign in Hyytiala
80 % 100 % 120 %
0
0.2
0.4
0.6
0.8
1
1.2
1.4
1.6
He
igh
t (z
/zi)
OPC (300-500nm), non-event days
OPC (300-500nm), Aug 3
Fig. 8. Vertical profiles of particle number concentrations. Concen-trations are normalized to the average in the mixed layer, altitudeis given as height above ground divided by boundary layer depth(z/zi). Only profiles with measurements both in the mixed layer(z/zi<1) and above (z/zi>1) are included; error bars denote stan-dard deviations of the sample (3 August, n=6, other days n=33).
Profiles obtained by this method represent instantaneoussnapshots of the vertical particle distribution. This is docu-mented by large variations in particle numbers at comparableheights between individual profiles. Variations from one pro-file flight to the next (time gap of at least 2 h) or even betweenascent and descent of the same flight (30 min) are large.
Some distinct features could be observed by looking atthe vertical distribution of particles in a relative way, bylooking at number concentrations normalized to the aver-aged concentration over the mixed layer. As can be seen inFig. 8, there was a different vertical trend in particle con-centrations (>300 nm) on 3 August as compared to the aver-age profile recorded on non-event-days. On 3 August, parti-cle concentrations above the planetary boundary layer (PBL)were small and no significant gradient within the PBL couldbe observed, whereas increasing aerosol concentrations withheight were observed on the other days.
During three flights, the CPC and OPC were run in par-allel. Of the resulting 10 profiles, some show different ver-tical trends for different particle sizes (Fig. 9). It indicatesthat particles of the sizes most interesting for nucleationevents may have an opposite gradient than larger particles.Summarising both figures, no indication for preferred parti-cle formation above the surface layer or in the free tropo-sphere appears, the results indicate that the formation of new
80 % 90 % 100 % 110 % 120 %
0
0.1
0.2
0.3
0.4
0.5
He
igh
t (z
/zi)
CPC (10-1000nm)
OPC (300-500nm)
Fig. 9. Vertical particle concentration gradients for different sizes,plotted in the same way as in Fig. 8; average of 4 profiles measuredon 8 August, 14:30–15:30.
particles happens throughout the boundary layer in a moreor less homogenous pattern. In this context Stratmann etal. (2003) measured with two CPCs with different cut-offs (5and 10 nm) homogenous distribution of particles with Dp=5–10 nm in the mixed boundary layer during an event day nearLeipzig, Germany.
More information of this type (especially measurementsof particles<300 nm) during nucleation events may providevaluable data for the interpretation of particle formation. Asthe results indicate, such efforts ideally would include notonly measurements of particle numbers, but also informationabout the size distribution.
3.2 Precursor measurements
3.2.1 Ozone, SO2 and NOx
The concentrations of different gases (O3, NOx and SO2)
monitored continuously in Hyytiala SMEAR II were anal-ysed for the time of the OSOA field campaign (at 16 m level)and plotted as half-hour average values in Fig. 10. During theexperiment the ozone concentrations were varying between10 and 40 ppb with a clear diurnal profile. However, therewere no visible trends of higher or lower values at times ofnew particle formation, neither in the daily maxima nor inthe gradients prior to the particle bursts (d[O3]/dt).
NOx and SO2 mixing ratios were varying during the cam-paign between 0.068 to 2.98 ppb and below detection limitto 1.34 ppb, respectively. If we compare the mixing ratiosof NOx with the wind direction from Fig. 6, we recognisehigher values during the times, when probably more pollutedair masses from Southwest (also with high values for aerosol
Atmos. Chem. Phys., 4, 657–678, 2004 www.atmos-chem-phys.org/acp/4/657/

M. Boy et al.: Overview of the field measurement campaign in Hyytiala 667
Fig. 10.Half hour average values of O3, NOx and SO2. The yellowarea marks the periods when bursts of nucleation mode particleswere observed.
condensational sink – see Fig. 2) arrived at the station. So thefirst three clear event days in the beginning of August showthe lowest concentrations of NOx and also SO2. The otherevents later on are more polluted with 2 to 4 times highervalues for both gases. Although SO2 (or the oxidised formH2SO4) is involved through binary or ternary nucleation inthe formation of TSCs, in the real atmosphere the influenceof other parameters such as the condensational sink may bealso important for the formation of new aerosols.
3.2.2 VOC measurements on tethered balloons
During the OSOA field campaign a total of 80 VOC sam-ples were collected onto cartridges from balloon platforms.In addition, VOC probes were taken on the SMEAR II mastat heights between 23 and 43 m above ground. The goalof these measurements was to determine fluxes of biogenicVOC, terpenes in particular, at both local and regional scales.
The analyses of the balloon samples focused on monoter-penes and isoprene. Terpene mixing ratios in the PBL dur-ing that period were in the order of a few ppt, withα-pinene, limonene,13-carene and camphene as the majorcompounds. Isoprene was also found in most samples, al-though at lower mixing ratios than monoterpenes. In com-parison to earlier measurements at Hyytiala, the contributionof α-pinene to the sum of terpenes was smaller in these PBL-measurements (Fig. 11a). Averaged VOC profiles (especiallymonoterpenes) within the PBL showed a decreasing trendwith height, as would be expected for gases with a sourceat the surface (Fig. 11b).
Daily averages of all VOC samples taken within the PBLare shown in Fig. 12. Days with particle formation events (2,3 and 7 August) had low terpene mixing ratios. Note how-ever, that a direct comparison of days is difficult, as the tem-poral coverage with balloon soundings varies significantlyfrom day to day.
14.5 a-pinene3.5 camphene2.7 ß-pinene6.5 3-carene8.5 limonene1.9 other
a-pinenecampheneß-pinene3-carenelimoneneother
0
0.2
0.4
0.6
0.8
0 0.05 0.1 0.15 0.2 0.25
g/m3
He
igh
t (z
/zi)
sum terpenes
isoprene
Fig. 11. Averaged monoterpene concentrations from balloon sam-ples,(a) mean composition,(b) profile of medians (error bars areinterquartile ranges).
1 2 3 4 5 6 7 8 9 10 11 12
Date (Day of August 2001)
0
0.1
0.2
0.3
0.4
0.5
g/m
3
sum of terpenes
isoprene
0
0.1
0.2
0.3
0.4
0.5
Fig. 12. Biogenic VOC concentrations during the OSOA campaign2001. Large symbols are daily averages (error bars are standarddeviations) of all measurements taken within the PBL (small sym-bols).
The VOC measurements from balloons were used to de-rive fluxes of biogenic VOC. The footprints of fluxes ob-tained from measurements in the PBL are of the order fromtens to hundreds of square kilometers, depending on themethod applied. Uncertainties of fluxes determined in thisway are largely due to the various assumptions included(Guenther et al., 1996). For example, homogenous emissionsare assumed within the footprint area, a condition that is most
www.atmos-chem-phys.org/acp/4/657/ Atmos. Chem. Phys., 4, 657–678, 2004

668 M. Boy et al.: Overview of the field measurement campaign in Hyytiala
Table 3. Organic compounds measured in the gas-phase.
Compound name Formula Concentration Range
µg m−3 molecules cm−3
Aldehydes and KetonesFormaldehyde HCHO 0.18–0.98 3.6 109–2.0 1010
Acetaldehyde CH3CHO 0.12–3.24 1.7 109–4.7 1010
Acetone CH3COCH3 0.24–1.8 2.5 109–1.9 1010
Acrolein H2CHCHO <0.01–1.33 <1.1 108–1.4 1010
Propionaldehyde CH3CH2CHO 0.02–0.38 2.1 108–4.0 109
Hexanaldehyde CH3(CH2)4CHO <0.01–0.31 <6.0 1071.9 109
commonly violated in practice. Landscape fluxes thereforeneed to be determined from averaged VOC profiles reflectingvarious conditions and wind directions. As a consequence,the advantage of deriving a flux representative for the scaleof a whole landscape is accompanied by limited temporal in-formation about the flux.
The mean terpene fluxes as derived from balloon measure-ments between 2 August and 12 August were between 140and 300µgC m−2 h−1, depending on the method applied.Assuming the discrepancy is mainly a consequence of thedifferent footprints of the methods, we conclude that terpeneemissions averaged over a region of several hundreds of km2
surrounding Hyytiala are less than those of the region cov-ering tens of km2 close to the site. The same trend of loweremissions with increasing footprint area exists in the com-parison of balloon results with measurements from the mast.The average of the terpene fluxes determined from gradientson the mast on 15 August was 330µgC m−2 h−1. This corre-sponds to a basal emission rate (30◦C) of 900µgC m−2 h−1;a value similar to earlier flux measurements on the tower(Rinne et al., 2000).
3.3 Chemical characterisation of photo-oxidation productsof VOCs in the gas- and particle-phase.
Chemical analyses of the gas-phase and particle-phase wereperformed in order to study the spatial distribution of mea-sured species.
3.3.1 Carboxylic acids and carbonyls
The concentrations of gas-phase carboxylic acids and car-bonyls observed during the campaigns were measured bytwo independent groups (Environmental Chemical ProcessesLaboratory- ECPL, and University of Aveiro – UVAR). Theresults are shown in Fig. 13 and Table 3. The data reportedby ECPL, concerning the gaseous concentration of small car-boxylic acids support the hypothesis that biogenic emissionsare sources of atmospheric formic and acetic acid. The con-centration of formic acid ranged from 0.52 up to 5.04µg m−3
(6.8–66 109 molecules cm−3) while the corresponding con-centration for acetic acid ranged from 0.41 up to 4.06µg m−3
(4.1–41 109 molecules cm−3). The general trends in bothformic and acetic were similar showing a high degree of cor-relation (Fig. 13a) suggesting that their sources should beclosely related. The formate to acetate ratio varied from 1.04to 1.43 (mean value of 1.26), indicating thus predominanceof formic acid in the forested area of Hyytiala. This comesin accordance with the observations by Chebbi et al. (1996)that formic acid is the main product of isoprene and monoter-penes (emitted by trees) oxidation by ozone. The same trendhas been observed in a previous study in a Eucalyptus forestin Portugal (Kavouras et al., 1998). Photochemical produc-tion (that favours formic acid) seems to play a more impor-tant role than direct emissions from vegetation (that favoursacetic acid). Acetic acid concentrations can be increasedby anthropogenic emissions (Kawamura et al., 1985) and/orbiomass burning (Talbot et al., 1987). This seems not to hap-pen in the investigated area. Measurements of the same acidsconducted by UVAR resulted to the same mean formate toacetate ratio value of 1.26. Both laboratories observed a pre-dominance of maxima during daytime and minima duringnighttime (Fig. 13a).
Formaldehyde presented a smooth diurnal variation withmaxima during daytime and minima during nighttime. Ac-etaldehyde and acetone exhibited also a predominanceof daytime maxima. Nevertheless these carbonyl com-pounds presented the highest concentrations during night-time. Acrolein exhibited a strong diurnal variation of concen-trations with maxima during nighttime and minima duringdaytime. The most pronounced variation occurred between 7and 11 August. Propionaldehyde didn’t present a character-istic diurnal variation and the highest concentrations of hex-analdehyde were observed mainly at night.
3.3.2 Gas/particle partitioning of photo-oxidation products
The volatile and semi-volatile of the polar and acidic frac-tions in both particulate and gas phase were analysed. Aseries of monoterpene-skeletoned photo-oxidation carbonyl
Atmos. Chem. Phys., 4, 657–678, 2004 www.atmos-chem-phys.org/acp/4/657/

M. Boy et al.: Overview of the field measurement campaign in Hyytiala 669
Pinonaldehyde (PAL)
0
5
10
15
20
25
30
35
31/
7-01
/8
01/
8-01
/8
01/
8-02
/8
02/
8-03
/8
03/
8-03
/8
03/
8-04
/8
04/
8-05
/8
05/
8-05
/8
05/
8-06
/8
06/
8-07
/8
07/
8-07
/8
07/
8-08
/8
Con
cent
ratio
n [u
g/m
3] .
Particle-phase
Gas-phase
c)
Nopinone (NP)
0.0
0.2
0.4
0.6
0.8
1.0
1.2
1.4
31/
7-01
/8
01/
8-01
/8
01/
8-02
/8
02/
8-03
/8
03/
8-03
/8
03/
8-04
/8
04/
8-05
/8
05/
8-05
/8
05/
8-06
/8
06/
8-07
/8
07/
8-07
/8
07/
8-08
/8
Sampling Date 2001
Con
cent
ratio
n [µ
g/m
3] .
Particle-phase
Gas-phase
e)
nor-Pinonic Acid (n-PA)
0.0
0.5
1.0
1.5
2.0
2.5
3.0
3.5
4.0
4.5
5.0
31/
7-01
/8
01/
8-01
/8
01/
8-02
/8
02/
8-03
/8
03/
8-03
/8
03/
8-04
/8
04/
8-05
/8
05/
8-05
/8
05/
8-06
/8
06/
8-07
/8
07/
8-07
/8
07/
8-08
/8
Con
cent
ratio
n [µ
g/m
3] .
Particle-phase
Gas-phase
b)
Pinonic Acid (PA)
0.0
1.0
2.0
3.0
4.0
5.0
6.0
31/
7-01
/8
01/
8-01
/8
01/
8-02
/8
02/
8-03
/8
03/
8-03
/8
03/
8-04
/8
04/
8-05
/8
05/
8-05
/8
05/
8-06
/8
06/
8-07
/8
07/
8-07
/8
07/
8-08
/8
Con
cent
ratio
n [µ
g/m
3] .
Particle-phase
Gas-phase
d)
Pinic Acid (PNA)
0.0
0.5
1.0
1.5
2.0
2.5
3.0
3.5
31/
7-01
/8
01/
8-01
/8
01/
8-02
/8
02/
8-03
/8
03/
8-03
/8
03/
8-04
/8
04/
8-05
/8
05/
8-05
/8
05/
8-06
/8
06/
8-07
/8
07/
8-07
/8
07/
8-08
/8
Sampling Date 2001
Con
cent
ratio
n [µ
g/m
3] .
Particle-phase
f)
0.0
1.0
2.0
3.0
4.0
5.0
6.0
01/
8-01
/8
02/
8-03
/8
03/
8-03
/8
03/
8-04
/8
05/
8-05
/8
05/
8-06
/8
06/
8-07
/8
07/
8-07
/8
07/
8-08
/8
Con
cent
ratio
n [µ
g/m
3] .
Acetic acid Formic acid Formic / Acetic
a)
Fig. 13. Gas- and particle-phase concentrations of some photo-oxidation products for the first eight days in August 2001 with a samplingtime of 12 h and start times at 6 p.m. and 6 a.m., respectively.
and acidic compounds were detected and quantified in bothgas and particles over the Hyytiala forest. In particu-lar, 6,6-dimethyl- bicyclo[3.1.1]heptan-2-one (reported asnopinone) and 2,2-dimethyl-3-acetyl-cyclobutyl-ethanal (re-ported as pinonaldehyde), 2,2-dimethyl-3-acetyl-cyclobutyl-formic acid (reported as nor-pinonic acid), 2,2-dimethyl-3-acetyl-cyclobutyl-acetic acid (reported as pinonic acid), andcis-2,2-dimethyl-3-carboxy-cyclobutyl-acetic acid (reportedas pinic acid) were identified on the basis of their CI andEI mass spectra and comparison with authentic standards(Fig. 13b–f). These compounds have been determined ascharacteristic products of the photo-oxidation ofα- andβ-
pinene with ozone, OH and NO3 radicals, in laboratory stud-ies. Pinonaldehyde and nopinone have shown for most ofthe sampling days higher gas- than particle-phase concen-trations. Nighttime reactions of pinenes with NO3 radicalseventually contributed to the relatively elevated concentra-tion of pinonaldehyde in the particulate phase. For pinonic,nor pinonic and pinic acids, concentrations in the particle-phase were higher than the corresponding concentrations inthe gas phase. Pinonic acid is produced through the reactionof α-pinene with both OH radicals and ozone, and pinic acidis mainly formed through the reaction ofα- and β-pinenewith ozone. The concentration levels of pinonic acid and
www.atmos-chem-phys.org/acp/4/657/ Atmos. Chem. Phys., 4, 657–678, 2004

670 M. Boy et al.: Overview of the field measurement campaign in Hyytiala
Table 4. The total concentration ranges and carbon preference indexes for some of the detected homologue compounds series.
Compounds Concentration Cmax CPI CPI CPIClass Range Whole range Split range Split range
(ng m−3) (Petroleum) (Bacterial) (Plant wax)C10–C34 C10–C25 C21–C34
n-Alkanes 7.2–95.2 C27 2.69±1.05 1.83±0.69 5.85±2.54n-Alkanols 1.0–17.4 C26 8.52±4.16 3.33±1.82 18.98±8.44n-Monocarboxylic Acids 39.0–192.0 C16 6.86±1.67 7.00±2.18 4.72±1.10
Cmax – Carbon number with the highest peak in the chromatogram;CPI – Sum of the odd carbon number homologues divided by the sum of the even carbon number homologues over the range indicated forn-alkanes and the inverse for n-alkanols and n-alkanoic acids (Abas and Simoneit, 1996).
pinic acid show that the first is produced faster and in higheramounts than the second under real conditions. Thus, it isclear that the atmospheric concentrations of OH radicals andozone have an effect on the composition of organic aerosolproduced through the atmospheric photo-oxidation reactions.The data show the preference of the above discussed car-boxylic acids to the particle phase and eventually their abilityto condense under certain atmospheric conditions.
3.4 Chemical characterisation of organic compounds andphoto-oxidation products of VOCs in Hyytiala fineaerosols
Chemical analyses of coarse mode particles (PM2−10) wereperformed by three groups with different sampling and an-alytical techniques, which gave the chance to compare theresults of some measured species.
3.4.1 Organic aerosols PM10 analysis
Carbonaceous aerosol was one important component of theaerosol at the studied location. Organic carbon accounted for27% of the PM10 mass concentration in Hyytiala. Addingthe contribution of black carbon, the share of total carbonreaches 34%. Using the dichloromethane-extraction proce-dure 31% of the organic carbon could be extracted. The ad-dition of the water-extract increased this ratio to 52%, whichis comparable to the 48% obtained during the short-term ex-periment (Alves et al., 2002).
On average the fraction of secondary carbon in the Finnishaerosol accounted for 71% of the organic carbon, which cor-responds to 19% of the PM10 mass concentration. Secondaryorganic carbon was calculated by subtracting primary or-ganic carbon from total organic carbon, assuming that theratio between primary organic carbon and black carbon is1.1 (Castro et al., 1999). In some periods the fraction of sec-ondary organic carbon showed clear maxima during daytimeand minima during nighttime. This is an obvious indicationof local or regional formation of secondary aerosol, because
even the interference of wood burning emissions, which ishigher at night, did not cause the rise of the values calculatedfor night periods.
The total concentration ranges and carbon preference in-dexes (CPI) for n-alkanes, n-alkanols and n-mono-carboxylicacids are presented in Table 4. CPI is a diagnostic parameter,where a value higher than 3 indicates the major incorpora-tion of recent biological constituents into the aerosol sample.The input of anthropogenic contaminants reduces the CPI,such that values of approximately 1 reflect the significant in-troduction of contaminants with human origin. Cmax (carbonnumber with the highest peak in the chromatogram) can alsogive an indication of relative source input and serves as a re-gional parameter of vascular plant contributions to the atmo-sphere (Abas and Simoneit, 1996). The distribution of the n-alkanes ranged from C16 to C34, with Cmax equal to 27. Oddcarbon number predominance was found, especially in therange Cn>23, wherein odd carbon number alkanes representa primary major contribution of vascular plants waxes (Abasand Simoneit, 1996). The isoprenoid hydrocarbons derivedfrom petroleum (pristane and phytane) were also detected.
The most representative PAHs in the sampling sitewere indeno[1,2,3-cd]pyrene, benzo[b+k]fluoranthene,benzo[a]anthracene, benzo[e]pyrene and benzo[a]pyrene.On average, the total concentration of PAHs in the Finnishsamples (8.9 ng m−3) was lower than those from the previousshort-term experiment in Finland (17 ng m−3, Alves et al.,2002).
Carbonyl compounds including linear homologues weredetected. However, the discontinuity of the series makesthe application of the CPI parameter for linear compoundsimpracticable. Table 5 presents the biogenically derivedcompounds detected in the samples, which includes somecarbonyl compounds. Pinonaldehyde, 6,10,14-trimethyl-2-pentadecanone and abieta-8,11,13-trien-7-one presentedthe highest concentrations in Hyytiala. During the pre-vious short-term experiment in Hyytiala, pinonaldehydewas more abundant (6.6 ng m−3; Alves et al., 2002) and
Atmos. Chem. Phys., 4, 657–678, 2004 www.atmos-chem-phys.org/acp/4/657/

M. Boy et al.: Overview of the field measurement campaign in Hyytiala 671
Table 5. Some primary and secondary compounds derived from biogenic sources.
Compound name Max. conc. Proposed sources and References(ng m−3)
6,10,14-trimethyl-2-Pentadecanone 15.0 Degradation product of phytol found in plant wax (Simoneit et al., 1988)
Angiosperm wood burning or plant wax weatheringTriterpenones C30H48O (isomers) 2.7
(Standley and Simoneit, 1987; Simoneit, 2002)
Cholesterol 1.4Wood burning or plant wax weathering (Simoneit, 1989, 2002);
Stigmasterol 2.4Cholesterol from meat cooking (Rogge et al., 1991)
β-Sitosterol 25.0
Pina ketone (Nopinone) 0.2Photo-oxidation of alpha- and/or beta-Pinene (Yokouchi and Ambe, 1985;
Pinonaldehyde 5.5Hoffmann et al., 1997; Christoffersen et al., 1998;
Pinonic acid 2.6Winterhalter et al., 1999; Koch et al., 2000)
Pinic acid 5.0
Dehydroabietinal 0.2Abieta-8,11,13-trien-7-one 2.1 Degradation of resinous components by coniferous wood burning6-Dehydrodehydroabietic acid 0.5 or natural weathering (Standley and Simoneit, 1987, 1994;Dehydroabietic acid 2.3 Simoneit 1989, 2002)7-Oxodehydroabietic acid 0.1
trimethylpentadecanone was not a ubiquitous component ofthe aerosol. Nopinone and monoaromatic carbonyls, includ-ing benzaldehyde, were detected in all the experiments.
The homologous compound series of n-alkanols rangesfrom C11 to C30 in the Finnish site. The most abundant ho-mologue was C26 and strong primary contributions of vascu-lar plants waxes were found. Sterols were also present in thesamples (Table 5).
The n-alkanoic acids are one of the dominant componentsin the extractable lipids. The homologous compound seriesranges from C8 to C32 with an even carbon number predomi-nance. The samples present a predominance of Cmax at n-C16 that may reflect an enhanced primary microbial com-ponent and a less pronounced variable maxima for carbonnumber higher than 22. Alkanedioic acids were present inthe aerosol samples from the Hyytiala forest in a discontin-uous series ranging from hexanedioic acid to docosanedioic.Nonanedioic was the most abundant constituent of this classand it has been suggested to be formed by photo-oxidation ofoleic and linoleic acids (Yokouchi and Ambe, 1986; Kawa-mura and Gagosian, 1987; Stephanou and Stratigakis, 1993),which were also detected in the samples. Acids resultingfrom the photo-oxidation of pinene were also present in theaerosol phase (Table 6). Resin acids were also detected.
The compounds detected in the water-extract werepolyhydroxy-, mono- and dicarboxylic acids, polyhydricalcohols (polyols) and sugars. The most representativeindividual compounds were malic acid, mannitol, ara-bitol, glucose and sucrose. Levoglucosan (1,6-anhydro-ß-
D-glucopyranose) was also detected in the water-extract,though it is extracted predominantly by dichloromethane inthe first extraction stage. This anhydrosugar is considereda specific tracer of biomass burning, which results from thedepolymerization of cellulose at temperatures above 300◦C(Simoneit et al., 1999). Table 6 also shows the concentra-tion ranges for some water-extractable organic compounds.A more detailed discussion on the sources and size distribu-tions of water-extractable organic compounds can be foundelsewhere (Carvalho et al., 2003).
3.4.2 Determination of VOC photo-oxidation products inPM2 and PM2.5
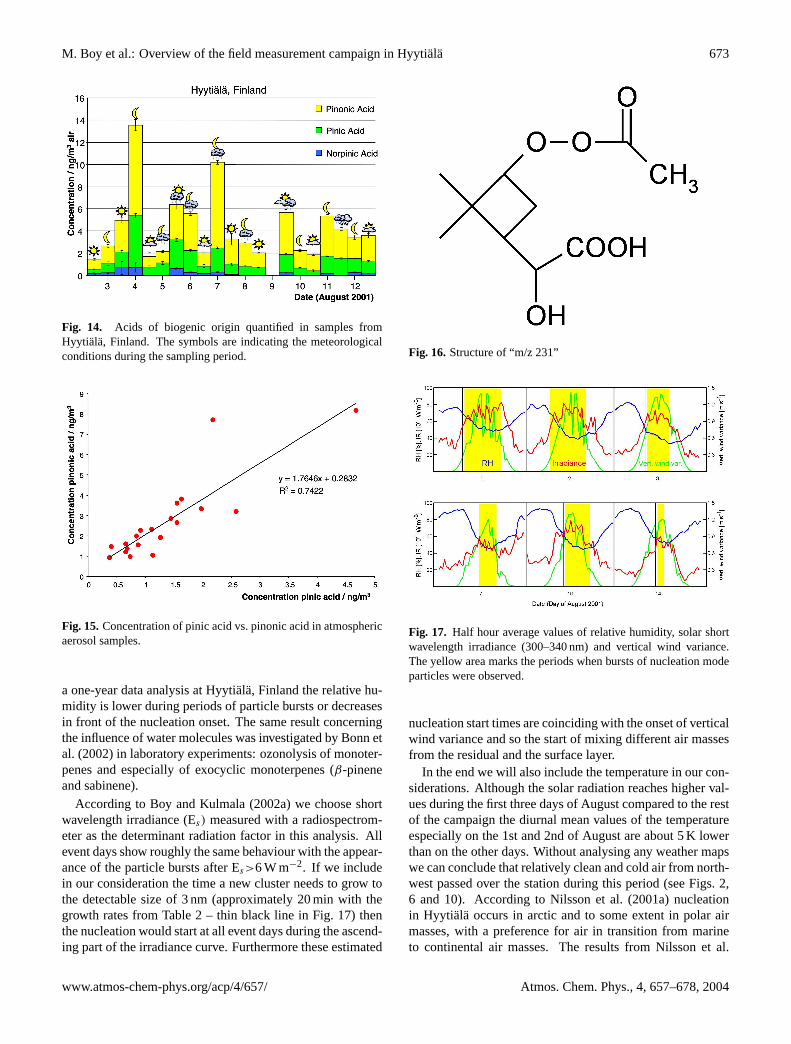
The analysis of PM2 and PM2.5 measured in aerosol sam-ples from Hyytiala were performed by two independentgroups. Group one (Institut fur Specktrochemie, Germany)detected and quantified a series of organic acids, which orig-inated from terpene (α-pinene) oxidation. The results areshown in Fig. 14. These acids, verified by commerciallyavailable standards, were norpinic, pinic and pinonic acid.Since their volatile precursors are of biogenic origin theseless volatile substances can be used as marker compoundsfor the natural fraction of the tropospheric secondary or-ganic aerosol. The concentrations of these compounds weremostly between 0.2 and 8 ng m−3 (for pinonic acid: ≈6.6105 and 2.6 107 molecules cm−3). The C10-ketocarboxylicacid – pinonic acid – shows most times higher concentrationsthan the C9-dicarboxylic acid – pinic acid. Norpinic acid –
www.atmos-chem-phys.org/acp/4/657/ Atmos. Chem. Phys., 4, 657–678, 2004

672 M. Boy et al.: Overview of the field measurement campaign in Hyytiala
Table 6. Some organic compounds detected in the water-extract.
Compound name Formula Concentration Range (ng m−3)
Malic acid (Hydroxibutanedioic) C4H6O5 0.1–8.02-Hydroxiglutaric acid C5H8O5 0.1–2.6Arabitol C5H12O5 1.4–241Mannitol C6H14O6 <0,5–88Glucose C6H12O6 1.3–41Sucrose C12H22O11 0.3–10
Table 7. Aerosol concentrations of terpene oxidation products.
Number of samples Minima Maxima Average
ng m−3 ng m−3 ng m−3 molecules cm−3
Pinic acid 16 2.0 21 5.6 1.8 107
Pinonic acid 16 5.2 14 8.1 2.7 107
Norpinic acid 16 n.q. 1.0 0.3 1.1 106
Sabinic acid 16 0.7 4.1 1.9 5.0 106
Limonic and caric acid 16 1.7 62 10 1.3 107
n.q.: below limit of quantification
a C8-dicarboxylic acid – is found at the lowest concentrationlevels, often below the detection limit.
The results from group two (Max-Planck-Institut furChemie, Germany) are summarized in Table 7. Their mea-sured average concentrations of pinic, pinonic and nor-pinonic acid were almost identical to the values from groupone (0.3 to 8.1 ng m−3). Furthermore, sabinic, caric andlimonic acid were measured for the first time in ambi-ent aerosol samples with average concentrations of 1.9 and10 ng m−3, respectively. They were identified by comparisonwith laboratory experiments. Sabinene, limonene and carenewere reacted with ozone in a smog chamber and the parti-cles were collected. Sabinic acid could be quantified in theHyytiala samples. However, caric and limonic acid coelutedin the HPLC, so the concentrations stated are the sum of bothacids. Sabinic, limonic and caric acid were quantified usingpinic acid as a standard. Their concentrations exceeded theconcentrations of pinic, pinonic and norpinic acid on severaldays. This shows that they have to be taken into accountwhen assessing the contribution of terpene oxidation to sec-ondary organic aerosol production.
Correlation analysis was done to get an indication of thesource, biogenic or anthropogenic, of known and unknowncompounds. The source can mean a source of primary emis-sions, a source of the precursor substances and/or the mecha-nism of formation (e.g. oxidation by ozone). As an example,one correlation analysis is shown for pinic and pinonic acidin Fig. 15. As can be expected the concentration of pinic
and pinonic acid shows a good correlation, since both com-pounds are formed from the same precursor compound andboth originate from identical degradation mechanisms. Fur-thermore, it can be seen that the average concentration ofpinonic acid is almost twice that of pinic acid.
Within the samples from Hyytiala a signal was observedwhich indicated the presence of a molecule with a molecularmass of 232 g mol−1. This compound was also observed inchromatograms from oxidation experiments ofα-pinene withNOx done in the CEAM-laboratory in Valencia as well as insamples from other laboratory experiments. Warscheid andHoffmann (2002) suggested a structure based on online MSn
experiments made during ozone oxidation experiments in asmog chamber, as shown in Fig. 16. The molecule containsa carboxyl and a per-ester function and consequently can besupposed to have a very low saturation vapour pressure.
3.5 Meteorology and solar radiation
The last point from the results presented in this publicationgives an overview of the meteorological situation during thecampaign including the solar radiation. Figure 17 shows forall events half-hour average values of relative humidity, shortwavelength irradiance (300–340 nm) and vertical wind vari-ance, which is proportional to the amount of turbulent kineticenergy and indicates the strength of the mixing process. Ta-ble 8 contains characteristic values of these parameters for alldays of the campaign including temperature. In agreementwith the results presented by Boy and Kulmala (2002b) for
Atmos. Chem. Phys., 4, 657–678, 2004 www.atmos-chem-phys.org/acp/4/657/
M. Boy et al.: Overview of the field measurement campaign in Hyytiala 673
Fig. 14. Acids of biogenic origin quantified in samples fromHyytiala, Finland. The symbols are indicating the meteorologicalconditions during the sampling period.
Fig. 15.Concentration of pinic acid vs. pinonic acid in atmosphericaerosol samples.
a one-year data analysis at Hyytiala, Finland the relative hu-midity is lower during periods of particle bursts or decreasesin front of the nucleation onset. The same result concerningthe influence of water molecules was investigated by Bonn etal. (2002) in laboratory experiments: ozonolysis of monoter-penes and especially of exocyclic monoterpenes (β-pineneand sabinene).
According to Boy and Kulmala (2002a) we choose shortwavelength irradiance (Es) measured with a radiospectrom-eter as the determinant radiation factor in this analysis. Allevent days show roughly the same behaviour with the appear-ance of the particle bursts after Es>6 W m−2. If we includein our consideration the time a new cluster needs to grow tothe detectable size of 3 nm (approximately 20 min with thegrowth rates from Table 2 – thin black line in Fig. 17) thenthe nucleation would start at all event days during the ascend-ing part of the irradiance curve. Furthermore these estimated
Fig. 16. Structure of “m/z 231”
Fig. 17. Half hour average values of relative humidity, solar shortwavelength irradiance (300–340 nm) and vertical wind variance.The yellow area marks the periods when bursts of nucleation modeparticles were observed.
nucleation start times are coinciding with the onset of verticalwind variance and so the start of mixing different air massesfrom the residual and the surface layer.
In the end we will also include the temperature in our con-siderations. Although the solar radiation reaches higher val-ues during the first three days of August compared to the restof the campaign the diurnal mean values of the temperatureespecially on the 1st and 2nd of August are about 5 K lowerthan on the other days. Without analysing any weather mapswe can conclude that relatively clean and cold air from north-west passed over the station during this period (see Figs. 2,6 and 10). According to Nilsson et al. (2001a) nucleationin Hyytiala occurs in arctic and to some extent in polar airmasses, with a preference for air in transition from marineto continental air masses. The results from Nilsson et al.
www.atmos-chem-phys.org/acp/4/657/ Atmos. Chem. Phys., 4, 657–678, 2004

674 M. Boy et al.: Overview of the field measurement campaign in Hyytiala
Table 8. Characteristic values from relative humidity, vertical wind variance, temperature and short wavelength irradiance (300–340 nm).
Date RH (%) Vert. wind variance (m s−1) Irradiance (W m−2) Temp. (◦C)Mean Min. Mean Max. Mean Max. Mean Max.
1 Aug. 55.3 48.3 1.01 1.24 5.0 9.3 13.4 14.72 Aug. 48.6 38.8 0.97 1.23 5.0 9.4 11.8 13.73 Aug. 44.8 33.3 0.84 1.11 5.9 9.2 14.7 18.04 Aug. 61.9 48.1 0.95 1.37 3.8 7.6 15.4 17.65 Aug. 77.5 54.0 0.64 1.00 4.1 8.6 17.9 20.86 Aug. 76.1 56.9 0.50 0.83 3.2 7.5 15.5 17.87 Aug. 61.1 45.4 0.64 0.90 4.2 8.1 16.6 18.88 Aug. 57.8 43.9 0.73 1.01 4.9 8.7 16.9 19.19 Aug. 73.0 52.7 0.78 1.03 3.1 7.0 17.3 20.410 Aug. 58.9 44.8 0.88 1.19 4.7 8.8 17.3 19.111 Aug. 81.6 56.3 0.49 0.79 2.2 6.9 13.8 17.812 Aug. 75.8 60.9 0.60 0.85 3.2 7.8 14.3 16.213 Aug. 76.8 58.3 0.56 0.89 3.3 8.0 15.2 17.914 Aug. 63.8 52.2 0.59 0.90 4.8 8.1 15.8 18.515 Aug. 62.7 48.2 0.65 0.86 4.8 7.8 19.4 22.416 Aug. 73.0 47.9 0.75 1.07 3.9 7.9 19.9 24.0
established during BIOFOR campaign in Hyytiala, Finlandagree completely with the first three events. However theother event days show different meteorological situations.
4 Summary and conclusions
The main results of the OSOA field campaign are describedin Sect. 3. Obviously two different kinds of meteorologicalsituations appeared during this period. In the beginning ofAugust (1 to 3) clean cold air masses – nucleation favouringconditions – from northwest passed over the station (low val-ues of NOx, SO2 and CS). During these days clear particleformation events with number concentrations between 600and 1200 particles cm−3 for nucleation mode particles (3–10 nm) were observed. Later in August the dominating windsector was south to east and the above mentioned parametersincreased clearly. Still we observed three days with indica-tions of particle bursts during this period. However, 14 Au-gust is difficult to declare: event or pollution. All parameterscalculated in Sect. 3.1.2 (growth rate, vapour concentration,vapour source and formation rate) are 4 to 5 times higher thanduring other event days and a clear peak in NOx betweenthe formation start and end was measured. Furthermore, theparticle number concentrations of nucleation mode particlesand total particle number (3–500 nm) show the same ascentwith a peak at 1.15 p.m. of 1250 and 11 000 particle cm−3,respectively. These results point more to the conclusion, thatpolluted air masses probably from the station building or thetown of Tampere were transported over the measuring site onthis day.
The analysis of precursor measurements, from Sect. 3.2showed an opposite trend for the sum of terpenes fromthe number concentration of the nucleation mode particles.However, the high variation in the temporal coverage and thelarge scattering of the measurements during single days limitfinal conclusions. Nevertheless, a direct correlation betweenthe concentration of monoterpenes and the ongoing of nucle-ation can be excluded. The same result is valid for the con-centrations of the carboxylic acids, the photo-oxidation prod-ucts from monoterpenes with the lowest saturation vapourpressures (Sects. 3.2.3 and 3.3). In this case, the highestconcentrations of formic and acetic acids were measured be-tween 4 and 13 August, excluding the three clear event daysin the beginning of August. Further, the sum of gas- andparticle-phase concentrations of nor-pinonic or pinonic acidsmeasured during the first eight days in August leads to thesame result. Summarising this paragraph brings the conclu-sion, that at least during the time of the campaign the con-centrations of the supposed precursors and the condensingspecies aren’t limiting factors for the formation of new parti-cles in Hyytiala, Finland. This fact is also supported by com-paring the calculated vapour concentrations of the condens-ing species from Sect. 3.1.2 with the measurements. For thefirst five events we calculated necessary concentrations forthe condensing species between 8–15 107 molecules cm−3
and the measured concentration of e.g. pinonic acid was dur-ing the first 3 event days below detection limit up to 3.6106 molecules cm−3. However, the measured values are re-sults of 12-h-sampling periods and we know that the reactionof OH radicals with monoterpenes is one important produc-tion path way for the carboxylic acids. So the concentrationsof single diacid or mono-acid molecules will be much higher
Atmos. Chem. Phys., 4, 657–678, 2004 www.atmos-chem-phys.org/acp/4/657/

M. Boy et al.: Overview of the field measurement campaign in Hyytiala 675
around noon than the 12-h average values. Including all car-boxylic acids in our considerations gives the conclusion thattheir concentrations would be high enough to fulfil the roleof the condensing species on the thermodynamically stableclusters during the time of particle bursts.
The chemical analyses, discussed in Sects. 3.3 and 3.4of PM2 to PM10 particles done by four institutes indepen-dently with different sampling and analytical methods andthe results of the HTDMA and OTDMA measurements fromSect. 3.1.3 gave the following results:
– the fraction of secondary organic carbon reaches 19%of the particle material on average with maxima duringdaytimes, which obviously indicates local or regionalformation of secondary organic aerosols;
– the concentrations of the identified carboxylic acids(formic, acetic, pinonic, pinic, norpinic, sabinic,limonic and caric acids) reached values of up to62 ng m−3;
– the formic to acetic ratio varied from 1.04 to 1.43, thusindicating predominance of formic acid in the forestedarea of Hyytiala. Formic acid is the main product of iso-prene and monoterpenes oxidation by ozone, whereasacetic acid comes from direct emission from vegetationand partly from biomass burning and/or anthropogenicemissions;
– the calculated carbon preference indexes (CPI) for thewhole range (C16–C34) gave values for the n-alkanes,n-alkanols and n-monocarboxylic acids of 2.69±1.0,8.52±4.16 and 6.86±1.67, respectively, where a CPInumber higher than 3 indicates a major incorporation ofrecent biological constituents into the aerosol sample;
– the average growth factors in ethanol vapour and in wa-ter vapour for 100 nm particles show a diurnal variationwith maxima during daytime;
– the ratio of 50 and 100 nm particles in ethanol and wa-ter vapours (∼1.05 and∼0.85, respectively) during thethree clear events in the beginning of August indicatethat the smaller particles contain a somewhat higherfraction of organic materials and a somewhat lower frac-tion of inorganic salts.
Summarising these points we recognise a clear contributionof organic matter originating from the oxidation of terpenesfrom the local biosphere to the sampled aerosols. However,the fact that current state-of-the-art techniques are not ableto analyse nucleation mode particles separately still leavesa lack of information about the composition of these newlyformed particles and to what extent the species with thelowest volatility (dicarboxylic acids) are responsible for thegrowth of the newly formed clusters.
One question still not answered concerning the formationof SOA is: “Where in the PBL are the particles formed?” Theanalysis of particle flux measurements indicates that duringall formation events the dominating fluxes were downward.However, high uncertainties in this data set as mentioned inSect. 3.1.4 and zero or even small upward fluxes during someevent days prevent direct conclusions. Furthermore the ver-tical profiles of monoterpene concentrations showed as ex-pected for gases with only ground-sources the highest valuesin the surface layer and the vertical profiles of aerosols inthe PBL give some indications that the formation of newlyformed particles is homogenous in the PBL (see Sect. 3.1.5).Summarizing, the question could not be answered in theframe of this project. However, we can assume that the par-ticles are formed throughout PBL and different parameterssuch as temperature, humidity, solar irradiance and concen-tration of different gases like monoterpenes, SO2 or OH withvarying vertical profiles shift the maxima of the particle for-mation rate to different height levels. To gain detailed infor-mation about this mechanism we would need vertical profilesof aerosols throughout the day with size and number distri-butions and simultaneous measurements of concentrations ofdifferent gas species.
Acknowledgements.The OSOA team acknowledges the financialsupport from the European Commission under contract EVK2-CT-1999-00016 (OSOA). We thank the “Fundacao para a Cienciae a Tecnologia” for financial support through the grant PRAXISXXI/BD/18450/98 to A. Carvalho. The Ministry of Educationof Greece (Herakleitos-EPEAEK Program) is acknowledged forfinancial support to M. Apostolaki. We would also like to thank thepersonnel of the SMEAR II station and the Hyytiala Forestry FieldStation for their help and support during the campaign.
Edited by: U. Baltensperger
References
Aalto, P., Hameri, K., Becker, E., Weber, R., Salm, J., Makela,J., Hoell, C., O’Dowd, C. D., Karlsson, H., Hansson, H.-C.,Vakeva, M., Koponen, I., Buzoius, G., and Kulmala, M.: Physi-cal chracterization of aerosol particles during nucleation events,Tellus, 35B, 344–358, 2001.
Abas, M. R. B. and Simoneit, B. R. T.: Composition of extractableorganic matter of air particles from Malaysia: initial study, At-mos. Environ., 15, 2779–2793, 1996.
Alves, C., Carvalho, A., and Pio, C.: Mass balance of organic car-bon fractions in atmospheric aerosols, J. Geophys. Res., 107,(D21), 8345–8354, 2002.
Alves, C., Pio, C., and Duarte, A.: Composition of extractable or-ganic matter of air particles from rural and urban Portuguese ar-eas, Atmos. Environ., 35, 5485–5496, 2001.
Birmili, W., Berresheim, H., Plass-Dulmer, C., Elste, T., Gilge,S., Wiedensohler, A., and Uhrner, U.: The Hohenpeissenbergaerosol formation experiment (HAFEX): a long-term study in-cluding size-resolved aerosol, H2SO4, OH and monoterpenesmeasurements, Atmos. Chem. Phys., 3, 361–378, 2003.
www.atmos-chem-phys.org/acp/4/657/ Atmos. Chem. Phys., 4, 657–678, 2004

676 M. Boy et al.: Overview of the field measurement campaign in Hyytiala
Bonn, B., Schuster, G., and Moortgat G. K.: Influence of watervapour on the process of new particle formation during monoter-pene ozonolysis, J. Phys. Chem. A, 106, (12), 2869–2881, 2002.
Boy, M. and Kulmala, M.: The part of the solar spectrum withthe highest influence of the formation of SOA in the continen-tal boundary layer, Atmos. Chem. Phys., 2, 375–386, 2002a.
Boy, M. and Kulmala, M.: Nucleation events in the continentalboundary layer: Influence of physical and meteorological param-eters, Atmos. Chem. Phys., 2, 1–16, 2002b.
Buzorius, G., Rannik,U., Makela, J. M., Keronen, P., Vesala, T.,and Kulmala, M.: Vertical aerosol fluxes measured by the eddycovariance method and deposition of nucleation mode particlesabove a Scots pine forest in southern Finland, J. Geophys. Res.,105, 19 905–19 916, 2000.
Buzorius, G.: Cut-off sizes and time constants of the CPC TSI 3010operating at 1–3 lpm flow rates, Aerosol Sci. Technol., 35, 577–585, 2001.
Buzorius, G., Rannik,U., Nilsson, D., and Kulmala, M.: Verticalfluxes and micrometeorology during aerosol particle formationevents, Tellus, 53B, 394–405, 2001.
Carvalho, A., Pio, C., and Santos, C.: Water-soluble hydroxylatedorganic compounds in German and Finnish aerosols, Atmos. En-viron., 37, (13), 1775–1783, 2003.
Castro, L., Pio, C., Harrison, R., and Smith, D.: Carbonaceousaerosol in urban and rural European atmospheres: Estimation ofsecondary organic carbon concentrations, Atmos. Environ., 33,2771–2781, 1999.
Chebbi, A. and Carlier, P.: Carboxylic acids in the troposphere,occurrence, sources and sinks: A review, Atmos. Environ., 30,4233–4249, 1996.
Chow, J. C., Watson, J. G., Fujita, E. M., Lu, Z. Q., Lawson, D. R.,and Ashbaugh, L.: Temporal and spatial variations of PM2.5 andPM10 aerosol in Southern California Air Quality Study, Atmos.Environ., 28, 2061–2080, 1994.
Christoffersen, T. S., Hjorth, J., Horie, O., Jensen, N. R., Kotzias,D., Molander, L. L., Neeb, P., Ruppert, L., Winterhalter, R.,Virkkula, A., Wirtz, K., and Larsen, B. R.: Cis-Pinic acid, a pos-sible precursor for organic aerosol formation from ozonolysis ofa-pinene, Atmos. Environ., 32, 1657–1661, 1998.
Dal Maso, M., Kulmala, M., Lehtinen, K. E. J., Makela, J. M.,Aalto, P., and O’Dowd, C. D.: Condensation and coagulationsinks and formation of nucleation mode particles in coastal andboreal forest boundary layers, J. Geophys. Res., 107, (D19),8097–9008, 2002.
Davis, K. J., Lenschow, D. H., and Zimmerman, P. R.: BiogenicNonmethane Hydrocarbon Emissions Estimated from TetheredBalloon Observations, J. Geophys. Res., 99, (D12), 25 587–25 598, 1994.
Greenberg, J., Lee, B., Helmig, D., and Zimmerman, P.: Fully au-tomated gas chromatograph-flame ionization detector system forthe in situ determination of atmospheric non-methane hydrocar-bons at low parts per trillion concentration, J. Chromotography,676, 389–398, 1995.
Greenberg, J. P., Guenther, A., Zimmerman, P., Baugh, W., Geron,C., Davis, K., Helmig, D. and Klinger, L. F.: Tethered balloonmeasurements of biogenic VOCs in the atmospheric boundarylayer, Atmos. Environ., 33, (6), 855–867, 1999.
Guenther, A., Hewitt, C. N., Erickson, D., Fall, R., Geron, C.,Graedel, T., Harley, P., Klinger, L., Lerdau, M., McKay, W. A.,
Pierce, T., Scholes, B., Steinbrecher, R., Tallamraju, R., Taylor,J., and Zimmerman, P.: A global model of natural volatile or-ganic compound emissions, J. Geophys. Res., 100, 8873–8892,1995.
Guenther, A., Baugh, W., Davis, K., Hampton, G., Harley, P.,Klinger, L., Vierling, L., Zimmerman, P., Allwine, E., Dilts, S.,Lamb, B., Westberg, H., Baldocchi, D., Geron, C., and Pierce,T.: Isoprene fluxes measured by enclosure, relaxed eddy accu-mulation, surface-layer gradient, mixed-layer gradient, and massbalance techniques, J. Geophys. Res., 101, 18 555–18 568, 1996.
Hameri, K., Koponen, I. K., Aalto, P., and Kulmal, M.: The par-ticle detection efficiency of the TSI-3007 condensation particlecounter, J. Aerosol Sci., 33, 1463–1469, 2002.
Hameri, K., Vakeva, M., Aalto, P., Kulmala, M., Swietlicki, E.,Zhou, J., Seidl, W., Becker, E., and O’Dowd C.: Hygroscopicand ccn properties of aerosol particles in boreal forests, Tellus,53B, 359–379, 2001.
Hameri, K., Vakeva, M., Hansson, H. C., and Laaksonen, A.: Hy-groscopic growth of ultrafine ammonium sulphate aerosol mea-sured using an ultrafine tandem differential mobility analyser, J.Geophys. Res., 105, 22 231–22 242, 2000.
Helmig, D., Balsley, B., Davis, K., Kuck, L. R., Jensen, M., Bog-nar, J., Smith Jr., T., Arrieta, R. V., Rodrıguez, R., and Birks, J.W.: Vertical profiling and determination of landscape fluxes ofbiogenic nonmethane hydrocarbons within the planetary bound-ary layer in the Peruvian Amazon, J. Geophys. Res., 103, (D19),25 519–25 532, 1998.
Hoffmann, T., Odum, J. R., Bowman, F., Collins, D., Klockow, D.,Flagan, R. C., and Seinfeld, J. H.: Formation of organic aerosolsfrom the oxidation of biogenic hydrocarbons, J. Atmos. Chem.,26, 189–222, 1997.
Hoppel, W., Fitzgerald, J., Frick, G., Caffrey, P., Pasternack, L.,Hegg, D., Gao, S., Leaitch, R., Shantz, N., Cantrell, C., Al-brechcinski, T., Ambrusko, J., and Sullivan, W.: Particle forma-tion and growth from ozonolysis ofα-pinene, J. Geophys. Res.,106, (D21), 27 603–27 618, 2001.
Joutsensaari, J., Vaattovaara, P., Vesterinen, M., Hameri, K., andLaaksonen, A.: A novel tandem differential mobility analyzerwith organic vapour treatment of aerosol particles, Atmos. Chem.Phys., 1, 51–60, 2001.
Kavouras, I., Mihalopoulos, N., and Stephanou, E. G.: Formationof atmospheric particles from organic acids produced by forests,Nature, 395, 683–686, 1998.
Kavouras, I., Mihalopoulos, N., and Stephanou, E. G.: Formationand Gas/Particle Partitioning of Monoterpenes Photo-oxidationProducts over Forests, Geophys. Res. Lett., 26, (1), 55–58,1999a.
Kavouras, I., Mihalopoulos, N., and Stephanou, E. G.: Secondaryaerosol formation vs. primary organic aerosol emission: Insitu evidence for the chemical coupling between monoterpeneacidic photo-oxidation products and new particle formation overforests, Environ. Sci. Technol., 33, 1028–1037, 1999b.
Kawamura, K., Ng, L.-L., and Kaplan, I. R.: Determination of or-ganic acids (C1–C10) in the atmosphere, motor exhausts, andengine oils, Environ. Sci. Technol., 19, 1082–1086, 1985.
Kawamura, K. and Gagosian R. B.: Implication of w-oxocarboxylicacids in the remote marine atmosphere for photo-oxidation ofunsaturated fatty acids, Nature, 325, 330–332, 1987.
Kirchstetter, T. W. and Novakov, T.: Differences in the volatility
Atmos. Chem. Phys., 4, 657–678, 2004 www.atmos-chem-phys.org/acp/4/657/

M. Boy et al.: Overview of the field measurement campaign in Hyytiala 677
of oganic aerosols in unpolluted tropical and polluted continen-tal atmospheres, J. Geophys. Res., 105, (D21), 26 547–26 554,2000.
Kirchstetter, T. W., Corrigan, C. E., and Novakov, T.: Labora-tory and field investigation of the adsorption of gaseous organiccompounds onto quartz filters, Atmos. Environ., 35, 1663–1671,2001.
Koch, S., Winterhalter, R., Uherek, E., Kolloff, A., Neeb, P.,and Moortgat, G.: Formation of new particles in the gas-phaseozonolysis of monoterpenes, Atmos. Environ., 32, 4031–4042,2000.
Korhonen, P., Kulmala, M., Laaksonen, A., Viisanen, Y., McGraw,R., and Seinfeld, J. H.: Ternary nucleation of H2SO4, NH3 andH2O in the atmosphere, J. Geophys. Res., 104, 26 349–26 353,1999.
Kulmala, M., Pirjola, L., and Makela, J. M.: Stable sulphate clustersas a source of new atmospheric particles, Nature, 404, 66–69,2000.
Kulmala, M., Hameri, K. K., Aalto, P., Makela, J., Pirjola, L., Nils-son, E. D., Buzorius, G., Rannik,U., Dal Maso, M., Seidl, W.,Hoffmann, T., Jansson, R., Hansson, H.-C., O‘Dowd, C., andViisane, Y.: Overview of the international project on biogenicaerosol formation in the boreal forest (BIOFOR), Tellus, 53B,324–343, 2001a.
Kulmala, M., Dal Maso, M., Makela, J. M., Pirjola, L., Vakeva, M.,Aalto, P., Miikkulainen, P., Hameri, K., and O’Dowd, C.: On theformation, growth and composition of nucleation mode particles,Tellus, 53B, 479–490, 2001b.
Lawrence, J. E. and Koutrakis, P.: Measurement of atmosphericformic and acetic acids: Methods evaluation and results fromfield studies, Environ. Sci. Technol., 28, 957–964, 1994.
Lawrence, J. and Koutrakis, P.: Measurement and speciation of gasand particulate phase organic acidity in an urban environment, I.Analytical, J. Geophys. Res., 101, 9159–9163, 1996.
Mihalopoulos, N., Stephanou, E. G., Kanakidou, M., Pilitzidis, S.,and Bousquet, P.: Tropospheric aerosol ionic composition in theEastern Mediterranean region, Tellus, 49B, 314–326, 1997.
Nilsson, E. D., Paatero, J., and Boy, M.: Effects of air masses andsynoptic weather on aerosol formation in the continental bound-ary layer, Tellus, 53B, 462–478, 2001a.
Nilsson, E. D., Rannik,U., Kulmala, M., Buzorius, G., andO’Dowd, C. D.: Effects of continental boundary layer evolution,convection, turbulence and entrainment, on aerosol formation,Tellus, 53B, 441–461, 2001b.
Novakov, T., Hegg, D. A., and Hobbs, P. V.: Airborne measure-ments of carbonaceous aerosols on the East Coast of the UnitedStates, J. Geophys. Res., 102, 30 023–30 030, 1997.
Petaja, T., Aalto, P., and Hameri, K.: Hygroscopicity of tolueneoxidation products, Abstracts of the Sixth International AerosolConference in Taipei, 851–852, 2002.
Peters, K. and Eiden, E.: Modelling of the dry deposition velocity ofaerosol particles to a spruce forest, Atmos. Environ., 26A, 2555–2564, 1992.
Pio, C., Castro, L., and Ramos, M.: Differentiated determination oforganic and elemental carbon in atmospheric aerosol particles bya Thermal-optical method, edited by Angeletti, G. and Restelli,G., Proc. Sixth European Symp. on Physico-chemical Behaviourof Atmospheric Pollutants, Report EUR 15609/2 EN, 706–711,1994.
Rinne, J., Hakola, H., Laurila, T., and Rannik,U.: Canopy scalemonoterpene emissions of Pinus sylvestris dominated forests,Atmos. Environ., 34, 1099–1107, 2000.
Rompp, A. and Moortgat, G.: Analysis of Oxygenated Compoundsin Ambient Aerosol by LC-MS-TOF, Proceedings of EURO-TRAC 2002 Symposium, 2002.
Rogge, W. F., Hildemann, L. M., Mazurek, M. A., Cass, G. R.,and Simoneit, B. R. T.: Sources of fine organic aerosol, 1. Char-broilers and meat cooking operations, Environ. Sci. Technol., 25,1112–1125, 1991.
Simoneit, B. R. T.: Organic matter of the troposphere – V: Applica-tion of molecular analysis to biogenic emissions into the tropo-sphere for source reconciliations, J. Atmos. Chem., 8, 251–275,1989.
Simoneit, B. R. T.: Biomass burning – a review of organic tracersfor smoke from incomplete combustion, Applied Geochemistry,17, 129–162, 2002.
Simoneit, B. R. T., Cox, R. E., and Standley, L. J.: Organic matterof the troposphere-IV, Lipids in Harmattan aerosols of Nigeria,Atmos. Environ., 22, 983–1004, 1988.
Simoneit, B., Schauer, J., Nolte, C., Oros, D., Elias, V., Fraser, M.,Rogge, W., and Cass, G.: Levoglucosan, a tracer for cellulose inbiomass burning and atmospheric particles, Atmos. Environ., 33,173–182, 1999.
Standley, L. and Simoneit, B. R. T.: Characterization of extractableplant wax, resin, and thermally maturated components in smokeparticles from prescribed burns, Environ. Sci. and Technol., 21,163–169, 1987.
Standley, L. and Simoneit, B. R. T.: Resin diterpenoids as tracers forbiomass combustion aerosols, J. Atmos. Chem., 18, 1–15, 1994.
Stephanou, E. and Stratigakis, N.: Determination of anthro-pogenic and biogenic organic compounds on airborne particles:flash chromatographic fractionation and capillary gas chromato-graphic analysis, J. Chromatogr. A, 644, 141–151, 1993.
Sirju, A.-P. and Shepson, P. B.: Laboratory and field investigation ofthe DNPH cartridge technique for measurement of atmosphericcarbonyl compounds, Environ. Sci. Technol., 29, 384–392, 1995.
Stratman, F., Siebert, H., Spindler, G., Wehner, B., Althausen, D.,Heintzenberg, J., Hellmuth, O., Rinke, R., Schmieder, U., Sei-del, C., Tuch, T., Uhrner, U., Wiedensohler, A., Wandinger, U.,Wendisch, M., Schell, D., and Stohl, A.: New-particle forma-tion events in a continental boundary layer: First results fromthe SATURN experiment, Atmos. Chem. Phys., 3, 1445–1459,2003.
Talbot, R. W., Beecher, K. M., Harris, R. C., and Coferr, W. R. IIIJr.: Atmospheric chemistry of formic and acetic acids at a mid-latitude temperate site, J. Geophys. Res., 93, 1638–1652, 1988.
Virkkula, A., Van Dingenen, R., Raes, F., and Hjort, J.: Hygro-scopic properties of aerosol formed by oxidation of limonene,alpha-pinene, and beta-pinene, J. Geophys. Res., 104, 3569–3579, 1999.
Warscheid, B. and Hoffmann, T.: Direct analysis of highly oxidisedorganic aerosol constituents by on-line ion trap mass spectrome-try in the negative ion mode, Rapid. Commun. Mass Spectrom.,16, 496–504, 2002.
Winklmayr, W., Reischl, G., Lindner, A., and Berner, A.: A newelectromobility spectrometer for the measurement of aerosol sizedistributions in the size range from 1 to 1000 nm, J. Aerosol Sci.,22, 289–296, 1991.
www.atmos-chem-phys.org/acp/4/657/ Atmos. Chem. Phys., 4, 657–678, 2004

678 M. Boy et al.: Overview of the field measurement campaign in Hyytiala
Winterhalter, R., Neeb, P., Grossmann, D., Kolloff, A., Horie, O.,and Moortgat, G.: Products and mechanism of the gas phase re-action of ozone with b-pinene, J. Atmos. Chem., 35, 165–197,2000.
Yokouchi, Y. and Ambe, Y.: Aerosols formed from the chemicalreaction of monoterpenes and ozone, Atmos. Environ., 19, 1271–1276, 1985.
Yokouchi, Y. and Ambe, Y.: Characterization of polar organicsin airborne particulate matter, Atmos. Environ., 20, 1727–1734,1986.
Zervas, E., Montagne, X., and Lahaye, J.: Collection and analysis oforganic acids in exhaust gas, Comparison of different methods,Atmos. Environ., 33, 4953–4962, 1999.
Atmos. Chem. Phys., 4, 657–678, 2004 www.atmos-chem-phys.org/acp/4/657/