OVERVIEW OF THE FEDERAL TAX SYSTEM AND ...3) estate, gift, and generationskipping taxes, and (4)...
65
OVERVIEW OF THE FEDERAL TAX SYSTEM AND POLICY CONSIDERATIONS RELATED TO TAX REFORM Scheduled for a Public Hearing Before the SENATE COMMITTEE ON FINANCE on July 18, 2017 Prepared by the Staff of the JOINT COMMITTEE ON TAXATION July 14, 2017 JCX-36-17
Transcript of OVERVIEW OF THE FEDERAL TAX SYSTEM AND ...3) estate, gift, and generationskipping taxes, and (4)...

OVERVIEW OF THE FEDERAL TAX SYSTEM AND POLICY CONSIDERATIONS RELATED TO TAX REFORM
Scheduled for a Public Hearing Before the
SENATE COMMITTEE ON FINANCE on July 18, 2017
Prepared by the Staff of the
JOINT COMMITTEE ON TAXATION
July 14, 2017 JCX-36-17

i
CONTENTS
Page
INTRODUCTION .......................................................................................................................... 1
I. SUMMARY OF PRESENT LAW FEDERAL TAX SYSTEM ........................................... 2
A. Individual Income Tax ..................................................................................................... 2
B. Corporate Income Tax .................................................................................................... 10
C. Taxation of Cross-Border Transactions ......................................................................... 16
D. Tax-Favored Retirement Savings ................................................................................... 18
E. Estate, Gift, and Generation-Skipping Transfer Taxes .................................................. 21
F. Social Insurance Taxes ................................................................................................... 22
G. Major Excise Taxes ........................................................................................................ 24
II. EVALUATING TAX SYSTEMS ....................................................................................... 26
A. Introduction .................................................................................................................... 26
B. Efficiency ....................................................................................................................... 27
C. Fairness........................................................................................................................... 38
D. Simplicity, Administration, and Compliance ................................................................. 45
APPENDIX: FIGURES AND TABLES ..................................................................................... 48

1
INTRODUCTION
The Senate Committee on Finance has scheduled a public hearing on July 18, 2017, entitled “Comprehensive Tax Reform: Prospects and Challenges.” This document,1 prepared by the staff of the Joint Committee on Taxation, provides discussion of the present-law Federal tax system and considerations for evaluating tax systems. Further relevant data is summarized in figures and tables in the Appendix.
Part I of this document summarizes the four main elements of the current Federal tax system: (1) income taxes on individuals and corporations; (2) payroll taxes on wages (and corresponding taxes on self-employment income) to finance certain social insurance programs; (3) estate, gift, and generation-skipping taxes, and (4) excise taxes on selected goods and services. In addition, the current taxation of cross-border transactions and the tax-favored treatment of retirement savings are highlighted.
Part II discusses how tax systems can be evaluated using the concepts of efficiency, fairness, and simplicity. Efficiency is a measure of how well resources are used and allocated in an economy. Efficiency may be altered by taxes that promote or discourage optimal behavior. Fairness can be measured by the degree to which similarly situated individuals are treated similarly or by the degree to which the capacity of individuals to bear tax burdens relates to individual tax burdens. Simplicity may affect how well a tax system functions. While a simple tax system may allow for easy compliance by taxpayers and administration by the government, a complex tax system may better target taxpayers for efficiency and fairness considerations. The design of a tax system often involves tradeoffs between these three different goals.
1 This document may be cited as follows: Joint Committee on Taxation, Overview of the Federal Tax
System and Policy Considerations Related to Tax Reform (JCX-36-17), July 14, 2017. This document can also be found on the Joint Committee on Taxation website at www.jct.gov.

2
I. SUMMARY OF PRESENT LAW FEDERAL TAX SYSTEM
A. Individual Income Tax
In general
A United States citizen or resident alien generally is subject to the U.S. individual income tax on his or her worldwide taxable income.2 Taxable income equals the taxpayer’s total gross income (after taking into account exclusions) less deductions. Graduated tax rates are then applied to a taxpayer’s taxable income to determine his or her individual income tax liability. A taxpayer may face additional liability if the alternative minimum tax applies. A taxpayer may reduce his or her income tax liability by any applicable tax credits.
Adjusted gross income
Under the Internal Revenue Code of 1986 (the “Code”), gross income means “income from whatever source derived” except for certain items specifically exempt or excluded by statute.3 Sources of income include compensation for services, interest, dividends, capital gains, rents, royalties, alimony and separate maintenance payments, annuities, income from life insurance and endowment contracts (other than certain death benefits), pensions, gross profits from a trade or business, income in respect of a decedent, and income from S corporations, partnerships,4 estates or trusts.5 Statutory exclusions from gross income include death benefits payable under a life insurance contract, interest on certain State and local bonds, the receipt of property by gift or inheritance, as well as employer-provided health insurance, pension contributions, and certain other benefits.
An individual’s adjusted gross income (“AGI”) is determined by subtracting certain “above-the-line” deductions from gross income. These deductions include trade or business
2 Foreign tax credits generally are available against U.S. income tax imposed on foreign source income to
the extent of foreign income taxes paid on that income. A nonresident alien generally is subject to the U.S. individual income tax only on income with a sufficient nexus to the United States. A U.S. citizen or resident who satisfies certain requirements for presence in a foreign country also is allowed a limited exclusion ($102,100 in 2017) for foreign earned income and a limited exclusion of employer-provided housing costs. Sec. 911.
3 Sec. 61.
4 In general, partnerships and S corporations (i.e., corporations subject to the provisions of subchapter S of the Code) are treated as pass-through entities for Federal income tax purposes. Thus, no Federal income tax is imposed at the entity level. Rather, income of such entities is passed through and taxed to the owners at the individual level. A business entity organized as a limited liability company (“LLC”) under applicable State law generally is treated as a partnership for Federal income tax purposes if it has two or more members; a single-member LLC generally is disregarded as an entity separate from its owner for Federal income tax purposes.
5 In general, the accumulated income of estates and trusts is taxed to the entity and the distributed income is taxed to the beneficiaries. A graduated tax rate schedule applies to the taxable income of estates and trusts and the alternative minimum tax may apply. Certain trusts are treated for income tax purposes as if the trust property is owned by grantor; in such cases, the grantor is taxed on the income of the trust.

3
expenses, capital losses, contributions to a qualified retirement plan by a self-employed individual, contributions to certain individual retirement accounts (“IRAs”), certain moving expenses, certain education-related expenses, and alimony payments.6
Taxable income
To determine taxable income, an individual reduces AGI by any personal exemption deductions and either the applicable standard deduction or his or her itemized deductions.7 Personal exemptions generally are allowed for the taxpayer, his or her spouse, and any dependents. For tax year 2017, the amount deductible for each personal exemption is $4,050. This amount is indexed annually for inflation. Additionally, the personal exemption phaseout reduces a taxpayer’s personal exemptions by two percent for each $2,500 ($1,250 for married filing separately), or fraction thereof, by which the taxpayer’s AGI exceeds $261,500 (single), $287,650 (head-of-household), $313,800 (married filing jointly and surviving spouses) and $156,900 (married filing separately).8 These threshold amounts are indexed for inflation.
A taxpayer also may reduce AGI by the amount of the applicable standard deduction. The basic standard deduction varies depending on a taxpayer’s filing status. For 2017, the amount of the standard deduction is $6,350 for single individuals and married individuals filing separately, $9,350 for heads of households, and $12,700 for married individuals filing jointly and surviving spouses. An additional standard deduction is allowed with respect to any individual who is elderly (i.e., above age 64) or blind.9 The amounts of the basic standard deduction and the additional standard deductions are indexed annually for inflation.
The combination of personal exemptions and the standard deduction means that taxpayers may have the first several thousand dollars of income untaxed by the income tax. For example, a single person earning under the personal exemption phaseout amount would have the first $10,400 of income would not be included in taxable income. This amount would be $20,800 for a married couple filing jointly and $28,900 if that married couple had two dependent children.
6 Sec. 62.
7 Sec. 63.
8 A taxpayer thus has all personal exemptions completely phased out at incomes of $384,000 (single), $410,150 (head-of-household), $436,300 (married filing jointly) and $218,150 (married filing separately).
9 For 2017, the additional amount is $1,250 for married taxpayers (for each spouse meeting the applicable criterion) and surviving spouses. The additional amount for single individuals and heads of households is $1,550. If an individual is both elderly and blind, the individual is entitled to two additional standard deductions, for a total additional amount (for 2017) of $2,500 or $3,100, as applicable.

4
Table 1.─2017 Standard Deduction and Personal Exemption Values
Standard Deduction
Married Filing Jointly $12,700
Head of Household $9,350
Single and Married Filing Separately $6,350
Personal Exemptions $4,050
In lieu of taking the applicable standard deductions, an individual may elect to itemize deductions. The deductions that may be itemized include State and local income taxes, real property and certain personal property taxes, home mortgage interest, charitable contributions, certain investment interest, medical expenses (in excess of 10 percent of AGI, or 7.5 percent in the case of taxpayers above age 64), casualty and theft losses (in excess of 10 percent of AGI and in excess of $100 per loss), and certain miscellaneous expenses (in excess of two percent of AGI).10 Additionally, the total amount of itemized deductions allowed is reduced by $0.03 for each dollar of AGI in excess of $261,500 (single), $287,650 (head-of-household), $313,800 (married filing jointly and surviving spouses) and $156,900 (married filing separately).11 These threshold amounts are indexed for inflation.
The Joint Committee staff estimates that for the 2017 tax year approximately 104.8 million taxpayers will claim the standard deduction while 48.7 million taxpayers will elect to itemize deductions.
Tax liability
In general
A taxpayer’s net income tax is the income tax reduced by the credits allowed against the tax. A taxpayer’s income tax is the greater of (1) the regular income tax or (2) the tentative minimum tax. The amount of income subject to tax and credits allowed are determined differently for purposes of the regular tax and the tentative minimum tax, and separate rate schedules apply. Lower rates apply for long-term capital gains and certain dividends; those rates apply for both the regular tax and the alternative minimum tax.
10 Sec. 67.
11 Sec. 68. This rule is sometimes referred to as the “Pease limitation.” A taxpayer may not lose more than 80 percent of his or her deductions as a result of this provision.

5
Regular tax liability
To determine regular tax liability, a taxpayer generally must apply the tax rate schedules (or the tax tables) to his or her regular taxable income. The rate schedules are broken into several ranges of income, known as income brackets, with the marginal tax rate increasing as a taxpayer’s income increases. Separate rate schedules apply based on an individual’s filing status. For 2017, the regular individual income tax rate schedules are as follows:
Table 2.─Federal Individual Income Tax Rates for 2017
If taxable income is: Then income tax equals:
Single Individuals
Not over $9,325 10% of the taxable income
Over $9,325 but not over $37,950 $932.50 plus 15% of the excess over $9,325
Over $37,950 but not over $91,900 $5,226.25 plus 25% of the excess over $37,950
Over $91,900 but not over $191,650 $18,713.75 plus 28% of the excess over $91,900
Over $191,650 but not over $416,700 $46,643.75 plus 33% of the excess over $191,650
Over $416,700 but not over $418,400 $120,910.25 plus 35% of the excess over $416,700
Over $418,400 $121,505.25 plus 39.6% of the excess over $418,400
Heads of Households
Not over $13,350 10% of the taxable income
Over $13,350 but not over $50,800 $1,335 plus 15% of the excess over $13,350
Over $50,800 but not over $131,200 $6,952.50 plus 25% of the excess over $50,800
Over $131,200 but not over $212,500 $27,052.50 plus 28% of the excess over $131,200 Over $212,500 but not over $416,700 $49,816.50 plus 33% of the excess over $212,500 Over $416,700 but not over $444,550 $117,202.50 plus 35% of the excess over $416,700
Over $444,550 $126,950 plus 39.6% of the excess over $444,550
Married Individuals Filing Joint Returns and Surviving Spouses
Not over $18,650 10% of the taxable income Over $18,650 but not over $75,900 $1,865 plus 15% of the excess over $18,650 Over $75,900 but not over $153,100 $10,452.50 plus 25% of the excess over $75,900 Over $153,100 but not over $233,350 $29,752.50 plus 28% of the excess over $153,100 Over $233,350 but not over $416,700 $52,222.50 plus 33% of the excess over $233,350 Over $416,700 but not over $470,700 $112,728 plus 35% of the excess over $416,700
Over $470,700 $131,628 plus 39.6% of the excess over $470,700

6
If taxable income is: Then income tax equals:
Married Individuals Filing Separate Returns
Not over $9,325 10% of the taxable income Over $9,325 but not over $37,950 $932.50 plus 15% of the excess over $9,325 Over $37,950 but not over $76,550 $5,226.25 plus 25% of the excess over $37,950 Over $76,550 but not over $116,675 $14,876.25 plus 28% of the excess over $76,550 Over $116,675 but not over $208,350 $26,111.25 plus 33% of the excess over $116,675 Over $208,350 but not over $235,350 $56,364 plus 35% of the excess over $208,350 Over $235,350 $65,814 plus 39.6% of the excess over $235,350
Special capital gains and dividends rates
In general, gain or loss reflected in the value of an asset is not recognized for income tax purposes until a taxpayer disposes of the asset. On the sale or exchange of a capital asset, any gain generally is included in income. Any net capital gain of an individual is taxed at maximum rates lower than the rates applicable to ordinary income. Net capital gain is the excess of the net long-term capital gain for the taxable year over the net short-term capital loss for the year. Gain or loss is treated as long-term if the asset is held for more than one year.
Capital losses generally are deductible in full against capital gains. In addition, individual taxpayers may deduct capital losses against up to $3,000 of ordinary income in each year. Any remaining unused capital losses may be carried forward indefinitely to another taxable year.
A maximum rate applies to certain capital gains and dividends. Any adjusted net capital gain otherwise taxed at a 10- or 15-percent rate is taxed at a zero-percent rate. Adjusted net capital gain otherwise taxed at rates greater than 15 percent but less than 39.6 percent is taxed at a 15-percent rate. In addition, the maximum rate of tax on the adjusted net capital gain of an individual is 20 percent on any amount of gain that otherwise would be taxed at a 39.6-percent rate. These rates apply for purposes of both the regular tax and the alternative minimum tax. Qualified dividend income is generally taxed at the same rate as net capital gains.12
Net investment income
An additional tax is imposed on net investment income in the case of an individual, estate, or trust.13 In the case of an individual, the tax is 3.8 percent of the lesser of net
12 Qualified dividend income means dividends subject to certain source and holding period requirements,
and is included in adjusted net capital gain. Sec. 1(h).
13 Sec. 1411.

7
investment income or the excess of modified adjusted gross income14 over the threshold amount. The threshold amount is $250,000 in the case of a joint return or surviving spouse, $125,000 in the case of a married individual filing a separate return, and $200,000 in any other case.15 Thus, the maximum rate on net capital gains and qualified dividends is 23.8 percent while the maximum rate on other investment income, including interest, annuities, royalties, and rents, is 43.4 percent.
Net investment income is the excess of (1) the sum of (a) gross income from interest, dividends, annuities, royalties, and rents, other than income which is derived in the ordinary course of a trade or business that is not a passive activity with respect to the taxpayer or a trade or business of trading in financial instruments or commodities, and (b) net gain (to the extent taken into account in computing taxable income) attributable to the disposition of property other than property held in the active conduct of a trade or business that is not in the trade or business of trading in financial instruments or commodities, over (2) deductions properly allocable to such gross income or net gain.
Credits against tax
An individual may reduce his or her tax liability by any available tax credits.16 Certain credits are “refundable;” that is, if the amount of these credits exceeds tax liability (net of other credits) an overpayment is created which may generate a refund. Two major refundable credits are the child tax credit and the earned income credit.17
An individual may claim a tax credit for each qualifying child under age 17. The amount of the credit per child is $1,000.18 The aggregate amount of child credits that may be claimed is phased out for individuals with income over certain threshold amounts. Specifically, the otherwise allowable child tax credit is reduced by $50 for each $1,000, or fraction thereof, of modified adjusted gross income over $75,000 for single individuals or heads of households, $110,000 for married individuals filing jointly, and $55,000 for married individuals filing separately. To the extent the child credit exceeds the taxpayer’s tax liability, the taxpayer is
14 Modified adjusted gross income is adjusted gross income increased by the amount excluded from
income as foreign earned income under section 911(a)(1) (net of the deductions and exclusions disallowed with respect to the foreign earned income).
15 These thresholds are not indexed for inflation.
16 These personal credits include the child tax credit, earned income tax credit, child and dependent care credit, adoption credit, premium tax credit, health coverage tax credit, saver’s credit, foreign tax credit, lifetime learning credit, American opportunity tax credit, residential energy efficient property credit (for qualifying solar energy property), and credits for the elderly or disabled.
17 Other refundable credits include the American opportunity tax credit, the premium tax credit, and the health coverage tax credit.
18 Sec. 24.

8
eligible for a refundable credit (the additional child tax credit) equal to 15 percent of earned income in excess of $3,000,19 not to exceed the maximum credit per child of $1,000.
A refundable earned income tax credit (“EITC”) is available to low-income workers who satisfy certain requirements.20 The amount of the EITC varies depending on the taxpayer’s earned income and whether the taxpayer has more than two, two, one, or no qualifying children. In 2017, the maximum EITC for taxpayers is $6,318 with more than two qualifying children, $5,616 with two qualifying children, $3,400 with one qualifying child, and $510 with no qualifying children. The credit amount begins to phase out at an income level of $23,930 for joint-filers with children, $18,340 for other taxpayers with children, $13,930 for joint-filers with no qualifying children, and $8,340 for other taxpayers with no qualifying children. The phase-out percentages are 21.06 for two or more qualifying children, 15.98 for taxpayers with one qualifying child, and 7.65 for no qualifying children.
Tax credits are also allowed for certain business expenditures, certain foreign income taxes paid or accrued, certain energy conservation expenditures, certain education expenditures, certain child care expenditures, and for certain elderly or disabled individuals. The personal credits allowed against the regular tax are generally allowed against the alternative minimum tax.
Alternative minimum tax liability
An alternative minimum tax is imposed on an individual, estate, or trust in an amount by which the tentative minimum tax exceeds the regular income tax for the taxable year.21 For 2017, the tentative minimum tax is the sum of (1) 26 percent of so much of the taxable excess as does not exceed $187,800 ($93,900 in the case of married filing separately) and (2) 28 percent of the remaining taxable excess. The taxable excess is so much of the alternative minimum taxable income (“AMTI”) as exceeds the exemption amount. The breakpoint between the 26-percent and 28-percent bracket is indexed for inflation. The maximum tax rates on net capital gain and dividends used in computing the regular tax are used in computing the tentative minimum tax. AMTI is the taxpayer’s taxable income increased by the taxpayer’s tax preferences and adjusted by determining the tax treatment of certain items in a manner that negates the deferral of income resulting from the regular tax treatment of those items.
For tax year 2017, the exemption amount is $84,500 for married individuals filing jointly and surviving spouses, $54,300 for other unmarried individuals, $42,250 for married individuals filing separately, and $24,100 for estates or trusts. The exemption amount is phased out by an amount equal to 25 percent of the amount by which the individual’s AMTI exceeds $160,900 for married individuals filing jointly and surviving spouses, $120,700 for other unmarried
19 Families with three or more children may determine the additional child tax credit by taking the greater
of (1) the earned income formula, or (2) the alternative formula, i.e. the amount by which the taxpayer’s social security taxes exceed the taxpayer’s earned income tax credit.
20 Sec. 32.
21 Sec. 55.

9
individuals, and $80,450 for married individuals filing separately, estates, or trusts. These amounts are indexed annually for inflation.
Among the tax preferences and adjustments included in AMTI are accelerated depreciation on certain property used in a trade or business, circulation expenditures, research and experimental expenditures, certain expenses and allowances related to oil and gas, certain expenses and allowances related to mining exploration and development, certain tax-exempt interest income, and a portion of the gain excluded with respect to the sale or disposition of certain small business stock. Personal exemptions, the standard deduction, and certain itemized deductions, such as State and local taxes and miscellaneous deductions, are not allowed to reduce AMTI.

10
B. Corporate Income Tax
Taxable income
Corporations organized under the laws of any of the 50 States (and the District of Columbia) generally are subject to the U.S. corporate income tax on their worldwide taxable income.22 Under subchapter S of the Code, a qualified small business corporation may elect not to be subject to the corporate income tax (i.e., may make an “S corporation election”). If an S corporation election is made, the income of the corporation flows through to the shareholders and is taxable directly to the shareholders.
The taxable income of a corporation generally is its gross income less allowable deductions. Gross income generally is income derived from any source, including gross profit from the sale of goods and services to customers, rents, royalties, interest (other than interest from certain indebtedness issued by State and local governments), dividends, gains from the sale of business and investment assets, and other income.
Allowable deductions include ordinary and necessary business expenditures, such as salaries, wages, contributions to profit-sharing and pension plans and other employee benefit programs, repairs, bad debts, taxes (other than Federal income taxes), contributions to charitable organizations (subject to an income limitation), advertising, interest expense, certain losses, selling expenses, and other expenses. Expenditures that produce benefits in future taxable years to a taxpayer’s business or income-producing activities (such as the purchase of plant and equipment) generally are capitalized and recovered over time through depreciation, amortization or depletion allowances. In some instances taxpayers can recover their costs more quickly than under the general rules. An additional first-year depreciation deduction is allowed equal to 50 percent of the adjusted basis of qualified property.23 Also, a taxpayer may elect to deduct (or “expense”) up to $500,000 of the cost of certain qualifying property placed in service during the taxable year.24
A net operating loss incurred in one taxable year may be carried back two years or carried forward 20 years. Deductions are also allowed for certain amounts despite the lack of a direct expenditure by the taxpayer. For example, a deduction is allowed for all or a portion of the amount of dividends received by a corporation from another corporation (provided certain
22 A foreign corporation generally is subject to the U.S. corporate income tax only on income with a
sufficient nexus to the United States.
23 Sec. 168(k). The 50-percent allowance is phased down for property placed in service in taxable years beginning after 2017 (after 2018 for certain longer-lived and transportation property).
24 This amount is reduced (but not below zero) by the amount by which the cost of qualifying property exceeds $2,000,000. Sec. 179.

11
ownership requirements are satisfied). Moreover, a deduction is allowed for a portion of the amount of income attributable to certain manufacturing activities.25
Certain expenditures may not be deducted, such as dividends paid to shareholders, expenses associated with earning tax-exempt income,26 certain entertainment expenditures, certain executive compensation in excess of $1,000,000 per year, a portion of the interest on certain high-yield debt obligations that resemble equity, as well as fines, penalties, bribes, kickbacks and illegal payments.
Tax liability
A corporation’s regular income tax liability generally is determined by applying the following tax rate schedule to its taxable income.
Table 3.–Federal Corporate Income Tax Rates
If taxable income is: Then the income tax rate is:
$0-$50,000 .......................................................... 15 percent of taxable income
$50,001-$75,000 ................................................. 25 percent of taxable income
$75,001-$10,000,000 .......................................... 34 percent of taxable income
Over $10,000,000 ............................................... 35 percent of taxable income
The first two graduated rates described above are phased out for corporations with taxable income between $100,000 and $335,000 (at a marginal rate of 39 percent). As a result, a corporation with taxable income between $335,000 and $10,000,000 is effectively subject to a flat tax rate of 34 percent. Also, the application of the 34-percent rate is gradually phased out for corporations with taxable income between $15,000,000 and $18,333,333 (at a marginal rate of 38 percent), such that a corporation with taxable income of $18,333,333 or more is effectively subject to a flat rate of 35 percent.
In contrast to the treatment of capital gains in the individual income tax, no separate rate structure exists for corporate capital gains. Thus, the maximum rate of tax on the net capital gains of a corporation is 35 percent. A corporation may not deduct the amount of capital losses in excess of capital gains for any taxable year. Disallowed capital losses may be carried back three years or carried forward five years.
25 Deductions of income amounts can be viewed as substitutes for exemption or rate reductions for the
affected income.
26 For example, the carrying costs of tax-exempt State and local obligations and the premiums on certain life insurance policies are not deductible.

12
Corporations are taxed at lower rates on income from certain domestic production activities. This rate reduction is effected by the allowance of a deduction equal to a percentage of qualifying domestic production activities income. The deduction is generally equal to nine percent of the income from manufacturing, construction, and certain other specified activities which results in an effective marginal tax rate of 31.85 percent. 27
Like an individual, a corporation may reduce its tax liability by any applicable tax credits.28 The largest three credits, as measured by total dollar amount claimed by all taxpayers, are the research credit, the low income housing tax credit, and the renewable electricity production credit, which target intangible investment, real property investment, and production respectively.29
The research credit is generally available with respect to incremental increases in qualified research.30 A research tax credit is also available with respect to corporate cash expenses paid for basic research conducted by universities (and certain nonprofit scientific research organizations) above a certain floor.31 Finally, a research credit is available for a taxpayer’s expenditures on research undertaken by an energy research consortium.32
The low-income housing tax credit may be claimed over a 10-year period by owners of certain residential rental property for the cost of rental housing occupied by tenants having incomes below specified levels.33 The amount of the credit for any taxable year in the credit period is the applicable percentage of the qualified basis of each qualified low-income building.
27 With a nine percent deduction, a corporation is taxed at a rate of 35 percent on only 91 percent of
qualifying income, resulting in an effective tax rate of 0.91 * 35, or 31.85 percent. A similar reduction applies to the graduated rates applicable to individuals with qualifying domestic production activities income.
28 Business credits also apply to the business income of individuals.
29 See Joint Committee on Taxation, Estimates of Federal Tax Expenditures For Fiscal Years 2016-2020 (JCX-3-17), January 30, 2017.
30 For general research expenditures, a taxpayer may claim a research credit equal to 20 percent of the amount by which the taxpayer’s qualified research expenses for a taxable year exceed its base amount for that year. Sec. 41(a)(1). An alternative simplified research credit (with a 14 percent rate and a different base amount) may be claimed in lieu of this credit. Sec. 41(c)(5).
31 This 20-percent credit is available with respect to the excess of (1) 100 percent of corporate cash expenses (including grants or contributions) paid for basic research conducted by universities (and certain nonprofit scientific research organizations) over (2) the sum of (a) the greater of two minimum basic research floors plus (b) an amount reflecting any decrease in nonresearch giving to universities by the corporation as compared to such giving during a fixed-base period adjusted for inflation. Sec. 41(a)(2) and (e).
32 This separate credit computation commonly is referred to as the energy research credit. Unlike the other research credits, the energy research credit applies to all qualified expenditures, not just those in excess of a base amount. Sec. 41(1)(3).
33 Sec. 42.

13
The qualified basis of any qualified low-income building for any taxable year equals the applicable fraction of the eligible basis of the building.
An income tax credit is allowed for the production of electricity from qualified energy resources at qualified facilities (the “renewable electricity production credit”). Qualified energy resources comprise wind, closed-loop biomass, open-loop biomass, geothermal energy, solar energy, small irrigation power, municipal solid waste, qualified hydropower production, and marine and hydrokinetic renewable energy. Qualified facilities are, generally, facilities that generate electricity using qualified energy resources. To be eligible for the credit, electricity produced from qualified energy resources at qualified facilities must be sold by the taxpayer to an unrelated person.34
In addition there are credits applicable to businesses including credits for biofuels, investment tax credits (applicable to investment in certain renewable energy property and the rehabilitation of certain real property), the empowerment zone employment credit (applicable to wages paid to certain residents of, or employees in, empowerment zones), the work opportunity credit (applicable to wages paid to individuals from certain targeted groups), and the disabled access credit (applicable to expenditures by certain small businesses to make the businesses accessible to disabled individuals).35 Unused credits generally may be carried back one year and carried forward twenty years.
Foreign tax credits generally are available against U.S. income tax imposed on foreign source income to the extent of foreign income taxes paid on that income. The limitation on the foreign tax credit is applied separately to different categories of income. Credits for foreign tax in excess of the limitation (so-called “excess foreign tax credits” or “excess credits”) in any tax year may be carried back one year or forward ten years.
Affiliated group
Domestic corporations that are affiliated through 80 percent or more corporate ownership may elect to file a consolidated return in lieu of filing separate returns. Corporations filing a consolidated return generally are treated as a single corporation; thus, the losses of one corporation can offset the income (and thus reduce the otherwise applicable tax) of other affiliated corporations.
Minimum tax
A corporation is subject to an alternative minimum tax that is payable, in addition to all other tax liabilities, to the extent that it exceeds the corporation’s regular income tax liability. The tax is imposed at a flat rate of 20 percent on alternative minimum taxable income in excess
34 Sec. 45.
35 Certain of these credits are scheduled to expire in 2017 or later. For more information on expiring provisions of the Code, see Joint Committee on Taxation, List of Expiring Federal Tax Provisions 2016-2026 (JCX-1-17), January 4, 2017.
14
of a $40,000 exemption amount.36 Credits that are allowed to offset a corporation’s regular tax liability generally are not allowed to offset its minimum tax liability. If a corporation pays the alternative minimum tax, the amount of the tax paid is allowed as a credit against the regular tax in future years.
Alternative minimum taxable income is the corporation’s taxable income increased by the corporation’s tax preferences and adjusted by determining the tax treatment of certain items in a manner that negates the deferral of income resulting from the regular tax treatment of those items. Among the preferences and adjustments applicable to the corporate alternative minimum tax are accelerated depreciation on certain property, certain expenses and allowances related to oil and gas, certain expenses and allowances related to mining exploration and development, certain amortization expenses related to pollution control facilities, and certain tax-exempt interest income. In addition, corporate alternative minimum taxable income is increased by 75 percent of the amount by which the corporation’s “adjusted current earnings” exceed its alternative minimum taxable income (determined without regard to this adjustment). Adjusted current earnings generally are determined with reference to the rules that apply in determining a corporation’s earnings and profits.
Treatment of corporate distributions
The taxation of a corporation generally is separate from the taxation of its shareholders. A distribution by a corporation to one of its shareholders generally is taxable as a dividend to the shareholder to the extent of the corporation’s current or accumulated earnings and profits.37 Thus, the amount of a corporate dividend generally is taxed twice: once when the income is earned by the corporation and again when the dividend is distributed to the shareholder.38 Conversely, amounts paid as interest to the debtholders of a corporation generally are subject to only one level of tax (at the recipient level) since the corporation generally is allowed a deduction for the amount of interest expense paid or accrued.
Amounts received by a shareholder in complete liquidation of a corporation generally are treated as full payment in exchange for the shareholder’s stock. A liquidating corporation recognizes gain or loss on the distributed property as if such property were sold to the distributee for its fair market value. However, if a corporation liquidates a subsidiary corporation of which
36 The exemption amount is phased out for corporations with income above a certain threshold, and is
completely phased out for corporations with alternative minimum taxable income of $310,000 or more.
37 A distribution in excess of the earnings and profits of a corporation generally is a tax-free return of capital to the shareholder to the extent of the shareholder’s adjusted basis (generally, cost) in the stock of the corporation; such distribution is a capital gain if in excess of basis. A distribution of property other than cash generally is treated as a taxable sale of such property by the corporation and is taken into account by the shareholder at the property’s fair market value. A distribution of stock of the corporation generally is not a taxable event to either the corporation or the shareholder.
38 This double taxation is mitigated by a reduced tax rate generally applicable to the qualified dividend income of individuals.

15
it has 80 percent or more control, no gain or loss generally is recognized by either the parent corporation or the subsidiary corporation.
Accumulated earnings and personal holding company taxes
Taxes at a rate of 20 percent (the top rate generally applicable to dividend income of individuals) may be imposed on the accumulated earnings or personal holding company income of a corporation. The accumulated earnings tax may be imposed if a corporation retains earnings in excess of reasonable business needs. The personal holding company tax may be imposed on the excessive passive income of a closely held corporation. The accumulated earnings tax and the personal holding company tax, when they apply, in effect impose the shareholder-level tax in addition to the corporate-level tax on accumulated earnings or undistributed personal holding company income.

16
C. Taxation of Cross-Border Transactions
The United States has adopted a Code that combines the worldwide taxation of all U.S. persons (U.S. citizens or resident aliens and domestic corporations)39 on all income, whether derived in the United States or abroad, with territorial-based taxation of U.S.-source income of nonresident aliens and foreign entities, and limited deferral for foreign income earned by subsidiaries of U.S. companies. Under this system (sometimes described as the U.S. hybrid system), the application of the Code differs depending on whether the income arises from outbound investment or inbound investment. Outbound investment refers to the foreign activities of U.S. persons, while inbound investment is investment by foreign persons in U.S. assets or activities.
With respect to outbound activities, income earned directly by a U.S. person, including as a result of a domestic corporation’s conduct of a foreign business itself (by means of direct sales, licensing or branch operations in the foreign jurisdiction) rather than through a separate foreign legal entity, or through a pass-through entity such as a partnership, is taxed on a current basis. However, active foreign business income earned by a domestic parent corporation indirectly through a foreign corporate subsidiary generally is not subject to U.S. tax until the income is distributed as a dividend to the domestic corporation. This taxpayer-favorable result is circumscribed by certain anti-deferral regimes of the Code.
By contrast, nonresident aliens and foreign corporations are generally subject to U.S. tax only on their U.S.-source income. Thus, the source and type of income received by a foreign person generally determines whether there is any U.S. income tax liability, and the mechanism by which it is taxed (either by gross-basis withholding or on a net basis through tax return filing).
Category-by-category rules determine whether income has a U.S. source or a foreign source. For example, compensation for personal services generally is sourced based on where the services are performed, dividends and interest are, with limited exceptions, sourced based on the residence of the taxpayer making the payments, and royalties for the use of property generally are sourced based on where the property is used. These and other source rules are described in more detail below.
To mitigate double taxation of foreign-source income, the United States allows a credit for foreign income taxes paid. As a consequence, even though resident individuals and domestic corporations are subject to U.S. tax on all their income, both U.S. and foreign source, the source of income remains a critical factor to the extent that it determines the amount of credit available for foreign taxes paid. In addition to the statutory relief afforded by the credit, the network of bilateral treaties to which the United States is a party provides a system for elimination of double taxation and ensuring reciprocal treatment of taxpayers from treaty countries.
Present law provides detailed rules for the allocation of deductible expenses between U.S.-source income and foreign-source income. These rules do not, however, affect the timing of
39 Sec. 7701(a)(30) defines U.S. person to include all U.S. citizens and residents as well as domestic
entities such as partnerships, corporations, estates and certain trusts. Whether a noncitizen is a resident is determined under rules in section 7701(b).

17
the expense deduction. A domestic corporation generally is allowed a current deduction for its expenses (such as interest and administrative expenses) that support income that is derived through foreign subsidiaries and on which U.S. tax is deferred. The expense allocation rules apply to a domestic corporation principally for determining the corporation’s foreign tax credit limitation. This limitation is computed by reference to the corporation’s U.S. tax liability on its taxable foreign-source income in each of two principal limitation categories, commonly referred to as the “general basket” and the “passive basket.” Consequently, the expense allocation rules primarily affect taxpayers that may not be able to fully use their foreign tax credits because of the foreign tax credit limitation.
U.S. tax law includes rules intended to prevent reduction of the U.S. tax base, whether through excessive borrowing in the United States, migration of the tax residence of domestic corporations from the United States to foreign jurisdictions through corporate inversion transactions or aggressive intercompany pricing practices with respect to intangible property.
18
D. Tax-Favored Retirement Savings
Tax-favored employer-sponsored retirement plans
Overview
Whether to offer a tax-favored retirement plan is a voluntary choice by an employer, with various factors entering into the decision. The Code provides for multiple types of tax-favored employer-sponsored retirement plans, including qualified retirement plans and annuities (secs. 401(a) and 403(a)), tax-deferred annuities (sec. 403(b)), governmental eligible deferred compensation plans (sec. 457(b)), SIMPLE (savings incentive match plan for employees) IRAs (sec. 408(p)), and simplified employee pensions (“SEPs”) (sec. 408(k)). These plans afford employers flexibility in the design and structure of the retirement plans they adopt, subject to the requirements applicable to each type of plan under the Code and, absent an exemption, under the Employee Retirement Income Security Act of 1974 (“ERISA”).
Qualified retirement plans
Qualified retirement plans (and other tax-favored employer-sponsored retirement plans) are accorded special tax treatment under present law. Most contributions, earnings on contributions, and benefits are not included in gross income until amounts are distributed, even though the arrangement is funded and even if benefits are vested. Under some plans, a participant may choose to have contributions made to the plan, rather than receiving the amount as current compensation. Under Roth arrangements, the participant chooses to contribute on an after-tax basis and earnings generally are not subject to tax when distributed. Distributions generally can be rolled over to another qualified retirement plan for further deferral of income inclusion. In the case of a taxable employer, the employer is entitled to a current deduction (within certain limits) for contributions even though the contributions are not currently included in an employee’s income. Contributions and earnings are held in a tax-exempt trust, which enables the assets to grow on a tax-free basis.
Various requirements apply in order for qualified retirement plans to receive tax-favored treatment; specific requirements vary based on the plan type. Very generally, some of these requirements define participant rights and provide participant protections, such as minimum participation, vesting, exclusive benefit and minimum funding requirements. These requirements generally have parallels under ERISA. Other qualified plan requirements limit tax benefits, such as the limit on compensation taken into account under a plan on which contributions and benefits are based and limits on the annual amount of contributions and benefits. These limitations, along with minimum coverage and nondiscrimination requirements, are intended to ensure that qualified retirement plans achieve the goal of broad-based retirement security for lower-paid employees in addition to higher-paid employees.
Enforcement of the qualified retirement plan requirements depends on the source of the requirements. Failure to meet a tax qualification requirement may mean the loss of tax-favored status; however, in practice, the Internal Revenue Service (“IRS”) rarely disqualifies a plan and instead generally permits plan sponsors to correct errors under the Employee Plans Compliance Resolution System (“EPCRS”). Certain requirements may be enforced through an excise tax.

19
Types of qualified retirement plans
Qualified retirement plans are of two general types: defined benefit plans, under which benefits are determined under a plan formula and paid from general plan assets, rather than individual participant accounts; and defined contribution plans, under which benefits are based on a separate account for each participant, to which are allocated contributions, earnings and losses. Defined benefit plans generally are subject to minimum funding requirements and benefits are guaranteed, within limits, by the Pension Benefit Guaranty Corporation (“PBGC”). Some qualified retirement plans are referred to as hybrid plans because they have features of both a defined benefit plan and a defined contribution plan; for example, cash balance plans are defined benefit plans, but plan benefits are defined by reference to a hypothetical account balance.
Qualified retirement plans are also categorized by the number of employers that maintain the plan and the type of employees covered by the plan. A single-employer plan is a plan maintained by one employer (treating members of controlled groups and affiliated service groups as one employer) and may cover collectively bargained employees (employees covered by a collective bargaining agreement), noncollectively bargained employees, or both. A multiple-employer plan is a single plan in which two or more unrelated employers (not members of the same controlled group or affiliated service group) participate. Some qualification requirements apply to a multiple-employer plan on a plan-wide basis; others apply on an employer-by-employer basis. Multiemployer plans (also known as “Taft-Hartley” plans) are maintained pursuant to one or more collective bargaining agreements with two or more unrelated employers; the collective bargaining agreements require the employers to contribute to the plan.
Individual Retirement Arrangements
There are two basic types of IRAs: traditional IRAs, to which deductible or nondeductible contributions can be made, and Roth IRAs, contributions to which are not deductible. The total contributions made to all IRAs for a year cannot exceed $5,500 (for 2017), plus an additional $1,000 (not indexed) in catch-up contributions for individuals age 50 or older. Certain individuals are not permitted to make deductible contributions to a traditional IRA or to make contributions to a Roth IRA, depending on their income.
Distributions from traditional IRAs are generally includible in income, except to the extent a portion of the distribution is treated as a recovery of the individual’s basis (if any). Qualified distributions from a Roth IRA are excluded from income; other distributions from a Roth IRA are includible in income to the extent of earnings. IRA distributions generally can be rolled over to another IRA or qualified retirement plan; however, a distribution from a Roth IRA generally can be rolled over only to another Roth IRA or a designated Roth account.
SIMPLE IRAs and SEPs are special types of employer-sponsored retirement plans under which the employer makes contributions to IRAs established for each of its employees in accordance with the Code requirements for each type of plan. Deemed IRAs are permitted to be provided in conjunction with a qualified retirement plan, section 403(b) plan, or governmental section 457(b) plan. An employer may also establish a payroll deduction IRA program, under which employees can elect to have amounts withheld from their pay and contributed to an IRA

20
opened by the employee. The Treasury Department has recently established the myRA program, under which individuals, particularly those without access to an employer-sponsored plan, can establish and contribute to a Roth IRA.

21
E. Estate, Gift, and Generation-Skipping Transfer Taxes
The United States generally imposes a gift tax on any transfer of property by gift made by a U.S. citizen or resident, whether made directly or indirectly and whether made in trust or otherwise. Nonresident aliens are subject to the gift tax with respect to transfers of tangible real or personal property where the property is located in the United States at the time of the gift. The gift tax is imposed on the donor and is based on the fair market value of the property transferred. Deductions are allowed for certain gifts to spouses and to charities. Annual gifts of $14,000 (for 2017) or less per donor and donee pair are not treated as taxable gifts and thus are not subject to tax.
An estate tax also is imposed on the taxable estate of any person who was a citizen or resident of the United States at the time of death, and on certain property belonging to a nonresident of the United States that is located in the United States at the time of death. The estate tax is imposed on the estate of the decedent and generally is based on the fair market value of the property passing at death.40 The taxable estate generally equals the worldwide gross estate less certain allowable deductions, including a marital deduction for certain bequests to the surviving spouse of the decedent and a deduction for certain bequests to charities.
The gift and estate taxes are unified such that a single graduated rate schedule and effective exemption amount apply to an individual’s cumulative taxable gifts and bequests. Under present law, this results in an effective estate and gift tax rate of 40 percent and a total amount exempted from gift and estate taxation for an individual of $5.49 million (for 2017).41 Unused exemption as of the death of a spouse generally is available for use by the surviving spouse; this feature of the law sometimes is referred to as exemption portability.
A separate transfer tax is imposed on generation-skipping transfers in addition to any estate or gift tax that is normally imposed on such transfers. This tax generally is imposed on transfers, either directly or through a trust or similar arrangement, to a beneficiary in more than one generation below that of the transferor. For 2017, the generation-skipping transfer tax is imposed at a flat rate of 40 percent on generation-skipping transfers in excess of $5.49 million.
40 In addition to interests in property owned by the decedent at the time of death, the Federal estate tax also
is imposed on: (1) life insurance that was either payable to the decedent’s estate or in which the decedent had an incident of ownership at death; (2) property over which the decedent had a general power of appointment at death; (3) annuities purchased by the decedent or his employer that were payable to the decedent before death; (4) property held by the decedents as joint tenants; (5) property transferred by the decedent before death in which the decedent retained a life estate or over which the decedent had the power to designate who will possess or enjoy the property; (6) property revocably transferred by the decedent before death; and (7) certain transfers taking effect at the death of the decedent.
41 The $5.49 million value for 2017 is the result of inflation indexing required by section 2010(c)(3)(B) of the $5 million exemption amount set forth in section 2010(c)(3)(A) for years after 2011.

22
F. Social Insurance Taxes
In general
Social Security benefits and certain Medicare benefits are financed primarily by payroll taxes on covered wages. The Federal Insurance Contributions Act (“FICA”) imposes tax on employers based on the amount of wages paid to an employee during the year. The tax imposed is composed of two parts: (1) the old age, survivors, and disability insurance (“OASDI”) tax equal to 6.2 percent of covered wages up to the taxable wage base ($127,200 in 2017); and (2) the Medicare hospital insurance (“HI”) tax amount equal to 1.45 percent of covered wages with no wage cap. In addition to the tax on employers, each employee is subject to FICA taxes equal to the amount of tax imposed on the employer. The employee level tax generally must be withheld and remitted to the Federal government by the employer.42
As a parallel to FICA taxes, the Self-Employment Contributions Act (“SECA”) imposes taxes on the net income from self-employment of self-employed individuals. The rate of the OASDI portion of SECA taxes is equal to the combined employee and employer OASDI FICA tax rates and applies to self-employment income up to the FICA taxable wage base. Similarly, the rate of the HI portion is the sum of the combined employer and employee HI rates and there is no cap on the amount of self-employment income to which the rate applies.43
In addition to FICA taxes, employers are subject to a Federal unemployment insurance payroll tax equal to six percent of the total wages of each employee (up to $7,000) on covered employment. Employers are eligible for a Federal credit equal to 5.4 percent for State unemployment taxes, yielding a 0.6 percent effective tax rate. Federal unemployment insurance payroll taxes are used to fund programs maintained by the States for the benefit of unemployed workers.
Additional hospital insurance tax on certain high-income individuals
The employee portion of the HI tax is increased by an additional tax of 0.9 percent on wages received in excess of a specific threshold amount.44 However, unlike the general 1.45 percent HI tax on wages, this additional tax is on the combined wages of the employee and the
42 Instead of FICA taxes, railroad employers and employees are subject, under the Railroad Retirement Tax Act (“RRTA”), to taxes equivalent to the OASDI and HI taxes under FICA. Under RRTA, employers and employees are also subject to an additional tax, referred to as the “tier 2” tax, on compensation up to a certain amount.
43 For purposes of computing net earnings from self-employment, taxpayers are permitted a deduction equal to the product of the taxpayer’s earnings (determined without regard to this deduction) and one-half of the sum of the rates for OASDI (12.4 percent) and HI (2.9 percent), i.e., 7.65 percent of net earnings. This deduction reflects the fact that the FICA rates apply to an employee’s wages, which do not include FICA taxes paid by the employer, whereas a self-employed individual’s net earnings are economically equivalent to an employee’s wages plus the employer share of FICA taxes.
44 Sec. 3101(b), as amended by the Patient Protection and Affordable Care Act (“PPACA”), Pub. L. No. 111-148.

23
employee’s spouse, in the case of a joint return. The threshold amount is $250,000 in the case of married filing jointly, $125,000 in the case of married filing separately, and $200,000 in any other case (unmarried individual, head of household or surviving spouse).45
The same additional HI tax applies to the HI portion of SECA tax on self-employment income in excess of the threshold amount. Thus, an additional tax of 0.9 percent is imposed on every self-employed individual on self-employment income in excess of the threshold amount.46
45 These threshold amounts are not indexed for inflation.
46 Sec. 1402(b).
24
G. Excise Taxes
The Federal tax system imposes excise taxes on selected goods and services. Generally, excise taxes are taxes imposed on a per unit or ad valorem (i.e., percentage of price) basis on the production, importation, or sale of a specific good or service. Among the goods and services subject to U.S. excise taxes are motor fuels, alcoholic beverages, tobacco products, firearms, air and ship transportation, certain environmentally hazardous products (e.g., the tax on ozone depleting chemicals, and a tax on crude oil and certain petroleum products to fund the Oil Spill Liability Trust Fund), coal, certain telephone communications (e.g. local service), certain wagers, indoor tanning services, and vehicles lacking in fuel efficiency.47 Additionally, an annual fee is imposed on health insurers and on certain manufacturers and importers of branded prescription drugs. The largest excise taxes in terms of revenue are those for gasoline motor fuel ($26.1 billion collected in fiscal year 2016),48 diesel motor fuel ($10.3 billion),49 and domestic air tickets ($9.9 billion).50 In fiscal year 2015, the latest fiscal year for which data is publicly available, $13.6 billion was collected on the excise tax on domestic cigarettes.51
Revenues from certain Federal excise taxes are dedicated to trust funds (e.g., the Highway Trust Fund) for designated expenditure programs, and revenues from other excise taxes (e.g., alcoholic beverages) go to the General Fund for general purpose expenditures.
47 For a description of the various Federal excise taxes, see Joint Committee on Taxation, Present Law and
Background Information on Federal Excise Taxes (JCX-99-15), July 13, 2015.
48 U.S. Department of Treasury, “FY 2016 Highway Consolidated Reports,” September 2016, pp. 12, available at ftp://ftp.publicdebt.treas.gov/dfi/tfmb/dfihw0916.pdf.
49 Ibid.
50 U.S. Department of Treasury, “FY 2016 Airport and Airways Reports,” September 2016, pp. 6, available at ftp://ftp.publicdebt.treas.gov/dfi/tfmb/dfiaa0916.pdf.
51 Internal Revenue Service, Statistics of Income Bulletin, Historical Table 20, “Federal Excise Taxes Reported to or Collected By the Internal Revenue Service, Alcohol and Tobacco Tax and Trade Bureau, and Customs Service, By Type of Excise Tax, Fiscal Years 1999-2015,” http://www.irs.gov/pub/irs-soi/histab20.xls (2016).

25
Table 4.─2017 Federal Excise Tax Rates for Selected Taxed Products or Services
Gasoline Motor Fuel 18.3 cents per gallon52
Diesel Motor Fuel 24.3 cents per gallon53
Cigarettes $50.33 per thousand small cigarettes ($1.01 per standard pack);
$105.69 per thousand large cigarettes.
Domestic Air Tickets 7.5 percent of fare, plus $4.10 (2017) per domestic flight segment generally.
52 This rate does not include the additional 0.1 cent per gallon to fund the Leaking Underground Storage
Tank Trust Fund.
53 This rate does not include the additional 0.1 cent per gallon to fund the Leaking Underground Storage Tank Trust Fund.

26
II. EVALUATING TAX SYSTEMS
A. Introduction
The primary purpose of a tax system is to raise revenue to fund government expenditures. Analysts generally judge a tax system—as a way of raising a given amount of revenue—in terms of how well the tax system answers three different questions.
• First, does the tax system promote or hinder economic efficiency? That is, to what extent does the tax system distort taxpayer behavior? Does the tax system create a bias against the domestic production of goods and services? To what extent does it promote economic growth?54
• Second, is the tax system fair? Does the tax system treat similarly situated individuals similarly? Does the tax system account for individuals’ different capacities to bear the burden of taxation?55
• Third, is the tax system simple and administrable? Is it costly for taxpayers to determine their tax liability and file their taxes?56 Can the tax system be easily administered by the government, and can it induce compliance by all taxpayers? Is enforcement costly? Can some individuals successfully avoid their legal liabilities?57
The design of a tax system involves tradeoffs between these different goals. Measures designed to ensure compliance may increase the complexity of taxation for individual filers. Measures designed to promote simplicity may create distortions in investment decisions. Measures designed to promote growth may alter the distribution of the tax burden in a direction not desired.
54 For a discussion, see Joint Committee on Taxation, Economic Growth and Tax Policy (JCX-19-17),
May 16, 2017.
55 For a discussion, see Joint Committee on Taxation, Fairness and Tax Policy (JCX-48-15), February 27, 2015.
56 For a discussion, see Joint Committee on Taxation, Complexity in the Tax System (JCX-49-15), March 6, 2015.
57 Ibid.

27
B. Efficiency
Introduction
In general, any system of raising revenue alters the prices of goods and services, or the supply of labor or capital, and potentially distorts economic decision-making. These distortions generally lead to economic inefficiencies to the extent that the tax system is not correcting for market failures.58 In analyzing tax systems, economists often emphasize the importance of marginal tax rates because, they argue, marginal tax rates affect incentives for taxpayers to work, to save, or to take advantage of various tax preferences.59 These incentives may distort taxpayer choice, which in turn may promote an inefficient allocation of society’s labor and capital resources. A less efficient allocation of labor and capital resources leaves society with a lower level of output of goods and services than it would enjoy in the absence of the distortions caused by the tax system.
Tax rate levels and economic efficiency
Overview
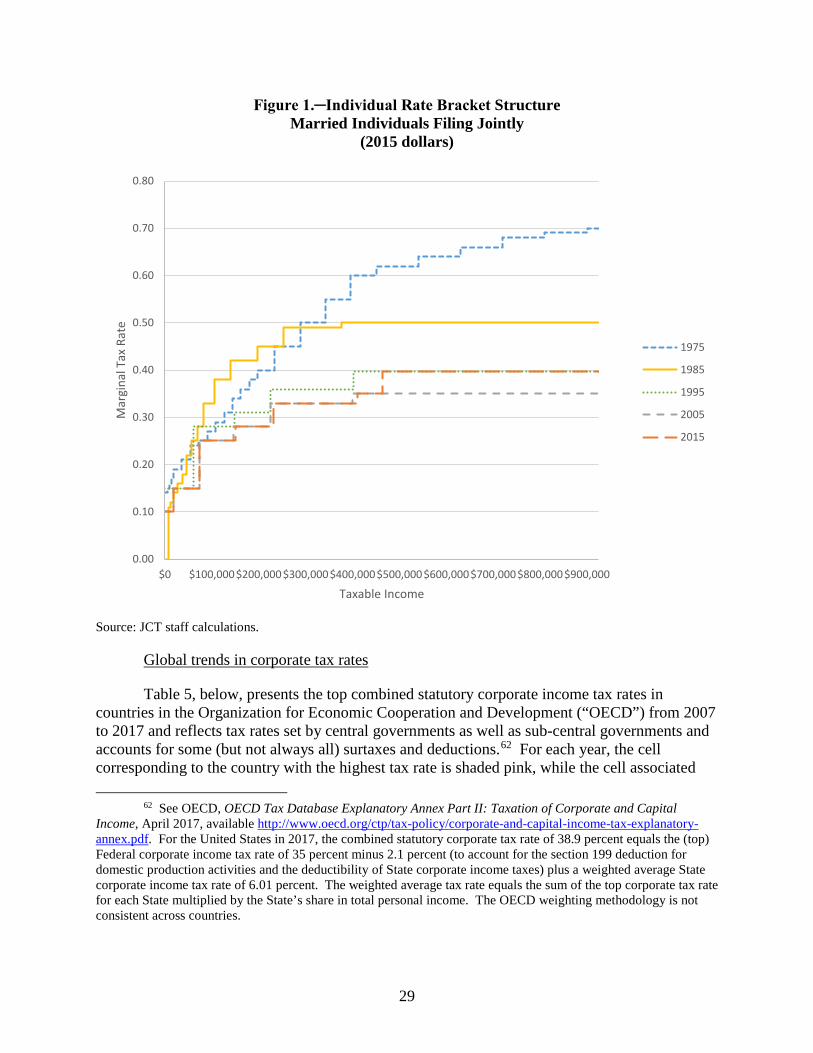
Economists have shown that the efficiency loss from taxation increases as the marginal tax rate increases. That is, a one percentage point increase in a marginal tax rate from 40 percent to 41 percent creates a greater efficiency loss per dollar of additional tax revenue than a one percentage point increase in a marginal tax rate from 20 percent to 21 percent.60 Thus, to minimize economic inefficiency, economists have generally recommended a broad base of taxation to keep marginal tax rates as low as possible to raise a given level of revenue. Figure 1 and Table 5, below, show trends in individual and corporate income tax rates.
In addition, a broader base may also promote a more efficient allocation of resources by eliminating preferential treatment of certain activities over others and by reducing the scope of
58 An exception to this is a “head tax” or “lump sum” tax, which imposes a fixed tax on all individuals
without regard to any behavior. Such a tax reduces the after-tax resources available to the individual, but does not change prices and thus does not distort choices a consumer faces in the absence of the tax. For a review of measures of the efficiency cost of taxation, see Alan J. Auerbach and James R. Hines, “Taxation and Economic Efficiency,” in Alan J. Auerbach and Martin Feldstein (eds.), Handbook of Public Economics, vol. 3, pp. 1347-1421.
59 The marginal tax rate is the rate that applies to the last dollar of income earned by the taxpayer. As a result of phase-outs and phase-ins of tax preference items (such as income exclusions or deductions and credits), a taxpayer’s effective marginal tax rate may differ from the taxpayer’s statutory marginal tax rate. In contrast to a taxpayer’s marginal tax rate, a taxpayer’s average tax rate is the taxpayer’s total tax paid as a percentage of the taxpayer’s total income.
60 The magnitude of the efficiency loss from taxation depends upon a measure of the taxpayer’s behavioral response, or the elasticity, and the square of the total effective marginal tax rate. Hence, a small change in an effective marginal tax rate can create an efficiency loss that is large in relation to the change in revenue. For a detailed discussion of this point, see Joint Committee on Taxation, Methodology and Issues in Measuring Changes in the Distribution of Tax Burdens (JCS-7-93), June 14, 1993, pp. 20–31 and Harvey S. Rosen, Public Finance, McGraw-Hill, 2004.

28
distortionary behavioral responses to taxation.61 For example, variation in effective marginal tax rates on investment may result in an inefficient pattern of investment, distortions in choice of organizational form, and distortions in source of investment financing. Table 6, below, provides estimates of effective marginal tax rates on new investment by asset type, organizational form, and source of financing.
Trends in individual income tax rates
Over time, marginal tax rates on individual income have generally fallen for all taxpayers. Figure 1, below, depicts the individual rate bracket structure for married individuals filing jointly (with income expressed in 2015 dollars). Marginal tax rates for high-income taxpayers within this group have risen in the last decade, but remain about 30 percentage points lower than in 1975. Tax rates for lower-income taxpayers are below the rates in 1975.
61 Some economists argue that, for efficiency reasons, tax rates should vary based on the extent to which
different sources of economic activity, and taxable income, respond differently to changes in tax rates. In particular, tax bases that are relatively immobile (such as consumption) should be subject to higher rates of tax than tax bases that are more mobile (such as corporate income). As an example, some economists argue that tax regimes that provide preferential tax treatment to mobile income may be desirable because they limit tax competition for less mobile income, for which tax competition is potentially more distortionary from the perspective of taxation and economic efficiency. See Michael Keen, “Preferential Regimes Can Make Tax Competition Less Harmful,” National Tax Journal, vol. 54, no. 4, 2001, pp. 757-762. Higher tax rates may also enhance economic efficiency to the extent that they discourage activities that generate negative externalities.
29
Figure 1.─Individual Rate Bracket Structure Married Individuals Filing Jointly
(2015 dollars)
Source: JCT staff calculations.
Global trends in corporate tax rates
Table 5, below, presents the top combined statutory corporate income tax rates in countries in the Organization for Economic Cooperation and Development (“OECD”) from 2007 to 2017 and reflects tax rates set by central governments as well as sub-central governments and accounts for some (but not always all) surtaxes and deductions.62 For each year, the cell corresponding to the country with the highest tax rate is shaded pink, while the cell associated
62 See OECD, OECD Tax Database Explanatory Annex Part II: Taxation of Corporate and Capital Income, April 2017, available http://www.oecd.org/ctp/tax-policy/corporate-and-capital-income-tax-explanatory-annex.pdf. For the United States in 2017, the combined statutory corporate tax rate of 38.9 percent equals the (top) Federal corporate income tax rate of 35 percent minus 2.1 percent (to account for the section 199 deduction for domestic production activities and the deductibility of State corporate income taxes) plus a weighted average State corporate income tax rate of 6.01 percent. The weighted average tax rate equals the sum of the top corporate tax rate for each State multiplied by the State’s share in total personal income. The OECD weighting methodology is not consistent across countries.
0.00
0.10
0.20
0.30
0.40
0.50
0.60
0.70
0.80
$0 $100,000 $200,000 $300,000 $400,000 $500,000 $600,000 $700,000 $800,000 $900,000
Mar
gina
l Tax
Rat
e
Taxable Income
1975
1985
1995
2005
2015

30
with the country with the lowest tax rate is shaded blue. For most OECD countries, top combined statutory income tax rates have declined over the last decade. The rate in 2017 was lower than in 2007 for 21 of the 35 OECD countries. Rates were higher in 2017 for only six countries. From 2007 to 2012, the United States had the second highest combined statutory corporate income tax rate among OECD countries, and had the highest rate from 2013 to 2017.63
Table 5.−Top Combined Statutory Corporate Income Tax Rates in the OECD (Central and Sub-Central Governments): 2007-2017
Source: OECD Tax Database.
63 For estimates of average and effective corporate tax rates across the Group of Twenty (“G20”) countries
for 2012, see Congressional Budget Office, International Comparisons of Corporate Tax Rates, March 2017. Average and effective corporate tax rates account for features of tax systems besides statutory corporate tax rates, such as cost recovery provisions and investment incentives. The Congressional Budget Office estimates, for the United States in 2012, an average corporate tax rate of 29.0 percent and an effective corporate tax rate of 18.6 percent, which were among the highest in the G20.
2007 2008 2009 2010 2011 2012 2013 2014 2015 2016 2017Australia 30.0 30.0 30.0 30.0 30.0 30.0 30.0 30.0 30.0 30.0 30.0Austria 25.0 25.0 25.0 25.0 25.0 25.0 25.0 25.0 25.0 25.0 25.0Belgium 34.0 34.0 34.0 34.0 34.0 34.0 34.0 34.0 34.0 34.0 34.0Canada 34.0 31.4 30.9 29.4 27.7 26.1 26.2 26.2 26.7 26.7 26.7Chile 17.0 17.0 17.0 17.0 20.0 20.0 20.0 21.0 22.5 24.0 25.0Czech Republic 24.0 21.0 20.0 19.0 19.0 19.0 19.0 19.0 19.0 19.0 19.0Denmark 25.0 25.0 25.0 25.0 25.0 25.0 25.0 24.5 23.5 22.0 22.0Estonia 22.0 21.0 21.0 21.0 21.0 21.0 21.0 21.0 20.0 20.0 20.0Finland 26.0 26.0 26.0 26.0 26.0 24.5 24.5 20.0 20.0 20.0 20.0France 34.4 34.4 34.4 34.4 36.1 36.1 38.0 38.0 38.0 34.4 34.4Germany 38.9 30.2 30.2 30.2 30.2 30.2 30.2 30.2 30.2 30.2 30.2Greece 25.0 25.0 25.0 24.0 20.0 20.0 26.0 26.0 26.0 29.0 29.0Hungary 20.0 20.0 20.0 19.0 19.0 19.0 19.0 19.0 19.0 19.0 9.0Iceland 18.0 15.0 15.0 18.0 20.0 20.0 20.0 20.0 20.0 20.0 20.0Ireland 12.5 12.5 12.5 12.5 12.5 12.5 12.5 12.5 12.5 12.5 12.5Israel 29.0 27.0 26.0 25.0 24.0 25.0 25.0 26.5 26.5 25.0 24.0Italy 37.3 31.4 31.4 31.4 31.4 31.3 31.3 31.3 31.3 31.3 27.8Japan 39.5 39.5 39.5 39.5 39.5 39.5 37.0 37.0 32.1 30.0 30.0Korea 27.5 27.5 24.2 24.2 24.2 24.2 24.2 24.2 24.2 24.2 24.2Latvia 15.0 15.0 15.0 15.0 15.0 15.0 15.0 15.0 15.0 15.0 15.0Luxembourg 29.6 29.6 28.6 28.6 28.8 28.8 29.2 29.2 29.2 29.2 27.1Mexico 28.0 28.0 28.0 30.0 30.0 30.0 30.0 30.0 30.0 30.0 30.0Netherlands 25.5 25.5 25.5 25.5 25.0 25.0 25.0 25.0 25.0 25.0 25.0New Zealand 33.0 30.0 30.0 30.0 28.0 28.0 28.0 28.0 28.0 28.0 28.0Norway 28.0 28.0 28.0 28.0 28.0 28.0 28.0 27.0 27.0 25.0 24.0Poland 19.0 19.0 19.0 19.0 19.0 19.0 19.0 19.0 19.0 19.0 19.0Portugal 26.5 26.5 26.5 26.5 28.5 31.5 31.5 31.5 29.5 29.5 29.5Slovak Republic 19.0 19.0 19.0 19.0 19.0 19.0 23.0 22.0 22.0 22.0 21.0Slovenia 23.0 22.0 21.0 20.0 20.0 18.0 17.0 17.0 17.0 17.0 19.0Spain 32.5 30.0 30.0 30.0 30.0 30.0 30.0 30.0 28.0 25.0 25.0Sweden 28.0 28.0 26.3 26.3 26.3 26.3 22.0 22.0 22.0 22.0 22.0Switzerland 21.3 21.2 21.2 21.2 21.2 21.2 21.2 21.2 21.2 21.2 21.2Turkey 20.0 20.0 20.0 20.0 20.0 20.0 20.0 20.0 20.0 20.0 20.0United Kingdom 30.0 28.0 28.0 28.0 26.0 24.0 23.0 21.0 20.0 20.0 19.0United States 39.3 39.3 39.2 39.2 39.2 39.1 39.1 39.1 39.0 38.9 38.9

31
Effective marginal tax rates on investment
In general
One way to measure the potential inefficiency in the allocation of capital is to calculate the effective marginal tax rate on investment. The effective marginal tax rate combines various features of the tax code as applied to a particular investment into a single rate that would offer the same investment incentives if that rate were applied directly to economic income.64 The effective marginal tax rate may be calculated from the user cost of capital.65 The effective marginal tax rate is the rate that would leave an after-tax real rate of return sufficient to cover the real financing costs of the investment and economic depreciation. Effective marginal tax rates are often used as a measure of investment incentives in lieu of the user cost of capital on which they are based. Tax changes that increase the user cost of capital also increase the effective marginal tax rate. Similarly, tax changes that reduce the user cost of capital also reduce the effective marginal tax rate. Increases (decreases) in the effective marginal tax rate tend to decrease (increase) investment in the long run, and thus decrease (increase) the size of the aggregate capital stock.
Economic output, however, depends not only on the size of the capital stock but also on its composition. In the absence of taxes, the operation of a competitive economy causes capital to flow to sectors where it is expected to earn the highest rate of return. This results in an allocation of investment that produces the largest amount of national income. However, if effective marginal tax rates differ across sectors of the economy, more capital may accumulate in lightly taxed sectors, and less capital may be invested in highly taxed sectors. This may result in an inefficient allocation of capital to sectors in which it earns a lower pre-tax rate of return, reducing total productivity and potential output across all sectors. Thus, the effect of a reduction in the economy-wide effective marginal tax rate on investment could be partially offset if the disparity in effective marginal tax rates across sectors increases.
Table 6, below, reports recent estimates from the U.S. Department of Treasury’s Office of Tax Policy of effective marginal tax rates on new investment.66 The overall effective
64 While useful for measuring marginal incentive effects, effective marginal tax rates are not relevant for purposes of comparing tax burdens on investors in particular activities or industries. The calculation of effective marginal tax rates depends on a concept of long-run equilibrium in which all investors earn the same risk-adjusted after-tax rate of return; therefore, differences in effective marginal tax rates do not reflect differences in investor returns. See James B. Mackie, III, “Unfinished Business of the 1986 Tax Reform Act: An Effective Tax Rate Analysis of Current Issues in the Taxation of Capital Income,” National Tax Journal, vol. 55, June 2002, pp. 293-337.
65 For a detailed description of the methodology and calculations involved, see Congressional Budget Office, Computing Effective Tax Rates on Capital Income, December 2006, available at http://www.cbo.gov/ftpdocs/76xx/doc7698/12-18-TaxRates.pdf.
66 U.S. Department of Treasury, Office of Tax Policy, The Case for Responsible Business Tax Reform, January 2017, p. 7, available at https://www.treasury.gov/resource-center/tax-policy/Documents/Report-Responsible-Business-Tax-Reform-2017.pdf. Comparisons of effective marginal tax rates across G20 countries can be found in Congressional Budget Office, International Comparisons of Corporate Tax Rates, March 2017.

32
marginal tax rate on capital income is 19.7 percent.67 However, the rate varies significantly depending on the form of business organization, the source of financing, and the type of investment. This variation contributes to distortions in the allocation of capital, which may reduce economic output.
Distortions by organizational form
Table 6, below, shows that the effective marginal tax rate on all business investment is 27.3 percent, with a higher rate in the corporate sector (28.9 percent) than in the noncorporate sector (24.4 percent).68 This difference is due in part to the presence of a separate corporate income tax and in part to most noncorporate income being taxed at relatively lower marginal rates. However, this difference is partially offset by the relatively greater share of corporate income relative to noncorporate income that is received by tax-favored retirement accounts.
Table 6.−Effective Marginal Tax Rates on New Investment (2016)
Source: Office of Tax Policy, U.S. Department of the Treasury.
67 The Congressional Budget Office (“CBO”) has estimated similar effective marginal tax rates on capital
income. The CBO estimate for 2014, as opposed to for 2016 in the Treasury study, are 18 percent overall; 29 percent on all business investment; 31 percent on investment in the corporate sector; 27 percent on investment in the noncorporate sector; and -2 percent for owner-occupied housing. See Congressional Budget Office, Taxing Capital Income: Marginal Tax Rates Under 2014 Law and Selected Policy Options, December 2014, available at http://www.cbo.gov/sites/default/files/cbofiles/attachments/49817-Taxing_Capital_Income_0.pdf.
68 See Appendix Figure A-5 for trends in the number of C corporation returns compared to the sum of S corporation and partnership returns (1980-2014), and Appendix Figure A-6 for trends in the share of net income (less deficit) by form of business (1980-2013). The number of returns filed by passthrough entities has increased significantly over time, while the number of returns filed by corporations has declined moderately. The share of net income earned by C corporations has also declined over time.
Business 27.3Corporate 28.9
FinancingEquity financed 34.5Debt financed -5.0
Asset TypeEquipment 24.2Structures 29.4Land 36.1Inventories 39.5Intangibles 2.4
Noncorporate Business 24.4Owner-occupied Housing -2.3
Total 19.7

33
Distortions by source of investment financing
The effective marginal tax rates shown in Table 6, above, are computed based on the mix of debt and equity financing observed in the corporate sector. To show the sensitivity of rates to the source of financing, effective marginal tax rates are recomputed assuming either all debt or all equity financing. The marginal tax rate on income from an all-debt-financed corporate investment is -5.0 percent versus 34.5 percent for an all-equity-financed corporate investment. The negative rate on income from an all-debt-financed corporate investment is attributable in part to deductions for both accelerated depreciation and interest expense which, in combination, exceed taxable income. This is partially offset by individual taxes on the interest income received; however, much of that interest income is generally taxed at individual marginal tax rates lower than the corporate marginal tax rate at which the interest paid is deductible, or is not taxed because it is received by tax-favored accounts (individual retirement accounts or accounts of tax-exempt investors, such as pension funds and endowments).
The marginal tax rate on income from an all-equity-financed corporate investment (34.5 percent) is very close to the top statutory corporate tax rate (35 percent). Individual income taxation of dividends and capital gains, mitigated by the share of such income received by tax-favored accounts, increases the marginal tax rate above the statutory corporate tax rate. Although these income flows are generally taxed at favorable rates at the individual level, they are not deductible by the corporation. Despite considering these individual-level taxes, the rate on equity-financed corporate investment is lower than the statutory rate because of accelerated depreciation.
Preference for investment in housing
Table 6, above, shows that investment for owner-occupied housing is tax-favored relative to business investment as a whole, with an effective marginal tax rate of -2.3 percent.69 The negative rate on owner-occupied housing reflects the deductibility of mortgage interest and real property taxes and the exclusion of implicit net rental income and certain capital gains from gross income.70
Distortions in investment across asset classes
Variation in effective marginal taxes rates on investment may lead to distortions in the pattern of investment in the economy by favoring investment in certain types of assets over
69 While the Office of Tax Policy document did not separately report an effective marginal tax rate for
tenant-occupied housing, it notes that the residential rental property sector is generally taxed more lightly than business investment as a whole due to (1) discounted present value of tax depreciation allowances for residential structures that is almost twice that implied by economic depreciation and (2) the low income housing tax credit. U.S. Department of Treasury, Office of Tax Policy, The Case for Responsible Business Tax Reform, January 2017, p. 20. Furthermore, a large portion of rental housing investment occurs outside of the more heavily taxed corporate sector.
70 See discussion of tax incentives for owner-occupied housing in Joint Committee on Taxation, Present Law, Data, and Analysis Relating to Tax Incentives for Residential Real Estate (JCX-10-13), April 22, 2013.

34
others. Table 6 reports the range in effective marginal tax rates in the corporate sector among those broad asset types listed.71 Intangible assets, including research and development, artistic originals, and advertising, are the most lightly taxed asset type with an effective marginal tax rate of 2.4 percent. This is attributable to expensing provisions and the credit for research and experimentation expenditures. Equipment (24.2 percent) and structures (29.4 percent) have the next lowest marginal effective tax rates due primarily to tax depreciation that is accelerated relative to economic depreciation. Inventories and land have the highest effective marginal tax rates, 39.5 percent and 36.1 percent respectively, generally because no depreciation is allowed with respect to these assets. Generally, effective marginal tax rates greater than the statutory tax rate reflect tax depreciation slower than economic depreciation, and vice versa.
The “lockout effect” and the choice between repatriating or reinvesting foreign earnings
Policymakers are also concerned that U.S. tax rules may create a “lockout effect,” which is a colloquial reference to the possibility that the overseas earnings of U.S. corporations are being “locked out” and not reinvested in the United States because U.S. corporations have a tax incentive, created by deferral, to reinvest foreign earnings rather than repatriate them. This may occur if corporations choose to make foreign investments, rather than domestic investments, because the ability to defer payment of residual U.S. tax liability on the returns to the foreign investments may make those foreign investments more attractive on an after-tax basis, even if they yield the same pre-tax return as a domestic investment. The lockout effect disappears if repatriation of overseas earnings has no tax consequence, as would be the case if foreign earnings were exempt from U.S. tax or if those earnings were subject to current U.S. taxation.
Figure 4, below, shows that an increasing amount, and share, of earnings from U.S. direct investment abroad is being reinvested overseas. From 1999 to 2016, earnings from U.S. direct investment abroad grew from $126.8 billion to $419.5 billion, while the amount of those earnings that was reinvested overseas increased from $64.2 billion to $298.6 billion. Therefore, the share of earnings reinvested abroad, as a percentage of earnings from U.S. direct investment abroad, rose from 38.4 percent to 71.1 percent. The amount of earnings that was distributed (i.e., dividends and withdrawals) rose from $62.5 billion in 1999 to $120.9 billion in 2016.72 Although a significant amount of foreign earnings was reinvested abroad and not distributed, that does not necessarily mean that the lockout effect is significant. Such reinvestment may be the most economically productive use of a corporation’s funds if the pre-tax rate of return on its foreign investment exceeds the domestic investment opportunities available to it. Because most growth by U.S. multinational enterprises (“MNEs”) is occurring in foreign markets, companies may be making productive investment decisions by reinvesting a large portion of their foreign earnings to support their expansion overseas.
71 The Office of Tax Policy notes that though they are not reported, the effective marginal tax rates by
asset type on investment in the noncorporate sector exhibits a similar pattern to those for the corporate sector.
72 The large increase in distributed earnings, and corresponding decrease in earnings reinvested abroad, in 2004 and 2005 was due largely to the enactment of the section 965 repatriation holiday.

35
Figure 4.−Earnings from U.S. Direct Investment Abroad: 2007-2016 (nominal dollars, in millions)
Source: JCT Staff calculations based on Bureau of Economic Analysis (“BEA”), International Transactions Table 4.2, “U.S. International Transactions in Primary Income on Direct Investment,” and Table 6.1, “U.S. International Transactions for Direct Investment.” U.S. direct investment abroad is defined as ownership by a U.S. investor of at least 10 percent of a foreign business. Primary income consists of income from direct investment, portfolio investment, and labor income.
However, one study finds a negative relationship between the amount of tax-induced foreign cash holdings (i.e., locked-out cash) of a U.S. MNE and stock market reactions to acquisitions made by the U.S. MNE of existing foreign-based (but not domestic) businesses, suggesting that U.S. MNEs may make more productive use of their funds if there were no residual U.S. tax liability when earnings are repatriated.73 Another study reaches a similar conclusion, and estimates that the burden of residual U.S. tax liability on repatriated earnings distorts a corporation’s decision concerning how much to repatriate (and from which foreign subsidiaries), and that the economic cost of this distortion—which could cause U.S. corporations to incur more debt, or invest less in the United States, than they would if they had no residual
73 Michelle Hanlon, Rebecca Lester, and Rodrigo Vedi, “The Effect of Repatriation Tax Costs on U.S.
Multinational Investment,” Journal of Financial Economics, vol. 116, no 1, April 2015, pp. 179-196.
-100,000
0
100,000
200,000
300,000
400,000
500,000
1999 2000 2001 2002 2003 2004 2005 2006 2007 2008 2009 2010 2011 2012 2013 2014 2015 2016
Millions $
Distributed earnings Reinvested earnings Earnings

36
U.S. tax liability on their foreign earnings—can be significant.74 Some economists find that the cost of this distortion increases as the accumulated stock of deferred income increases.75
Deferral may also contribute to distortions in how U.S. corporations manage shareholder payouts and debt. For example, deferral may provide U.S. corporations with an incentive to reinvest foreign earnings rather than repatriate the earnings and distribute the proceeds to shareholders in the form of dividends or share buybacks, leading to reduced shareholder payouts. Moreover, U.S. corporations may have larger levels of U.S. debt than they otherwise would because they are not repatriating foreign earnings to reduce their debt load, or because they choose to fund shareholder payouts through borrowing rather than out of repatriated foreign earnings.
Taxes and increases in economic efficiency: correcting for market failures
While taxes may have distortionary effects, tax policy can lead to a more efficient allocation of resources when it is used to correct for market failures. A common economic rationale for government intervention in certain markets (including many aspects of energy markets and the market for innovation) is that there may be “externalities” in the consumption or production of certain goods. The externalities lead to “market failures,” wherein either too little or too much of certain economic activity occurs relative to the socially optimal level of activity. An externality exists when, in the consumption or production of a good, there is a difference between the cost (or benefit) to the participants in the market for the good from its consumption or production and the cost (or benefit) to society as a whole. When the economy-wide, or “social,” costs of a certain economic activity (e.g., production or consumption of a certain good) exceed the private costs of that activity, a negative externality exists, and the level of that activity is above that which is socially optimal. In contrast, when the social benefits from a certain activity exceed the private benefits, a positive externality exists, and the level of that activity is below that which is socially optimal.
The reason the level of economic activity is either above or below that which is socially optimal in markets with externalities is that individuals and firms generally take into account the personal, or private, benefits and costs of their decisions, and ignore the benefits received, and costs incurred, by other market participants. Thus, they engage in economic activity up to the point where their private marginal benefit equals their private marginal cost. But, from an economy-wide perspective, economic activity should occur up to the point where the social marginal benefit (i.e., the benefits accruing to the entire economy and not only to the individual or firm engaged in the activity) equals the social marginal cost (i.e., the costs incurred by individuals and firms in the economy as a whole and not only by the individual or firm engaged in the activity). Privately optimal economic decisions may not be socially optimal. Absent some intervention, private actions lead to the socially optimal level of consumption or production only
74 Mihir A. Desai, C. Fritz Foley, and James R. Hines Jr., “Repatriation Taxes and Dividend Distortions,”
National Tax Journal, vol. 54, no. 4, December 2001, pp. 829-851.
75 Harry Grubert and Rosanne Altshuler, “Fixing the System: An Analysis of Alternative Proposals for the Reform of International Tax,” National Tax Journal, vol. 66, no. 3, September 2013, pp. 671-712.

37
when there are no externalities, because only in that case are private costs and benefits equal to social costs and benefits.
Taxes are one tool that policymakers can use to correct for market failures. For example, policymakers can promote activities that create positive externalities through a tax subsidy to lower the after-tax price of the good to the consumer or increase the after-tax profit to the producer. An example where a positive externality is thought to exist is in basic scientific research, as the social payoffs to such research are not fully captured by private parties that undertake, and incur the cost of, such research. This is one rationale for the tax credit for increasing research activities.76 In addition, policymakers can discourage activities that lead to negative externalities by taxing those activities to raise the after-tax price to the consumer or decrease the after-tax profit to the producer. Pollution is an example of a negative externality, because the costs of pollution are borne by society as a whole rather than solely by the polluters themselves. An example of a tax policy to raise the after-tax price of certain pollutants is the excise tax on ozone-depleting chemicals.77
76 Sec. 41.
77 Sec. 4681.

38
C. Fairness
Introduction
While most would agree that taxation should be fair, views as to what constitutes a fair tax vary. Economists and political philosophers since the days of Adam Smith have recognized two broad concepts of fair taxation.78
One such principle is known as the benefit principle, under which taxes should be levied in proportion to the benefits received from the public sector. Under this principle, it is the government’s job to view taxes as the prices that would prevail in an actual market for the government service. Thus, the tax for each individual should approximate the price that an individual would willingly pay for the government service if it were provided in a market. Under a tax system that purely reflects the benefit principle, individuals are entitled to all of their earnings and there is no role for redistribution of those earnings. The Federal government currently imposes certain taxes that are intended to broadly reflect the benefit principle. Perhaps the most well known is the motor fuels excise tax, which funds highway construction. Since most gasoline is consumed in motor vehicles used on highways, the tax that one pays on gasoline rises or falls in proportion to one’s use of the highways.79 Social insurance taxes, such as those for Social Security, may be viewed partially in this light, as one’s future Social Security benefits are generally correlated with the amount of Social Security taxes paid in one’s working life.
The second principle is known as the ability to pay principle. This principle focuses only on the tax side of the budget, and views taxation as imposing an aggregate cost that must be apportioned in a manner that taxes those with equal ability to pay equally, and imposes greater burdens on those with greater ability to pay. The graduated rate structure of the individual income tax can be viewed as reflecting of the ability to pay principle, as average tax rates generally rise with income.
Assessing ability to pay
The notion of ability to pay (i.e., the taxpayer’s capacity to bear taxes) is commonly applied to determine fairness, though there is no general agreement regarding the appropriate standard by which to assess a taxpayer’s ability to pay. Annual income is the most common choice, though some have advocated that lifetime income, or consumption, might be better measures.
78 Richard A. Musgrave, “Fairness in Taxation,” in Joseph J. Cordes, Robert D. Ebel, and Jane G. Gravelle
(eds.), Encyclopedia of Taxation and Tax Policy, Urban Institute, 2005, pp. 134-137.
79 This tax is clearly not a perfect application of the benefit principle for a variety of reasons, including that gasoline use per road mile travelled will vary depending on the fuel efficiency of the motor vehicle.

39
Annual income.–Many analysts have advocated a comprehensive measure of income as a measure of ability to pay.80 Although income is commonly measured on an annual basis, it is recognized that there are significant shortcomings with using current-year income as an indicator of current-year ability to pay. First, an individual may be subject to wide swings in income from year to year. In this case, a snapshot of income in any one year could be a misleading indicator of ability to pay from a lifetime perspective. An individual’s income generally varies more from year to year than does that individual’s consumption expenditures, as individuals typically save more when their income is high and dissave to finance consumption purchases when their income is low. Second, over the course of one’s lifetime, annual income will vary according to age, where income is low in one’s early working years, peaking toward the end of one’s working years, and declining in retirement. Low annual income may incorrectly indicate a low ability to pay, from a lifetime perspective, for those whose income is only temporarily low.
Lifetime income.–As a result of variability in annual income over one’s lifetime, many economists have argued that lifetime income (or some average of income over several years) is a better indicator of ability to pay.81
Over an individual’s lifetime, consumption may roughly equal income;82 but, as noted above, consumption is likely to be high relative to income in low-earning years and low relative to income in high-earning years. Therefore, if, under a consumption tax, tax liabilities are borne in proportion to consumption, a broad-based consumption tax would appear regressive if compared to an annual measure of income and would appear less regressive and perhaps even proportional when lifetime income is used as the measure of ability to pay.
It has been widely observed that annual consumption is much less variable than annual income, and that annual consumption is more likely to be a function of lifetime income than annual income.83 Based on this observation, some have even advocated annual consumption itself as a measure of ability to pay since it is a good proxy for average lifetime income.84 Others
80 See, for example, Henry Simons, Personal Income Taxation, Chicago: University of Chicago Press, 1938; and Richard Goode, “The Superiority of the Income Tax,” in Joseph Pechman (ed.), What Should Be Taxed: Income or Consumption? Washington, D.C.: Brookings Institution, 1980.
81 If individuals do not have easy access to well-developed financial markets, the appropriateness of lifetime income as a measure of ability to pay should be qualified. For example, if an individual is credit-constrained, lifetime income may overestimate a low-income individual’s ability to pay.
82 Lifetime consumption may exceed lifetime income (in present value) when an individual receives large bequests or gifts (and these receipts are not considered income). Lifetime consumption may be less than lifetime income (in present value) when an individual makes bequests or gifts (and these payments are not considered consumption).
83 For empirical support of this observation, see Costas Meghir and Luigi Pistaferri, “Earnings, Consumption, and Life Cycle Choices,” in Orley Ashenfelter and David Card (eds.), Handbook of Labor Economics, North Holland Publishing Co., 2011, pp. 773-854. For a classic study, see Milton Friedman, A Theory of the Consumption Function, Princeton, N.J.: Princeton University Press, 1957.
84 See James M. Poterba, “Is the Gasoline Tax Regressive?” in (David Bradford (ed.), Tax Policy and the Economy, vol. 5, (Cambridge: The MIT Press), 1991.

40
have advocated consumption itself not because it is a good proxy for income, but because it is a better measure than income of economic well-being.
If a tax system is considered fair when two individuals with the same wealth at the beginning of their lives and the same abilities to earn wage income are taxed equally, then consumption is a better tax base than income. This is the case because (if an individual neither receives nor leaves bequests) the present value of lifetime consumption equals the present value of his lifetime earnings, while the present value of lifetime income varies with the timing of savings and earnings. The present value of a consumption tax is then proportional to economic well-being but the present value of an income tax varies for individuals with equal measures of economic well-being and, in fact, increases with the rate of savings.85
Horizontal and vertical equity
Within the confines of a tax system based on ability to pay, analysts generally apply two concepts when assessing the equity, or fairness, of a tax system: vertical equity and horizontal equity. The concept of horizontal equity asks whether taxpayers who otherwise are similarly situated bear the same tax burden. That is, do two taxpayers with the same ability to pay pay the same amount in tax?
However, it is sometimes difficult to determine when two individuals are similarly situated. For example, people disagree over whether two taxpayers are similarly situated if they have the same income but different medical, work-related, or dietary expenses, or whether they rent or own their home. These are disagreements about the tax base. Any noncomprehensive tax base, whether under an income-based or consumption-based tax, potentially imposes different tax liabilities on any two taxpayers who some might consider to be similarly situated. So too, a comprehensive tax base might impose different tax liabilities on any two taxpayers whom some might consider to be similarly situated, if, for example, one believes that medical expenses reduce the taxpayer’s ability to pay.
The concept of vertical equity compares the tax burdens of taxpayers at different levels of income (that is, different ability to pay) or consumption (hereafter the discussion will be framed in reference to income as the basis of tax) and asks how the tax burdens of lower-income taxpayers compare to the tax burdens of higher-income taxpayers. If a tax system is horizontally equitable, there must be vertical differentiation in tax liabilities unless all taxpayers are viewed as similarly situated. There is, however, no agreed upon standard to determine what vertical differentiation in tax liabilities is most fair. Vertical equity is usually discussed in terms of the progressivity or regressivity of the tax system.86
85 The Treasury Department discusses the relative merits of a consumption and income tax base in its 1977
tax reform study. See, Department of the Treasury, Blueprints for Basic Tax Reform, January 17, 1977, pp. 38-41.
86 Under the benefit principle of taxation, horizontal and vertical equity are not generally discussed. However, the benefit principle implies that those getting the same benefits from government services should pay the same tax, and those getting more services should pay greater tax.

41
Filing status: marriage neutrality versus equal taxation of married couples with equal incomes
The choice of the unit of taxation has important consequences related to equity. Any system of taxing married couples requires making a choice among three different concepts of tax equity. One concept is that the tax system should be marriage neutral; that is, the tax burden of a married couple should be exactly equal to the combined tax burden of two single persons where one has the same income as the husband and the other has the same income as the wife. A second concept of equity is that, because married couples frequently consume as a unit, couples with the same income should pay the same amount of tax regardless of how the income is divided between them. (This second concept of equity could also apply to cohabitating couples or to other tax units that may consume jointly, such as the extended family or the household, defined as all people living together under one roof.) A third concept of equity is that the income tax should be progressive; that is, as income rises, the tax burden should rise as a percentage of income.
These three concepts of equity on treatment across single and married people are mutually inconsistent. A tax system can generally satisfy any two of them, but not all three. The current tax system is progressive: as a taxpayer’s income rises, the tax burden increases as a percentage of income. It also taxes married couples with equal income equally: it specifies the married couple as the tax unit so that married couples with the same income pay the same tax. However, it is not marriage neutral.87 A system of mandatory separate filing for married couples would sacrifice the principle of equal taxation of married couples with equal incomes for the principle of marriage neutrality unless it were to forgo progressivity.88
87 Even if all the bracket breakpoints and the standard deduction amounts for unmarried taxpayers (and for
married taxpayers filing separate returns) were half of those for married couples filing a joint return, the current tax system would not be marriage neutral. Many married couples would still have marriage bonuses. As described below, the joint return in such a system would allow married couples to pay twice the tax of a single taxpayer having one-half of the couple’s taxable income. With progressive rates, this income splitting may result in reduced tax liabilities for some couples filing joint returns. For example, consider a married couple in which one spouse has $100,000 of income and the other has none. By filing a joint return, the couple pays the same tax as a pair of unmarried individuals each with $50,000 of income. With progressive taxation, the tax liability on $50,000 would be less than half of the tax liability on $100,000. Thus, the married couple has a marriage bonus: the joint return results in a smaller tax liability than the combined tax liability of the spouses if they were not married.
88 It should be noted that there is an exception to this rule if refundable credits are permissible. A system with a single tax rate and a per taxpayer refundable credit would have marriage neutrality, equal taxation of couples with equal incomes, and progressivity. In such a system, the refundability of the tax credit combined with an equal marginal tax rate on all income would make irrelevant any splitting of income between the individuals. Refundability of the tax credit also would create progressivity in what would otherwise be a proportional tax. Such a system could not have standard deductions, as they would operate like a zero rate bracket, violating the single tax rate criterion.

42
There is disagreement as to whether equal taxation of couples with equal incomes is a better principle than marriage neutrality.89 Those who hold marriage neutrality to be more important tend to focus on marriage penalties that may arise under present law and argue that tax policy discourages marriage and inappropriately encourages unmarried individuals to cohabitate without getting married. Also, they argue that it is simply unfair to impose a marriage penalty even if the penalty does not actually deter anyone from marrying.
Those who favor the principle of equal taxation of married couples with equal incomes argue that as long as most couples pool their income and consume as a unit, two married couples with $60,000 of income are equally well off regardless of whether their income is divided $50,000-$10,000 or $30,000-$30,000. Thus, it is argued, those two married couples should pay the same tax, as they do under present law. By contrast, a marriage-neutral system with progressive rates would involve a larger combined tax on the married couple with the unequal income division. The attractiveness of the principle of equal taxation of couples with equal incomes may depend on the extent to which married couples actually pool their incomes.90
An advocate of marriage neutrality could respond that the relevant comparison is not between a two-earner married couple where the spouses have equal incomes and a two-earner married couple with an unequal income division, but rather between a two-earner married couple and a one-earner married couple with the same total income. Here, the case for equal taxation of the two couples may be weaker, because the non-earner in the one-earner married couple benefits from more time that may be used for unpaid work inside the home, other activities or leisure. It could, of course, be argued in response that the “leisure” of the non-earner may in fact consist of necessary job hunting or child care, in which case the one-earner married couple may not have more ability to pay income tax than the two-earner married couple with the same income.91
Tax progressivity
A progressive tax is a tax wherein one’s average tax rate rises as income rises (as in the current income tax system). A regressive tax, in contrast, is a tax where the average tax rate falls as income rises (the Social Security tax is an example, due to the cap on the wage base subject to tax). A proportional tax is a tax where the average tax rate remains constant as income rises (a
89 This discussion assumes that the dilemma cannot be resolved by moving to a proportional tax (i.e. a
single rate on all income for all taxpayers) system. A proportional system would automatically produce marriage neutrality and equal taxation of couples with equal incomes, but is not a progressive system.
90 Some have called into question the justification for joint returns and the assumption of pooling of income among members of a household. See Marjorie E. Kornhauser, “Love, Money, and the IRS: Family, Income Sharing, and the Joint Income Tax Return,” 45 Hastings Law Journal 63, 1993; Edward J. McCaffery, “Taxation and the Family: A Fresh Look at Behavioral Gender Biases in the Code,” 40 UCLA Law Review 983, 1993; and Lawrence Zelenak, “Marriage and the Income Tax,” 67 Southern California Law Review 399, 1994.
91 However, if two couples have equal incomes and dependent children requiring care, many would think the two-earner couple paying for child care would have lower ability to pay tax than the single-earner couple, because the latter benefits from the unpaid labor of the stay-at-home spouse with regard to child care.

43
flat rate income tax with no exemptions would be an example). A flat rate tax with an exemption would be a progressive tax, as Figure 5, below, illustrates.
Figure 5.−Average Tax Rate Under A 10-Percent Flax Rate Tax With A $20,000 Exemption
Source: JCT Staff calculations.
Various features of the current Code contribute to making it a progressive tax. The most obvious is the progressive rate structure, wherein successive tranches of income bear a greater tax (i.e., the marginal rate of tax rises with income). At the bottom of the income distribution, the standard deduction and the personal exemptions exempt a significant share of income from tax. Additionally, an important role is played by income-targeted credits, and refundable tax credits in particular, especially the earned income credit and the child credit. Phaseouts of tax benefits as income rises also contribute to progressivity. These phaseouts include, for example, the personal exemption phaseout (“PEP”), the overall limit on itemized deductions (“Pease” limitation), and phaseouts for most of the personal credits.
Other features of the Code reduce its degree of progressivity. An example from the income tax is the preferential tax rates or exclusions on forms of income concentrated nearer the top of the income distribution, such as tax-exempt interest and capital gain and dividend income. An example from the Social Security tax system is the cap on wages that applies for the 6.2 percent employer and employee tax on wage income for Old Age Survivors and Disability
$0
$2,000
$4,000
$6,000
$8,000
$10,000
$12,000
$14,000
$16,000
$18,000
$20,000
0%
1%
2%
3%
4%
5%
6%
7%
8%
9%
10%
$0$3
,000
$6,0
00$9
,000
$12,
000
$15,
000
$18,
000
$21,
000
$24,
000
$27,
000
$30,
000
$33,
000
$36,
000
$39,
000
$42,
000
$45,
000
$48,
000
$51,
000
$54,
000
$57,
000
$60,
000
$63,
000
$66,
000
$69,
000
$72,
000
$75,
000
$78,
000
$81,
000
$84,
000
$87,
000
$90,
000
$93,
000
$96,
000
$99,
000
Tax
Liability
average
rate

44
Insurance (“OASDI”) and the comparable Self-Employment Contributions Act (“SECA”). For 2017, this cap is $127,200. The Federal excise taxes (e.g., 18.3 cents per gallon gasoline tax) also reduce progressivity, to the extent consumption does not rise proportionately with income.
Table 7, below, assembles features of the code to show the distribution of Federal taxes and average tax rates across income category.92 The measure of Federal taxes here includes individual and corporate income taxes, employment tax, and excise taxes. The calculated average tax rate reflects that, generally, the Federal tax burden increases with income, indicating a progressive tax system.
Table 7.−Distribution of Federal Taxes and Average Tax Rates in 2017 (Projected)
However, tax progressivity should generally not be viewed in isolation. The progressivity of Federal spending and transfers affect the overall progressivity of Federal policy. For example, while Social Security taxes are regressive (average Social Security taxes decline as income rises beyond the FICA base), Social Security transfers are progressive, and the Social Security system in its entirety is generally considered to be progressive.
92 The appendix contains an extended version of this table that breaks out individual income taxes and
employment taxes, Table A-6.
Federal Taxes Under Present Law [3]
$ Billions Percent shareAverage Tax Rate
[4]Less than $10,000.................................. 19,174 6.9 0.2% 9.8%$10,000 to $20,000................................. 20,306 -2.5 -0.1% -0.8%$20,000 to $30,000................................. 21,107 19.4 0.7% 3.7%$30,000 to $40,000................................. 15,965 43.8 1.5% 7.9%$40,000 to $50,000................................. 12,680 62.6 2.1% 11.0%$50,000 to $75,000................................. 26,945 244.1 8.2% 14.7%$75,000 to $100,000............................... 17,417 255.8 8.6% 16.9%$100,000 to $200,000............................. 29,971 858.8 29.0% 20.9%$200,000 to $500,000............................. 8,975 663.1 22.4% 26.3%$500,000 to $1,000,000.......................... 1,121 233.2 7.9% 30.9%$1,000,000 and over............................... 560 577.4 19.5% 32.2%Total, All Taxpayers............................... 174,220 2,962.5 100.0% 20.6%
[1] The income concept used to place tax returns into income categories is adjusted gross income (AGI) plus: (1) tax-exempt interest, (2) employer contributions for health plans and life insurance, (3) employer share of FICA tax, (4) worker's compensation, (5) nontaxable Social Security benefits, (6) insurance value of Medicare benefits, (7) alternative minimum tax preference items, (8) individual share of business taxes, and (9) excluded income of U.S. citizens living abroad. Categories are measured at 2017 levels.[2] Includes nonfilers, excludes dependent filers and returns with negative income.[3] Federal taxes are equal to individual income tax (including the outlay portion of refundable credits), employment tax (attributed to employees), excise taxes (attributed to consumers), and corporate income taxes. The estimates of Federal taxes are preliminary and subject to change. Individuals who are dependents of other taxpayers and taxpayers with negative income are excluded from the analysis. Does not include indirect effects.[4] The average tax rate is equal to Federal taxes described in footnote [3] divided by income described in footnote [2].Source: Joint Committee on Taxation staff estimates.
Income Category [1] Number of Returns [2] [Thousands]
45
D. Simplicity, Administration, and Compliance
Simplicity
One common concern about the current income tax system is its complexity. Complexity requires taxpayers to devote resources, including time and money, in order to understand the Code and to prepare returns for the Federal government’s collection of the tax. Individuals, businesses, and the government all use time and other resources in the process of paying or collecting tax revenue. A simpler tax system may reduce the costs of complying with the tax system and increase the amount of resources taxpayers can devote to more economically productive activities.
For tax year 2014, of the 148.6 million individual income tax returns filed, 128.1 million returns were filed electronically (86.2 percent).93 In addition, 81.8 million returns (55 percent) were filed with the assistance of a paid preparer.94
The individual AMT has also been viewed as a source of significant complexity in the tax code. The Joint Committee staff estimates that for the 2017 tax year approximately 4.5 million taxpayers will be subject to the AMT, and $30.2 billion in AMT liability will be collected.
Filing burdens
The IRS has produced, for the 2017 filing season, estimates of taxpayer time burdens associated with filing certain tax forms.95 The average time spent filing the main individual income tax forms—Form 1040, 1040A, and 1040EZ (including all attachments)—is estimated to be 13 hours per taxpayer.96 The average burden for businesses filing these forms is 22 hours, while the average burden for non-businesses filing these forms is nine hours.
The IRS has also produced estimates of taxpayer time burdens for partnerships and corporations for the 2017 filing season. The average time spent filing the main partnership tax forms—Forms 1065, 1065-B, and 1066 (including all attachments)—is 290 hours per taxpayer.97 Large partnerships—defined as having end-of-year assets greater than $10 million—face an
93 Internal Revenue Service, 2014 Individual Income Tax Returns Line Item Estimates, Publication 4801
(Rev. 8-2016), 2016.
94 Ibid. This number does not include those taxpayers that filed returns electronically with the use of tax preparation software.
95 Internal Revenue Service, “Instructions for Form 1040,” 2016, pp. 99-100, available at https://www.irs.gov/pub/irs-pdf/i1040gi.pdf. The time burden includes time spent keeping records, completing and submitting forms, and tax planning.
96 Ibid.
97 Internal Revenue Service, Instructions for Form 1120, 2016, p. 23, available at https://www.irs.gov/pub/irs-pdf/i1120.pdf.

46
average time burden of 610 hours.98 The average time spent filing the main corporate tax forms for taxable corporations—including Form 1120 and related forms (including all attachments)—is 315 hours per taxpayer.99 Large taxable corporations—defined as having end-of-year assets greater than $10 million—face an average time burden of 1,250 hours.100 The average time spent filing the main tax forms for entities taxed as pass-through corporations—Form 1120-REIT, 1120-RIC, 1120-S (including all attachments)—is 245 hours per taxpayer.101 Large pass-through corporations—defined as having end-of-year assets greater than $10 million—face an average time burden of 610 hours.102
Administration and compliance
It is generally desirable for a tax system to be administrable in order to ensure compliance by taxpayers. One measure of taxpayer compliance with the U.S. tax system is the gross tax gap, which is the amount of true tax liability that is not paid voluntarily or timely. The IRS estimates that, for tax years 2008-2010, the average annual gross tax gap was $458 billion, which was 18.3 percent of the annual true tax liability of $2.5 trillion.103 Therefore, the voluntary compliance rate—the amount of tax paid voluntarily and timely divided by total true tax liability—was 81.7 percent.104 Voluntarily compliance rates for tax years 2008-2010 were lowest for the individual income tax (74 percent) and the estate tax (74 percent) and highest for the employment tax (90 percent) and the corporate income tax (83 percent).105
Another tax gap measure is the net tax gap, which is the gross tax gap less amounts of tax that are eventually collected, either as a result of voluntary payment or IRS administrative and enforcement activities. The IRS estimates that the average annual net tax gap was $406 billion
98 Ibid. Of the total 3.9 million main partnership tax returns that the IRS estimates will be filed for the
2017 filing season, 0.2 million are for large partnerships.
99 Ibid.
100 Ibid. Of the total 2.1 million main corporate tax returns that the IRS estimates will be filed for the 2017 filing season, 0.1 million are for large taxable corporations.
101 Ibid.
102 Ibid. Of the total 4.9 million main pass-through corporation tax returns that the IRS estimates will be filed for the 2017 filing season, 0.1 million returns are for large pass-through corporations.
103 Internal Revenue Service, Federal Tax Compliance Research: Tax Gap Estimates for Tax Years 2008-2010, Publication 1415 (Rev. 5-2016), May 2016, p. 1, available at https://www.irs.gov/pub/irs-soi/p1415.pdf.
104 Ibid, p. 1.
105 Ibid., p. 11.

47
for tax years 2008-2010, or 16.3 percent of annual true tax liability, for a net compliance rate of 83.7 percent.106
Taxpayer noncompliance may take three primary forms: underreporting of tax liability on tax returns ($387 billion of the gross tax gap for tax years 2008-2010); underpayment of taxes due ($39 billion); and non-filing ($32 billion), which refers to the failure to file a required tax return altogether or on time.107 Compliance is generally high when amounts are subject to third-party information reporting and withholding. Misreporting of income amounts subject to substantial third-party information reporting and withholding was 1 percent for tax years 2008-2010, while misreporting of income amounts subject to substantial third-party information reporting but not withholding was 7 percent for that time period. Misreporting of income amounts subject to little or no third-party information reporting was 63 percent.108
106 Ibid., p. 1.
107 Ibid., p. 2.
108 Ibid., p. 2.

48
APPENDIX: FIGURES AND TABLES
Page
Table A-1.−Federal Receipts by Source, 1967-2016 .....................................................................49
Table A-2.−Federal Receipts by Source, as a Percentage of GDP, 1967-2016 .............................50
Table A-3.−Federal Receipts by Source, as a Percentage of Total Revenues, 1967-2016 ............51
Figure A-1.−Federal Receipts by Source as Share of Total Receipts, 1950-2016 ........................52
Figure A-2.−Federal Receipts as a Percentage of GDP, 1950-2016..............................................53
Figure A-3.−Federal Receipts by Source, 2017 (Projected) ..........................................................54
Figure A-4.−Sources of Income for Individual Taxpayers, 1984-2014.........................................55
Table A-4.−Number of Business Returns by Type, 1978-2014 ....................................................56
Figure A-5.– Number of C Corporation Returns Compared to the Sum of S Corporation and Partnership Returns, 1980-2014 ..............................................................................................57
Figure A-6.– Share of Net Income (Less Deficit) by Form of Business, 1980-2013 ....................59
Table A-5.−Social Security Taxable Wage Base and Rates of Tax, 1975-2017 ...........................60
Table A-6.−Distribution of Income and Taxes, and Average Tax Rates in 2017 (Projected) .......61
Table A-7.−Tax Returns with Income or Employment Taxes in 2017 (Projected) .......................62
Table A-8.−Marginal Tax Rates on Labor and Long-Term Capital Gains, by Income Category in 2017 (Projected) .........................................................................................................62
Table A-9.−Distribution of Selected Sources of Income in 2017 (Projected) ...............................63

49

50

51

52
0.0
10.0
20.0
30.0
40.0
50.0
1950
1951
1952
1953
1954
1955
1956
1957
1958
1959
1960
1961
1962
1963
1964
1965
1966
1967
1968
1969
1970
1971
1972
1973
1974
1975
1976
1977
1978
1979
1980
1981
1982
1983
1984
1985
1986
1987
1988
1989
1990
1991
1992
1993
1994
1995
1996
1997
1998
1999
2000
2001
2002
2003
2004
2005
2006
2007
2008
2009
2010
2011
2012
2013
2014
2015
2016
Figure A-1.-Federal Receipts by Source as Share of Total Receipts, 1950-2016
Individual Income Tax Corporate Taxes Employment Taxes Excise Taxes Estate and Gift Taxes
Sources: Office of Management and Budget, Historical Tables, Fiscal Year 2017; Final Monthly Treasury Statement Fiscal Year 2016; Joint Committee on Taxation calculations.
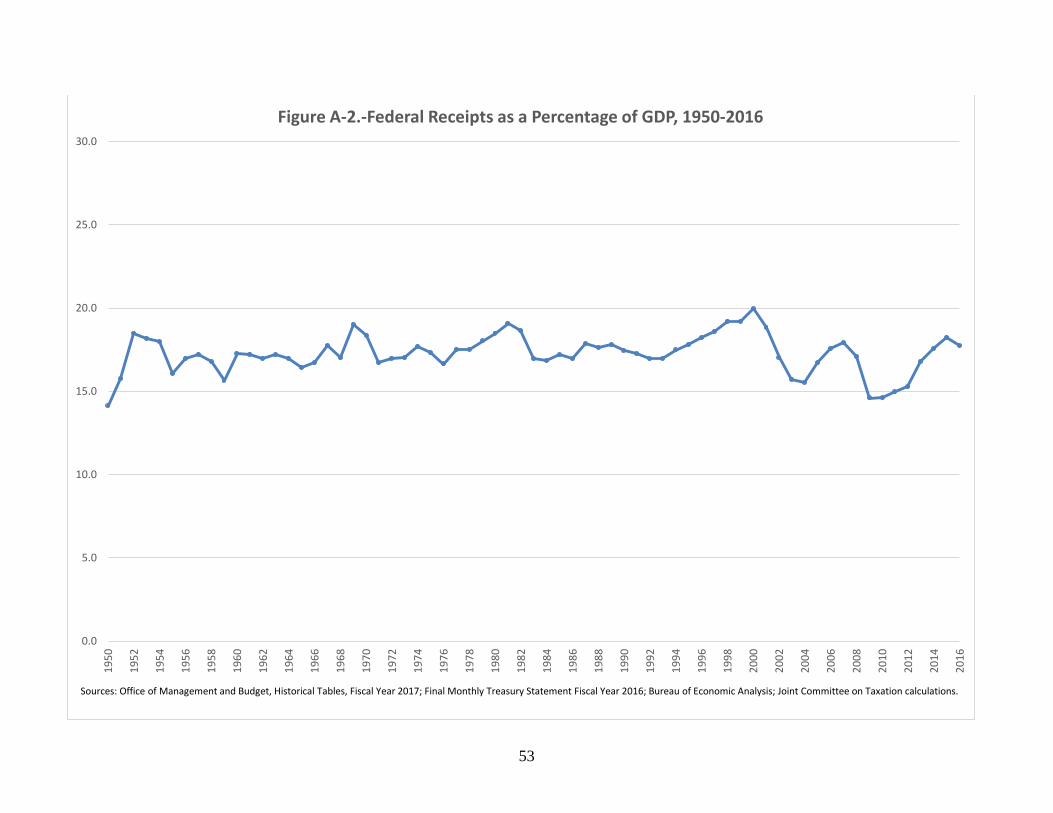
53
0.0
5.0
10.0
15.0
20.0
25.0
30.0
1950
1952
1954
1956
1958
1960
1962
1964
1966
1968
1970
1972
1974
1976
1978
1980
1982
1984
1986
1988
1990
1992
1994
1996
1998
2000
2002
2004
2006
2008
2010
2012
2014
2016
Figure A-2.-Federal Receipts as a Percentage of GDP, 1950-2016
Sources: Office of Management and Budget, Historical Tables, Fiscal Year 2017; Final Monthly Treasury Statement Fiscal Year 2016; Bureau of Economic Analysis; Joint Committee on Taxation calculations.

54
Individual Income Tax48.5%
Corporate Income Tax
9.4%
Social Insurance Taxes33.8%
Excise Taxes2.5%
Estate & Gift Tax0.7%
Other Taxes5.1%
Figure A-3.-Federal Receipts by Source, 2017 (Projected)
Source: Congressional Budget Office, January 2017 Baseline

55

56

57
Trends in business entities
Figure A-5 shows the number of C corporation returns compared to the sum of the number of S corporation and partnership returns (collectively referred to as “passthrough entities”) for each year from 1980 through 2014. Prior to the passage of the Tax Reform Act of 1986, the number of C corporation returns and passthrough entity returns were growing at approximately the same rate. Following the passage of the Tax Reform Act of 1986, the number of C corporation returns has generally declined from approximately 2.6 million returns to approximately 1.6 million returns in 2014. By contrast the number of passthrough entities has increased from approximately 2.5 million returns in 1986 to nearly 8 million returns in 2014.
Figure A-5.−Number of C Corporation Returns Compared to the Sum of S Corporation and Partnership Returns, 1980-2014
Source: Internal Revenue Service, Statistics of Income, published and unpublished data, Joint Committee on Taxation staff calculations.

58
Trends in business income
For tax purposes, businesses may be organized in various forms, including as C corporations, partnerships, S corporations, RICs, REITs, or as sole proprietorships. The IRS’s Statistics of Income division (“SOI”) tabulates tax returns filed by different forms of business organizations. SOI compiles statistical data to form the SOI Integrated Business Dataset (“IBD”). The IBD is assembled from the annual SOI cross-sectional studies of corporations (including C corporations, S corporations, RICs, and REITs), partnerships, and nonfarm109 sole proprietorships.110 The dataset combines data from these types of organizations to enable examination of changes in business composition.
Figure A-6 reports the share of total net income (less deficit)111 earned by businesses in each form.112 Since 1980, C corporations have accounted for the largest share of net income of all business forms in all but three years (2001, 2002, and 2008), when partnerships accounted for a larger share; however, that share has varied significantly. At the beginning of the period, C corporations accounted for nearly three-quarters of all business profits, followed by nonfarm sole proprietorships with 17.3 percent, while REITs and RICs, S corporations, and partnerships together accounted for less than 10 percent. Throughout the early 1980s, the C corporate share of business net income fell, as did that of partnerships, while the other business forms’ shares increased or held steady. Partnerships during this period actually had net losses, consistent with many tax shelters being organized in this form. Following passage of the Tax Reform Act of 1986, C corporations continued their decline while sole proprietorships, S corporations, and partnerships rose.
109 Data from farm sole proprietorships are not included. For this purpose, farm sole proprietorships are
measured solely by reference to those individuals who report income (or loss) on Schedule F of Form 1040. Farm sole proprietorships have reported negative aggregate farm net income (less deficit) every year since 1980. Other individuals engaged in agricultural enterprises may conduct their farm business through a separate legal entity. When this occurs, the data reported below report that entity among the totals for C corporations, S corporations, or partnerships.
110 Data from exempt organizations with unrelated business income (Form 990-T) are not included. For 2013, over 46,000 organizations filed Form 990-T to report unrelated business income. Of these, 37,536 returns reported approximately $909.5 million of unrelated business taxable income (less deficit).
111 Unlike data in some SOI tabulations, net income (less deficit) used here is the more comprehensive “total net income” for S corporations for tax years after 1986. This concept includes trade or business income plus portfolio income, as well as real estate and rental activity incomes distributed directly to shareholders. For partnerships, net income (less deficit) includes ordinary business income (or loss), interest income, dividend income, royalties, net rental real estate income (or loss) from Form 8825, and other net rental income (or loss), but does not include net short-term capital gain or net long-term capital gain.
112 Data may include some double counting because items may be passed through from passthrough entities to the returns of a C corporate partner or a partner that is itself a passthrough entity. For example some partnerships are partnerships of C corporations, some are partnerships of other partnerships, and some are partnerships of individuals and C corporations or other partnerships. Estimates suggest that approximately five percent of the amount of total net income of partnerships is income passed through to other partnerships.

59
Figure A-6.−Share of Net Income (Less Deficit) by Form of Business, 1980-2013
Source: Internal Revenue Service Statistics of Income and JCT staff calculations.
Beginning in the early 1990s, partnerships began to increase their share of business net income, first at the expense of sole proprietorships, whose share of net income peaked at 27.0 percent in 1991, but then at the expense of C corporations. C corporations earned approximately 50 percent of net income from 1989 through 1996, with a brief dip for the recession in 1991 through 1992. Over the subsequent five years, C corporations would see their share of net income fall in half from 46.3 percent in 1997 to 23.7 percent in 2001. That year marks the first time the partnership share of net income exceeded the C corporate share of net income. By 2005, C corporations experienced a rapid increase in profitability, earning about half of all net income that year. However, in 2008, C corporations would account for the smallest share of net income recorded since 1980, before recovering to just under 40 percent of net income of all businesses. For 2013, the most recent year for which complete data are available, C corporations accounted for 38.7 percent, partnerships for 25.6 percent, S corporations for 14.9 percent, REITs and RICs for 10.7 percent, and nonfarm sole proprietorships for 10.1 percent of net income (less deficit).

60

61
Federal Taxes Under Present Law [3] Individual Income Taxes Employment Taxes
$ BillionsPercent share
Average Tax Rate $ Billions
Percent share
Average Tax Rate $ Billions
Percent share
Average Tax Rate
Less than $10,000....................... 19,174 11.0% 70,570 0.5% 6.9 0.2% 9.8% -6.2 -0.4% -8.8% 7.6 0.7% 10.8%$10,000 to $20,000...................... 20,306 11.7% 312,768 2.2% -2.5 -0.1% -0.8% -41.0 -2.8% -13.1% 31.0 2.8% 9.9%$20,000 to $30,000...................... 21,107 12.1% 524,442 3.6% 19.4 0.7% 3.7% -31.9 -2.2% -6.1% 41.3 3.7% 7.9%$30,000 to $40,000...................... 15,965 9.2% 553,747 3.9% 43.8 1.5% 7.9% -12.5 -0.8% -2.3% 45.5 4.1% 8.2%$40,000 to $50,000...................... 12,680 7.3% 569,576 4.0% 62.6 2.1% 11.0% 2.3 0.2% 0.4% 48.8 4.4% 8.6%$50,000 to $75,000...................... 26,945 15.5% 1,658,978 11.5% 244.1 8.2% 14.7% 60.6 4.1% 3.7% 148.3 13.3% 8.9%$75,000 to $100,000..................... 17,417 10.0% 1,509,610 10.5% 255.8 8.6% 16.9% 91.9 6.2% 6.1% 130.1 11.7% 8.6%$100,000 to $200,000................... 29,971 17.2% 4,112,030 28.6% 858.8 29.0% 20.9% 368.9 25.0% 9.0% 387.9 34.8% 9.4%$200,000 to $500,000................... 8,975 5.2% 2,518,200 17.5% 663.1 22.4% 26.3% 386.8 26.2% 15.4% 203.4 18.2% 8.1%$500,000 to $1,000,000................ 1,121 0.6% 754,750 5.3% 233.2 7.9% 30.9% 172.9 11.7% 22.9% 35.7 3.2% 4.7%$1,000,000 and over..................... 560 0.3% 1,790,486 12.5% 577.4 19.5% 32.2% 484.8 32.8% 27.1% 34.9 3.1% 1.9%Total, All Taxpayers.................... 174,220 100.0% 14,375,157 100.0% 2,962.5 100.0% 20.6% 1,476.6 100.0% 10.3% 1,114.6 100.0% 7.8%
[1] The income concept used to place tax returns into income categories is adjusted gross income (AGI) plus: (1) tax-exempt interest, (2) employer contributions for health plans and life insurance, (3) employer share of FICA tax, (4) worker's compensation, (5) nontaxable Social Security benefits, (6) insurance value of Medicare benefits, (7) alternative minimum tax preference items, (8) individual share of business taxes, and (9) excluded income of U.S. citizens living abroad. Categories are measured at 2017 levels.[2] Includes nonfilers, excludes dependent filers and returns with negative income.[3] Federal taxes are equal to individual income tax (including the outlay portion of refundable credits), employment tax (attributed to employees), excise taxes (attributed to consumers), and corporate income taxes. The estimates of Federal taxes are preliminary and subject to change. Individuals who are dependents of other taxpayers and taxpayers with negative income are excluded from the analysis. Does not include indirect effects.[4] The average tax rate is equal to Federal taxes described in footnote [3] divided by income described in footnote [2].Source: Joint Committee on Taxation staff estimates.
Table A-6.─Distribution of Income and Taxes, and Average Tax Rates in 2017 (Projected)
Number of Returns [2]
[Thousands]Share of Returns
Income [Millions of
Dollars]Share of Income
Income Category [1]

62

63