OVERVIEW OF THE CANADIAN DOWNSTREAM PETROLEUM ...
26
OVERVIEW OF THE CANADIAN DOWNSTREAM PETROLEUM INDUSTRY Oil Division July 2005
Transcript of OVERVIEW OF THE CANADIAN DOWNSTREAM PETROLEUM ...

OVERVIEW OF THE CANADIAN DOWNSTREAM PETROLEUM INDUSTRY
Oil Division July 2005


Table of Contents Introduction Crude Oil Canadian Refineries Refinery Economics Crude Slates Refinery Configuration Product Slates Refinery Utilization Environmental Initiatives Petroleum Product Supply/Demand Logistics Product Exchanges Refineries to Terminals Atlantic/Quebec Ontario Western Canada Terminals Retail Outlets Inventory Levels Prices Retail Gasoline Prices Summary Appendix 1
Page
1
1
2
3 4 5 7 8 9
10
12 12 13 13 14 14 15 15
16
17 18
20
21


1
Introduction The downstream petroleum industry is a complex and often misunderstood business. The term downstream refers to all aspects of refining and marketing of petroleum products. It includes petroleum refining, product distribution systems and the marketing and retailing of petroleum products to businesses and individual consumers. This paper will discuss the supply chain for petroleum products, from the sources of the crude oil to the delivery of the products to the final user. It will examine some of the factors that drive refinery economics and provide information on Canada’s supply and demand of petroleum products. It will describe the complexities of the product distribution system and discuss the evolution of just-in-time product inventory levels. The pricing section will focus primarily on gasoline markets. Crude Oil Crude oil is the primary input into the petroleum refining industry. Therefore, basic information about the production and distribution of crude oil in Canada will provide useful context for the downstream business. While Canada is a large and growing net oil exporter, crude oil imports satisfy more than half of domestic refinery demand. The transportation costs associated with moving crude oil from the oil fields in Western Canada to the consuming regions in the east and the greater choice of crude qualities make it more economic for some refineries to use imported crude oil. Therefore, Canada’s oil economy is now a duel market. Refineries in Western Canada run domestically produced crude oil, refineries in Quebec and the eastern provinces run primarily imported crude oil, while refineries in Ontario run a mix of both imported and domestically produced crude oil. In more recent years, eastern refineries have begun running Canadian crude from east coast offshore production. The Western Canada sedimentary basin is an important source of crude oil for Canada and the northern U.S.. Canadian east coast offshore production flows to eastern Canadian refineries and the U.S. northeast. In 2004 Canada was the largest exporter of crude oil to the U.S., accounting for 16% of U.S. imports and 10% of U.S. supply. Imported crude oil flows by tanker into Newfoundland and Labrador, Nova Scotia, New Brunswick and part of Quebec, and by pipeline through Portland, Maine, to Montreal and Ontario. While imports into Canada have been growing in the last few years, exports of Canadian oil to the U.S. have been increasing more rapidly. Canada’s net exports of crude oil have tripled since 1990. Regardless of the source of crude oil, the price is determined in the world market and both imported and domestic crude oil is priced according to the supply/demand balance and pricing

2
dynamics on the world oil market. In this respect, Canadian refiners are “price takers” and have very little influence on the price they pay for crude oil. (Figure 1)
Figure 1 Crude Oil Price Comparison
($US/bbl)
Source: NRCan Canadian Refineries There are currently 12 companies operating refineries in Canada. Only Imperial Oil, Shell and PetroCanada operate more than one refinery and market products nationally. Other refiners generally operate a single refinery and market product in a particular region. These regional refiners include North Atlantic Refining, Irving Oil and Ultramar in the east, Suncor in Ontario and Federated Co-op, Husky and Chevron in the west. Of the 19 refineries in Canada, there are 16 that manufacture the full range of petroleum products. Husky’s facility in Lloydminster, Alberta, and the Moose Jaw Asphalt plant in Moose Jaw, Saskatchewan, are primarily asphalt plants with limited production of other products. The Nova Chemicals facility in Sarnia, Ontario, is a petrochemical plant that also produces some distillate products. There is also a small refinery in Bowden, Alberta, owned by Parkland Industries that is currently shutdown. There are three main refining centres in Canada (Edmonton, Sarnia and Montreal), but most provinces have at least one refinery. (See Figure 2) Manitoba and Prince Edward Island are the only provinces with no refining capacity and there are no refineries in the territories.
0
10
20
30
40
50
60
Jan-
99
Jul-9
9
Jan-
00
Jul-0
0
Jan-
01
Jul-0
1
Jan-
02
Jul-0
2
Jan-
03
Jul-0
3
Jan-
04
Jul-0
4
Jan-
05
$US
per b
arre
l
WTI Brent Edmonton Par

3
Figure 2 Refineries in Canada 2005
(thousands of cubic metres per day)
Refinery Economics The overall economics or viability of a refinery depends on the interaction of three key elements: the choice of crude oil used (crude slates), the complexity of the refining equipment (refinery configuration) and the desired type and quality of products produced (product slate). Refinery utilization rates and environmental considerations also influence refinery economics. Using more expensive crude oil (lighter, sweeter) requires less refinery upgrading but supplies of light, sweet crude oil are decreasing and the differential between heavier and more sour crudes is increasing. Using cheaper heavier crude oil means more investment in upgrading processes. Costs and payback periods for refinery processing units must be weighed against anticipated crude oil costs and the projected differential between light and heavy crude oil prices. Crude slates and refinery configurations must take into account the type of products that will ultimately be needed in the marketplace. The quality specifications of the final products are also increasingly important as environmental requirements become more stringent.
1
Prairies:90.4
B.C.10.1
Ontario74.3
Quebec74.3
Atlantic75.2
Husky – 1.8
Chevron- 8.3
Parkland – 1.0*
Petro-Canada – 21.9Imperial – 28.6Shell – 20.0
Consumers’ Coop – 13.5
Imperial- 19.2 Shell - 11.1
Sunoco - 13.5Nova - 12.7
Imperial- 17.8
Petro-Canada – 20.6Shell - 20.7
Ultramar- 33.0
Imperial- 14.0Irving – 44.5
North Atlantic Refining – 16.7
Source: NRCan and NEB
•Parkland: currently closed Total: 324.3
MJ Asphalt – 2.4
Husky – 4.0

4
Crude Slate Different types of crude oil yield a different mix of products depending on the crude oil’s natural qualities. Crude oil types are typically differentiated by their density (measured as API gravity) and their sulphur content. Crude oil with a low API gravity is considered a heavy crude oil and typically has a higher sulphur content and a larger yield of lower-valued products. Therefore, the lower the API of a crude oil, the lower the value it has to a refiner as it will either require more processing or yield a higher percentage of lower-valued by-products such as heavy fuel oil, which usually sells for less than crude oil. Crude oil with a high sulphur content is called a sour crude while sweet crude has a low sulphur content. Sulphur is an undesirable characteristic of petroleum products, particularly in transportation fuels. It can hinder the efficient operation of some emission control technologies and, when burned in a combustion engine, is released into the atmosphere where it can form sulphur dioxide. With increasingly restrictive sulphur limits on transportation fuels, sweet crude oil sells at a premium. Sour crude oil requires more severe processing to remove the sulphur. Refiners are generally willing to pay more for light, low sulphur crude oil. Most refineries in Western Canada and Ontario were designed to process the light sweet crude oil that is produced in Western Canada. Unlike leading refineries in the U.S., Canadian refineries in these regions have been slower to reconfigure their operations to process lower cost, less desirable crude oils, instead choosing to rely extensively on the abundant, domestically-produced, light, sweet crudes. As long as these lighter crudes were available, refining economics were insufficient to warrant new investment in heavy oil conversion capacity. However, with growing oil sands production and the declining production of conventional light sweet crudes, refineries in Western Canada and Ontario have started to make the investment required to process the increasing supply of heavier crudes. In 2003, Shell Canada completed the conversion of their Scotford refinery to use bitumen feedstock. In the fall of 2003, Consumer’s Co-operative Refineries Ltd completed a 35,000 bbls/day expansion of their refinery in Regina, Saskatchewan. This increased their heavy oil refining capacity to approximately 85,000 bbls/day. Petro-Canada has also announced plans to do a major refitting of their Edmonton refinery. Although this construction is not expected to increase their capacity, it will allow them to upgrade and refine oil sands feedstock. The $1.2 billion CDN project will significantly expand the existing coker at Edmonton allowing for approximately 53,000 bbls/day of bitumen upgrading. Similarly, Suncor is expected to do a feedstock conversion at its Sarnia refinery to run more lower value oil sands feedstock. Much of this investment by the large integrated oil companies (companies that are involved in both the production of crude oil and the manufacturing and distribution of petroleum products) is associated with ensuring a market for their growing oil sands production. In Western Canada and Ontario, almost 50% of the crude oil processed by refiners is conventional light, sweet crude oil and another 25% is high quality synthetic crude oil.

5
Synthetic crude is a light crude oil that is derived by upgrading oil sands. Most of the remaining crude oil processed by these refineries is heavy, sour crude. The crude slate is expected to change significantly in the years ahead as refiners increase their capacity to process heavy crude oil and lower quality synthetic crudes. Refineries in Atlantic Canada and Quebec are dependent on imported crudes and tend to process a more diverse crude slate than their counterparts in Western Canada and Ontario. These refiners have the capacity to purchase crude oil produced almost anywhere in the world and therefore have incredible flexibility in their crude buying decisions. Approximately 1/3 of crude processed in Eastern Canada and Quebec is conventional, light sweet crude and another 1/3 is medium sulphur, heavy crude oil. The remaining 1/3 is a combination of sour light, sour heavy and very heavy crude oil. The crude slate in Eastern Canada is expected to remain much more static than that in Western Canada and Ontario, as these refiners are not constrained by the quality or volume of domestic crude production. Figure 3 illustrates the product yield for six typical types of crude oil processed in Canada. It includes both light and heavy as well as sweet and sour crude oils. A very light condensate (62 API) and a synthetic crude oil are also included. The chart compares the different output when each crude type is processed in a simple distillation refinery. The output is broken down into five main product groups: gasoline, propane and butane (C3/C4), Cat feed (a partially processed material that requires further refining to make usable products), distillate (which includes diesel oil and furnace oil) and residual fuel (the heaviest and lowest-valued part of the product output, used to make heavy fuel oil and asphalt).
Figure 3 Comparison of Refinery Yields by Crude Type
Source: NRCan
0
20
40
60
80
100
Co nde nsa t e Lig ht , Lo w S Lig ht , Hig h S He a v y , Hig h S Ve ry He a v y S y nt he t ic
Perc
ent
Resid Cat Feed Distillate Gasoline C3/C4
62 39 35 27 21 32API

6
Refinery Configuration A refiner’s choice of crude oil will be influenced by the type of processing units at the refinery. Refineries fall into three broad categories. The simplest is a topping plant, which consists only of a distillation unit and probably a catalytic reformer to provide octane. Yields from this plant would most closely reflect the natural yields from the crude processed. Typically only condensates or light sweet crude would be processed at this type of facility unless markets for heavy fuel oil (HFO) are readily and economically available. Asphalt plants are topping refineries that run heavy crude oil because they are only interested in producing asphalt. The next level of refining is called a cracking refinery. This refinery takes the gas oil portion from the crude distillation unit (a stream heavier than diesel fuel, but lighter than HFO) and breaks it down further into gasoline and distillate components using catalysts, high temperature and/or pressure. The last level of refining is the coking refinery. This refinery processes residual fuel, the heaviest material from the crude unit and thermally cracks it into lighter product in a coker or a hydrocraker. The addition of a fluid catalytic cracking unit (FCCU) or a hydro cracker significantly increases the yield of higher-valued products like gasoline and diesel oil from a barrel of crude, allowing a refinery to process cheaper, heavier crude while producing an equivalent or greater volume of high-valued products. Hydrotreating is a process used to remove sulphur from finished products. As the requirement to produce ultra low sulphur products increases, additional hydrotreating capability is being added to refineries. Refineries that currently have large hydrotreating capability have the ability to process crude oil with a higher sulphur content. Figure 4 demonstrates that using the same crude input (heavy crude with a 27 API) yields a very different range of petroleum products depending on the refining units and processes used. In the case of the cracking refinery, the addition of other blending materials at various stages of production is required but the resulting volumetric output is greater than the volume of the crude oil input. Each refinery is unique due to age / technology and modifications over time, but generalizations are possible. The installation of additional conversion capability increases the yield of clean products and reduces the yield of heavy fuel oil. However, increased conversion capability would generally result in higher energy use and, therefore, higher operating costs. These higher operating and capital costs must be weighed against the lower cost of the heavier crude oil. Canada has primarily cracking refineries. These refineries run a mix of light and heavy crude oils to meet the product slate required by Canadian consumers. Historically, the abundance of domestically produced light sweet crude oils and a higher demand for distillate products, such as heating oil, than in some jurisdictions reduced the need for upgrading capacity in Canada. However, in more recent years, the supply of light sweet crude has declined and newer sources of crude oil tend to be heavier. Many of the Canadian refineries are now being equipped with

7
upgraders to handle the heavier grades of crude oil currently being produced.1 Appendix 1 provides a profile of the refineries in Canada, their age, current capacity and configuration.
Figure 4 Comparison of Yields by Refinery Type
“Heavy Crude Oil Example”
Source: NRCan Product Slate Refinery configuration is also influenced by the product demand in each region. Refineries produce a wide range of products including: propane, butane, petrochemical feedstock, gasolines (naphtha specialties, aviation gasoline, motor gasoline), distillates (jet fuels, diesel, stove oil, kerosene, furnace oil), heavy fuel oil, lubricating oils, waxes, asphalt and still gas. Nationally, gasoline accounts for about 40% of demand with distillate fuels representing about one third of product sales and heavy fuel oil accounting for only eight percent of sales. Total petroleum product demand is distributed almost equally across the regions, with Atlantic/Quebec, Ontario and the West each accounting for about one third of total sales. However, the mix of products varies quite significantly among the regions.2 In the Atlantic provinces, where furnace oil (light heating oil) is the primary source of home heating, distillate fuels make up 40% of product demand, and heavy fuel oil, used to generate electricity, accounts for another 24%. Gasoline sales account for less than 30% of product demand.
1 Source: NRCan surveys 2 Source: Statistics Canada “The Supply and Disposition of Refined Petroleum Products in Canada” (45-004)
-20
0
20
40
60
80
100
120
Topping Cracking Coking/Cracking
Perc
ent
Other HFO Distillate Gasoline C3/C4

8
In Quebec, where natural gas and hydroelectricity are prevalent, distillate fuel has a 34% share of sales and gasoline is about 40%. Similarly, in Ontario, gasoline sales outpace distillate sales and account for more than 45% of total product demand, with distillates at less than 30%. In Western Canada, agricultural use is one of the primary drivers behind distillate demand and gasoline and distillate each account for about 40% of total petroleum product sales. These regional differences in product demand have influenced the configurations of the refineries in each area. By comparison, in the U.S., the demand for gasoline is much larger than distillate demand and, therefore, refiners configure their installations to maximize gasoline production. Gasoline sales account for nearly 50% of demand while distillate sales account for less than 30% of product demand. In several Western European countries, most notably Germany and France, policies exist that encourage the use of diesel engines creating a much stronger distillate component. Gasoline accounts for less than 20% of petroleum product sales in Europe. The US refineries are configured to process a large percentage of heavy, high sulphur crude and to produce large quantities of gasoline, and low amounts of heavy fuel oil. U.S. refiners have invested in more complex refinery configurations, which allow them to use cheaper feedstock and have a higher processing capability. Canada’s refineries do not have the high conversion capability of the US refineries, because, on average, they process a lighter, sweeter crude slate. Canadian refineries also face a higher distillate demand, as a percent of crude, than those found in the U.S. so gasoline yields are not as high as those in the US, but are still significantly higher than European yields. The relationship between gasoline and distillate sales can also create challenges for refiners. A refinery has a limited range of flexibility in setting the gasoline to distillate production ratio. Beyond a certain point, distillate production can only be increased by also increasing gasoline production. For this reason, Europe is a major gasoline exporter, primarily to the U.S. Refinery Utilization Another critical component of refining economics is the utilization rate, or how efficiently the refining complex is operating. The Canadian refining sector has undergone significant rationalization in the last three decades. In the early 1970s, there were 40 refineries in Canada. Since that time several factors have contributed to a major rationalization of company operations. The oil price shocks in 1973 and 1979 led to improvements in the efficiency of vehicles and to fuel switching from oil to natural gas and electricity. This curbed the demand for petroleum products and resulted in a substantial surplus of refining capacity. The spare capacity resulted in increased competition among refiners, which further eroded refining margins. Less efficient, smaller refiners were closed, sometimes in favor of new larger facilities. Weak economic conditions in the early 1980s put additional pressure on the industry to rationalize their operations, resulting in a significant number of refinery closures. Today there

9
are 19 refineries producing petroleum products in Canada. However, due to expansions at the remaining refineries over the last decade, current refining capacity in Canada is greater than it was in the 1970s. In recent years, growth in the demand for petroleum products has led to an improvement in capacity utilization, increasing operating efficiency and reducing costs per unit of output. As a result, refinery utilization rates have been above 90% nationally for six of the last ten years. A utilization rate of about 95% is considered optimum as it allows for normal shut downs required for maintenance and seasonal adjustments. Refinery capacity is based on the designed size of the crude distillation unit(s) of a refinery (often referred to as nameplate capacity). Occasionally, through upgrades or de-bottlenecking procedures, refineries can process more crude than the nameplate size of the distillation unit would indicate. In such cases, a refinery is able to achieve a utilization rate greater than 100 percent for short periods of time Environmental initiatives Not all investment decisions are driven by refinery economics. Refiners also make investment decisions because of voluntary actions or legislative and regulatory requirements. In recent years, governments and industry have directed considerable effort towards reducing the environmental impact of burning fossil fuels. Many of the initiatives have been aimed at providing ‘cleaner’ fuels for Canadians. Petroleum refining is a very complicated and capital-intensive industry. New environmental regulations require industry to make additional investments to meet the more stringent standards. Since 1990, the refining industry has undertaken a number of environmental initiatives, both on a voluntary basis and in order to meet new federal regulations. These include: $ Summer time gasoline volatility was reduced voluntarily in all areas of Canada as a
means of reducing the evaporative emissions from vehicles. In some areas of Ontario, Quebec and British Columbia provincial regulations now mandate low volatility gasoline during summer months.
$ Low sulphur diesel was voluntarily introduced at all retail and card-lock locations in
1994 and was mandated in January 1998 by Environment Canada for all on-road use. $ The “Benzene in Gasoline Regulation” reduced the benzene content in gasoline to less
than 1% beginning in July 1999. $ Environment Canada’s annual National Pollutant Release Inventory (NPRI) was initiated
in 1993 for the purpose of tracking trends in the releases and transfers to the environment of some 176 substances (now expanded to 272 substances). To reduce volatile organic compound emissions refineries have voluntarily adopted the Canadian Council of Ministers of the Environment (CCME) Codes of Practice on Leak Detection and Repair

10
(LDAR) programs and Aboveground Storage Tanks. The Canadian Petroleum Products Institute (CPPI) reports that their members have decreased their total releases of substances by 60 percent.
$ CPPI refiners have participated in the Canadian Industry Program for Energy
Conservation (CIPEC) to reduce the Energy Intensity Index (EII) at their facilities. CPPI reported an EII value of 93.0 for 2003 versus 113.3 in 1990, a reduction of more than 17%. In 2000 CPPI members extended their commitment to reduce their EII by 1% per annum thru to 2005.
$ Regulations reduced the sulphur content of gasoline to 30 ppm by January 1, 2005 and
will further reduce the sulphur content in on-road diesel to 15 ppm by June 1, 2006. $ A number of provinces have announced ethanol mandates that will come into effect over
the next several years. The requirement to blend a certain percentage of ethanol into motor gasoline will necessitate retooling of some refineries in order to make the required blending component. In addition, the use of ethanol in gasoline will require investments to establish dedicated storage tanks at terminals and make the required modifications to the fuel distribution network.
$ During the last decade, substantial improvements were also made in point source
emissions to air, water and land as required by provincial regulations and permits. Although not all of the costs associated with these initiatives are well defined, it is expected that investments in the neighbourhood of $6 billion will be required for refinery modifications associated with existing and anticipated sulphur regulations alone. Some of these projects also resulted in increased overall production capacity of the facility. However, these decisions cannot be made in isolation either. Most refiners still need to manage their cash flow and account for their investment decisions to their shareholders. Faced with enormous capital investments to meet new environmental regulations, refiners are faced with the decision of whether to make these investments or close their refineries. For example, PetroCanada chose to close its refinery in Oakville in 2005 and expand its Montreal facility rather than invest in the required upgrades at both locations to meet the sulphur in gasoline regulations. In future years, Canadian refineries will be under increasing pressure to reduce costs to remain economically viable. Environmental decisions will need to made in that context.

11
Petroleum Product Supply and Demand The Persian Gulf War drove oil prices up in 1990-91, dampening demand and leading to a economic downturn. Since 1992 demand for petroleum products has been growing steadily at a rate of about 1 percent per year. However, product demand is a moving target and the demand for each product does not always grow at the same pace. Gasoline demand has increased slightly in most of the last 10 years. The distillate demand (diesel oil, furnace oil and kerosene), driven primarily by on-road diesel requirements, dipped during the economic recession in 1991-92 but has been the fastest growing component since 1993. Because of the significant proportion of distillate demand that comes from the trucking industry, this component is the most closely linked with economic activity. Some of the distribution challenges arise from the fact that petroleum products are refined in only a few geographic regions but they are consumed all across Canada. Of the western provinces, only Alberta and Saskatchewan produce more products and they consume. Manitoba and parts of British Columbia and most of the territories are supplied primarily from the three refineries in Edmonton. (Figure 5)
Figure 5 Refined Petroleum Product Production vs. Sales
Quebec and Ontario together are close to being in balance with significant volumes moving from Quebec to Ontario since the closure of the Oakville refinery. Atlantic Canada is a major exporter
0
5
10
15
20
25
30
35
40
Other Provincesand Territories
Alberta Ontario Quebec AtlanticProvinces
Mill
ions
of C
ubic
Met
res
Refinery Production Domestic SalesSource: Statistics Canada 45-004, 2004

12
of petroleum products. However, even the provinces that are self-sufficient must still move petroleum products over long distances to supply all of their customers. Figure 6 illustrates how far product is moved in Canada. Western refineries supply all product demand from Vancouver to Thunder Bay, including the northern territories. Refiners in southern Ontario move product to Sault Ste-Marie, northern Ontario and as far east as Ottawa. Montreal and Quebec City facilities supply the St Lawrence River corridor from Toronto to the Gaspé Peninsula, as well as the more remote areas of northern Quebec and occasionally parts of the Arctic. Petroleum products from the three Atlantic refineries find their way to the Arctic and Hudson Bay regions as well as the U.S. eastern seaboard.
Figure 6 Refinery Supply Orbits
Logistics The logistics network required to supply petroleum products from the refineries to the end-users is a complex system of pipelines, ships, railways and trucks. Often several methods of transportation are utilized to move petroleum products from the refineries, ports and large terminals to tremendously disperse markets all across Canada. The long distances and variety of transportation modes used can pose challenges for the refiners who must maintain strict product specifications. Degradation or contamination of product in transit can result in costly re-processing at the delivery point if the integrity of the distribution system is not carefully monitored. This is increasingly important as environmental regulations result in cleaner and more stringent product characteristics.
11

13
Product Exchanges In order to reduce transportation costs and to capitalize on increasing economies of scale, refiners enter into a large number of product exchange agreements with one another. Product exchanges occur when one refiner provides another refiner with specific products in a certain location in exchange for a similar quality and volume of products in another location. Product exchanges significantly reduce the volumes and distances over which products are moved, thereby considerably reducing transportation costs and environmental exposure. These agreements have not only allowed the industry to consolidate their operations at the refinery level but have also led to a consolidation of local product terminals. It is no longer unusual to purchase gasoline from a branded outlet that was produced by one of its main competitors. In cases where product exchanges are not available, companies need to make other arrangements to supply their terminals and retail networks. The method of transportation they select to move their products will be influenced by several factors. Geographic barriers are a major concern as well as the volume of products demanded in each of these markets and the relative costs of transportation. Each mode of transportation has its own inherent strengths and weaknesses. Refineries to Terminals Product terminals are more widely distributed than refineries and are generally located near major markets. Pipelines are the safest, most reliable and cost-effective way of transporting the large volume of petroleum products that must be moved throughout Canada each day. However, the enormous capital cost associated with constructing pipelines limits their use to locations where very large volumes of product are to be moved for an extended period of time. The payback period for these projects is often 15-20 years or greater. Where the volume of petroleum products cannot justify the construction of a pipeline, petroleum products are transported to terminals across land by truck and rail and over water by marine tanker. In Atlantic Canada, all petroleum product terminals are serviced by marine tanker. In other areas of Canada, railways and trucks are much more important. Although transportation by truck is the most expensive transportation method, it is also the most flexible. Highway truck tankers transport all gasoline from the terminals or refinery truck loading facilities (commonly referred to as "racks") to underground storage tanks at each retail outlet. Most of Canada’s refined petroleum product distribution network is operated by three national oil companies (Shell, PetroCanada, and Imperial Oil) and a handful of regional refiners (Irving Oil, Ultramar, Suncor Energy, Federated Co-op, Husky and Chevron). With only a few exceptions, all products terminals are owned and operated by one of these companies. The Canadian downstream petroleum industry can be broken into three distinct regions: Western Canada, Ontario and Quebec/Atlantic Canada. Although some product movements do occur between regions, such as shipments from Quebec refiners into Ontario, each of these regions has historically been self-sufficient. In 2005 Ontario shifted to a net import position with the closure of the Oakville refinery and increased product movements from Quebec refineries.

14
Product imports can play a significant role in satisfying petroleum product demand in Canada. The availability of both crude oil and petroleum product imports in every region hinges on geographic constraints. Some regions are better suited than others to accommodate imported products. Each area has its own natural features and this creates some unique situations. Atlantic/Quebec In the Atlantic/Quebec region, product movements from refineries to terminals occur primarily by ship. An exception is the unit train employed by Ultramar to move product from their refinery near Quebec City to Montréal. Ultramar is currently planning to build a pipeline from the St.-Romuald refinery across the river from Quebec City to east-end Montreal to be operated in conjunction with the unit trains. Terminal locations are governed by proximity to markets and alternative transportation modes. This region provides an excellent example of product exchanges as Imperial Oil and Irving Oil provide refined petroleum products to Shell, PetroCanada and Ultramar at Atlantic terminals in exchange for similar quantities of product in Montreal and Quebec City. Because of their connection via major waterways, Atlantic Canada and Quebec have good access to imports from the northeastern U.S. and Europe. As a result there are a number of major independent marketers who import petroleum products into Montreal for sale in the Quebec and Ontario markets. Ontario Product movements from refineries to terminals within Ontario are primarily done by pipeline, although some movements by marine are made into Sault Ste Marie and Thunder Bay. Thunder Bay is also supplied by rail from Winnipeg, and Sault Ste-Marie is partially supplied by rail and ship from Quebec. Eastern Ontario (Cornwall and Ottawa) obtains a large amount of their supply from Montréal via the Trans Northern Pipeline (TNPL). Three product pipelines, two from Sarnia refineries and the TNPL from Montréal, supply the Toronto area. Toronto is one location where essentially all refiners maintain terminals due to the large demand for products in the area. In 2005 the Toronto to Cornwall section of TNPL was reversed to allow product to move from Quebec refineries all the way into Toronto. Ontario also has access to supplies from large U.S. markets and can also bring in cargos via the St. Laurence Seaway from Quebec, Atlantic or offshore refineries. However, logistical constraints, such as the size of ships that can navigate the Seaway and the seaway-shipping season, increase the cost of these supplies. Other modes of transportation, such as pipeline, unit train and trucking, are necessary to bring in products from other regions. Western Canada Most of Western Canada is landlocked, and as such, has very limited access to supplies from other regions. Only B.C. has access to imported product as the current infrastructure was not designed to transport supplies to the Prairies from other regions. However, the Edmonton refineries supply petroleum products into the Vancouver market via the TransMountain pipeline

15
(TMPL). In the event of a supply shortage in the Prairies, these Alberta refiners have the ability to balance supply and demand by importing product into Vancouver from Washington State, freeing up additional Edmonton production for consumption in prairie markets. Product movements from refineries to terminals in the West are primarily done by pipeline. Movement by rail to the territories, B.C. interior and to Thunder Bay in western Ontario also occurs. Barges carry product from Vancouver to terminals on Vancouver Island and along the coast and from terminals in the Northwest Territories to more northern locations along the MacKenzie River. Edmonton refineries provide about 50-60% of the petroleum product needs in the Vancouver market. The rest of the Vancouver area is supplied either by the Chevron refinery in Vancouver, or with product imports from the U.S. The West has some unique dual product pipelines. Enbridge Line 1 pipeline from Edmonton, Alberta, to Gretna, Manitoba, ships refined products plus natural gas liquids (NGLs) and synthetic crude. TMPL from Edmonton to Vancouver ships refined products plus all types of crude oil. The crude oil leaves deposits of substances, like sulphur, on the pipeline wall as it passes through the pipeline. These can be picked up by the clean products like gasoline that follow the crude oil through the line. Gasoline shipped via TMPL to Vancouver must undergo further treating prior to sale to remove impurities picked up in transit. Terminals As a result of the significant rationalization of terminals over the last 20 years, in some markets, only one terminal exists and all marketers load at that terminal. From these local terminals, petroleum products are trucked to retail / customer sites. Each product has a different delivery system from the terminal depending on the customer base. For example, jet fuel is often moved by pipeline directly to the airport. Diesel fuel is distributed through retail outlets, large commercial card lock facilities where trucking companies can fill up at unattended distribution sites, or by truck delivered directly to customer tankage. Furnace oil is distributed from the terminal directly to home heating customers. Gasoline, the most visible and widely used of all the products, has the most dispersed distribution network. Before the gasoline leaves the terminal, some gasoline retailers will add performance and detergent additives to distinguish their brand from those of their competitors. The formula for each additive package is unique to that specific brand. As many companies pick up product from the same terminal, the proprietary additives are generally added at the terminal and are the only way to differentiate gasoline at retail outlets. Ethanol, and ethanol-blended gasoline, because of its ability to pick up water, cannot be transported by pipeline. Ethanol can be shipped by railcar or truck but must be blended at the terminal for those locations supplied by marine or pipeline. Dedicated tanks are required to store the ethanol and the gasoline-blending component with which it will be mixed. The handling of ethanol-blended fuels also requires modifications to other aspects of the fuel distribution system,
16
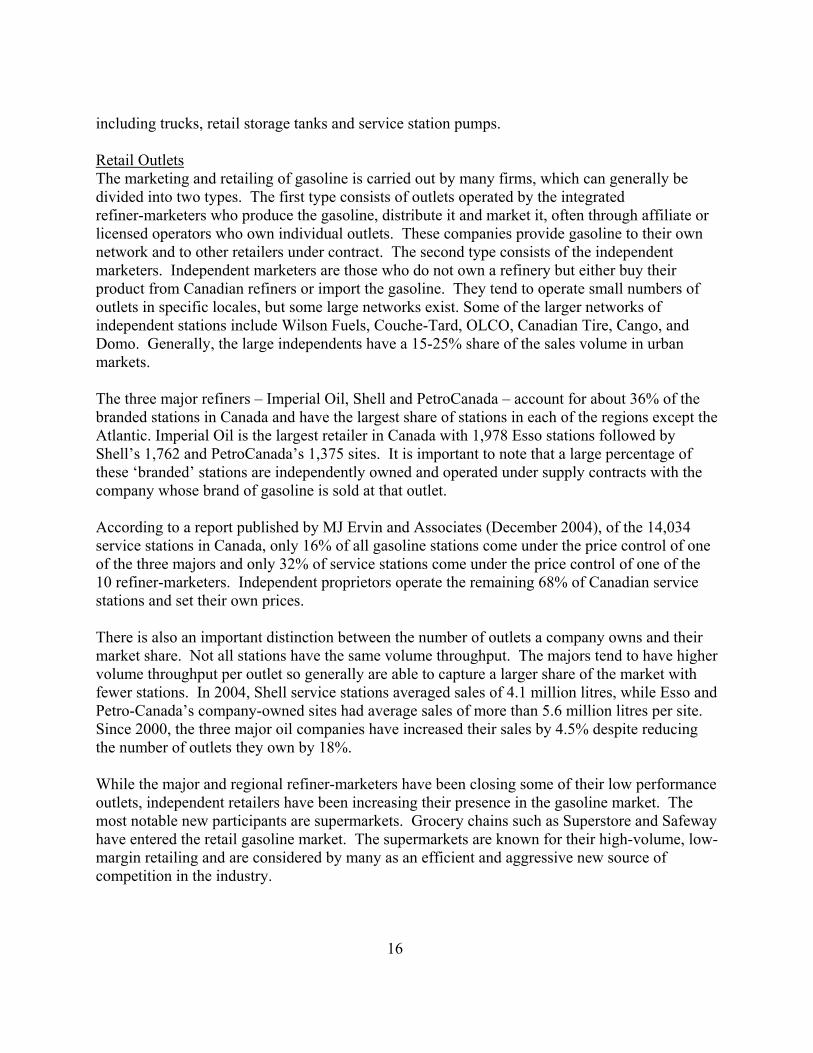
including trucks, retail storage tanks and service station pumps. Retail Outlets The marketing and retailing of gasoline is carried out by many firms, which can generally be divided into two types. The first type consists of outlets operated by the integrated refiner-marketers who produce the gasoline, distribute it and market it, often through affiliate or licensed operators who own individual outlets. These companies provide gasoline to their own network and to other retailers under contract. The second type consists of the independent marketers. Independent marketers are those who do not own a refinery but either buy their product from Canadian refiners or import the gasoline. They tend to operate small numbers of outlets in specific locales, but some large networks exist. Some of the larger networks of independent stations include Wilson Fuels, Couche-Tard, OLCO, Canadian Tire, Cango, and Domo. Generally, the large independents have a 15-25% share of the sales volume in urban markets. The three major refiners – Imperial Oil, Shell and PetroCanada – account for about 36% of the branded stations in Canada and have the largest share of stations in each of the regions except the Atlantic. Imperial Oil is the largest retailer in Canada with 1,978 Esso stations followed by Shell’s 1,762 and PetroCanada’s 1,375 sites. It is important to note that a large percentage of these ‘branded’ stations are independently owned and operated under supply contracts with the company whose brand of gasoline is sold at that outlet. According to a report published by MJ Ervin and Associates (December 2004), of the 14,034 service stations in Canada, only 16% of all gasoline stations come under the price control of one of the three majors and only 32% of service stations come under the price control of one of the 10 refiner-marketers. Independent proprietors operate the remaining 68% of Canadian service stations and set their own prices. There is also an important distinction between the number of outlets a company owns and their market share. Not all stations have the same volume throughput. The majors tend to have higher volume throughput per outlet so generally are able to capture a larger share of the market with fewer stations. In 2004, Shell service stations averaged sales of 4.1 million litres, while Esso and Petro-Canada’s company-owned sites had average sales of more than 5.6 million litres per site. Since 2000, the three major oil companies have increased their sales by 4.5% despite reducing the number of outlets they own by 18%. While the major and regional refiner-marketers have been closing some of their low performance outlets, independent retailers have been increasing their presence in the gasoline market. The most notable new participants are supermarkets. Grocery chains such as Superstore and Safeway have entered the retail gasoline market. The supermarkets are known for their high-volume, low-margin retailing and are considered by many as an efficient and aggressive new source of competition in the industry.

17
Inventory Levels To provide added flexibility to the distribution of petroleum products, refiners and marketers maintain inventories of the various products in strategic locations throughout the distribution chain. If supplies of imported or domestic crude oil were interrupted for any reason, or if the product distribution system failed, companies would rely on commercial inventories to meet short-term needs while alternate arrangements were being made. Canadian crude oil and petroleum product inventories have been relatively stable for the last five years. Inventory levels for some products, such as gasoline and furnace oil, fluctuate significantly over the year. Demand for these products is very seasonal and at its peak can exceed the production capacity of refineries. Therefore, refiners need to anticipate the peak consumption periods by building inventories in advance. Gasoline inventories increase during the first quarter of the year and are used during the summer months to supplement refinery production. Furnace oil stocks grow during the fall and are drawn during the coldest months of winter when demand is at its highest level. Refiners also build up inventories of all products in advance of scheduled refinery maintenance (called turnarounds). Turnarounds can vary in frequency from annually to once every few years and sometimes require the refinery to be completely shut down for a period of several weeks. Refiners anticipate this by building up product stocks that can be used during the turnaround. Refiners’ crude oil inventories fluctuate over a very narrow band and are less seasonal than product stocks. There are significant regional variations in crude oil stocks, with refiners in the West, who run domestic crude oil maintaining about 5-7 days of oil, and refiners in eastern Canada who run imported crude oil averaging 15-20 days. Prices The last piece in the supply/demand puzzle is price. Price is the equalizer than ensures supply always meets demand. If demand exceeds supply, prices will rise until either new supplies are attracted to the market or demand is dampened so that equilibrium is achieved. If supply exceeds demand, prices will drop until the market is in balance. From a refiner’s perspective, the price of petroleum products is measured at the refinery gate. The price at which a refiner can sell product at the loading rack is called the rack price. It is rack prices that determine refinery viability in terms of revenue generated from the refining process. Because of the ability to move product to the market where the highest price is found, most petroleum product prices are similar from market to market. For example, if the rack price for gasoline was lower in Toronto than it was in Buffalo, refiners in Toronto would choose to ship their product to Buffalo to sell at the higher price, as long as the cost of transporting it to Buffalo was less than the price difference. This would increase the supply in Buffalo and lead to a price

18
decrease until the two markets were in balance. The same would apply in reverse if the Toronto price were higher. Generally, the difference in wholesale prices between two markets can be attributed to the cost of transportation between those two markets. As a result of the integrated nature of North American petroleum product markets, Canadian refiners are price takers and must price their products to compete with the price of imported product delivered to Canada. Even if no products are in fact actually imported, the existence of the import option imposes a certain pricing discipline on local refiners. The price that the consumer pays for a petroleum product depends on the product and how the product will be used. With the exception of automotive fuels, most petroleum products are sold at the wholesale level directly to the consumer of the fuel, usually under contract. The terms of the contracts are considered commercially sensitive and not generally made public. As a result, the prices of these products are less transparent and more difficult to track. Wholesale prices for petroleum products react to a broad range of factors unique to their individual markets. Product prices are influenced by the supply and demand balances as well as the prices of alternative products with which they compete. For example, propane can be used for heating, as an automotive fuel or for agricultural uses like crop drying. A late wet harvesting season in the prairies can overlap with an early cold winter that results in a surge in demand and short-term price spikes. The demand for diesel fuel is directly related to economic activity, which is manifested in increased truck traffic to move goods and services in a robust economy. Diesel oil is also an automotive fuel and can be easily converted to furnace oil for home heating. When all of these uses compete for supply, prices will rise. Automotive fuels are distributed to consumers through retail outlets. The retail price, therefore, includes distribution costs as well as a number of federal and provincial consumption taxes. Retail price can also be used as a tool to attract market share. This kind of competition in the market can lead to significant price wars with some low and volatile consumer prices. When all the factors that can influence prices - supply/demand, crude oil costs, distribution costs, federal and provincial taxes and local market conditions - all come together, retail prices, and to a lesser degree wholesale prices, can vary significantly between markets. Retail Gasoline Prices Gasoline prices can be difficult to understand because they do not behave like the prices of many of the other goods that consumers buy every week. Gasoline is a commodity, like gold or pork bellies, and its wholesale price reacts to a number of factors. The most obvious ones are supply and demand. When there is more demand (in summer when everyone drives more), there is more pressure to ensure that there is sufficient supply to meet demand, so the price goes up. When there is less demand, such as during the winter months, supply and demand are better balanced and prices are generally lower.

19
Over the longer term, demand has been growing each year as drivers choose bigger and bigger vehicles and drive greater distances. This puts pressure on the supply and can also lead to higher prices. Another factor that has the greatest influence on gasoline prices over time is the cost of crude oil, the raw material from which gasoline is made. The supply and demand for crude oil are balanced in a worldwide market, so that every refiner around the world has to pay the world price for oil. When events like the war in Iraq cause concerns over possible supply disruptions, some buyers are willing to pay more for oil to ensure they have adequate supply for their refineries. This pushes up the price for everyone. Both gasoline and crude oil prices also react to commodity markets. Speculators who want to make money buying and selling contracts for oil or gasoline can influence prices with their buying patterns. Recently, the combination of all of these factors has lead to some of the highest prices for crude oil and gasoline in the last 10 years. They have also led to frequent changes in the price that consumers pay at the pump. However, the overriding factor is always the local market. Every gas station owner wants consumers to buy gasoline from them. They will try to attract business by lowering their prices by a small amount. The other stations watch their competitors very closely and will match the lower price almost immediately. This can lead to price wars where prices drop by small amounts over a few days until they reach levels where suppliers are selling gasoline for less than the price that they paid for it. When this happens, one of the suppliers may decide to go back to the original price, which can often be five or ten cents per litre higher. Usually the other stations will follow soon afterward to return to a price that provides some profit. This is called a price restoration. Some markets, where competition is fierce, have one or more price wars every week so prices appear to be constantly changing. Consumers can benefit from price wars because the price they pay is often lower than it would be in a market with less competition. Figure 8 depicts weekly Canada average gasoline prices for the last five years. Prices track the changes in crude oil prices very closely, both the increases and the decreases. However, the higher volatility in gasoline prices indicates the influence of local price wars on the average. In spite of the recent volatility in gasoline markets, once prices are adjusted for inflation, current crude oil and gasoline prices are not significantly different than they were in the early 1980s. Following the sharp decline in crude oil prices in 1986, prices were relatively stable and trended downward in the 1990s. The price increases experienced in the last few years have reached the levels of the early 1980s. On a tax-excluded basis, current gasoline prices are just below the levels seen in the early 1980s. (See Figure 9)

20
Figure 8 Regular Gasoline Pump Prices - Canada Average
(Cents/litre)
Source: NRCan & MJ Ervin
Figure 9
Average Price of Regular Gasoline in Canada Adjusted (2004$)
Source: NRCan & Statistics Canada
0
10
20
30
40
50
60
70
80
90
100Ja
n-98
May
-98
Sep-
98Ja
n-99
May
-99
Sep-
99Ja
n-00
May
-00
Sep-
00Ja
n-01
May
-01
Sep-
01Ja
n-02
May
-02
Sep-
02Ja
n-03
May
-03
Sep-
03Ja
n-04
May
-04
Sep-
04Ja
n-05
May
-05
Gasoline Excluding taxes Edmonton Par crude
0
10
20
30
40
50
60
70
80
90
100
1980
1981
1982
1983
1984
1985
1986
1987
1988
1989
1990
1991
1992
1993
1994
1995
1996
1997
1998
1999
2000
2001
2002
2003
2004
Cen
ts/li
tre
Gasoline Excluding Taxes Crude

21
Summary The downstream petroleum sector is complex and highly competitive. Each petroleum product in each regional market reacts to a different set of supply/demand and transportation pressures. Refiners must balance a number of competing factors in deciding what type of crude oil to process, what kind of equipment to investment in and what range of products to manufacture. These decisions are also influenced by the need to operate in a sustainable and environmentally responsible manner. The viability of the industry depends on its ability to earn an acceptable rate of return for its investors in a marketplace where prices are set by international (wholesale) and local (retail) markets.

22
APPENDIX 1
Company Location Year Built Current Capacity Typem3/d (June 2005)
ATLANTIC
Imperial Oil Dartmouth, NS 1918 13,992 CrackingIrving Oil Saint-John, NB 1960 44,517 CrackingNorth Atlantic Refining Come-by-Chance, NFLD 1973 16,700 CrackingAtlantic Total 75,209
QUEBEC
Petro-Canada Montreal, QB 1955 20,635 CrackingShell Montreal, QB 1933 20,700 CrackingUltramar St-Romuald, QB 1971 33,000 CrackingQuebec Total 74,335
ONTARIO
Imperial Oil Nanticoke, ON 1978 17,800 CrackingImperial Oil Sarnia, ON 1897 19,200 CokingShell Sarnia, ON 1952 11,100 CrackingSuncor Sarnia, ON 1953 13,500 HydrocrackingNova Chemicals * Sarnia, ON 1977 12,700 Topping (Petrochemicals)Ontario Total 74,300
PRAIRIES
Coop/Newgrade Regina, SK 1935 13,500 Hydrocracking/CokingHusky (upgrader)* Lloydminister, AB 1947 4,000 Topping (Asphalt)Imperial Oil Edmonton, AB 1975 28,600 CrackingPetro-Canada Edmonton, AB 1971 21,929 CokingMoose Jaw Asphalt* Moose Jaw, SK 2,400 Topping (Asphalt)Shell Scotford, AB 1984 20,000 Hydrocracking/CokingPrairies Total 90,429
BRITISH COLUMBIA
Chevron Burnaby, BC 1936 8,300 CrackingHusky Prince George, BC 1967 1,800 CrackingBritish Columbia Total 10,100
CANADA GRAND TOTAL 324,373
* refinery does not produce the full range of petroleum products
Canadian Refineries