Overview of ME-PDG Program · 2 M-E Pavement Design Program • Available from the web atAvailable...
28
1 FDOT MECHANISTIC EMPIRICAL FDOT MECHANISTIC-EMPIRICAL PAVEMENT DESIGN UPDATE Project Manager Bruce Dietrich, P.E., FDOT Researchers Emmanuel Fernando, TTI Jeongho Oh, TTI Overview of ME-PDG Program
Transcript of Overview of ME-PDG Program · 2 M-E Pavement Design Program • Available from the web atAvailable...

1
FDOT MECHANISTIC EMPIRICALFDOT MECHANISTIC-EMPIRICAL PAVEMENT DESIGN UPDATE
Project Manager Bruce Dietrich, P.E., FDOT
ResearchersEmmanuel Fernando, TTIJeongho Oh, TTI
Overview of ME-PDG Program

2
M-E Pavement Design Program
• Available from the web at• Available from the web at http://www.trb.org/mepdg/ for evaluation
• Program is a tool for pavement analysis
• M difi ti i i f th• Modifications arising from other research are expected
• Consider need for calibration during implementation
General Information- Site/Project Identification
Analysis Status
Inputs-Traffic-Climatic-Structure
Input & OutputSummary

3
Model Verification/Calibration
• M E PDG models calibrated using a• M-E PDG models calibrated using a national data base of LTPP sections
• Calibration to local conditions is important
• Calibration factors input to programCalibration factors input to program for specific distresses
Model Calibration Factors

4
Map of Calibration Sections
B df d (1 0)
Gadsden (1,1)
Polk (2 ,1)
St.Johns (0,1)
Bradford (1,0)
Alachua (1,0)Santa Rosa (1,0)
Palm Beach(2 0)
Lake (0,1)Seminole (1,0)
Volusia (1,0)
Hillsborough (2,3)
Pinellas (0,4)
15 HMAC sections
Charlotte (0,1)
Polk (2 ,1)
Broward (1,0)
(2,0)
Monroe (1,0) Dade (1,4)
16 PCC Sections
FIELD AND LABORATORY TESTS
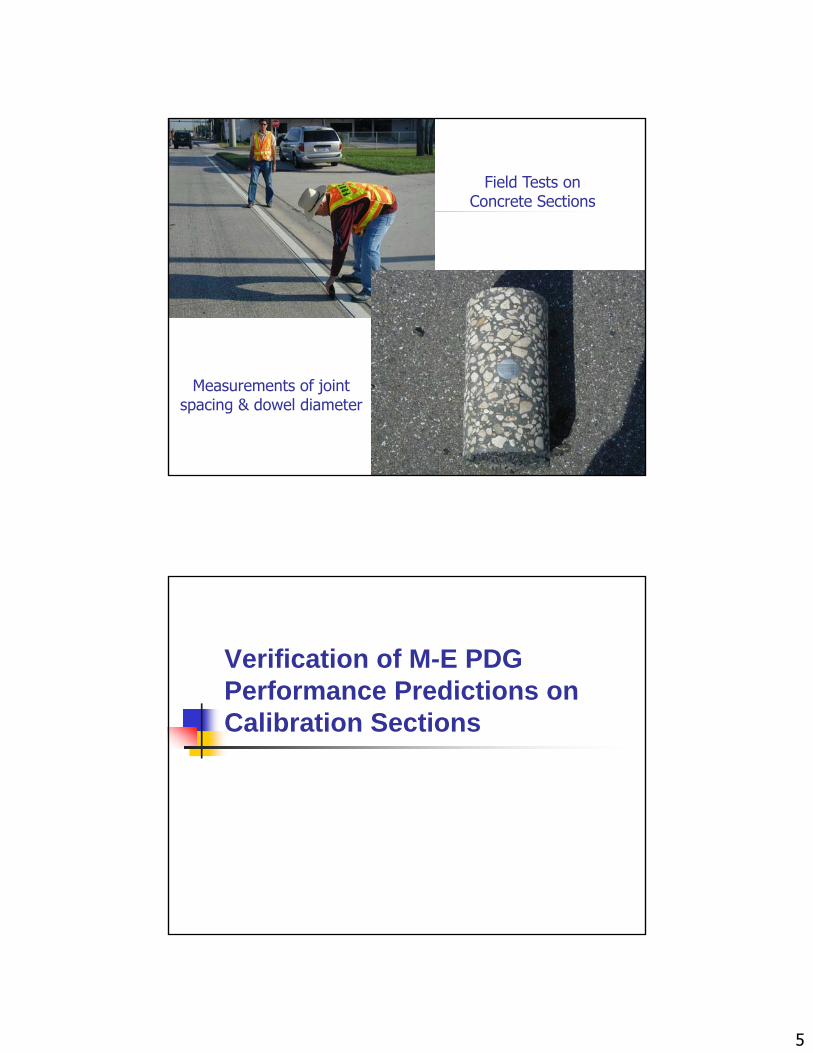
5
Field Tests on Concrete Sections
Measurements of joint spacing & dowel diameter
Verification of M-E PDG Performance Predictions onPerformance Predictions on Calibration Sections

6
Transverse Cracking on Calibration Sections
100
40
60
80
Tran
sver
se C
rack
ing
(%)
0
20
0 20 40 60 80 100
Measured Transverse Cracking (%)
Pred
icte
d T
IRIs on Calibration Sections

7
Faulting on Calibration Sections
Failure Criteria for Generating Design Tables
Distress Criterion
Transverse cracking 10 percent slabs cracked
Faulting 0.12 inch
IRI 180 in per mile

8
Locations Considered inLocations Considered in Comparisons of Rigid Pavement Cross-Sections
Findings from Comparisons of Rigid Pavement Cross-Sections
• Cross sections 2 and 3• Cross-sections 2 and 3 gave same slab thicknesses
• These cross-sections gave up to 0.5-inch thicker slabs than the otherslabs than the other cross-sections
• Rigid design tables based on cross-section 3

9

10
Effect of Slab Width• Performance predictions compared• Performance predictions compared
for 12, 13 and 14 ft slab widths• M-E PDG predicts better performance
for 13-ft wide slab with tied shoulders
• Design tables for 13 ft wide slabs developed
Consideration of Regional Conditions• Used M E PDG data base to• Used M-E PDG data base to
characterize climatic conditions in each county
• Used soil-water characteristic curves established from county soil survey y yreports and soil suction tests done in the laboratory

11
95% reliability and 50 M Design ESALs
Map of Design Slab Thicknesses
SENSITIVITY ANALYSIS

12
Sensitivity to Base Modulus100
40
60
80
cent
Cra
cked
Sla
b
0
20
0 2 4 6 8 10 12 14 16 18 20
Year
Per
40 ksi 50 ksi 60 ksi
Sensitivity to Subgrade Modulus
100
40
60
80
cent
Cra
cked
Sla
b
0
20
0 2 4 6 8 10 12 14 16 18 20
Year
Perc
15 ksi 25 ksi 35 ksi

13
Effect of k-value
Effect of CTE on Crack Predictions
30
15
20
25
ckin
g (%
) at 9
5% re
liabi
lity
0
5
10
0 50 100 150 200 250 300
Month
Tran
sver
se c
ra
5.5 per F*10-66.0 per F*10-66.5 per F*10-6

14
Effect of CTE on Ride Predictions
Coefficient of thermal expansion
Effect of Concrete Compressive Strength
40
20
25
30
35
acki
ng (%
) at 9
5% re
liabi
lity
0
5
10
15
0 50 100 150 200 250 300
Month
Tran
sver
se c
ra
3000 psi4000 psi5000 psi

15
Effect of Slab Width30
15
20
25
acki
ng (%
) at 9
5% re
liabi
lity
0
5
10
0 50 100 150 200 250 300
Month
Tran
sver
se c
ra
12 ft13 ft14 ft
Effect of Slab Length

16
M-E PDG Rigid PavementM E PDG Rigid Pavement Design Tables
Design Assumptions
• CTE of 6 microstrain per °F• CTE of 6 microstrain per °F• 28-day compressive strength: 4000
psi• Slab widths: 13 and 14 ft• Joint spacing: 15 ft• Joint spacing: 15 ft• Subgrade k-value: 200 lb per in3
• Initial IRI: 58 inches per mile

17
Design Assumptions
• Minimum slab thickness of 8 inches• Minimum slab thickness of 8 inches• Dowel diameters:
1 inch for 8 to 8.5-inch slabs1.25 inches for 9 to 10.5-inch slabs1.5 inches for 11-inch and thicker slabs1.5 inches for 11 inch and thicker slabs
Sensitivity to CTE80
20
30
40
50
60
70
erce
nt S
labs
Cra
cked
μ − 2σμμ + 2σ
0
10
20
Andes
iteBas
alt
Diabas
e
Granite
Schist
Chert
Dolomite
Limes
tone
Quartz
ite
Sands
tone
Aggregate Type
Pe
from Mallela et al.

18
Effect of Initial IRI120
60
80
100
mile
) at 9
5% re
liabi
lity
0
20
40
0 50 100 150 200 250Month
IRI (
in/m
50 in/mile58 in/mile65 in/mile
Implementation Considerations• Predicted performance sensitive to CTE• Predicted performance sensitive to CTE• Need to develop and implement specs to
measure and control CTEs for construction quality assurance purposes
• Predicted performance also sensitive to initial IRIinitial IRI
• Need ride specification to get desired initial smoothness

19
Establishing Preliminary Flexible Pavement Design Tablesg
Bruce Dietrich, P.E.E G Fernando Ph D P EE.G. Fernando, Ph.D., P.E.Jeongho Oh, Ph.D., P.E.
Sensitivity AnalysisVariables considered in New AC
AC Mix combination, AC material propertyModulus of Base, Subgrade and EmbankmentThickness of Base Cumulative ESALsEnvironmental RegionReliability

20
Climatic Effect on Alligator Crack of AC Pavements
40
15
20
25
30
35ac
king
(%) a
t 95%
relia
bilit
y
0
5
10
15
0 50 100 150 200 250 300
Month
Alli
gato
r cra
MiamiTallahassee
Base Modulus Effect on Alligator Crack of AC Pavements
60
30
40
50
acki
ng (%
) at 9
5% re
liabi
lity
0
10
20
0 50 100 150 200 250 300
Month
Alli
gato
r cra
30 ksi 45 ksi60 ksi
21
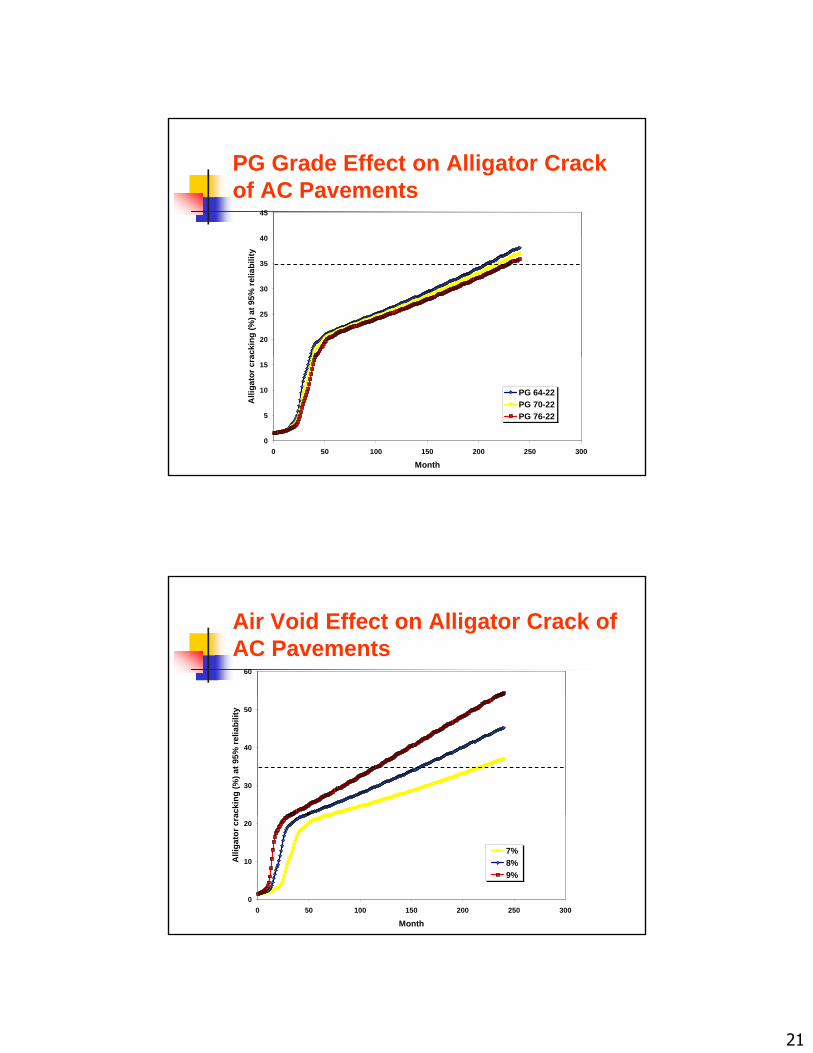
PG Grade Effect on Alligator Crack of AC Pavements
40
45
20
25
30
35
40
acki
ng (%
) at 9
5% re
liabi
lity
0
5
10
15
0 50 100 150 200 250 300
Month
Alli
gato
r cra
PG 64-22PG 70-22PG 76-22
Air Void Effect on Alligator Crack of AC Pavements
60
30
40
50
acki
ng (%
) at 9
5% re
liabi
lity
0
10
20
0 50 100 150 200 250 300
Month
Alli
gato
r cra
7%8%9%

22
Base Thickness Effect on Alligator Crack of AC Pavements
40
15
20
25
30
35ac
king
(%) a
t 95%
relia
bilit
y
0
5
10
15
0 50 100 150 200 250 300
Month
Alli
gato
r cra
10 inch
15 inch
Embankment Modulus Effect on Alligator Crack of AC Pavements
40
15
20
25
30
35
acki
ng (%
) at 9
5% re
liabi
lity
0
5
10
15
0 50 100 150 200 250 300
Month
Alli
gato
r cra
8 ksi10 ksi12 ksi

23
ESAL Effect on Alligator Crack of AC Pavements
40
15
20
25
30
35ac
king
(%) a
t 95%
relia
bilit
y
0
5
10
15
0 50 100 150 200 250 300
Month
Alli
gato
r cra
TTC 6 with AADTT=11250TTC 1 with AADTT=8600TTC 14 with AADTT = 16000
50 Million ESALs
AC Mix Effect on Alligator Crack of AC Pavements
Mi t C bi ti FC 5 FC 9 5 FC 12 5Mixture Combination FC 5 FC 9.5 FC 12.5
SP 9.5 42.27 41.64 41.81
SP 12.5 42.27 41.64 41.81
SP 19.0 41.99 41.34 41.64
Modified SP 41.27 40.64 40.91

24
Criteria of Preliminary Design Table for New Construction
1-inch FC 12.5
SP 12.5
10-inch LR Base
12-inch Stab.
Only alligator cracking criterion (35%, which is a default limit)FC 12.5 over SP 12.5 AC mixtureBase modulus = 30, 45, and 60 ksiSubgrade modulus = 16 ksiEmbankment modulus = 12 ksiMiami weather data used
Subgrade
Embankment
20 yrs design lifeFive reliability levels same as PCCCumulative ESALs considered
Sensitivity Analysis for Overlay
Variables considered in Overlay ACVariables considered in Overlay ACAC Mix combination, AC material propertyModulus of Base, Subgrade and EmbankmentThickness of Base Cumulative ESALsEnvironmental RegionReliabilityExisting Pavement ConditionExisting AC layer thickness after milling

25
Alligator cracking in New vs. Overlay Pavements with Identical Structures
35
40
10
15
20
25
30
35
Bot
tom
-up
Cra
ck (%
) Overlay
Existing
εWhere is from?
0
5
10
0 50 100 150 200 250
Age (Month)
Mean prediction_New Mean prediction_Resurfacing95% Reliability_New 95% Reliability_Resurfacing
εt Where is from?
Alternative Way to Model Overlay
Use new/reconstruction options inUse new/reconstruction options in M-E PDG to model existing and overlay lifts
Vary PG-Grade or Air Void to represent different existing pavement conditions
FDOT Practice
Good: No cracking, minor rutting
Fair: Crack rating ≥ 8
Poor: Crack or rutting rating ≤ 7
FDOT Practice

26
Effect of PG Grading vs. Air Void
40
4560
20
25
30
35
40ra
ckin
g (%
) at 9
5% re
liabi
lity
30
40
50
rack
ing
(%) a
t 95%
relia
bilit
y
0
5
10
15
0 50 100 150 200 250 300
Month
Alli
gato
r cr
PG 64-22PG 70-22PG 76-22
0
10
20
0 50 100 150 200 250 300
Month
Alli
gato
r cr
7%8%9%
Findings from Alternative Approach
We use a fixed PG-Grade for existing layer asWe use a fixed PG Grade for existing layer as PG 70-22
Varying air void of existing layer for different pavement conditions to have comparable overlay thickness to those obtained from FDOT design procedureg p
8.0 percent for poor condition
7.5 percent for fair condition
7.2 percent for good condition

27
Criteria of Preliminary Design Table for Overlay Construction
1 inch FC 12 5 Only alligator cracking criterion 1-inch FC 12.5
Existing SP 12.52 ~ 6 inch
10-inch LR Base
12 inch Stab
y g g(35%, which is a default limit)FC 12.5 over SP 12.5 AC mixtureBase modulus = 30, 45, and 60 ksiSubgrade modulus = 16 ksiEmbankment modulus = 12 ksiMiami weather data used20 yrs design lifeFi li bilit l l PCC
Overlay SP 12.5
12-inch Stab. Subgrade
Embankment
Five reliability levels same as PCCCumulative ESALs considered same as PCCPoor/Fair & Good condition
Comparison of AC Overlay Design Thickness based on FDOT Practice vs. M-E PDG
4.0
4.5
4.0
4.5
50 million ESALs
1.5
2.0
2.5
3.0
3.5
-12.
5) o
verla
y th
ickn
ess
(in) 25 million ESALs
with 2” existing AC
1.5
2.0
2.5
3.0
3.5
-12.
5) o
verla
y th
ickn
ess
(in)
with 4” existing AC
0.0
0.5
1.0
75 80 85 90 95
Reliability (%)
AC
(SP
FDOT_Poor M-E PDG_Poor FDOT_Good M-E PDG_Good
0.0
0.5
1.0
75 80 85 90 95
Reliability (%)
AC
(SP
FDOT_Poor M-E PDG_Poor FDOT_Good M-E PDG_Good

28
Questions?