Overview of Energy Life Cycle Analysis at NETL for Carbon...
45
Overview of Energy Life Cycle Analysis at NETL for Carbon Utilization Technologies Timothy J. Skone, P.E. LCA Webinar for the National Academy of Sciences, Engineering, and Medicine December 5, 2017
Transcript of Overview of Energy Life Cycle Analysis at NETL for Carbon...

Overview of Energy Life Cycle Analysis at NETL for Carbon Utilization Technologies
Timothy J. Skone, P.E. LCA Webinar for the National Academy of Sciences, Engineering, and Medicine
December 5, 2017
2
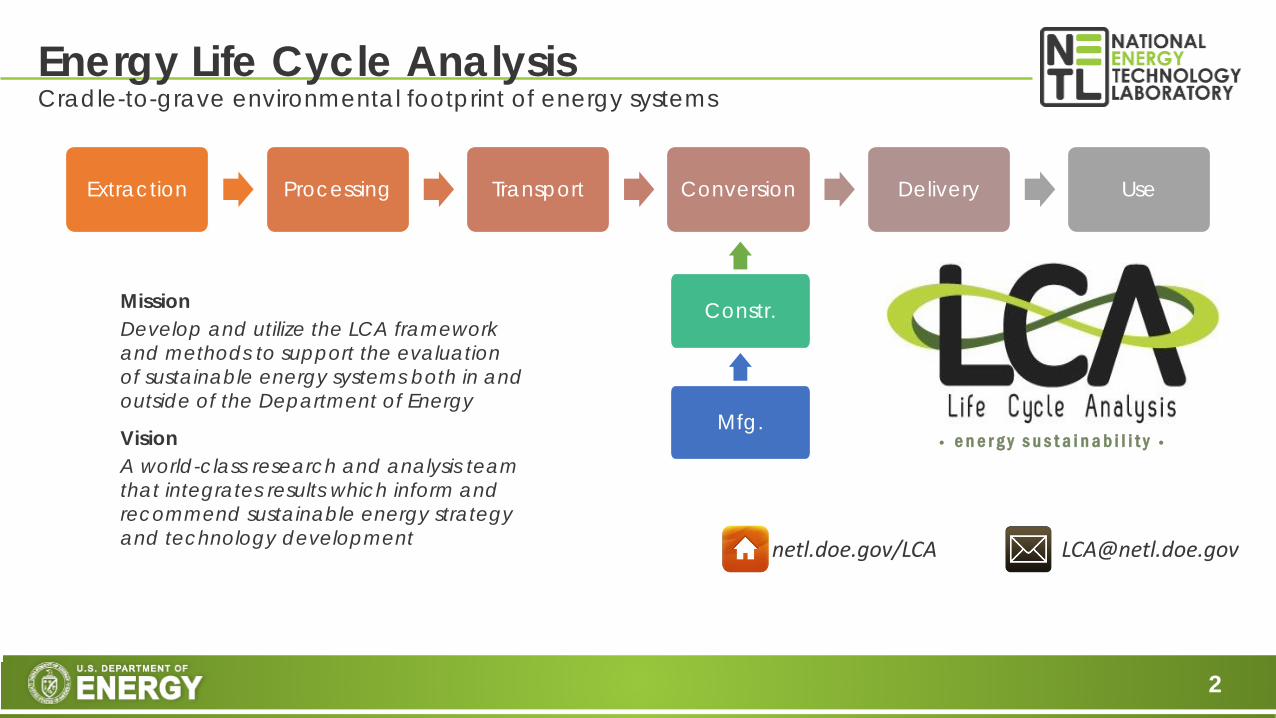
Energy Life Cycle AnalysisCradle-to-grave environmental footprint of energy systems
Extraction Processing Transport Conversion Delivery Use
Mfg.
Constr.MissionDevelop and utilize the LCA framework and methods to support the evaluation of sustainable energy systems both in and outside of the Department of Energy
VisionA world-class research and analysis team that integrates results which inform and recommend sustainable energy strategy and technology development
• e n e r g y s u s t a i n a b i l i t y •
netl.doe.gov/LCA [email protected]

3
Life Cycle Analysis TeamTim Skone – 18 yearsFederal Team LeadBS Chemical Engineering | P.E. Env. Engr.
Greg Cooney – 10 yearsContractor Team LeadMS Env Engr | BS Chem Engr
James Littlefield – 17 yearsNatural gas, system & process designBS Chemical Engineering
Joe Marriott – 12 yearsSenior AdvisorPhD Environmental Engr & Public Policy
Matt Jamieson – 8 yearsPower systems, CO2-enhanced oil recoveryBS Mechanical Engineering
Michele Mutchek – 5 yearsLoan program office, federal LCA commons MS Civil/Env/Sust Engr|BS Env Sciences
Michelle Krynock – 2 yearsNatural gas, fuel cells, coalBS Civil/Env Engr & Public Policy
Derrick Carlson – 7 yearsI/O LCA, Energy efficiencyPhD/MS Civ/Env Engr|BS Chemistry
Dan Augustine – 1 yearNatural gas, visual analyticsBS Energy Engineering
Ambica Pegallapati – 5 yearsBiofuels, bioreactor developmentPhD Env Engr|BS Civil Eng
Greg Zaimes – 4 yearsEnergy analysis; transportation fuels PhD Civ/Env Eng; BS Physics
Selina Roman-White – 1 yearEnergy/environmentBS Chem. Engr.
Junior-level LCA – 2 yearsEnergy/environmentMS Civil/Env Engr | BS Env Engr

4
CO2 Utilization at DOE Fossil Energy (FE)
EOR is a FE/NETL supported area, but is NOT considered under the Carbon Use/Reuse Program
• What is CO2 Utilization?• FE and NETL Context

5
Offset CO2 capture costs, fix CO2 in stable products, and produce services/products that reduce the release of greenhouse gas emissions to the atmosphere.
U.S. DOE FE: Carbon Use & Reuse Drivers
Biological Capture & Conversion Fuels & Chemicals Mineralization &
Cements

6
What is Unique about CO2 Utilization LCA?
• Technically…Nothing.
• Every LCA depends on the goal of the study
“What question do you want to answer?”
“Why are you performing the LCA?”

7
• Question: When commercially deployed, will the CO2U product, or derived product, result in lower greenhouse gas emissions on a life cycle basis then the state-of-the-art alternative in the market that provides the equivalent service or function to society?
• Metric: Percent difference in life cycle GHG emissions on a carbon dioxide equivalent basis; IPCC, AR-5, 100-year time period.
• Scope• Geographical Representation: United States (for deployment, LCA is global)• Temporal Representation: Year of Market Entry + Product Service Life• Scale of Market: Product or Facility/Operation
CO2U Project Life Cycle GHG Analysis Definition

8
• U.S. DOE Office of Fossil Energy Sponsored Workshop
• 40 Participants• LCA Subject Matter Experts
(North America and Europe)• CO2U Project Leads and Engineers (Industry and
Academia
• Goal: Develop consensus based LCA Guidance for DOE CO2U Projects
• Outcome: Revised Draft LCA Guidance Document for evaluating CO2 utilization concepts – Spring 2018
CO2U LCA Workshop – October 2017

9
• Emerging technologies have limited performance data, commercial performance often estimated based on research/project goals.
• Complex functional units and highly integrated system boundaries challenge results interpretation for a single product of interest.
• What is the “correct” business as usual case for comparison? Average or state-of-the-art performance? Today or 10-years in the future when deployed in the market?
• Will the product actually displace a more GHG intensive product from being produced? Or, simply be additive?
• Attributional vs. Consequential LCA – will the product have an effect on it’s primary market or secondary markets?
CO2 Utilization LCA Challenges

A Life Cycle Analysis Perspective ofCO2 Enhanced Oil Recovery

11
Life Cycle Emissions for Traditional CO2-EORCompared to rest of U.S. crude mix
† Cooney, G., Jamieson, M., Marriott, J., Bergerson, J., Brandt, A., & Skone, T. (2016). Updating the U.S. Life Cycle GHG Petroleum Baseline to 2014 with Projections to 2040 Using Open-Source Engineering-Based Models. Environmental Science & Technology.
Baseline 2005 2014
Crude Prod and Transport
(kg CO2e/bbl)
77.4 60.2
Crude Prod and Transport
(g CO2e/MJ gas)
13.0 10.3
Well to Wheel(g CO2e/MJ gas)
98.1 96.2

12
Life Cycle of Gasoline from CO2-EOR Crude
Gasoline Combustion
Gasoline Refining
EOR Crude Extraction
Natural Dome CO2
Power Plant Captured CO2
Power Plant Fuel &
Transport
CO2 Pipeline Transport
Gasoline Transport
EOR Crude Transport
Displaced Electricity
1 bbl gasoline
1.1 bbl crude
1.1 bbl crude 123 kg C†
440 kg CO2112 kg C
440 kg CO2
0.54 MWh
206 kg coal 440 kg CO2
Scenario shown is for 2 bbl crude per tonne CO2 recovery ratio and a 550-MW supercritical pulverized coal power plant with 90% CO2 capture
546 kg CO2149 kg C
119
-400
-200
0
200
400
600
800
SCPC
Glob
al W
arm
ing
Pote
ntia
l(k
g CO
₂e/b
bl c
ombu
sted
gas
olin
e)
119
-400
-200
0
200
400
600
800
SCPC
Glob
al W
arm
ing
Pote
ntia
l(k
g CO
₂e/b
bl c
ombu
sted
gas
olin
e)
167
-400
-200
0
200
400
600
800
SCPC
Glob
al W
arm
ing
Pote
ntia
l(k
g CO
₂e/b
bl c
ombu
sted
gas
olin
e)
171
-400
-200
0
200
400
600
800
SCPC
Glob
al W
arm
ing
Pote
ntia
l(k
g CO
₂e/b
bl c
ombu
sted
gas
olin
e)
537
-400
-200
0
200
400
600
800
SCPC
Glob
al W
arm
ing
Pote
ntia
l(k
g CO
₂e/b
bl c
ombu
sted
gas
olin
e)
539
-400
-200
0
200
400
600
800
SCPC
Glob
al W
arm
ing
Pote
ntia
l(k
g CO
₂e/b
bl c
ombu
sted
gas
olin
e)
588
-400
-200
0
200
400
600
800
SCPC
Glob
al W
arm
ing
Pote
ntia
l(k
g CO
₂e/b
bl c
ombu
sted
gas
olin
e)
649
-400
-200
0
200
400
600
800
SCPC
Glob
al W
arm
ing
Pote
ntia
l(k
g CO
₂e/b
bl c
ombu
sted
gas
olin
e)
364
-400
-200
0
200
400
600
800
SCPC
Glob
al W
arm
ing
Pote
ntia
l(k
g CO
₂e/b
bl c
ombu
sted
gas
olin
e)
581
364
-400
-200
0
200
400
600
800
Dome SCPC
Glob
al W
arm
ing
Pote
ntia
l(k
g CO
₂e/b
bl c
ombu
sted
gas
olin
e)
Some of the injected CO2goes toward
producing NGLs
1 bbl gasoline
† Lyons, W.C., and Plisga, G.J. (2011). Standard Handbook of Petroleum and Natural Gas Engineering . Gulf Professional Publishing. – Crude content of oil is 84-87 wt%.

13
Life Cycle of Gasoline from CO2-EOR Crude
Gasoline Combustion
Gasoline Refining
EOR Crude Extraction
Natural Dome CO2
Power Plant Captured CO2
Power Plant Fuel &
Transport
CO2 Pipeline Transport
Gasoline Transport
EOR Crude Transport
Displaced Electricity
1 MJ gasoline
0.03 bbl crude
0.03 bbl crude
0.09 kg CO2
0.1 kWh
0.04 kg coal 0.09 kg CO2
Scenario shown is for 2 bbl crude per tonne CO2 recovery ratio and a 550-MW supercritical pulverized coal power plant with 90% CO2 capture
1 MJ gasoline
0.09 kg CO2
115
72
-80
-40
0
40
80
120
160
Dome SCPC
Glob
al W
arm
ing
Pote
ntia
l(g
CO
₂e/M
J com
bust
ed g
asol
ine)
Petroleum Baseline

14
Life Cycle of Gasoline from CO2-EOR Crude
Gasoline Combustion
Gasoline Refining
EOR Crude Extraction
Natural Dome CO2
Power Plant Captured CO2
Power Plant Fuel &
Transport
CO2 Pipeline Transport
Gasoline Transport
EOR Crude Transport
Displaced Electricity
1 MJ gasoline
0.03 bbl crude
0.09 kg CO2
0.1 kWh
0.04 kg coal 0.09 kg CO2
1 MJ gasoline
0.09 kg CO2
Upstream CO20.03 bbl crude
CO2 intensity of upstream
CO2
115
72
-80
-40
0
40
80
120
160
Dome SCPC
Glob
al W
arm
ing
Pote
ntia
l(g
CO
₂e/M
J com
bust
ed g
asol
ine)
Petroleum Baseline

15
0.10
-0.39 -0.54
-1.17
0.10
-0.94 -1.05
-2.49
-3.5
-3.0
-2.5
-2.0
-1.5
-1.0
-0.5
0.0
0.5
1.0
Dome SCPC SCPC/30%Biomass
NGCC Dome SCPC SCPC/30%Biomass
NGCC
CO₂ I
nten
sity
of U
pstr
eam
CO
₂(k
g CO
₂e/k
g CO
₂)Fuel Upstream CO₂ Source CO₂ Pipeline Power Displacement
CO2 Intensity of Upstream CO2Grid displacement impacts (power examples, same concept for industrial source)
2014 Grid Mix(566 g CO2e/kWh)
Fleet Coal(1,041 g CO2e/kWh)

16
Net Carbon Negative Oil LCA StudyEOR for GHG Reduction: Achievable low-carbon fuel targets are dependent on the intersection of CO2 source GHG intensity & crude recovery efficiency
-3.0
-2.5
-2.0
-1.5
-1.0
-0.5
0.0
0.5
0.0 1.0 2.0 3.0 4.0
CO₂ I
nten
sity
of U
pstr
eam
CO
₂(k
g CO
₂e/k
g CO
₂)
Crude Recovery Ratio (bbl/tonne CO₂ sequestered)
Baseline
10% Reduction
25% Reduction
50% Reduction
Net Zero GHG Fuel
-50 g CO₂e/MJ-100 g CO₂e/MJ
Natural Dome
SCPC-2014 GridSCPC/30%-2014 Grid
SCPC-Fleet CoalSCPC/30%-Fleet Coal
NGCC-2014 Grid
NGCC-Fleet Coal
Low EOR/ROZ Performance High

17
• An LCA framework allows for in-depth examination of the system where captured CO₂ from fossil power is paired with EOR/ROZ
• Key considerations are the carbon intensity of the power that is displaced by the new plant equipped with carbon capture and the willingness of the crude producer to behave like a sequestration site
-3.0
-2.5
-2.0
-1.5
-1.0
-0.5
0.0
0.5
0.0 1.0 2.0 3.0 4.0
CO₂ I
nten
sity
of U
pstr
eam
CO
₂ (kg
CO
₂e/k
g CO
₂)
Crude Recovery Ratio (bbl/tonne CO₂ sequestered)
Baseline
10% Reduction
25% Reduction
50% Reduction
Net Zero
100 g/MJ Sequestered
Natural Dome
SCPC-2014 GridSCPC/30%-2014 Grid
SCPC-Fleet CoalSCPC/30%-Fleet Coal
NGCC-2014 Grid
NGCC-Fleet Coal
Coal-fired power
Gas-fired power
FuelCombustion
Refining
Crude Extraction
Power Plant
Fuel Extraction &
Transport
CO2Transport
FuelTransport
Crude Transport
Displaced Electricity
fuel
fuel
crude
CO2
kWh
coal/gas
CO2
crude
CO2 Intensity of Upstream CO2
Crude Recovery
Ratio
EOR for GHG Reduction: Achievable low-carbon fuel targets are dependent on the intersection of CO2 source GHG intensity & crude recovery efficiency
50 g/MJ Sequestered
Low EOR/ROZ Performance High
Net Carbon Negative Oil LCA Study
18
• Emerging technologies have limited performance data, commercial performance often estimated based on research/project goals.
• Complex functional units and highly integrated system boundaries challenge results interpretation for a single product of interest.
• What is the “correct” business as usual case for comparison? Average or state-of-the-art performance? Today or 10-years in the future when deployed in the market?
• Will the product actually displace a more GHG intensive product from being produced? Or, simply be additive?
• Attributional vs. Consequential LCA – will the product have an effect on it’s primary market or secondary markets?
CO2 Utilization LCA ChallengesHow do they apply to CO2-EOR?

19
• Emerging technologies have limited performance data, commercial performance often estimated based on research/project goals.
• Complex functional units and highly integrated system boundaries challenge results interpretation for a single product of interest.
• What is the “correct” business as usual case for comparison? Average or state-of-the-art performance? Today or 10-years in the future when deployed in the market?
• Will the product actually displace a more GHG intensive product from being produced? Or, simply be additive?
• Attributional vs. Consequential LCA – will the product have an effect on it’s primary market or secondary markets?
CO2 Utilization LCA ChallengesHow do they apply to CO2-EOR?
EOR using anthropogenic CO2 is relatively new, residual oil zone applications are novel – performance data limited.
20
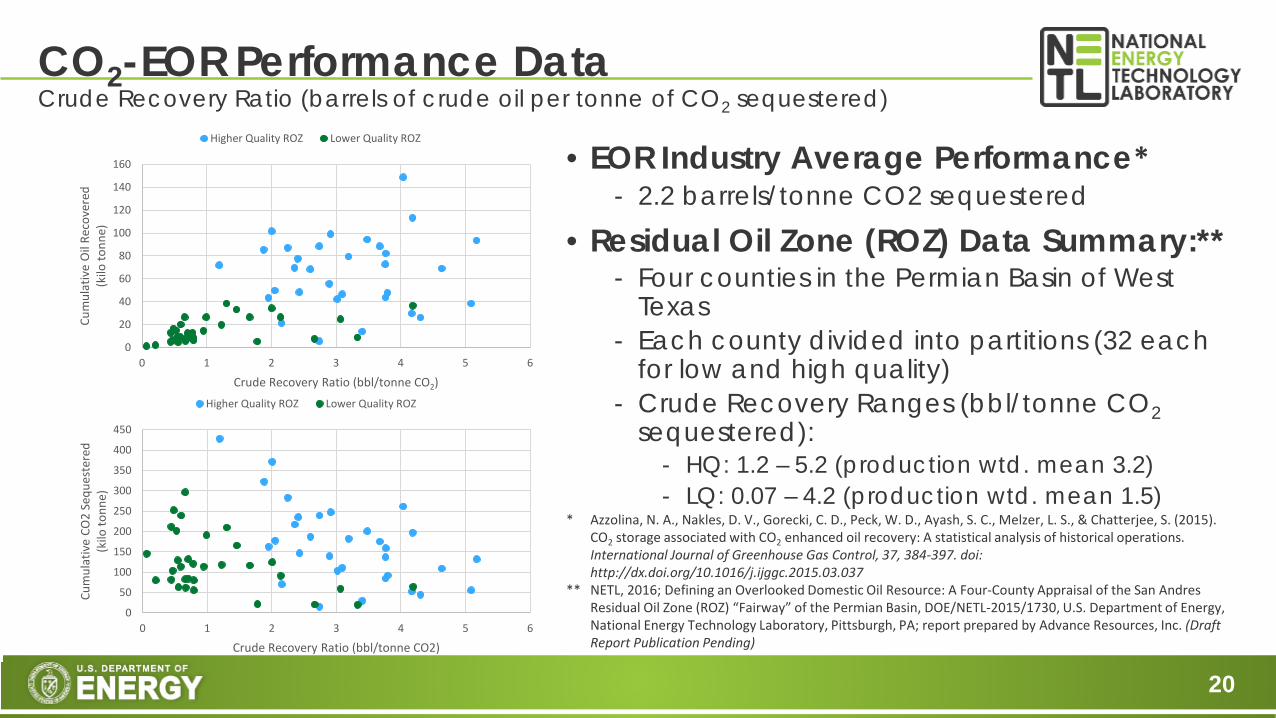
• EOR Industry Average Performance*- 2.2 barrels/tonne CO2 sequestered
• Residual Oil Zone (ROZ) Data Summary:**- Four counties in the Permian Basin of West
Texas- Each county divided into partitions (32 each
for low and high quality)- Crude Recovery Ranges (bbl/tonne CO2
sequestered):- HQ: 1.2 – 5.2 (production wtd. mean 3.2)- LQ: 0.07 – 4.2 (production wtd. mean 1.5)
CO2-EOR Performance DataCrude Recovery Ratio (barrels of crude oil per tonne of CO2 sequestered)
* Azzolina, N. A., Nakles, D. V., Gorecki, C. D., Peck, W. D., Ayash, S. C., Melzer, L. S., & Chatterjee, S. (2015). CO2 storage associated with CO2 enhanced oil recovery: A statistical analysis of historical operations. International Journal of Greenhouse Gas Control, 37, 384-397. doi: http://dx.doi.org/10.1016/j.ijggc.2015.03.037
** NETL, 2016; Defining an Overlooked Domestic Oil Resource: A Four-County Appraisal of the San Andres Residual Oil Zone (ROZ) “Fairway” of the Permian Basin, DOE/NETL-2015/1730, U.S. Department of Energy, National Energy Technology Laboratory, Pittsburgh, PA; report prepared by Advance Resources, Inc. (Draft Report Publication Pending)
0
20
40
60
80
100
120
140
160
0 1 2 3 4 5 6
Cum
ulat
ive
Oil
Reco
vere
d (k
ilo to
nne)
Crude Recovery Ratio (bbl/tonne CO2)
Higher Quality ROZ Lower Quality ROZ
0
50
100
150
200
250
300
350
400
450
0 1 2 3 4 5 6
Cum
ulat
ive
CO2
Sequ
este
red
(kilo
tonn
e)
Crude Recovery Ratio (bbl/tonne CO2)
Higher Quality ROZ Lower Quality ROZ

21
• Emerging technologies have limited performance data, commercial performance often estimated based on research/project goals.
• Complex functional units and highly integrated system boundaries challenge results interpretation for a single product of interest.
• What is the “correct” business as usual case for comparison? Average or state-of-the-art performance? Today or 10-years in the future when deployed in the market?
• Will the product actually displace a more GHG intensive product from being produced? Or, simply be additive?
• Attributional vs. Consequential LCA – will the product have an effect on it’s primary market or secondary markets?
CO2 Utilization LCA ChallengesHow do they apply to CO2-EOR?
EOR using anthropogenic CO2 is relatively new, residual oil zone applications are novel – performance data limited.
Mixed product functional unit is more accurate for comparison but less practical for decision making – tradeoffs.

22
CO2-EOR is a Complex System to ModelMultiple products from a single interconnected system
Possible products from this system:• Electricity• Crude oil• Refined fuel• Captured CO₂• Some combination of the above
23
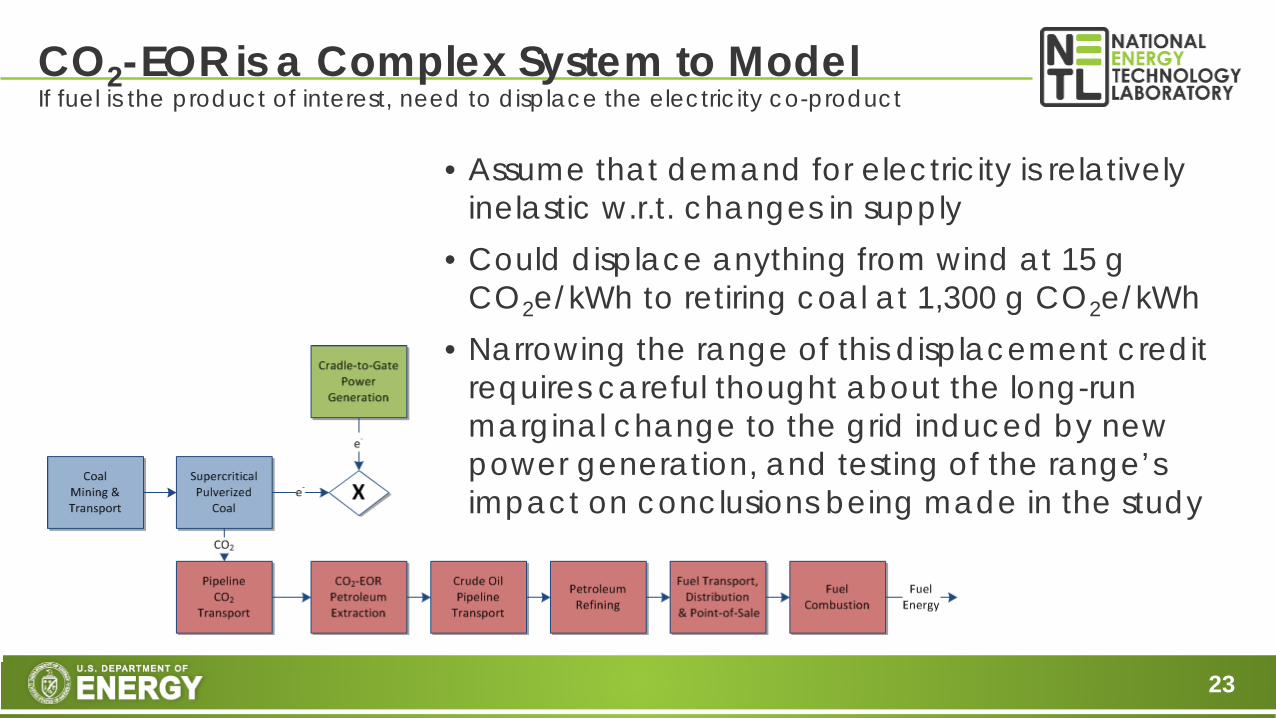
CO2-EOR is a Complex System to ModelIf fuel is the product of interest, need to displace the electricity co-product
• Assume that demand for electricity is relatively inelastic w.r.t. changes in supply
• Could displace anything from wind at 15 g CO2e/kWh to retiring coal at 1,300 g CO2e/kWh
• Narrowing the range of this displacement credit requires careful thought about the long-run marginal change to the grid induced by new power generation, and testing of the range’s impact on conclusions being made in the study

24
Net Carbon Negative Oil LCA StudyAs the grid decarbonizes, the CO2 intensity of upstream CO2 increases
-3.0
-2.5
-2.0
-1.5
-1.0
-0.5
0.0
0.5
0.0 1.0 2.0 3.0 4.0
CO₂ I
nten
sity
of U
pstr
eam
CO
₂(k
g CO
₂e/k
g CO
₂)
Crude Recovery Ratio (bbl/tonne CO₂ sequestered)
Baseline
10% Reduction
25% Reduction
50% Reduction
-50 g CO₂e/MJ-100 g CO₂e/MJ
NGCC
Net Zero GHG Fuel1,041 g/kWh
163 g/kWh
Low ROZ Quality High
• As capture is implemented, the grid becomes less GHG intensive
• Hypothetical example depicts range from fleet coal (1,041) to a carbon-constrained grid (163)
• This analysis can help determine the grid GHG intensity at which it is no longer possible to hit a target
• Under full fossil capture, transportation would likely shift away from conventional technology

25
• Emerging technologies have limited performance data, commercial performance often estimated based on research/project goals.
• Complex functional units and highly integrated system boundaries challenge results interpretation for a single product of interest.
• What is the “correct” business as usual case for comparison? Average or state-of-the-art performance? Today or 10-years in the future when deployed in the market?
• Will the product actually displace a more GHG intensive product from being produced? Or, simply be additive?
• Attributional vs. Consequential LCA – will the product have an effect on it’s primary market or secondary markets?
CO2 Utilization LCA ChallengesHow do they apply to CO2-EOR?
EOR using anthropogenic CO2 is relatively new, residual oil zone applications are novel – performance data limited.
Mixed product functional unit is more accurate for comparison but less practical for decision making – tradeoffs.
Comparison to the 2005 Petroleum Baseline, average fuels consumed today, future crude oil supply mix in 2040?

26
Petroleum Baseline is a Snapshot in TimeChanging market dynamics and operations will shift baseline over time
95.9 96
.0 96.1
96.0
95.8
95.7
95.7
95.8
95.8
95.9
95.9
95.9
96.0
96.0
95.9
95.9
96.0 96
.2 96.3 96
.596
.4 96.5
96.6
96.7
96.7
96.7
96.7High economic
growth
High oil and gas resource
High oil price
Low economic growth
Low oil and gas resource
Low oil price
94
95
96
97
98
99
2014 2019 2024 2029 2034 2039W
TW G
WP
100-
yr A
R5g
CO₂e
/MJ g
asol
ine
Maximum percent changes from the 2014 WTW gasoline result are +2.1% and -1.4%
† Cooney, G., Jamieson, M., Marriott, J., Bergerson, J., Brandt, A., & Skone, T. (2016). Updating the U.S. Life Cycle GHG Petroleum Baseline to 2014 with Projections to 2040 Using Open-Source Engineering-Based Models. Environmental Science & Technology.
98.190.7 94.196.2
88.092.0
Gasoline Jet Diesel
g CO
₂e/M
J
2005
2014
-1.9% -3.0% -2.2%
What is the state of the art system for comparison?

27
• Emerging technologies have limited performance data, commercial performance often estimated based on research/project goals.
• Complex functional units and highly integrated system boundaries challenge results interpretation for a single product of interest.
• What is the “correct” business as usual case for comparison? Average or state-of-the-art performance? Today or 10-years in the future when deployed in the market?
• Will the product actually displace a more GHG intensive product from being produced? Or, simply be additive?
• Attributional vs. Consequential LCA – will the product have an effect on it’s primary market or secondary markets?
CO2 Utilization LCA ChallengesHow do they apply to CO2-EOR?
EOR using anthropogenic CO2 is relatively new, residual oil zone applications are novel – performance data limited.
Mixed product functional unit is more accurate for comparison but less practical for decision making – tradeoffs.
Comparison to the 2005 Petroleum Baseline, average fuels consumed today, future crude oil supply mix in 2040?
What are the market consequences of producing another barrel of crude oil from CO2-EOR? 30% of the market?

28
U.S. - Gulf of Mexico
2014 U.S. Average
Venezuela
0
10
20
30
40
50
60
70
80
0% 20% 40% 60% 80% 100%
Gre
enho
use
Gas
Em
isiso
ns(g
CO
₂e/M
J Com
bust
ed G
asol
ine)
Percent of Crude Source Displaced by CO₂-EOR Crude
CO2-EOR Crude DisplacementDoes displacement occur? What crude source is actually displaced?
• Graph shows GWP of CO₂-EOR through combustion taking into account possible credits for replacing crudes from different sources
• EOR crude recovery ratio is 2.2 bbls/tonne
• Plant is SCPC w/ 90% capture

29
CO2-EOR Crude DisplacementMarket scale affects consequences of displacement in addition to source displaced
0%
5%
10%
15%
20%
25%
30%
35%
40%
45%
50%
0% 10% 20% 30% 40% 50%
Scal
e of
new
EO
R pr
oduc
tion
(as s
hare
of e
xist
ing
crud
e su
pply
)
Share of existing crude supply displaced by new EOR production
• Modeling specific life cycle scenarios is relatively straightforward
• Understanding net system effects as new production displaces existing production is more complicated

30
• Emerging technologies have limited performance data, commercial performance often estimated based on research/project goals.
• Complex functional units and highly integrated system boundaries challenge results interpretation for a single product of interest.
• What is the “correct” business as usual case for comparison? Average or state-of-the-art performance? Today or 10-years in the future when deployed in the market?
• Will the product actually displace a more GHG intensive product from being produced? Or, simply be additive?
• Attributional vs. Consequential LCA – will the product have an effect on it’s primary market or secondary markets?
CO2 Utilization LCA ChallengesHow do they apply to CO2-EOR?
EOR using anthropogenic CO2 is relatively new, residual oil zone applications are novel – performance data limited.
Mixed product functional unit is more accurate for comparison but less practical for decision making – tradeoffs.
Comparison to the 2005 Petroleum Baseline, average fuels consumed today, future crude oil supply mix in 2040?
What are the market consequences of producing another barrel of crude oil from CO2-EOR? 30% of the market?

31
Attributional vs Consequential LCAConceptual Framework
Attributional Consequential
Purpose Regulatory compliance, Corporate footprint
Policy implications
Goal What are the environmental burdensof a particular product?
How does new system changethe world around it?
Functional unit Single product Multiple products
(within a defined world)
Boundaries Truncated(to isolate burdens of a single product)
Expanded(to include indirect effects)
Uncertainty Methods for isolating a single product can arbitrarily shift burdens between systems Extent to which system alters the world around it
Both types of analyses – attributional and consequential – are valid LCA approaches; context of a study must be known before determining which one is appropriate

32
Attributional vs Consequential LCAHow does a supply chain affect surrounding systems?
Surrounding systems• Competing products• Other markets
Uncertainties• Changes over time• Scalability• Producer/consumer behavior
Examples• Ethanol (food for fuel)• LNG exports (global energy market)• EOR (global crude market) – maybe? Image source: National Oceanic and Atmospheric Administration
Consequential LCA attempts to consider the broader effect(s) of
supply chain changes.

33
Attributional vs Consequential LCAWhere could a consequential LCA approach apply to a CO2-EOR system?
• How does the displacement credit for electricity change over time as the grid decarbonizes?
• Does EOR crude/fuel production displace other sources of evenas world demand for continues to increase?
• Are natural sources of CO2still being utilized after captured fossil sources emerge?

34
• Emerging technologies have limited performance data, commercial performance often estimated based on research/project goals.
• Complex functional units and highly integrated system boundaries challenge results interpretation for a single product of interest.
• What is the “correct” business as usual case for comparison? Average or state-of-the-art performance? Today or 10-years in the future when deployed in the market?
• Will the product actually displace a more GHG intensive product from being produced? Or, simply be additive?
• Attributional vs. Consequential LCA – will the product have an effect on it’s primary market or secondary markets?
CO2 Utilization LCA Challenges - SummaryHow do they apply to CO2-EOR?
EOR using anthropogenic CO2 is relatively new, residual oil zone applications are novel – performance data limited.
Mixed product functional unit is more accurate for comparison but less practical for decision making – tradeoffs.
Comparison to the 2005 Petroleum Baseline, average fuels consumed today, future crude oil supply mix in 2040?
What are the market consequences of producing another barrel of crude oil from CO2-EOR? 30% of the market?

35
LCA - More Complete Picture, More Uncertainty

36
Contact Information
Timothy J. Skone, P.E.Senior Environmental EngineerStrategic Energy Analysis (412) 386-4495 • [email protected]
netl.doe.gov/LCA [email protected] @NETL_News

37
Evaluating the Climate Benefits of CO2-Enhanced Oil Recovery Using Life Cycle Analysis (2015)
Cooney, G.; Littlefield, J.; Marriott, J.; & Skone, T. J.• CO2-EOR is a GHG-intensive way of extracting crude
compared to conventional extraction methods • Linking EOR with anthropogenic CO2 yields a benefit
due to the displacement of uncaptured electricity
Recent Petroleum-related LCA Work
Updating the U.S. Life Cycle GHG Petroleum Baseline to 2014 with Projections to 2040 Using Open-Source Engineering-Based Models (2016)
Cooney, G., Jamieson, M., Marriott, J., Bergerson, J., Brandt, A., Skone, T.
• 98.1 vs. 96.2 g CO2e/MJ gasoline (-2%) for 2005 to 2014• Changing baseline values lead to potential compliance
challenges with frameworks such as the EISA Section 526
Ongoing Work• Adding CO2
capture to refineries• Full environmental
inventory for the Petroleum Baseline
• Using field EOR data to inform models
• Inclusion of biofuels in U.S. transportation consumption
Collaborators

38
Recent Natural gas-related LCA Work
LossExtraction — Processing — Transmission — Distribution Rate
Cradle-to-Extraction 4.7 1,086 0.5% 0.43%
Cradle-to-Processing 4.7 + 2.6 1,020 6.6% 0.71%
Cradle-to-Transmission 4.7 + 2.6 + 5.2 1,005 7.9% 1.24%
Cradle-to-Distribution 4.7 + 2.6 + 5.2 + 4.5 1,000 8.4% 1.70%
Processing Only (GtG) 2.6 1,020 6.1% 0.25%
Transmission Only (GtG) 5.2 1,005 1.5% 0.52%
Distribution Only (GtG) 4.5 1,000 0.5% 0.45%
Boundary Upstream Emissions (g CH ) NG ExitingBoundary (g)
EmissionRate
Numerator Denominator
Synthesis of recent ground-level methane emission measurements from the US natural gas supply chain (2017)
Littlefield, J.; Marriott, J.; Schivley, G.; Skone, T. J.• Overall Result: 1.7% CH₄ emission rate across the NG life cycle• Emission reduction opportunities: Pneumatic devices –
widespread use in production and gathering stages; Unassigned” emissions (observed, but not fully understood); Gathering Systems (new to emissions inventories, but highly aggregated)
Using Common Boundaries to Assess CH₄ Emissions: a Life Cycle Evaluation of Natural Gas & Coal Power Systems (2016)
Littlefield, J.; Marriott, J.; Schivley, G.; Cooney, G.; Skone, T. J.• Emphasizes the importance of boundary selection when
expressing CH₄ emission rates and comparing NG to other energy sources
• Includes use of technology warming potential as a method for comparing cumulative radiative forcing
Ongoing Work• Creating a 2016
baseline for natural gas produced in the U.S.
• Collaboration with ONE Future
• Improved uncertainty characterization
Collaborators
39
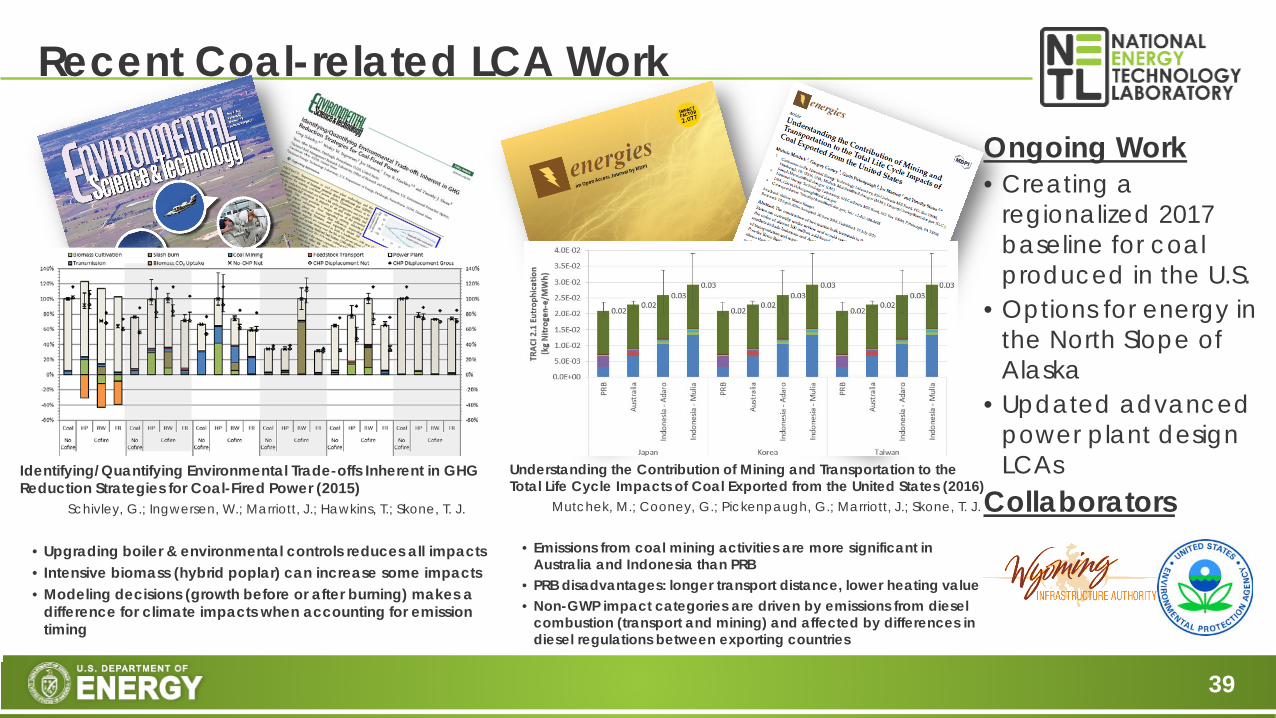
Recent Coal-related LCA Work
Identifying/Quantifying Environmental Trade-offs Inherent in GHG Reduction Strategies for Coal-Fired Power (2015)
Schivley, G.; Ingwersen, W.; Marriott, J.; Hawkins, T.; Skone, T. J.
• Upgrading boiler & environmental controls reduces all impacts• Intensive biomass (hybrid poplar) can increase some impacts• Modeling decisions (growth before or after burning) makes a
difference for climate impacts when accounting for emission timing
Understanding the Contribution of Mining and Transportation to the Total Life Cycle Impacts of Coal Exported from the United States (2016)
Mutchek, M.; Cooney, G.; Pickenpaugh, G.; Marriott, J.; Skone, T. J.
• Emissions from coal mining activities are more significant in Australia and Indonesia than PRB
• PRB disadvantages: longer transport distance, lower heating value• Non-GWP impact categories are driven by emissions from diesel
combustion (transport and mining) and affected by differences in diesel regulations between exporting countries
Ongoing Work• Creating a
regionalized 2017 baseline for coal produced in the U.S.
• Options for energy in the North Slope of Alaska
• Updated advanced power plant design LCAs
Collaborators

40
Cooney, G., Littlefield, J., Marriott, J., & Skone, T. J. (2015). Evaluating the Climate Benefits of CO2-Enhanced Oil Recovery Using Life Cycle Analysis. Environmental Science & Technology, 49(12), 7491-7500. doi: 10.1021/acs.est.5b00700. http://pubs.acs.org/doi/abs/10.1021/acs.est.5b00700
Cooney, G., Jamieson, M., Marriott, J., Bergerson, J., Brandt, A., & Skone, T. J. (2016). Updating the U.S. Life Cycle GHG Petroleum Baseline to 2014 with Projections to 2040 Using Open-Source Engineering-Based Models. Environmental Science & Technology. doi: 10.1021/acs.est.6b02819http://pubs.acs.org/doi/abs/10.1021/acs.est.6b02819
Littlefield, J. A., Marriott, J., Schivley, G. A., & Skone, T. J. (2017). Synthesis of recent ground-level methane emission measurements from the U.S. natural gas supply chain. Journal of Cleaner Production, 148, 118-126. doi: 10.1016/j.jclepro.2017.01.101http://www.sciencedirect.com/science/article/pii/S0959652617301166
Littlefield, J. A., Marriott, J., Schivley, G. A., Cooney, G., & Skone, T. J. (2016). Using Common Boundaries to Assess Methane Emissions: A Life Cycle Evaluation of Natural Gas and Coal Power Systems. Journal of Industrial Ecology, 20(6), 1360-1369. doi: 10.1111/jiec.12394http://onlinelibrary.wiley.com/doi/10.1111/jiec.12394/full
Mutchek, M., Cooney, G., Pickenpaugh, G., Marriott, J., & Skone, T. (2016). Understanding the Contribution of Mining and Transportation to the Total Life Cycle Impacts of Coal Exported from the United States. Energies, 9(7). doi: 10.3390/en9070559http://www.mdpi.com/1996-1073/9/7/559
Schivley, G., Ingwersen, W. W., Marriott, J., Hawkins, T. R., & Skone, T. J. (2015). Identifying/Quantifying Environmental Trade-offs Inherent in GHG Reduction Strategies for Coal-Fired Power. Environmental Science & Technology, 49(13), 7562-7570. doi: 10.1021/acs.est.5b01118http://pubs.acs.org/doi/pdf/10.1021/acs.est.5b01118
Citations and Links to Recent Work

41
• “80-20” Rule: Guidance should work for 80% of the cases but be flexible enough to accommodate the 20% that don’t fit perfectly
• Reduce the LCA effort while increasing consistency and comparability
• Transparency, Reproducibility, and Un-biased: Clear Justification and Documentation
• LCA Knowledge Level: Novice to Expert
• Primary Audience: FOA Principle Investigators
• Secondary Audience: Anyone performing a CO2U Project LCA
CO2U LCA Guidance Document Themes

42
Overall Result: 1.7% CH₄ life cycle emission rate
0.70%
1.11%1.23%
1.57%1.65%
0.0%0.1%0.2%0.3%0.4%0.5%0.6%0.7%0.8%0.9%1.0%1.1%1.2%1.3%1.4%1.5%1.6%1.7%1.8%1.9%2.0%2.1%2.2%
0.00
0.01
0.02
0.03
0.04
0.05
0.06
0.07
0.08U
nass
igne
d (o
utsid
e Ba
rnet
t)
Una
ssig
ned
(Bar
nett
)
Com
plet
ion
Chem
ical
Pum
ps
Equi
pmen
t Lea
ks
Pneu
mat
ics
Prod
uced
wat
er ta
nks
Liq.
unl
oadi
ng (n
o pl
unge
r)
Liq.
unl
oadi
ng (p
lung
er)
Com
pres
sor p
acki
ng
Com
pres
sor e
xhau
st
Dehy
drat
or v
ents
Gath
erin
g fa
cilit
ies
Gath
erin
g pi
pelin
es
Proc
essin
g fa
cilit
y
Proc
essin
g fu
gitiv
es
Tran
smiss
ion
stat
ions
Stor
age
stat
ions
Com
pres
sor e
xhau
st
Pneu
mat
ics
Stat
ion
vent
ing
Oth
er
Supe
r-em
itter
s
Mai
ns
Serv
ice
pipe
lines
Met
erin
g &
regu
latin
g
Cust
omer
met
ers
Mai
nten
ance
Ups
ets
PRODUCTION GATHERING PROCESSING TRANSMISSION & STORAGE DISTRIBUTION
CH₄ Emission Rate (g CH₄ em
itted/g NG
delivered)g
CH₄/
MJ d
eliv
ered
NG
Measured Augmented Cumulative Emission Rate
(0.12 g CH₄/MJ)
(0.20 g CH₄/MJ)
(0.22 g CH₄/MJ)
(0.28 g CH₄/MJ)(0.29 g CH₄/MJ)
Aside from total emission rates, results point to top emission reduction and research opportunities

43
NETL “Techno-Regions” and VariabilityUnderstanding technological & regional variability allows focused policy and R&D
12.4
23.0
10.314.5
18.8
24.7
48.6
20.8
29.9 31.21.3%
2.8%
1.1%
1.6%
1.3%1.6% (national)
0.0%
1.0%
2.0%
3.0%
4.0%
5.0%
6.0%
0
10
20
30
40
50
60
70
80
90
100
Shale, Ft. Worth Basin Tight Gas, RockyMountains
Onshore Conventional,Gulf Coast
Shale, Appalachian Basin Tight Gas, Gulf Coast
CH₄Emission Rate (m
ass CH₄ emissions/m
ass delivered NG as
percentage)
GHG
Em
issi
ons
(g C
O₂e
/MJ N
G d
eliv
ered
)61
% o
f NG
goes
thro
ugh
dist
ribut
ion
afte
r tra
nsm
issio
n
Total CO₂e (100-yr GWP) Total CO₂e (20-yr GWP) CH₄ emission rate
NETL’s results before assimilation of EDF
studies.
Source: NETL (2016) Life Cycle Analysis of Natural Gas Extraction and Power Generation
• There are scenarios where CH4 emission rates greater than 5% are likely• But the national average is lower (1.6% based on NETL’s 2016 report)
44
Inventory perspective• Synthesis result, U.S. annualized: 0.29 g CH4/MJ 7,349 Gg CH4/yr• EPA 2016 Greenhouse Gas Inventory (GHGI) result for 2012 (after removing
condensate tanks) is 6,716 Gg CH4/yr• Synthesis result is 9% higher than GHGI because
- Different data sources are used for production emission sources- Synthesis includes unassigned emissions
Life cycle CO2e perspective• Includes CO2 and N2O in addition to CH4• 2013 Global Warming Potentials (GWP)• 13.8 g CO2e/MJ (100-yr GWP) and 28.6 g CO2e/MJ (20-yr GWP)
Additional Perspective

45
Conclusions and Recommendations
• Emission reduction opportunities- Pneumatic devices – widespread use in production and gathering stages- “Unassigned” emissions (observed, but not fully understood)- Gathering Systems (new to emissions inventories, but highly aggregated)
• Research opportunities- Improve activity data on pneumatic devices throughout supply chain- Identify drivers and regional variability for unassigned emissions- Disaggregate gathering emissions at the category level to individual
system components