Overview of CrayPat and Apprentice 2 Adam Leko UPC Group HCS Research Laboratory University of...
14
Overview of CrayPat and Apprentice 2 Adam Leko UPC Group HCS Research Laboratory University of Florida Color encoding key: Blue: Information Red: Negative note Green: Positive note
-
Upload
eric-garrison -
Category
Documents
-
view
213 -
download
0
Transcript of Overview of CrayPat and Apprentice 2 Adam Leko UPC Group HCS Research Laboratory University of...

Overview of CrayPat and Apprentice2
Adam Leko
UPC Group
HCS Research Laboratory
University of Florida
Color encoding key:
Blue: Information
Red: Negative note
Green: Positive note

2
Basic Information Name: CrayPat, Apprentice2
Developer: Cray Current Version:
CrayPat v24.107 Apprentice2 v2.0 (not available separately)
Languages: Fortran, C, C++ Website: Documentation available at
http://www.cray.com/cgi-bin/swpubs/craydoc30/craydoc.cgi Contact:
Luiz DeRose ([email protected])

3
CrayPat and Apprentice2 Overview CrayPat
Cray’s toolkit for instrumenting executables and producing data from runs
Uses static binary instrumentation Supports tracing, profiling, and sampling Outputs data in binary format which can be converted to
XML format (for Apprentice2)
Text format (report that contains statistical information) Apprentice2
Visualization tool for CrayPat data files Can read in .xml or .xml.gz files (gzipped XML reports converted
from binary output of CrayPat) Several visualizations available

4
CrayPat Overview Command-line based performance optimization tools In CrayPat, you perform experiments on instrumented executables
Several types of experiments available Tracing: Record timestamps and arguments for all instrumented functions Sampling: Samples hardware counters or callstack at fixed intervals Profiling: Performs a specific sampling experiment where user + system time are sampled for all functions in a
program Type of experiment guided by setting environment variables
However, can only perform tracing experiments on executables instrumented for tracing But, can perform sample-type experiments on executables instrumented for tracing
General workflow 1. Compile application and run as normal 2. Instrument using pat_build 3. Run instrumented executable as normal; binary .xf log file will be produced 4. View report using pat_report Can also use pat_run to combine steps 3 & 4, or pat_hwpc on uninstrumented exectuables to get
hardware counter reports CrayPat supports many languages + extensions
C, C++, Fortran, UPC, MPI, CoArray Fortran, OpenMP, SHMEM

5
CrayPat Instrumentation Instrumentation is very simple! Build application as normal (not even debugging symbols needed), keeping the .o files
Eg: UPC: cc -hupc -hkeepfiles *.upc -o exe C/C++/MPI C: cc -hkeepfiles *.c -o exe Fortran: ftn -hkeepfiles *.f77 -o exe Can also use -c flag with compilers and link in separate stage as normal
Use pat_build to build instrumented executable For profiling or sampling: pat_build exe inst.exe For tracing:
UPC: pat_build -g upc exe inst.exe MPI: pat_build -g mpi exe inst.exe Several other things can be traced with -g flag (CoArray Fortran, heap calls, I/O system calls Passing the -u flag also traces all (non-inlined) user function calls
Then run program as normal as shown earlier Use of binary instrumentation means low overhead and no interference with compiler
optimizations X1 and X1E are extremely dependent on compiler optimizations (loop vectorization especially), so
this is an absolute necessity for CrayPat In our informal tests, sampling instrumentation resulted in negligible overhead (< 2-3 %) Also, .xf logfiles from runs seem very compact

6
Sample pat_report Output By default, pat_report
lists profile-type information Can also produce a listing of
events with -c records option, but not very useful Although necessary for
exporting traces to Apprentice2
Lots of different summary information can be displayed using pat_report Output very customizable Can change text format,
how stats are computed, which data is displayed, …
Like prof on steroids
Table 1: -d time%,cum_time%,time,traces,P,E,M -b exp,pe,thread,ssp,function,ca
Time% | Cum.Time% | Time | Traces |Experiment=1 |PE=0 |Thread=0 |SSP=0 |Function |Caller
100.0% | 100.0% | 33.364290 | 72 |Total|-------------------------------------------------------| 100.0% | 100.0% | 33.359228 | 1 |main| | | | | (N/A)| 0.0% | 100.0% | 0.003155 | 45 |timer_now$$CFE_id_hex2UINT||------------------------------------------------------|| 0.0% | 100.0% | 0.001608 | 21 | timer_elapsed$$CFE_id_hex2UINT|| | | | | main|| 0.0% | 100.0% | 0.001547 | 24 |main||======================================================| 0.0% | 100.0% | 0.001443 | 2 |ioctl| | | | | printf| | | | | main| 0.0% | 100.0% | 0.000395 | 21 |timer_elapsed$$CFE_id_hex2UINT| | | | | main| 0.0% | 100.0% | 0.000026 | 1 |extendDC| | | | | main| 0.0% | 100.0% | 0.000025 | 1 |_exit| | | | | sigtramp| | | | | main| 0.0% | 100.0% | 0.000018 | 1 |hex2UINT| | | | | main|=======================================================
7
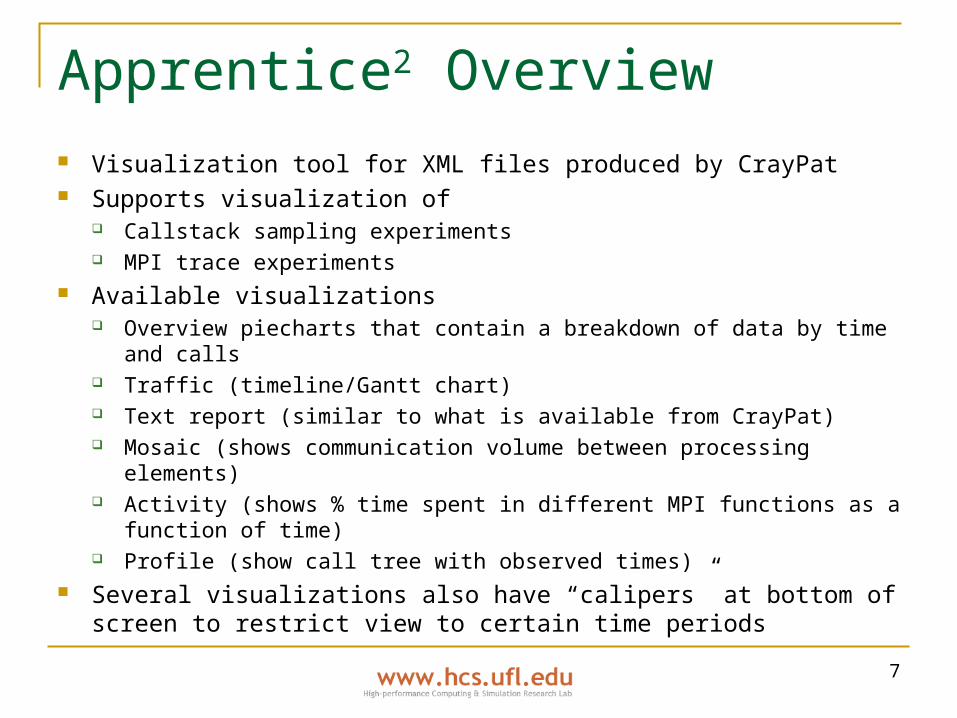
Apprentice2 Overview Visualization tool for XML files produced by CrayPat Supports visualization of
Callstack sampling experiments MPI trace experiments
Available visualizations Overview piecharts that contain a breakdown of data by time and calls Traffic (timeline/Gantt chart) Text report (similar to what is available from CrayPat) Mosaic (shows communication volume between processing elements) Activity (shows % time spent in different MPI functions as a function of time) Profile (show call tree with observed times)
Several visualizations also have “calipers” at bottom of screen to restrict view to certain time periods

8
Apprentice2 Problems Was never able to get
Apprentice2 to run properly Followed instructions provided by
Cray [1], but was never able to get Apprentice to show a callstack profile or an MPI trace All visualizations looked empty! See right for examples
Probably due to using a (beta) public-access Cray machine
Rest of information garnered from [2]

9
Apprentice2 Visualizations
Call graph view Shows summary of
sampled call stacks Similar to display of
KCacheGrind Inclusive/exclusive
time annotated by height and width of functions

10
Apprentice2 Visualizations (2) Overview display
Overview shows breakdown of execution time by each function in a pie chart
Clicking on each function brings up a tab showing breakdown per node
Clicking on “other” brings up text list of other functions
Can also display pie chart of function times by node
11
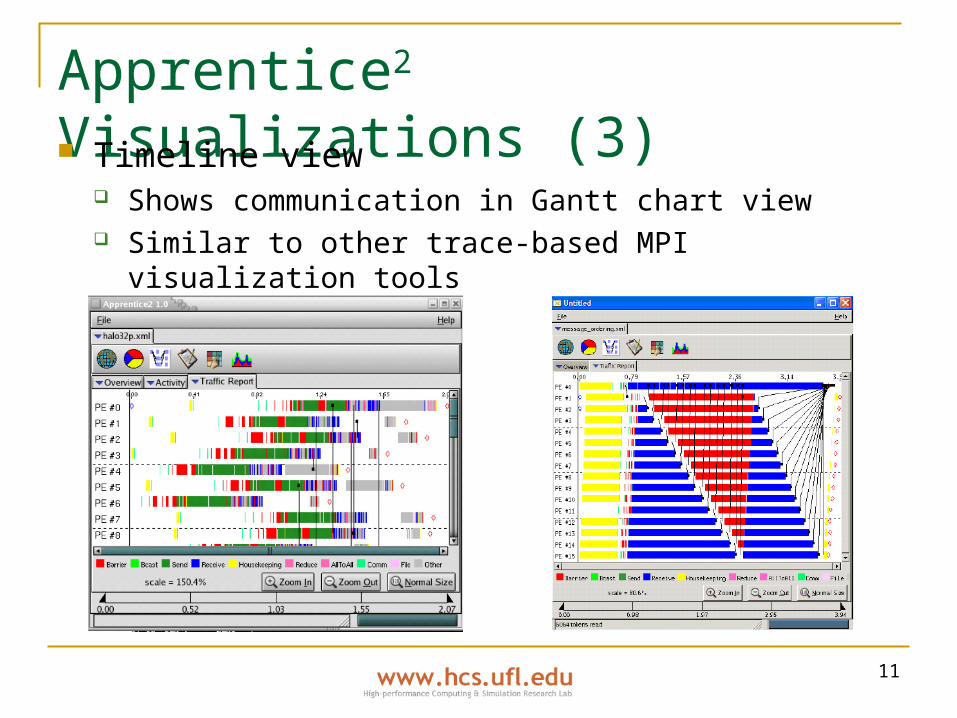
Apprentice2 Visualizations (3) Timeline view
Shows communication in Gantt chart view Similar to other trace-based MPI visualization tools

12
Apprentice2 Visualizations (4)
Mosaic view Shows pair-wise
communication statistics
Can show different stats Max time Average time Min time

13
Apprentice2 Visualizations (5)
Activity view Shows percentage
of time spent in MPI calls as a function of time
Ex: Red = barrier Light green =
broadcast Dark green =
send

14
References
[1] “Optimizing Applications on Cray X1 Series Systems,” #S-2315-54, 2005. (available from docs.cray.com)
[2] L. DeRose, “Performance Analysis and Visualization with
Cray Apprentice2,” SC 2004, Pittsburgh, PA, November 2004.