Overcoming the Market Barriers to Organic Production in West Virginia
62
James Farmer, Cassie Peters, Evan Hansen, Fritz Boettner, Meghan Betcher June 28, 2013 Overcoming the Market Barriers to Organic Production in West Virginia Prepared by: James Farmer, Ph.D. Indiana University 1025 East 7 th Street Bloomington, IN 47405 (812) 856-0969 [email protected] Cassie Peters, J.D., LL.M. Evan Hansen, M.S. Fritz Boettner, M.S. Meghan Betcher, M.S. Downstream Strategies 295 High Street, Suite 3 Morgantown, WV 26505 (304) 292-2450 www.downstreamstrategies.com
Transcript of Overcoming the Market Barriers to Organic Production in West Virginia

James Farmer, Cassie Peters, Evan Hansen, Fritz Boettner, Meghan Betcher
June 28, 2013
Overcoming the Market Barriers to Organic Production in West Virginia
Prepared by: James Farmer, Ph.D. Indiana University 1025 East 7th Street Bloomington, IN 47405 (812) 856-0969 [email protected] Cassie Peters, J.D., LL.M. Evan Hansen, M.S. Fritz Boettner, M.S. Meghan Betcher, M.S. Downstream Strategies 295 High Street, Suite 3 Morgantown, WV 26505 (304) 292-2450 www.downstreamstrategies.com

ii | P a g e
ABOUT THE AUTHORS
James R. Farmer, Ph.D., Indiana University. Dr. Farmer focuses his research on sustainability issues in the rural landscape, which includes sustainable farming and private land conservation. Additionally, Dr. Farmer is on the board of the Local Growers Guild and works with local food and sustainable farming advocacy groups in the Great Lakes and Central Appalachian regions.
Cassie Peters, J.D., LL.M., Agriculture and Food Policy Manager, Land Program, Downstream Strategies. Ms. Peters focuses on issues related to sustainable agricultural methods, local food systems, and urban agriculture. She has a legal background with extensive experience analyzing sustainability plans, local food policies, organic production, and agricultural policies.
Evan Hansen, M.S., President, Downstream Strategies. Mr. Hansen explores resource and environmental problems and solutions in three areas: water, energy, and land. He manages interdisciplinary research teams, performs quantitative and qualitative policy and scientific analyses, provides litigation support and expert testimony, develops computer tools, provides training, and performs field monitoring.
Fritz Boettner, M.S., Principal, GIS Program, Downstream Strategies. Mr. Boettner has over ten years of professional experience in a wide array of environmental consulting activities. He uses GIS to complete projects at the local, regional, and national levels in the fields of planning, water resources, and environmental science.
Meghan Betcher, M.S., Staff Environmental Scientist, Downstream Strategies. Ms. Betcher offers expertise in environmental science, specifically microbiology and ecology. She is experienced in project design, field sampling, data analysis, and presentation of complex scientific findings to academics, students, and community groups.
Overcoming the Market Barriers to Organic Production in West Virginia

iii | P a g e
ACKNOWLEDGEMENTS
This project was supported by Organic Agriculture Research and Extension Initiative Competitive Grant no. 2011-51300-30709 from the USDA National Institute of Food and Agriculture.
We thank the farmers who took the time to participate in the telephone interviews and complete the mailed questionnaires. This project would not have been possible without their input. We also greatly appreciate the feedback we received on the questionnaire and interview scripts from farmer Tim Alexander, Dr. Tim Woods, farmer Dominique Wong, farmer Dr. Jennifer Meta-Robinson, Dr. Jim Kotcon, Laura Hartz, Megan Grandfield, and Anne Stroud. Their assistance was greatly appreciated. Finally, we offer the utmost gratitude to the United States Department of Agriculture for financial support of this project in the hope of promoting organic production and certification in West Virginia and beyond.
iv | P a g e
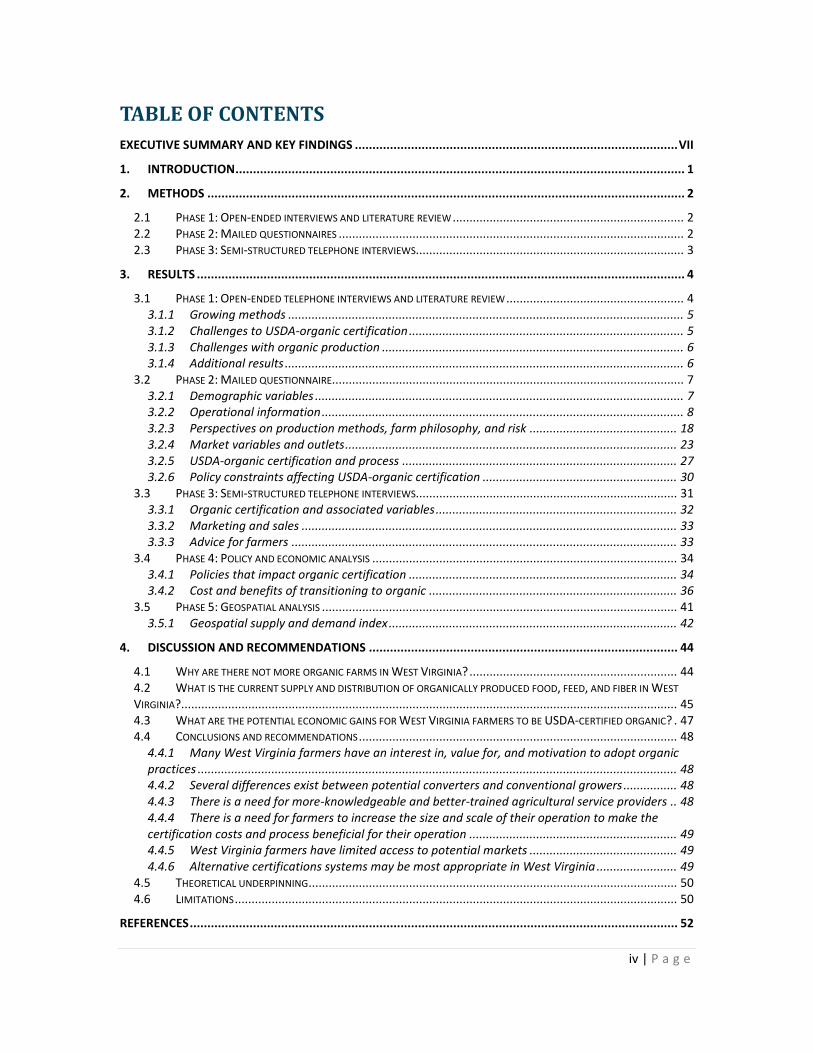
TABLE OF CONTENTS
EXECUTIVE SUMMARY AND KEY FINDINGS ............................................................................................ VII
1. INTRODUCTION ................................................................................................................................ 1
2. METHODS ........................................................................................................................................ 2
2.1 PHASE 1: OPEN-ENDED INTERVIEWS AND LITERATURE REVIEW ..................................................................... 2 2.2 PHASE 2: MAILED QUESTIONNAIRES ....................................................................................................... 2 2.3 PHASE 3: SEMI-STRUCTURED TELEPHONE INTERVIEWS................................................................................ 3
3. RESULTS ........................................................................................................................................... 4
3.1 PHASE 1: OPEN-ENDED TELEPHONE INTERVIEWS AND LITERATURE REVIEW ..................................................... 4 3.1.1 Growing methods ...................................................................................................................... 5 3.1.2 Challenges to USDA-organic certification .................................................................................. 5 3.1.3 Challenges with organic production .......................................................................................... 6 3.1.4 Additional results ....................................................................................................................... 6
3.2 PHASE 2: MAILED QUESTIONNAIRE......................................................................................................... 7 3.2.1 Demographic variables .............................................................................................................. 7 3.2.2 Operational information ............................................................................................................ 8 3.2.3 Perspectives on production methods, farm philosophy, and risk ............................................ 18 3.2.4 Market variables and outlets ................................................................................................... 23 3.2.5 USDA-organic certification and process .................................................................................. 27 3.2.6 Policy constraints affecting USDA-organic certification .......................................................... 30
3.3 PHASE 3: SEMI-STRUCTURED TELEPHONE INTERVIEWS.............................................................................. 31 3.3.1 Organic certification and associated variables ........................................................................ 32 3.3.2 Marketing and sales ................................................................................................................ 33 3.3.3 Advice for farmers ................................................................................................................... 33
3.4 PHASE 4: POLICY AND ECONOMIC ANALYSIS ........................................................................................... 34 3.4.1 Policies that impact organic certification ................................................................................ 34 3.4.2 Cost and benefits of transitioning to organic .......................................................................... 36
3.5 PHASE 5: GEOSPATIAL ANALYSIS .......................................................................................................... 41 3.5.1 Geospatial supply and demand index ...................................................................................... 42
4. DISCUSSION AND RECOMMENDATIONS ........................................................................................ 44
4.1 WHY ARE THERE NOT MORE ORGANIC FARMS IN WEST VIRGINIA? .............................................................. 44 4.2 WHAT IS THE CURRENT SUPPLY AND DISTRIBUTION OF ORGANICALLY PRODUCED FOOD, FEED, AND FIBER IN WEST
VIRGINIA?.................................................................................................................................................... 45 4.3 WHAT ARE THE POTENTIAL ECONOMIC GAINS FOR WEST VIRGINIA FARMERS TO BE USDA-CERTIFIED ORGANIC? . 47 4.4 CONCLUSIONS AND RECOMMENDATIONS ............................................................................................... 48
4.4.1 Many West Virginia farmers have an interest in, value for, and motivation to adopt organic practices ............................................................................................................................................... 48 4.4.2 Several differences exist between potential converters and conventional growers ................ 48 4.4.3 There is a need for more-knowledgeable and better-trained agricultural service providers .. 48 4.4.4 There is a need for farmers to increase the size and scale of their operation to make the certification costs and process beneficial for their operation .............................................................. 49 4.4.5 West Virginia farmers have limited access to potential markets ............................................ 49 4.4.6 Alternative certifications systems may be most appropriate in West Virginia ........................ 49
4.5 THEORETICAL UNDERPINNING .............................................................................................................. 50 4.6 LIMITATIONS .................................................................................................................................... 50
REFERENCES ........................................................................................................................................... 52

v | P a g e
TABLE OF TABLES
Table 1: Emergent themes from Phase 1 informal telephone interviews .............................................. 5 Table 2: Level of educational attainment ............................................................................................... 7 Table 3: Household income .................................................................................................................... 7 Table 4: Number of generations of family ownership of the farm ......................................................... 7 Table 5: Cross-tab and Chi-square results of farm and demographic characteristics based on farming methods .................................................................................................................................................. 8 Table 6: Gross and net farm income (by percentage)........................................................................... 12 Table 7: Common farm products grown and raised by West Virginia farmers ..................................... 15 Table 8: Mean scores on farming values and philosophy ..................................................................... 19 Table 9: Results of Wilcoxen Signed-Rank Test comparing rankings .................................................... 19 Table 10: Differences in farming values and philosophy between conventional and potentially organic farmers .................................................................................................................................................. 20 Table 11: Issues affecting farms and dependence in regard to economic performance of the farm .. 21 Table 12: Results of Wilcoxen Signed-Rank Test comparing rankings .................................................. 21 Table 13: Frequency of important farm goals....................................................................................... 22 Table 14: Motivations for maintaining current farming system ........................................................... 22 Table 15: Themes and subthemes on the meaning of USDA-organic symbol ...................................... 28 Table 16: Interest in pursuing USDA-organic certification .................................................................... 28 Table 17: Results of Wilcoxen Signed-Rank Test comparing rankings .................................................. 29 Table 18: Differences in views toward USDA-organic certification between conventional and potentially organic farmers ................................................................................................................... 30 Table 19: Emergent themes from Phase 3 semi-structured telephone interviews .............................. 32
TABLE OF FIGURES
Figure 1: Acres farmed ............................................................................................................................ 9 Figure 2: Acres owned ........................................................................................................................... 10 Figure 3: Internet use ............................................................................................................................ 11 Figure 4: Gross income.......................................................................................................................... 12 Figure 5: Net income ............................................................................................................................. 13 Figure 6: Use of United States Department of Agriculture programs .................................................. 14 Figure 7: Types of farm products produced .......................................................................................... 16 Figure 8: Percent of farmers by farm product ...................................................................................... 17 Figure 9: Regional distribution patterns from Eastern Panhandle farms ............................................. 24 Figure 10: Regional distribution patterns from north-central West Virginia farms ............................. 25 Figure 11: Regional distribution patterns from Greenbrier Valley farms ............................................ 26 Figure 12: Regional distribution patterns from Huntington-area farms .............................................. 27 Figure 13: West Virginia farms by value of sales, 2007 ........................................................................ 36 Figure 14: Estimated organic price premiums for the top ten fruit and vegetable commodities ........ 40
vi | P a g e
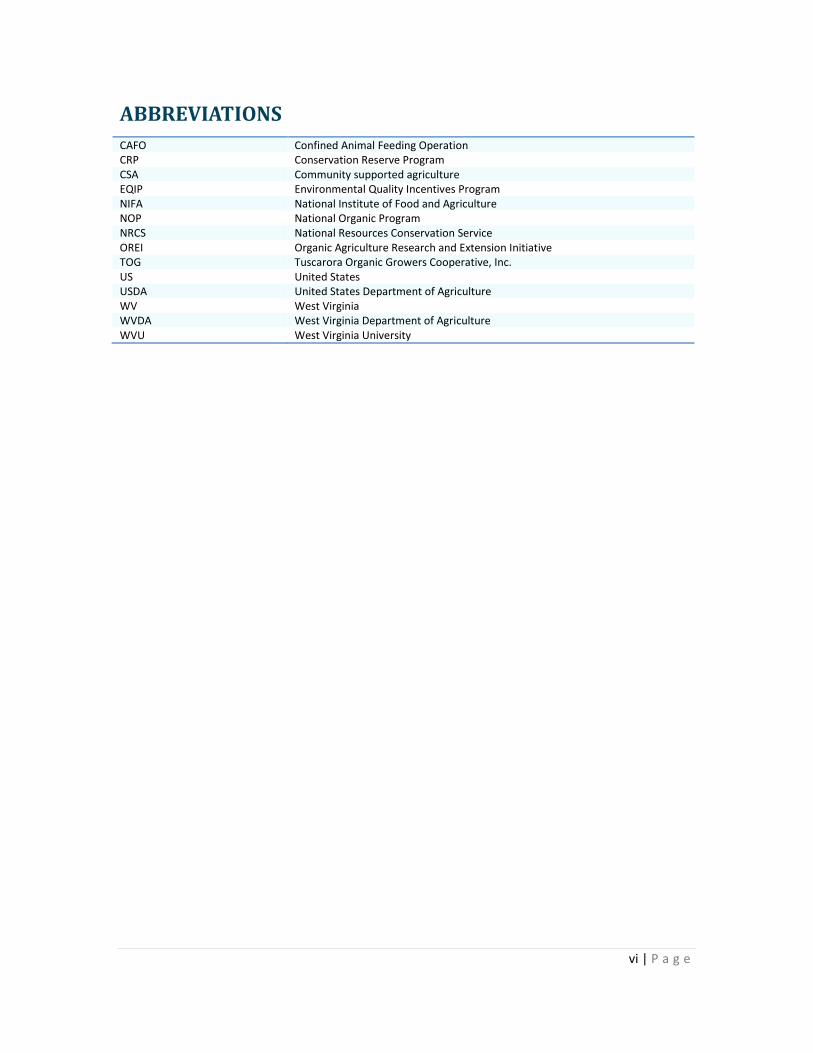
ABBREVIATIONS
CAFO Confined Animal Feeding Operation CRP Conservation Reserve Program CSA Community supported agriculture EQIP Environmental Quality Incentives Program NIFA National Institute of Food and Agriculture NOP National Organic Program NRCS National Resources Conservation Service OREI Organic Agriculture Research and Extension Initiative TOG Tuscarora Organic Growers Cooperative, Inc. US United States USDA United States Department of Agriculture WV West Virginia WVDA West Virginia Department of Agriculture WVU West Virginia University

vii | P a g e
EXECUTIVE SUMMARY AND KEY FINDINGS
There are very few certified organic farms in West Virginia. Consequently, the aim of this project was to comprehend the market variables affecting organic production, certification, and distribution through a multi-phase research design.
Phase 1 used informal in-depth interviews and a literature review to develop a mailed questionnaire that was used in Phase 2. This questionnaire solicited data on farmer and farm characteristics; farmers’ motives, values, and risk perceptions; and farmers’ opinions and considerations on organic production and certification. Phase 3 solicited detailed data from some individuals who participated in Phase 2 through the use of semi-structured telephone interviews.
Data were analyzed using a phenomenological framework for the qualitative data of Phases 1 and 3, thematic coding for the qualitative data from Phase 2, and statistical analyses (including descriptive statistics, reliability analysis, and non-parametric comparison tests) for Phase 2 quantitative data.
Additional research was performed on policies that impact decisions by West Virginia farmers to transition to organic methods, as well as on the costs and potential price premiums that impact the economics of transitioning to organic. Geographic information systems were used for spatial analysis of results.
In Phase 2, 884 questionnaires were mailed to potential participants, and we received a 29.2% response rate. For data analysis, farmers were classified as being either “conventional” or “potential converters to organic” (if they describe their farm as organic, are in transition to being USDA-certified organic, or classify their farm as “natural” or another similar style). Respondents were split relatively evenly between these two categories: 114 conventional farmers and 96 potential converters.
In general, West Virginia farms are small, both in terms of size and income. Respondents farm 78 acres on average, but approximately one-half of respondents farmed less than 20 acres. Further, approximately one-half of respondents generated gross revenues of less than $5,000 per year, and approximately two-thirds generated between $5,000 and $10,000. The small size and low incomes of West Virginia farmers underlie several of the issues related to a transition to organic certification.
Why are there not more organic farms in West Virginia?
There are very few organic farms in West Virginia. While the 2007 Agriculture Census counted 84 farms as certified organic and 132 as in transition, this study was able to find only six farms that are currently USDA-organic certified and another seven that are in transition.
There are several interrelated issues that explain why so few West Virginia farmers are organic: the size and scale of West Virginia farms, potential consumers, cynicism about USDA-organic certification, misconceptions about USDA certification processes and costs, perception of costs versus benefits, and the need for certification in order to meet the goals of the farm.
What is the current supply and distribution of organically produced food, feed, and fiber in West Virginia?
A wide variety of vegetables, fruits, nuts, meat, and other products are produced by the farms that participated in this study. Respondents’ farms are generally diverse, and no clear-cut spatial patters emerged regarding which counties produce which products. After classifying farm products into five categories—vegetables, fruits/nuts, miscellaneous plants, meats, and miscellaneous animals—it was

viii | P a g e
found that at least one respondent in each county produces at least one product in each category. This underscores the diversity of farm products grown and raised by West Virginia farmers.
Farmers in different regions of West Virginia have access to different markets. In all four of the key regions we investigate, farmers sell their products within their local region. But farmers in the Eastern Panhandle tend to be oriented to the east and sell to the large metropolitan areas of Washington, D.C.; northern Virginia; and Baltimore, Frederick, and Hagerstown, Maryland. Farmers in north-central West Virginia, in contrast, focus more of their distribution within West Virginia, although they also access markets in Waynesburg, Pennsylvania; Garrett County, Maryland; New York City; and international markets.
Farmers within the Greenbrier Valley region sell exclusively within West Virginia. Farmers in the Huntington area, by contrast, sell within West Virginia but also to New York City; Washington, D.C.; Garrett County, Maryland; Atlanta, Georgia; and international markets. Compared with the other three areas, Huntington-area farmers report the widest diversity of destinations for their farm products.
What are the potential economic gains for West Virginia farmers to be USDA-certified organic?
Decisions regarding organic certification consider certain tradeoffs: Growers weigh the extra expense and paperwork associated with certification against the potential price premiums that certified organic products could command in the marketplace and the potential additional costs (or savings) encountered when using organic methods.
Many respondents expressed skepticism regarding price premiums for organic products—especially conventional farmers who are the very people who would be making decisions to transition to organic. Depending on what markets are used for distribution, price premiums may or may not be available, or may be larger or smaller. In general, data provided by two West Virginia distributors, as well as data from the USDA Agricultural Marketing Service for nearby produce terminals, are generally consistent and confirm that price premiums for certified-organic products can be quite substantial.
Care must be taken in interpreting these results, however, because data are not available on price premiums for products sold in local markets. In order to take advantage of these price premiums, West Virginia farms would likely need to sell their organic produce via regional distributors to reach customers willing to pay the premium. This, in turn, has implications for many other aspects of a farmer’s operation: the scale of production that may be required at each farm, certifications (other than organic) that may be required by regional distributors, packing requirements, and other aspects.
Six main conclusions emerged from this research:
Many West Virginia farmers have an interest in, value for, and motivation to adopt organic practices.
Several differences exist between potential converters and conventional growers.
There is a need for more knowledgeable and well-trained agricultural extension employees.
There is a need for farmers to increase the size and scale of their operation to make the certification costs and process beneficial for their operation.
West Virginia farmers have limited access to potential markets.
Alternative certifications systems may be most appropriate in West Virginia.
1 | P a g e
1. INTRODUCTION
This Organic Agriculture Research and Extension Initiative (OREI) planning project sought to answer the question: Why are there not more organic farms in West Virginia and Central Appalachia? According to the United States Department of Agriculture (USDA) (2009), West Virginia contains 1% of the nation’s farms, but less than 0.6% of the nation’s organic farms. Less than 0.4% of the farms in West Virginia are USDA-certified organic, compared to the national average of 0.66%. The data show that West Virginia’s organic industry lags behind that of the rest of the nation while demand for organic products continues to increase (Lillard and Lindner, 2012). Research concerning constraints and barriers that hinder conventional farmers from transitioning to USDA-certified organic production is sparse (Archer and Kludze, 2006). Still, organic production is one of the fastest growing sectors of the agriculture industry, having sustained growth between 15-21% each year between 1999 and 2009 (Dimitri and Oberholtzer, 2009; Kuminof and Wossink, 2009).
However, a recent report focused on the enhancement of organic agriculture production in Oregon and how it relates to research, education, and policy (Stephenson et al., 2012). This report investigates the variables affecting organic production and distribution by considering barriers. Three organic and local food stakeholder populations were included in the study: researchers, farmers, and others. According to this report, the top eight barriers to organic production and profitability include:
weed management,
costs of organic production,
farm labor,
fertility management,
yields,
insect pest management,
marketing of farm products, and
access to organic inputs (Stephenson et al., 2012).
For farmers engaged in the production of specialty crops, weed control, cost of production, and farm labor ranked first through third. Eight main themes emerged from focus group interviews: consumer base, skilled labor, inputs, regulations and certifications, market access, research interests, educational needs, and new opportunities (Stephenson et al., 2012).
Additional similar studies are necessary to generate a better understanding of the barriers affecting organic certification and production. Further marketing and policy constraint research should decrease the bottleneck caused by an increased demand and an insufficient supply of organic foods in the United States (Thilmany, 2006). Kuminof and Wossink (2009) find little theoretical or empirical evidence concerning the compensation needed by farmers to convert their production from conventional methods to organic methods. Previous research does little to explain the policy and economic factors that impede adoption of organic production methods, especially those specific to central Appalachia. Therefore, we attempted to comprehend the variables constraining and facilitating the transition from conventional to organic farming, as well as USDA-organic certification.
The three research questions are as follows:
1. Why are there not more organic farms in West Virginia? (OREI Legislative Goal 5) 2. What is the current supply and distribution of organically produced food, feed, and fiber in
West Virginia? (OREI Legislative Goal 5) 3. What are the potential economic gains for West Virginia farmers to be USDA-certified
organic? (OREI Legislative Goal 2)
2 | P a g e
2. METHODS
Phases 1 through 3 of the study used a sequentially embedded mixed methods research design that involved open-ended and semi-structured telephone interviews and mailed paper surveys (Creswell and Clark, 2007). The sequentially embedded design allowed one step to inform the development and facilitation of proceeding steps and the use of multiple data sets to offset the limitations of another (Greene et al., 1989). Participants in this study included four groups of West Virginia farmers:
USDA-certified organic growers,
non–USDA-certified organic growers,
conventional growers, and
in-transition growers.
2.1 Phase 1: Open-ended interviews and literature review
Phase 1 entailed the use of open-ended telephone interviews and a literature review to develop two questionnaires that were used to solicit data in Phase 2. Telephone interviews were utilized to gather data from a variety of farmers from across the state in order to minimize project costs. Additionally, these interviews allowed for a greater representation of farmers who otherwise may have not been able to convene for focus groups.
Interview participants were purposely selected to focus on individuals who would have some knowledge about organic farming and USDA-organic certification (Riddick and Russell, 2009). In total, 14 individuals participated in the telephone interviews. Data were phenomenologically analyzed. The phenomenological data analysis included three primary steps: (1) the investigation of the phenomena through informal interviews; (2) identification of general themes/essences of the phenomena; and (3) delineation of essential relationships among the themes (Creswell, 2007). Step 1 consisted of collecting the data and coding initial concepts, terms, and phrases of the participants’ interviews into distinct categories. Initial categories were created consistent with Moustakas’ framework for phenomenological coding (Moustakas, 1994). Step 2 consisted of organizing the clusters of data from the subsequent categories and analyzing each for emergent themes that exist among the different participants’ interviews. The emergent themes and phrases contained within the data were then evaluated in conjunction with the original transcription to validate the observed phenomena. In Step 3, researchers evaluated the phrases, categories, and themes, examining each for internal consistency. This included the review and crosschecking of data among the three research team members to establish a consensus on the coded data and emergent themes. Similar to interpretive biographers, phenomenology views verification and standards as largely related to the researchers’ interpretations (Moustakas, 1994). General thematic coding and classification was used on data that were readily quantifiable, such as farm products and demographics.
2.2 Phase 2: Mailed questionnaires
Data garnered from Phase 1 were used to develop two Phase 2 questionnaires. One questionnaire was developed for USDA-certified organic farms while a second was developed for all other farm types (non–USDA-certified, in-transition, and conventional growers). Non–USDA-certified organic farms include those that are using organic practices, but have not sought USDA-organic certification or have exempt status. In-transition farms indicate that the farms/farmers are pursuing USDA-organic certification. Conventional farms refer to those using mainstream practices, including the use of non-organic methods and inputs. The two questionnaires were developed and refined between

3 | P a g e
December 2011 and February 2012; however, only one was used due to the low number of USDA-certified organic farms.
The research team used a variety of mechanisms to compile a list of West Virginia farmers. A participant list from the West Virginia Small Farms Conference was provided by the West Virginia Small Farm Center and supplied the greatest number of contacts. The project team also gathered contact information from the online Local Harvest database (www.localharvest.org), through open recruitment at meetings and conferences in Huntington and Morgantown, by contacting the market managers for all farmers markets in West Virginia, and through the West Virginia Small Farm Advocate periodical, the West Virginia Department of Agriculture (WVDA), the West Virginia Farmers Market Association, email announcements by the West Virginia Food & Farm Coalition, and the researchers’ personal contacts.
Prior to distributing the questionnaires by mail, an expert panel of scholars and conventional, organic, and specialty-crop farmers were asked to review and provide feedback on the questionnaire. Based on the panel’s input, the questionnaires were revised. Mailing 1 occurred on January 25, 2012, and included a postcard describing the study and an invitation to participate. Mailing 2 occurred on February 1, 2012, and included an invitation letter, the questionnaire, and a pre-addressed, stamped return envelope. Mailing 3, a follow-up postcard reminder, was sent on February 7, 2012. Mailing 4, a final distribution of the invitation letter, questionnaire, and return envelope, was sent on February 14, 2012.
As completed questionnaires were returned, data were input into an online survey using the Survey Monkey tool via iPads. This process decreased the number of input errors that may occur using a traditional spreadsheet system. Three undergraduate students at Earlham College and Dr. James Farmer completed this process. Upon receipt, the research team kept count of completed questionnaires, those with insufficient addresses, and those where the intended recipient indicated they were no longer a candidate for the study.
On May 2, 2012, data were downloaded from Survey Monkey in IBM SPSS format. A variety of analyses were performed on the data, including the following: general descriptive and frequency counts, cross-tabulation, Chi-square, Analysis of Variance, and comparison tests for non-parametric data (Wilcoxen Signed-Rank Test). Open-ended and fill-in-the-blank questions were thematically coded based on Bernard (Bernard, 2006).
2.3 Phase 3: Semi-structured telephone interviews
In Phase 3, semi-structured telephone interviews were conducted to solicit follow-up data among questionnaire participants. Questionnaire participants were purposely grouped and selected to participate. Five groups were developed: Group 1 consisted of farmers who were once USDA-certified organic and no longer maintain USDA certification; Group 2 consisted of farmers who are in transition to USDA-certified organic; Group 3 consisted of farmers who are practicing organic farming methods and have gross income of $5,000 or more; Group 4 consisted of conventional farmers grossing in excess of $5,000 from farming of specialty crops; and Group 5 consisted of farmers who are practicing organic farming methods and have gross income less than $5,000. Each group had several questions that overlapped between scripts, as well as a few unique to each group.
Data were phenomenological analyzed using the methods described above in Section 2.1. Interviews were stopped once there were no remaining individuals in each group to contact.

4 | P a g e
3. RESULTS
3.1 Phase 1: Open-ended telephone interviews and literature review
The researchers started with a literature review and informal telephone interviews in order to identify those variables affecting organic production and certification. Results were used to develop the survey instruments for Phase 2.
Through the literature search, the researchers found a dearth of studies that sought to understand the factors promoting or constraining organic certification and production in the United States. However, a multitude of studies existed for areas in Europe—most notably from northern Europe—that attempted to comprehend variables affecting organic producers and the transition from conventional to organic production (Lohr and Salomonsson, 2000; Offerman and Nieberg, 2000; Willock et al., 1999). Variables included income potential, production and yield, costs (time and financial), personal health, quality of life, farming philosophy, environmental attitude, and risk.
A seminal article that assisted in the development of the questionnaire sought to understand farmers’ perceptions of risk and motivations for production methods and farming philosophy (Koesling et al., 2004). This project utilized and adapted multiple scales from this article, which had established reliability levels for internal consistency. Scales used included those for farm goals, risk and risk attitude, and variables with economic impacts on the farm. Other scholarship to note emerged from Australia and New Zealand, where organic agriculture production comprises a larger market share than in the United States (Fairweather, 1999; Fairweather, 1996; Martin, 1996).
Fourteen informal telephone interviews were conducted in order to solicit data that assisted in the development of the questionnaires for Phase 2. Interviews were conducted in November and December 2011. Interview times ranged from 8 to 36 minutes, with an average interview concluding after 15 minutes. Participants were asked a range of questions and provided with multiple prompts, including the following:
Can you tell me about your farm?
What types of growing methods do you utilize?
Do you have any opinions on organic production? o What are they?
Do you have any opinions on the USDA-organic certification? o What are they?
Interviews were recorded and transcribed verbatim. A phenomenological analysis was then conducted, with three main themes emerging. Other data were coded and categorized, including farm products and participant demographics. Based on Creswell, inferences and conclusions can be made from as few as 10 interviews (Creswell, 2007). The researchers chose to err on the high side, conducting 14 interviews. Table 1 details the emergent themes and subthemes from these interviews.

5 | P a g e
Table 1: Emergent themes from Phase 1 informal telephone interviews
Growing methods Challenges to USDA-organic certification Challenges to organic production
Weed control Alternative certifications to USDA-organic certification
Costs and availability of organic animal feed
Insects and pest control What does it mean/for big agriculture It does not work Boycotting synthetics Costs Organic fertilizer expense Restoring soils Lack of benefits Lack of labor Fertilizers and growing Mountains of paperwork Lack of demand
Animal feed Lack of understanding of USDA-organic certification
3.1.1 Growing methods
Participants often discussed “growing methods” for crops and livestock, such as controlled burns or using the “Red Dragon,” a portable propane burner. Farmers also mentioned mulching and the use of fabric for weed suppression. The use of neem oil, castile soap, Listerine, and a pepper/garlic mix for warding off insect and mammal pests were discussed. Others use chickens and guinea fowl and their insect consumptive behavior as a means for biological control in their vegetable fields.
Another subtheme was that farmers noted that they boycott or attempt to not use any petroleum-based herbicides or insecticides. Three farmers discussed activities associated with restoring soil fertility, such as the use of cattle to fertilize and spread seeds. Others discussed the use of green manure. The fertilizer/growing sub-theme was highlighted with individuals discussing alternative fertilization methods, such as the use of “rock dust,” hydroponics, rabbit manure, and a chicken manure “tea.”
The challenge of finding or growing organic animal feed was discussed by three participants. One person discussed how it is cost prohibitive to buy organic animal feed and finding feed without antibiotics was a major challenge.
3.1.2 Challenges to USDA-organic certification
A second theme to emerge was “challenges to USDA-organic certification.” Two farmers discussed that they were pursuing alternative certifications, as they felt the USDA certification process had been co-opted by large-scale industrial agriculture. Five other farmers noted they are challenged by the term “organic” and what it actually means. One participant noted that “organic certification is really such a loose term anymore,” while another stated, “again the organic terminology, kind of, turns me off a little bit because that is so loosely used anymore.”
Nearly all of the interviewees mentioned the costs associated with becoming USDA-certified organic. One person stated “It was just, every year they raised the cost and we just did not see that we were gaining anything from the agency.” Another person noted, “I heard the other farmers talk about why they got out of it because of cost and so forth and how much it costs them every year and so forth, it was like for us it is a little farm and the amount of money that we bring in, it would not be cost effective for us to do that.”
In relation to the costs of certification, several farmers mentioned that they felt there are a lack of benefits, particularly for the size and scale of their farms. The following excerpt reflects the sentiments of several farmers:
Another was our customers have grown to know us and trust us and they know that we are not going to do anything that is going to harm them or the soil while we are producing our food because we are also consuming that same food that we are producing for them. And,

6 | P a g e
we have grandsons so they have just come to trust us to know we are going to do what is best. We really did not see where we, economically, we didn’t see where it was benefiting us. I mean, we are not going to change anything about our practices but we were getting the same price at the farmers market that the other farmers were getting and they are not certified. So, there are many different factors in it.
Other farmers mentioned that the amount of paperwork was a deterrent for them. One farmer mentioned that he did not have time to maintain the paperwork trail even though he would be in compliance based on practice. Another noted:
I would need a secretary to keep up with all of the paperwork for that, would not have any time on the field, because originally that is what I was going to do. I looked into it, I got the paperwork, I had all the paperwork, and I had all the forms and then the fees. Then, another USDA would like reimburse you the cost or whatever. But, the paperwork – I do not have the time to be looking at it and do what I need to do and keep up with all of the paperwork.
As illustrated by the previous quote, lack of understanding was the final subtheme of the challenges to USDA-organic certification, with farmers mentioning that they do not fully understand the process or the requirements. Another participant noted “it’s probably just the knowledge, or lack thereof, at this point, to method and substances that I can use. That is just one of the things on the list to try and learn and I am just, I’m not quite there yet.”
3.1.3 Challenges with organic production
The final theme was “challenges with organic production.” Again, the cost of organic feed emerged and was discussed by five participants. Two participants expressed skepticism toward organic production, with one stating that organic methods just “do not work as well.” Others discussed the challenge with finding organic fertilizers. Two participants discussed lack of human power. Finally, several farmers mentioned issues with marketing organic foods to people in their area due issues related to lack of income. One noted “I thought about it but around here, it is so hard to get rid of vegetables and stuff anyway that to me it is not really worth it. People around here, especially where I am from, I am from the Burlington area, the people around here just do not have much money, you have to charge more for organic stuff.”
3.1.4 Additional results
Most commonly, the farmer participants indicated that they sell their farm products through farmers markets (with two individuals discussing selling in the suburbs of Washington, D.C.). Others sell direct from the farm. Only two individuals noted that they have Community Supported Agriculture (CSA) programs, with another two noting they sell direct to restaurants and grocery stores. One farmer indicated that he provides a delivery/drop-off service to the Huntington community for items including eggs, honey, fresh bread, and vegetables.
Of the 14 farmers interviewed, six were female and the average age was 52.5 years. Thirteen individuals indicated their ethnicity as Caucasian, with one person not answering the question. Seven individuals hold a bachelor’s degree or higher, two have an associate’s degree, one had vocational training, and one indicated a high school degree as their highest level of education. Over 50% had been involved in farming less than four years, with six individuals having been involved for more than five years. Seven of the participants had no formal agricultural training, one has a bachelor’s degree in agriculture, and others received training at workshops/conferences, 4-H, an internship, or on the job. Only two participants indicated they earn 100% of their income from the farm, with seven earning 10% or less.

7 | P a g e
3.2 Phase 2: Mailed questionnaire
Using a modified Salant and Dillman (1994) mailed survey, 884 questionnaires were mailed to potential participants. Among the mailed questionnaires, 65 were returned for insufficient addresses, and 68 were sent back because the recipient no longer qualified to participate in the study. Thus, 751 addresses were deemed valid. We received 219 useable surveys, providing a 29.2% response rate. Some participants left some questions blank; therefore, there are fewer than 219 responses for many questions.
3.2.1 Demographic variables
The mailed questionnaire collected demographic data: age, education, ethnicity, household income, whether the participant farmer had a second job, the number of generations living on the farm, years involved in farming operations, type of setting the farmer grew up in, and whether the farmer had any formal agricultural training.
The average age of the farmers completing the questionnaire was 55.5 years; 90.9% indicated they were Caucasian. More than half of the farmers surveyed (58.9%) had a second job that was off-farm. The farmers, on average, had been involved in farming operations for 24.2 years, with the median years of operation at 19. The majority (61.6%) of participants grew up in a rural setting, with 24.2% growing up in suburban areas and 7.3% growing up in urban areas. Over half of the participants had no formal agricultural training (52.1%). Table 2 through Table 4 summarize the data for the level of educational attainment, household income, and the number of generations of family ownership of the farm.
Table 2: Level of educational attainment
No high school
diploma High school
diploma Technical
degree Some
college Associate’s
degree Bachelor’s
degree Master’s degree
Ph.D. or M.D.
2.8% 18.7% 1.4% 7.8% 5.5% 29.2% 22.4% 5.5% Note: Approximately 7% of respondents did not answer this question.
Table 3: Household income
$1- $19,999
$20,000-$39,999
$40,000-$59,999
$60,000- $79,999
$80,000-$99,999 $100,000+
8.2% 19.6% 24.7% 12.8% 11.4% 12.3% Note: Approximately 11% of respondents did not answer this question.
Table 4: Number of generations of family ownership of the farm
1 2 3 4 5 or more
68.4% 11.0% 5.9% 5.0% 9.0% Note: Approximately 1% of respondents did not answer this question.
Farmers were classified as being either “conventional” or “potential converters to organic.” Potential converters include participants who described their farms as organic, “natural,” or another similar style or are in transition to being USDA-certified organic. Cross tablature calculations were used to compare these two groups. Based on Chi-Square results, potential converters to organic are younger, share farm responsibilities more equally between men and women, farm smaller acreage, have attained higher levels of education, appear to have greater access to the Internet on the farm, and were more often from suburban or urban areas than their conventional counterparts. No statistical difference was found between the two groups related to participation in USDA-sponsored programs. Table 5 summarizes the results for each of these groups and the related statistical p-values.

8 | P a g e
Table 5: Cross-tab and Chi-square results of farm and demographic characteristics based on farming methods
Characteristic/Sub-characteristic Conventional Potential converters to USDA-certified organic
p-value (Pearson Chi-square)
Farm type 114 96
Age .000 18-29 8 4 30-44 11 19 45-59 40 41 60-74 35 24 75+ 17 3
Gender responsibility .001
Male(s) 57 24 Female(s) 8 17 Male(s) and female(s) 52 55
Acres farmed .000 <1 2 1 1-4.99 18 35 5-9.99 6 16 10-19.99 10 12 20-49.99 24 15 50-99.99 13 4 100-249.99 23 11 250+ 15 1
Education .000 No school diploma 5 1 Post high school training/education 42 31 Bachelor’s degree 28 36 Post-bachelor’s degree 37 24
Internet access .027 Yes 80 79 No 31 14
Type of setting raised in .000 Rural 88 47 Suburban 18 36 Urban 7 9
Use of USDA programs .061 Yes 5 1 No 113 91
Note: p-values less than 0.05 are considered to demonstrate statistically significant differences between conventional farmers and potential converters to USDA-certified organic.
3.2.2 Operational information
More than half of participants used conventional methods of farming (51.6%), 39.7% used organic methods but were not USDA-certified organic, 2.3% were in transition to USDA-organic certification, and 1.4% were organic but exempt from certification requirements.1 Additionally, 2.7% of
1 Approximately 5% of respondents did not answer this question.

9 | P a g e
participants indicated that they had once been USDA-certified organic and that they let their certification expire.
On average, roughly 78 acres were farmed (See Figure 1), and 84.9% of farmers owned all of their land. On a 1-10 scale—with 1 indicating low soil fertility and 10 indicating high soil fertility—the mean score among participants concerning their soil fertility was 6.22. Clay was the most common soil type.
Figure 1: Acres farmed

10 | P a g e
Figure 2: Acres owned
The responsibilities for running the farming operations generally fell to both males and females, with 48.9% of respondents noting men and women both share the responsibilities; 37% noting that only males hold the responsibility of maintaining the farm, and 11.4% noting that only females hold this responsibility.2 Almost three-quarters of respondents (72.6%) noted having Internet access on the farm, with 55.7% indicating that they use it for their farming operations. As shown in Figure 3, Internet use is at or near 100% in many counties, while it is as low as 60-68% in other counties.
2 Approximately 3% of respondents did not answer this question.

11 | P a g e
Figure 3: Internet use
Respondents reported both their gross and net farm income, as summarized in Table 6. Approximately one-third of respondents grossed $2,500 or less, and about one-half grossed $5,000 or less. This threshold, $5,000, is important because farmers with less than $5,000 in gross organic sales are exempt from two key certification requirements, as discussed in Section 3.4.1.3 Net income, as expected, is skewed even lower; approximately 60% of respondents report a net income of $5,000 or less.
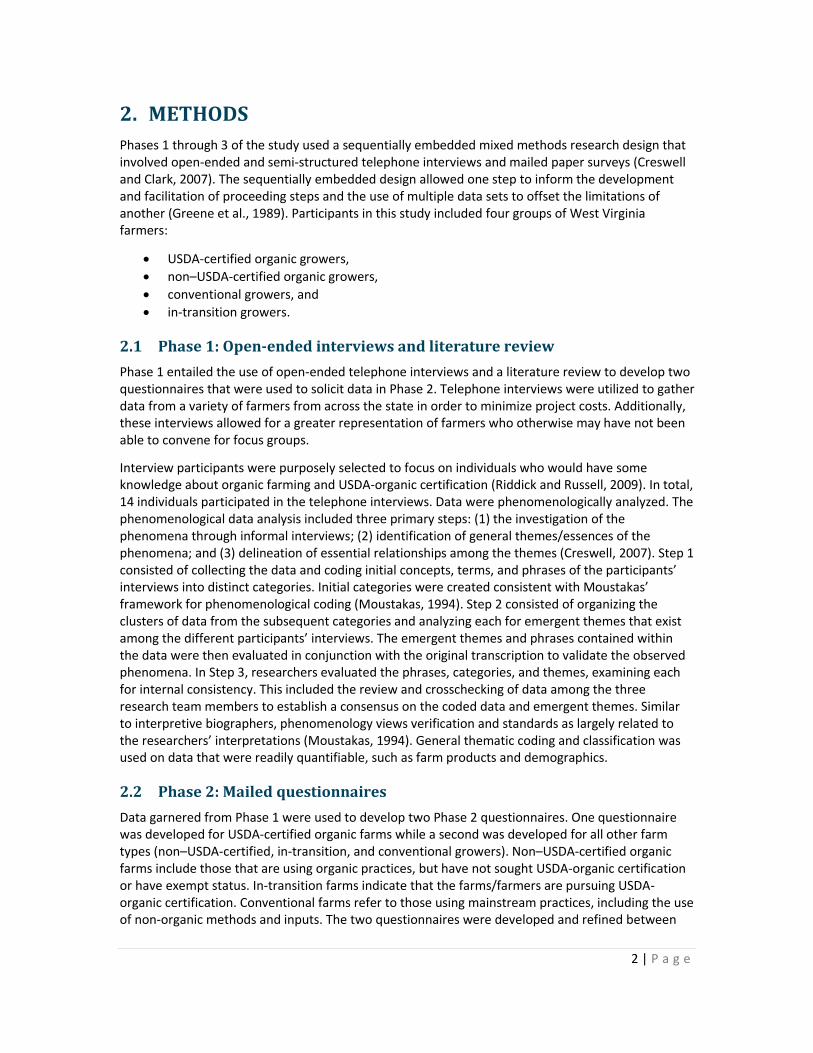
As illustrated in Figure 4, farms with gross incomes above $100,000 are found in a band across northern West Virginia—from the Eastern Panhandle all the way west to the Ohio River. Farms with incomes below $5,000 are scattered throughout the state. Figure 5, which shows net income, illustrates that farms with the highest net incomes are somewhat more evenly distributed across West Virginia.
3 The gross incomes reported in Table 6 are generally comparable with the farm sales shown in Figure 13; however, sales in Figure 13 are from the 2007 Agricultural Census (USDA, 2009) as opposed to the survey conducted for this project.

12 | P a g e
Table 6: Gross and net farm income (by percentage)
$1-$2,500
$2,501- $5,000
$5,001- $10,000
$10,001- $20,000
$20,001- $40,000
$40,001- $60,000
$60,001- $80,000
$80,001- $100,000 $100,001+
Gross 32.4% 17.4% 14.6% 8.2% 8.7% 5.0% 1.4% 0.9% 7.3% Net 43.8% 16.4% 9.1% 8.7% 5.0% 1.8% 0.8% 1.4% 1.0% Note: Approximately 4% of respondents did not report their gross income, and approximately 12% did not report their net income.
Figure 4: Gross income
13 | P a g e
Figure 5: Net income
When asked whether they use USDA programs such as the Environmental Quality Incentives Program (EQIP), Conservation Reserve Program (CRP), subsidies, or insurance, 30.6% of farmers indicated yes, and 61.6% indicated no.4
4 Approximately 8% of respondents did not answer this question.
14 | P a g e
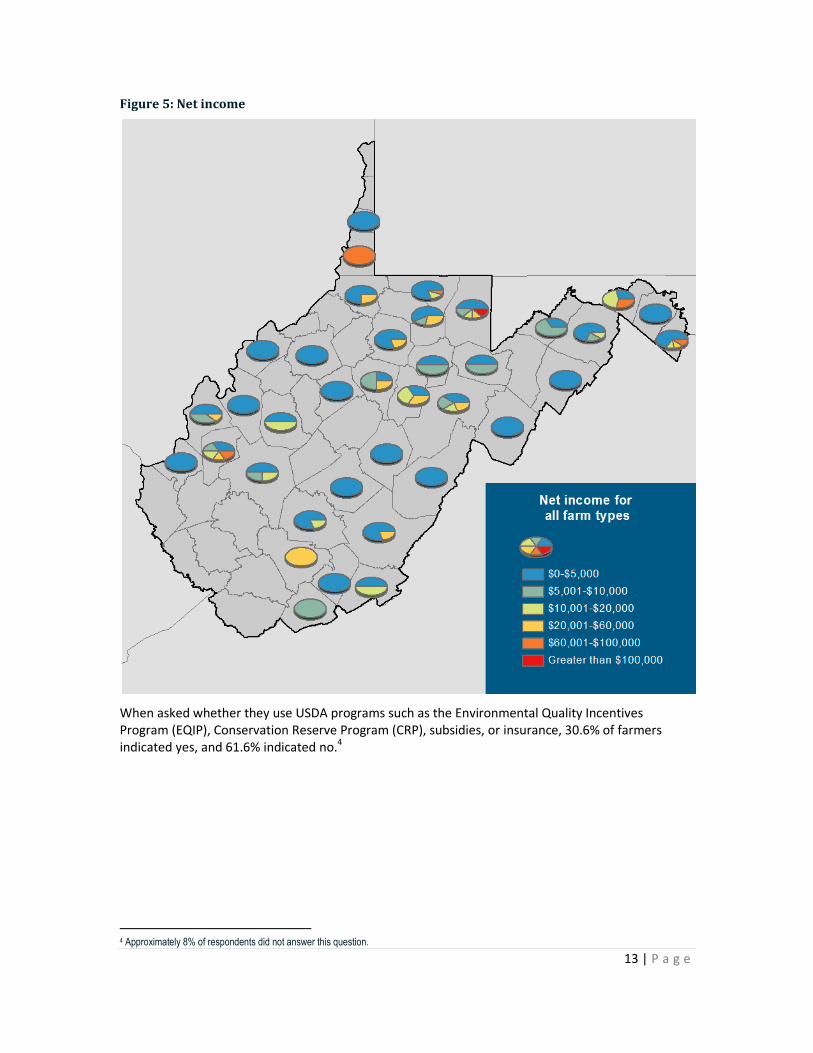
Figure 6: Use of United States Department of Agriculture programs
When asked what the farm produced, many individuals indicated vegetables in general, followed in rank by tomatoes, beans, squash, cucumbers, potatoes, sweet corn, onions, cabbage, and bell peppers. Apples, berries (in general), and peaches were the most common amongst fruits and nuts. Hay, herbs, and cut flowers were commonly grown miscellaneous plant products. Common meats included beef, chicken, lamb, and pork. Miscellaneous animal products—including eggs, honey, dairy products from goats, and wool—were also somewhat common. Table 7 contains the top-ranking items for each category.

15 | P a g e
Table 7: Common farm products grown and raised by West Virginia farmers
Vegetables f Fruits/Nuts f Misc. Plants f Meats f Misc. Animals f Vegetables (general) 70 Apples 26 Hay 42 Beef 44 Eggs 29 Tomatoes 31 Berries 17 Herbs 26 Chicken 21 Honey 19 Beans 27 Peaches 16 Cut flowers 11 Lamb/mutton 18 Dairy (goat) 7 Squash 26 Raspberries 16 #2 corn 9 Pork 14 Wool 3 Cucumbers 23 Blueberries 14 Garlic 9 Goat 5 Alpaca 2 Potatoes 18 Pears 13 Grains 9 Rabbit 4 Cheese 2 Sweet corn 17 Blackberries 12 Bedding plants 7 Fish 3 Llama 1 Onions 17 Tree fruits 11 Mushrooms 7 Turkey 3 Yogurt 1 Cabbage 16 Strawberries 9 Timber 7 Guinea 1 Soap, goat 1 Bell peppers 14 Fruits 8 Ginseng 5 Duck 1 Ice cream 1 Note: f = frequency.
As shown in Figure 7 and Figure 8, no clear-cut spatial patterns emerge regarding the types of farm products produced. In fact, in each county with respondents, at least one farmer produces at least one product in each category, which underscores the diversity of farm products grown and raised by West Virginia farmers.

16 | P a g e
Figure 7: Types of farm products produced

17 | P a g e
Figure 8: Percent of farmers by farm product

18 | P a g e
3.2.3 Perspectives on production methods, farm philosophy, and risk
An additional section of the questionnaire sought to understand variables concerning production methods, farmer management philosophy, and risk behavior (or risk taking). Nearly one-third (30.6%) of farmer participants noted being aware of someone farming that was USDA-organic certified, with 20.1% knowing them personally and 13.2% having a friend or family member who has a USDA-certified organic farm. Additionally, when asked to reflect on the following three prompts and rate one’s level of full disagreement (1) to full agreement (7), the following scores emerged:
I am interested in trying new production methods: 5.84.
I am interested in attempting new methods for marketing my farm’s products: 5.80.
I am interested in alternative finance and investment opportunities: 4.26.
Farmers were also prompted to note their level of agreement or disagreement with 14 statements concerning farming values and farming philosophy issues. Concern about high-quality food and the health of the land ranked highest, with mean scores of 6.48 out of seven. Table 8 details the mean scores for each prompt.
When tested in rank using a Wilcoxen Signed-Rank Test for non-parametric data, significant differences were found between seven of the ranked pairs (see Table 9).

19 | P a g e
Table 8: Mean scores on farming values and philosophy
Prompt Mean score I am concerned with the production of high-quality foods. 6.48 The health of my farm is extremely important to me. 6.48 I attempt to minimize pollution as much as possible on the farm. 6.35 I am willing to adopt and try new farming practices. 6.15 I am interested in learning about new farming techniques and practices. 6.14 I hope my land continues to be farmed after I decide to stop farming. 6.10 Higher soil fertility is an important consideration for me. 6.06 Health risks associated with chemicals/farm applications are one of my concerns. 5.89 I attempt to minimize off-the-farm inputs (fertilizers, purchased feed, etc.) in the processes on my farm.
5.31
The existence of my farm is an important asset to my larger community. 5.02 The farmers I associate with use conventional farming techniques that involve common herbicide and pesticide applications.
4.70
Confined animal feeding operations (CAFOs) are acceptable for raising livestock. 4.57 The farmers I associate with use organic/sustainable farming techniques that do not involve common herbicide and pesticide applications.
4.00
I am able to find seasonal manual laborers readily available when needed. 3.19 Note: These scores are based on a 1 to 7 Likert-style scale, where 1 means that the respondent fully disagrees, and 7 means that the respondent fully agrees. In testing the reliability estimates of these prompts, as a whole, this question set had a Cronbach’s Alpha of 0.903.
Table 9: Results of Wilcoxen Signed-Rank Test comparing rankings
Rank Prompt Rank Comparison prompt p-value
2 The health of the land on my farm is extremely important to me.
3 I attempt to minimize pollution as much as possible on the farm.
0.041
3 I attempt to minimize pollution as much as possible on the farm.
4 I am willing to adopt and try new and innovative farming practices.
0.013
8 Health risks associated with chemicals/farm applications are one of my concerns.
9 I attempt to minimize off-the-farm inputs in the processes on my farm.
0.000
10 The existence of my farm is an important asset to my larger community.
11
The farmers I associate with use conventional farming techniques that involve common herbicide and pesticide applications.
0.016
12 Confined animal feeding operations are acceptable for raising livestock.
13
The farmers I associate with use organic/ sustainable farming techniques that do not involve common herbicide and pesticide applicants.
0.026
13
The farmers I associate with use organic/ sustainable farming techniques that do not involve common herbicide and pesticide applicants.
14 I am able to find seasonal manual laborers readily available when needed.
0.000
Note: Only those with significant results are included.
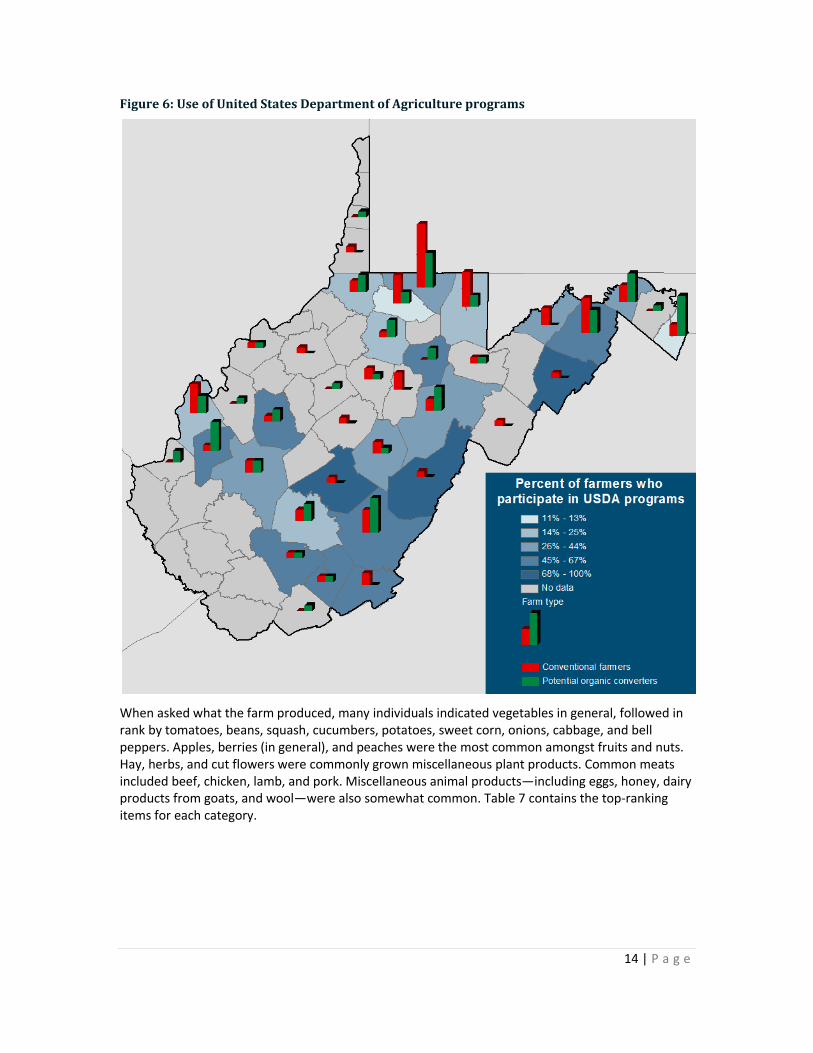
When comparing responses to these prompts between the two groups of farmers (conventional and potentially organic) 10 significant differences were found. Only the desire for higher soil fertility, ability to find seasonal manual labor, the farm’s relation to community, and the desire that one’s farm continues to be farmed in the future were found not to have differences (see Table 10).
20 | P a g e
Table 10: Differences in farming values and philosophy between conventional and potentially organic farmers
Prompt p-value Group with higher score, statistically
I am concerned with the production of high-quality foods. 0.009 Potential converters Higher soil fertility is an important consideration for me. 0.058 No difference I attempt to minimize pollution as much as possible on the farm. 0.004 Potential converters Health risks associated with chemicals/farm applications are one of my concerns. 0.002 Potential converters I am willing to adopt and try new and innovative farming practices. 0.022 Potential converters I am able to find seasonal manual laborers readily available when needed. 0.217 No difference The health of the land on my farm is extremely important to me. 0.002 Potential converters I am interested in learning about new farming techniques and practices. 0.005 Potential converters The farmers I associate with use conventional farming techniques that involve common herbicide and pesticide applications.
0.005 Conventional farmers
The existence of my farm is an important asset to my larger community. 0.669 No difference The farmers I associate with use organic/sustainable farming techniques that do not involve common herbicide and pesticide applicants.
0.000 Conventional farmers
I hope my land continues to be farmed after I decide to stop farming. 0.604 No difference Confined animal feeding operations (CAFOs) are acceptable for raising livestock. 0.000 Potential converters I attempt to minimize off-the-farm inputs in the processes on my farm. 0.000 Potential converters
Farmers were prompted to note their level of dependence on specific issues in consideration of the farm’s economic performance. Concern about injury, illness, or death of the operators ranked highest with a mean score of 5.44, followed by marketing and sales, leasing farmland, family health situation, and changes in consumer preferences. Table 11 details the mean scores for each prompt.
When tested in rank using a Wilcoxen Signed-Rank Test for non-parametric data, significant or noteworthy differences were found among 11 of the ranked pairs (see Table 12).

21 | P a g e
Table 11: Issues affecting farms and dependence in regard to economic performance of the farm
Prompt Mean score Injury, illness, or death of operator(s) 5.44 Marketing/sale (production contracts, direct sale, the processing industry, etc.) 5.10 Leasing farm land (price, availability, etc.) 5.01 Health situation of others in the farm family 5.01 Changes in consumer preferences 5.00 Other government laws and regulations (e.g. natural environment, work environment) 4.59 Technical failure/malfunction of machinery and equipment 4.32 Livestock loss or disease/illness 4.22 Changes in tax policy 4.21 Cost of operating inputs (capital items excluded) 4.09 Changes in technology 4.08 Fire damages (buildings, livestock, machinery, yield, etc.) 4.00 Lack/cost of health or retirement benefits 3.96 Price premiums for organic products 3.88 Organic farming laws and regulations 3.67 Cost of credit (interest rate) 3.38 Cost of capital equipment (machinery, buildings, etc.) 3.38 Hired labor 3.22 Availability of loan funds 3.17 Uncertainty about family relationships 3.14 Changes in government support payments (non-organic) 3.10 Additional government payments to organic farming 2.78 Note: These scores are based on a 1 to 7 Likert-style scale, where 1 means that the respondent has no dependence, and 7 means that the respondent has very large dependence. In testing the reliability of these results as a whole, this question set had a Cronbach’s Alpha of 0.794.
Table 12: Results of Wilcoxen Signed-Rank Test comparing rankings
Rank Prompt Rank Comparison prompt p-value 1 Injury, illness, or death of operator(s) 2 Marketing/sale 0.054 2 Marketing/sales 3 Leasing farm land 0.000
3 Leasing farm land 4 Health situation of others in the farm family 0.000
5 Changes in consumer preferences 6 Other government laws and regulations 0.004
6 Other government laws and regulations 7 Technical failure/malfunction of machinery and equipment 0.036
9 Changes in tax policy 10 Cost of operating inputs 0.000 10 Cost of operating inputs 11 Changes in technology 0.000 14 Price premiums for organic products 15 Organic farming laws and regulations 0.049 16 Cost of credit 17 Cost of capital equipment 0.000 17 Cost of capital equipment 18 Hired labor 0.000
21 Changes in government support payments 22
Additional government payments to organic farming 0.012
Note: Only those with significant or near-significant results are included. While the significance of the difference between Prompts 1 and 2 is greater than 0.05, this difference is still noteworthy.

22 | P a g e
We also asked participant farmers to note their five most important farm goals. The most frequently mentioned goals included producing high quality-food, a desire to continue in the profession, sustainable and environmentally friendly farming, and time for family, friends, and quality of life. Table 13 lists the frequency of important farm goals.
Table 13: Frequency of important farm goals
Goal Frequency Producing high-quality food 156 Continue to be a farmer 121 Sustainable and environment friendly farming 117 Time for family/friends, quality of life 98 Improve the farm for the next generation 98 Work with animals/crops 89 Self-employment, independence 89 Reduce debt, become free of debt 69 Maximize profit 63 Certain and stable income 49 Higher private consumption 24 Social contacts 23 Have possible time for leisure 20 Increase equity 14
An additional question asked farmers to note their top three motivations for adopting and continuing to maintain their current farming systems. Again, production of high-quality food ranked first, followed by their personal philosophy on farming, achieving higher soil fertility rates and less pollution, and profitability. Table 14 lists the frequency of the motives stated for the adoption and maintenance of the participants’ current farming systems.
Table 14: Motivations for maintaining current farming system
Motivation Frequency Production of high-quality food 148 Philosophy on farming 108 Higher soil fertility rates and less pollution 84 Profitability 60 Natural conditions 59 Animal welfare 36 High levels of production 32 Health risks 29 It was the method always used on the farm 21 More stable income 20 Professional challenges 20 Too hard to change farming methods 10

23 | P a g e
3.2.4 Market variables and outlets
Among the farmers who participated in this study, responses suggest that the demand for certified organic food is slightly above a moderate level (A mean of 5.14). More than one-third (36.1%) of respondents indicated that consumers were willing to pay higher prices associated with organic products. Participants most commonly distribute their products directly from the farm (f=140). Other common venues for distribution include farmers markets (f=135), restaurants (f=47), local stockyards (f=39), roadside stands (f=31), and CSA programs (f=26). Participants indicated that they also sell direct to wholesalers (f=20) and through auctions (f=20).
Farm products were most commonly distributed to the following locales:
Morgantown/Monongalia County (16/4 farms),
Baltimore and surrounding area (9 farms),
Charleston/Kanawha County (8/3 farms),
Romney (7 farms),
Fairmont (7 farms),
Lewisburg (5 farms),
Elkins (5 farms),
Berkeley Springs (5 farms),
Clarksburg (4 farms),
Alderson (4 farms),
Washington, D.C. (3 farms),
Huntington (3 farms), and
Parkersburg (2 farms).
To help visualize regional distribution patterns, respondents were divided into four regions: Eastern Panhandle, North-central, Greenbrier Valley, and Huntington-area farms. The following figures illustrate distribution patterns for each region; the thickness of the blue arrows generally indicates the number of farms in the region that distribute products to particular locations.
Figure 9 illustrates the regional distribution patterns for Eastern Panhandle farms. A considerable amount of farm products are sold within the five-county region, as depicted by the thick blue arrow that circles back to the region. However, products are also distributed to several nearby cities, including Washington, D.C.; unspecified cities in northern Virginia; and Baltimore, Frederick, and Hagerstown, Maryland. This map clarifies that Eastern Panhandle farms, which are located close to many large and affluent population centers, tend to focus their distribution eastward when they are not selling locally.
Farms in north-central West Virginia, in contrast, focus more of their distribution within West Virginia. As shown in Figure 10, farm products are sold within the four-county region, to nearby Taylor, Tyler, and Harrison counties, and to the Beckley. Out-of-state markets include Waynesburg, Pennsylvania; Garrett County, Maryland; New York City, and international markets.
Farms in the two-county Greenbrier Valley region sell their products within West Virginia—mostly within Fayette and Greenbrier counties, but also to nearby Pocahontas and Summers counties. As illustrated in Figure 11, no farms in this region reported sales to non-contiguous counties, neighboring states, or international markets.
Figure 12 illustrates distribution patterns for Huntington-area farms in Mason and Putnam counties. Farmers report that their most significant sales are within the two-county region. Farmers also

24 | P a g e
report sales to neighboring Kanawha and Cabell counties, where West Virginia’s two largest cities are located: Charleston and Huntington. Huntington-area farms also report distribution to Morgantown, West Virginia; New York City; Washington, D.C.; Garrett County, Maryland; Atlanta, Georgia; and international markets. Compared with the other three areas, these farmers report the widest diversity of destinations for their farm products.
Figure 9: Regional distribution patterns from Eastern Panhandle farms
Note: The thickness of the blue arrows generally indicates the number of farms that distribute products to particular locations.

25 | P a g e
Figure 10: Regional distribution patterns from north-central West Virginia farms
Note: The thickness of the blue arrows generally indicates the number of farms that distribute products to particular locations.

26 | P a g e
Figure 11: Regional distribution patterns from Greenbrier Valley farms
Note: The thickness of the blue arrows generally indicates the number of farms that distribute products to particular locations.

27 | P a g e
Figure 12: Regional distribution patterns from Huntington-area farms
Note: The thickness of the blue arrows generally indicates the number of farms that distribute products to particular locations.
3.2.5 USDA-organic certification and process
Participants were asked a variety of questions concerning USDA-organic certification and the process of obtaining certification. This section had two general questions and subsections for farms that are in transition, organic-exempt farms, and conventional/non-certified organic farms. Due to low participant numbers among in-transition and organic-exempt farms, only quantitative data from conventional/non-certified organic participants are included in this report.
The first asked: What does (USDA-organic symbol) mean to you? Based on thematic coding of the data, four main themes emerged, including the following: positive perspectives, negative perspectives, costs, and certification for commercial-scale agriculture. Table 15 highlights the themes, subthemes, and frequency counts from this question.

28 | P a g e
Table 15: Themes and subthemes on the meaning of USDA-organic symbol
Theme Subtheme Frequency Positive perspectives Met and maintained standards 46 Chemical- and antibiotic-free 23 Generally positive 15 Healthy/safe 9
Total 93
Negative perspectives Skeptical of the certification 36 Having little or no value 26 Co-opted by commercial agriculture 13 Government intrusion/bureaucracy 13
Total 88
Costs (money and time) For the consumer 25 For the farmer 20
Total 45
Commercial-scale agriculture only In general 9 Total 9
Participants were asked about their feelings about issues in pursuing USDA-organic certification. The lack of availability of organic animal feed ranked highest, followed by a belief that the process is cost-prohibitive, and that both maintaining the certification and the process of obtaining the certification itself are time consuming. Many respondents also noted that the benefits do not outweigh the costs to organic production and certification. Table 16 illustrates the mean scores for each prompt.
Table 16: Interest in pursuing USDA-organic certification
Prompt Mean Availability of organic animal feed is a challenge for raising livestock organically. 5.63 I believe the costs associated with becoming USDA-certified organic to be extremely high. 5.18 I find maintaining the certification paperwork extremely time consuming. 5.17 I find the USDA-organic certification process extremely time consuming. 5.04 I do not believe the benefits associated with USDA-organic certification are worth the time and expense. 4.90 I feel that organic certification by USDA has been co-opted and is no longer meaningful. 4.54 The individuals that purchase my farm products would not pay for food grown/raised using organic methods. 3.84 I am using practices that far surpass the USDA-organic certification requirements. 3.73 I have no interest in changing the management systems already in place on my farm. 3.36 Organic farming practices are not effective/practical for my crop(s). 3.14 I have no interest in learning about new farming techniques that would be required to pursue USDA-organic certification.
3.04
I simply have no interest in organic production or methods. 2.71 I have no interest in using organic methods for production on my farm. 2.61 Note: The Cronbach’s Alpha score for this set of prompts was 0.794.
When tested in rank using a Wilcoxen Signed-Rank Test for non-parametric data, significant differences were found between four of the ranked pairs (see Table 17).

29 | P a g e
Table 17: Results of Wilcoxen Signed-Rank Test comparing rankings
Rank Prompt Rank Comparison prompt p-value
1 Availability of organic animal feed is a challenge for raising livestock organically.
2 I believe the costs associated with becoming USDA-certified organic to be extremely high.
0.022
5 I do not believe the benefits associated with USDA-organic certification are worth the time and expense.
6 I feel that the organic certification by the USDA has been co-opted and is no longer meaningful.
0.02
6 I feel that organic certification by USDA has been co-opted and is no longer meaningful.
7 The individuals that purchase my farm products would not pay for food grown/raised using organic methods.
0.001
8 I am using practices that far surpass the USDA-organic certification requirements.
9
I have no interest in learning about new farming techniques that would be required to pursue USDA-organic certification.
0.002
Note: Only those with significant results are included.
When comparing the responses of the conventional farmers versus those that would potentially certify as organic, a statistical difference was found with six of the prompts and their respective scores. Differences were detected in the prompts associated with a genuine interest in organic production/methods, the belief in what one’s consumers are willing to pay for, the use of practices that surpass what the USDA-organic guidelines mandate, interest in learning about new farming techniques, belief that the benefits associated with USDA-organic certification are worth the time and expense, belief that organic farming practices are not effective/practical for the respondent’s crop(s), and the statement “I feel that the organic certification by the USDA has been co-opted and is no longer meaningful.” Table 18 highlights the significance values and identifies which of the two groups had higher mean scores for each prompt.

30 | P a g e
Table 18: Differences in views toward USDA-organic certification between conventional and potentially organic farmers
Prompt p-value Group with higher score, statistically
I simply have no interest in organic production or methods. 0.000 Conventional farmers
I find maintaining the certification paperwork extremely time consuming. 0.132 No difference I am not interested in government certifications or programs. 0.648 No difference
I have no interest in using organic methods for production on my farm. 0.000 Conventional farmers
The individuals that purchase my farm products would not pay for food grown/raised using organic methods. 0.000 Conventional
farmers I believe the costs associated with becoming USDA certified-organic to be extremely high. 0.671 No difference
I am using practices that far surpass the USDA-organic certification requirements. 0.000 Potential converters I have no interest in learning about new farming techniques that would be required to pursue USDA-organic certification. 0.044 Conventional
farmers I do not believe the benefits associated with USDA-organic certification are worth the time and expense. 0.198 No difference
Availability of organic animal feed is a challenge for raising livestock organically. 0.532 No difference I have no interest in changing the management systems already in place on my farm. 0.109 No difference
I find the USDA-organic certification process extremely time consuming. 0.289 No difference
Organic farming practices are not effective/practical for my crop(s). 0.000 Conventional farmers
I feel that organic certification by USDA has been co-opted and is no longer meaningful. 0.000 Potential converters
3.2.6 Policy constraints affecting USDA-organic certification
Although farmers in transition to organic were directly asked what “state or federal policies” have been challenging or prohibitive to the pursuit or attainment of organic certification, many answers were not policy-centric. Responses to this question were thematically coded and four themes emerged:
education/communication,
policies,
expense, and
process.
Participants often discussed communication issues between USDA and farmers—or the certifying agency and farmers—followed by a lack of education on organic policies and the USDA certification process. Participants also highlighted a lack of knowledge amongst county agriculture extension specialists on production techniques and organic certification. The strongest subtheme from this education/communication theme, however, was a general lack of farmers’ education and understanding about the process, with many indicating they did not know where to get information.
Several specific policies were referred to by participants, as well as some overarching beliefs about policy and government. One person seemed to be plagued by seed certification requirements, while another was challenged by rules on paraffin and Styrofoam for mushroom sealant. Buffer zones around organic fields were also important considerations discussed by farmers, as was a lack of flexibility in the USDA standards. Farmers also mentioned a fear of government policy and the belief that USDA’s rules are quite static.

31 | P a g e
The constraint of up-front expenses for certification and the costs of organic fertilizers were again mentioned by farmer participants. Respondents also presented concerns about the amount of time the process takes as well as the maintenance of paperwork for certification.
Finally, the process theme contained several comments from farmers about the challenge of collecting and documenting the data. Additionally, one farmer noted that the certification itself is more a process than a practice.
3.3 Phase 3: Semi-structured telephone interviews
In Phase 3, 22 informal telephone interviews were conducted in order to solicit data that would provide greater depth and insight into the study’s findings, allowing the project team to make stronger inferences and conclusions. Interviews were conducted from mid-April through early June 2012. Interview times ranged from 4 to 33.5 minutes, with an average interview concluding after 17 minutes. Interviewers asked a range of questions and provided multiple prompts, including the following:
Can you tell me about your farm?
What are your methods used for marketing and distribution?
Have you ever considered pursuing USDA-organic certification? What are your thoughts on becoming certified?
What is the demand for certified-organic products in your area?
What advice do you have for other farmers considering organic certification?
Interviews were recorded and transcribed verbatim. A phenomenological analysis was completed, and three main themes and 17 subthemes emerged. Interviews were discontinued once saturation of emergent themes was met (Creswell, 2007). Table 19 details the emergent themes and subthemes from the interviews.

32 | P a g e
Table 19: Emergent themes from Phase 3 semi-structured telephone interviews
Themes Subthemes Tertiary themes Frequency Organic certification and associated variables
Constraints 48 Input scarcity 3 Demand for organics 28 Problems with the process 24 Ending one’s certification 10 Motives to go organic 6 Prices for organics 6 Subtotal 125
Marketing and sales
Distribution channels 46 Online 14 Farmers markets 13 Other 11 Direct sales 6 CSAs 2 Constraints 18 Personal connection 17 Animals processing 7 Value-added 4 Subtotal 92
Advice for farmers 12 Subtotal 12
3.3.1 Organic certification and associated variables
Organic certification and associated variables was the strongest theme, garnering 125 coded phrases. Within the theme, there were seven subthemes, including the following: constraints, input scarcity, demand for organics, problems with the process, ending one’s certification, motives to go organic, and prices for organics.
The most common subtheme was “constraints.” Farmers often discussed the challenge of finding enough labor to support an organic-style operation, with one person noting that they took a break for a year after seven years of farming, “and it did not make any sense to continue to be certified organic.” Another common constraint raised by farmers was that the size and scale of their operation was not conducive to organic certification when factoring in the costs in both the fees and the time in maintaining paperwork. A common attitude was that, “it just didn’t make sense for the small scale that I was at.”
Several farmers mentioned that, due to the scale of their operation, it just was not worth the resource allocation. Other individuals discussed the challenges associated with growing certain produce in an organic fashion, namely corn and green beans. Lack of inputs, such as organic grain for feeding livestock, was discussed by several farmers. In addition, individuals discussed the fact that the high cost of organic grains would prevent the local population from purchasing organic chicken or beef.

33 | P a g e
While many individuals noted a demand for their products, farmers also suggested that the demand for foods that are certified organic can only be found in the metropolitan areas of Washington, D.C.; Maryland; northern Virginia; Charleston, West Virginia; and upscale restaurants. The project team interviewed several farmers who were once certified through a state association in West Virginia prior to the establishment of the USDA-certification system. These individuals felt that USDA policies and regulations were far too loose and allowed too many loopholes for larger industrial agriculture companies to access the certification without having to produce the foods in a truly “organic” fashion.
Several farmers discussed having difficulties with the certification process itself and not being able to rely on their local extension agents or USDA and Natural Resources Conservation Services (NRCS) field experts to assist them in transitioning to organic or with the certification process. One person mentioned that they would not pursue certification again, “after the experience I’ve had [with the USDA office] and the [NRCS] office failed here too,” while a second stated, “the local USDA representative…didn’t have a good handle on [the process].” Another individual noted that county extension agents knew little about organic certification. Additionally, another farmer was in the process of becoming certified and the NRCS office instructed him to cancel his application because he felt they were under resourced to support him going through the process.
3.3.2 Marketing and sales
Marketing and sales was the second strongest emergent theme, with 92 phrases coded to the theme. Subthemes include marketing constraints, personal connection, distribution channels (online, farmers markets, other, direct sales, and CSAs), animal processing, and value-added.
Several farmers discussed the challenges associated with distribution and not having enough of a population in their area to create a viable market for their farm products. Some farmers drive three to four hours to markets in Washington, D.C. or Pittsburgh in order to distribute their products, while others sell at lower prices rather than expending the financial or time resources needed to tap into the larger markets.
Other farmers discussed the variability in selling on contract and the challenges in selling to a single business. One person noted that he and his friend had a dropped contract and “we had a trust relationship and then totally got screwed, and grew a whole bunch of lettuce, and, um, they wouldn’t buy them.”
Making “personal connections” appears critical in the type and scale of the distribution occurring with the study’s participants. Most farmers discussed word of mouth as a key component to selling and establishing oneself as a reputable farmer with an open door policy to visitors. One farmer stated that “people feel, um, much more comfortable buying that food, um, um, from people that they know and can ask questions of.”
3.3.3 Advice for farmers
The third theme, advice for farmers concerning organic production and certification, garnered 12 coded phrases. Many farmers were quite positive in suggesting that others pursue organic production and certification. They noted that it is entirely a personal decision and the value of certification depends on the style and size of an operation.
Others commented that while the certification and what it tries to achieve is quite positive, it is really set up for large-scale operations. According to these respondents, the general public really wants to know farmers personally and to be able to visit farms to see the operations. One person

34 | P a g e
noted that they, “don’t mean to sound like, ya know, bongo beatin’ hippie. But, ya know, I want my dirt clean. I want my food clean.” And they think the certification is a “wonderful thing.”
Others mentioned that the process and fees are well worth it, with one individual specifically stating that, “if you’re going into vegetables, small fruit, you know whatever, get your certification and be organic. Because the price difference is enough that it will – it will really pay you to do it.” Others offered a more intrinsic and altruistic motivation for pursuing organic production, discussing that farmers “should do it … if they have that market go for it. They could raise a higher quality product and garner more customers if they took the low input approach.”
3.4 Phase 4: Policy and economic analysis
As demonstrated by the survey results, very few West Virginia farmers are certified organic. As discussed in Section 3.2.2, 39.7% of respondents used organic methods but were not USDA-certified organic, 2.3% were in transition to USDA-organic certification, and 1.4% were organic but exempt from certification requirements. Additionally, 2.7% of participants indicated that they had once been USDA-certified organic and that they let their certification expire. In this section, we consider some of the policies and economic considerations that play a role in the low number of USDA-certified organic growers across West Virginia.
3.4.1 Policies that impact organic certification
While it was originally envisioned that farmers would identify several specific federal or state policy barriers to organic certification, only a few were mentioned in the survey. Still, the survey reveals numerous barriers to organic certification in West Virginia:
1. farms are not big enough to make certification worth it; 2. farmers perceive a lack of markets for organic products; 3. small farmers often sell to people they know, growers can easily convey they are using
organic methods, and buyers do not necessarily care about certification because they know and trust the growers;
4. farmers lack institutional and physical resources and lack education about organic farming; and
5. some West Virginia farmers simply do not trust or recognize a value in USDA certification.
In this section, we discuss the two clearest policy-related barriers to organic certification that were mentioned by West Virginia farmers: paying for organic certification and the need for local certifying agencies and organic expertise.
Paying for organic certification
In addition to the extra time and effort required to qualify for USDA-organic certification, organic certification is expensive for small farms. In order to ease these burdens, small farms with gross organic sales less than $5,000 per year are exempt from two key requirements: They do not need to be certified, and they are not required to document their specific practices and substances used to produce and/or handle organic products in an organic system plan. While exempt farmers cannot use the USDA organic seal or market their products as “certified organic,” they can still market their products as “organic,” so long as they follow all other requirements in the USDA organic regulations. (Baier and Ahramjian, 2012)

35 | P a g e
The effectiveness of the organic exemption for facilitating a transition to organic production methods is considered separately for three size classes of West Virginia farms: those with sales less than $5,000, those with sales between $5,000 and $25,000, and those with sales of $25,000 or more.
As illustrated in Figure 13, most West Virginia farms are extremely small. In fact, 12,433 West Virginia farms had less than $2,500 in sales in 2007, the most recent year for which agricultural census data are available. An additional 3,531 farms had sales between $2,500 and $5,000. Together, 68% of West Virginia farms had less than $5,000 in sales. Even if these farms sold only organic products, these farms would fall within the organic exemption. The exemption, therefore, has the potential to ease the transition to organic methods for at least two-thirds of West Virginia farms. As described above, these farmers, so long as they follow organic production standards, can market their products as “organic” so long as they do not use the USDA seal or market their products as “certified organic.” Still, the time and effort required to officially call their products “organic”—even with the exemption—appear to be too much for many West Virginia farmers who feel that they can communicate their methods to buyers who know and trust their local growers.
The second size class we consider includes farms with sales between $5,000 and $25,000, which includes 23% of West Virginia farms. The organic exemption would likely provide an incentive to transition at least part of these farms to organic methods, so long as organic sales remained below the $5,000 threshold. Farms in this category would also, in theory, consider transitioning more than $5,000 in sales to organic, if they felt that the benefits outweighed the costs of certification. Because inspection fees alone can cost up to several thousand dollars (Baier and Ahramjian, 2012), farms in this size class must think carefully about whether these fees, along with recordkeeping and other requirements, are truly worth the cost, time, and effort to be able to market their products with the USDA seal as “certified organic.” Farms of this size, like those with sales below $5,000, are also likely to be engaged in direct marketing to consumers and can communicate their growing practices to buyers who know and trust their local growers.
The third size class includes the 9% of West Virginia farms with sales of $25,000 or more. These farms are most likely to pursue organic certification. However, fewer than 1,500 West Virginia farms had sales at these levels in 2007.
Because most West Virginia farms small, the organic exemption can help ease many farmers’ transitions to organic methods, because it allows them to save money and time that would be required for full certification. Medium-size farms considering a transition to organic methods likely face a decision about the costs and benefits of pursuing the exemption while keeping organic sales low, versus expanding organic sales and taking on the time and money requirements for inspections and full USDA certification. While the largest farms would appear to have the most incentive to pursue full USDA certification, there are very few farms with sales above $25,000 in West Virginia.

36 | P a g e
Figure 13: West Virginia farms by value of sales, 2007
Source: USDA (2009).
In order to assist West Virginia producers in obtaining USDA-organic certification, the West Virginia Department of Agriculture (WVDA) offers a cost-share program to help West Virginia producers pay for organic certification. After receiving an organic certificate or a notice of continued certification, producers an apply for 90% of organic certification costs up to a maximum of $750 (WVDA, 2013).
Local certifying agencies and organic expertise
According to the federal rules, inspectors must visit farms before they can be certified organic. Because there are so few farms that have sought organic certification in West Virginia, and because of the remote location of so many of its farms, no certifiers are based in West Virginia. This means that inspections in West Virginia are particularly expensive due to the travel costs and time required for out-of-state certifiers. In addition, this lack of in-state certifiers means that there are fewer professionals that can be relied upon to educate growers about transitioning to organic methods.
In the survey, West Virginia farmers identified a need for local assistance in organic farming methods and certification, namely among National Resources Conservation Service and county extension agents. Policies that expand the level of expertise related to organic methods and the certification process could be beneficial to help dispel myths and to provide factual information regarding the methods, costs, and potential benefits of a transition to organic methods and certification.
3.4.2 Cost and benefits of transitioning to organic
As described above in Section 1, one of the most important barriers to the expansion of organic production is cost (Stephenson et al., 2012). This theme also emerged in our research in West Virginia. As shown above in Table 1, our informal telephone interviews with West Virginia farmers in Phase 1 identified the cost of USDA-organic certification as a challenge to certification. Nearly all
0
2,000
4,000
6,000
8,000
10,000
12,000
14,000
Less than
$2,500$2,500 to
$4,999$5,000 to
$9,999$10,000 to
$24,999$25,000 to
$49,999$50,000 to
$99,999$100,000 or
more
Nu
mb
er
of f
arm
s
Value of sales

37 | P a g e
interviewees mentioned this challenge. These interviews also identified the cost of organic animal feed and organic fertilizer as challenges to organic production.
In Phase 2, West Virginia farmers were asked about their feelings toward issues in pursuing USDA-organic certification. As shown above in Table 16, several of the issues of most concern are related to cost. For example, the second-highest mean score is associated with the statement: “I believe the costs associated with becoming USDA-certified organic to be extremely high.” The fifth-highest mean score is associated with the statement: “I do not believe the benefits associated with USDA-organic certification are worth the time and expense.” And the seventh-highest mean score is associated with the statement: “The individuals that purchase my farm products would not pay for food grown/raised using organic methods.”
When asked about state or federal policies, West Virginia farmers again brought up the up-front expenses for certification and the cost of organic fertilizers.
In summary, this survey shows that West Virginia farmers are concerned about two types of costs related to organic farming: (1) the cost of the certification itself and (2) the potential increased cost of purchasing approved inputs such as fertilizer. Costs and prices cannot be discussed separately, because even if it costs more to produce a farm product, it may actually be more profitable if it can be sold at a higher price. In the survey, however, West Virginia farmers expressed skepticism as to whether markets exist in which to sell USDA-certified organic products at a premium sufficient to cover the perceived increased cost of production. As summarized above in Table 18, conventional farmers, in particular, were more likely than potential converters to agree that “The individuals that purchase my farm products would not pay for food grown/raised using organic methods.”
In this section, we focus on the potential increased cost of production of USDA-certified organic products, as well as the potential price premiums that West Virginia growers may receive.
Cost of organic versus conventional production
We conducted a literature review to understand whether production costs tend to be higher, lower, or approximately the same for comparable organic and conventional crops. While this research would ideally have been conducted in West Virginia—and for the top crops grown by West Virginia farmers—such studies were not found. The literature review therefore included research conducted on the following crops: corn, soybeans, tomatoes, and apples. Research plots included in this analysis were located in South Dakota, Iowa, Pennsylvania, California, New Jersey, and Washington.
An analysis of seven studies addressing the economic performance of conventional and organic systems revealed a large amount of variation in production costs across crops and regions. Two of the studies (Brumfield et al., 2000 and Clark et al., 1999), both of which assessed tomato production, found that the cost of growing tomatoes organically is up to 53% higher than growing the same tomato varieties conventionally. In contrast, four studies, which analyzed crops including corn, soybeans, and apples, demonstrated that the cost of organic production ranges from 2% to 45% lower than growing the same crops with conventional methods (Hanson et al., 1997; Delate et al., 2003; Glover et al., 2002; Pimental et al., 2005). Only one study resulted in no significant difference in the cost of organically and conventionally growing corn and soybeans (Dobbs and Smolik, 1996).
Production cost estimates were calculated per farm area rather than per product quantity; therefore, it is important to also consider the difference in yield between organic and conventional methods. Similar to production costs, variation exists in product yield across crops and regions. Of the seven studies analyzed, two found higher yields in conventional crops (Dobbs and Smolik, 1996 and Brumfield et al., 2000). Five of the studies, which include tomato, corn, soybean, and apple

38 | P a g e
crops, did not find a significant difference in yield over the duration of each study (Hanson et al., 1997; Clark et al., 1999; Delate et al., 2003; Pimental et al., 2005; and Glover et al., 2002).
For example, results of a Washington State University study demonstrated that the cost of producing golden delicious apples organically was approximately $1,000 less per acre than the cost of producing apples conventionally during a four-year study period (Glover et al., 2002). Cumulative apple yields for organic and conventional methods during the four-year study period were similar, but in one of the years the organic fruit yield was significantly lower than the conventional fruit yield (Glover et al., 2002).
In Iowa, researchers showed that the cost of growing corn and soybeans organically is 46% and 12% lower, respectively, than growing these crops utilizing conventional methods. While organic farming required additional seed, labor, and machinery costs, the diminished cost of organic production is attributed to the avoided high cost of chemical fertilizer and pesticides required by conventional farming (Delate et al., 2003). Higher yields were obtained for organic corn and soybeans when crop rotation methods were implemented. It is important to consider that these studies were performed by farmers experienced in organic farming methods; less-experienced farmers should not expect similar success during transitional years (Delate et al., 2003).
Crop yields and cost of production for conventional and organic harvests vary across studies, yet all agree that when price premiums for organic products are included, the net income for organic producers is consistently greater than that of conventional producers. Farmers considering transitioning to organic methods should expect increases in seed costs and labor requirements, but diminished chemical pesticide and fertilizer expenses.
Potential price premiums for organic products in West Virginia
As noted directly above in the discussion of the cost of organic versus conventional production, several studies conclude that price premiums for organic products typically provide a higher net income compared with conventional products. However, the studies reviewed above include farms outside of West Virginia and do not include most of the top ten fruits and vegetables grown by surveyed West Virginia farmers.
West Virginia farmers sell their products through a variety of supply chains. They may sell directly to a consumer through on-farm stores, roadside stands, U-pick operations, farmers markets, community supported agriculture arrangements, or online markets. They may sell via intermediated supply chains such as regional distributors or to institutions, restaurants, or local retailers. They may sell through mainstream supply chains such as national grocery stores. In addition, West Virginia products may be processed before they are ultimately sold to consumers at a packing shed, processing facility, or slaughterhouse. (Peters et al., 2012)
Calculating the price premiums available for organic products that are grown in West Virginia and sold via all of these supply chains is well beyond the scope of this project. Instead, we investigate the potential price premiums for organic products sold via intermediated supply chains. We estimate organic price premiums for nine of the top fruit and vegetable commodities grown by survey participants (See Figure 14).
We use two methods to estimate potential price premiums. Our first method is based on average year-to-date sales prices and approximate markup margins from a regional certified-organic distributor, Tuscarora Organic Growers Cooperative, Inc. (TOG), and a regional nonorganic-distributor, Corey Brothers, Inc. Using regional distributors ensures that the prices being compared would be obtainable by West Virginia growers if they accessed either of these distribution channels.

39 | P a g e
As described in a recent report on the West Virginia food system:
TOG is a grower cooperative based near Maddensville, Pennsylvania (approximately 35 miles outside of West Virginia). TOG was formed in 1988 to bring small organic farms together to coordinate production, create economies of scale, and increase market access. TOG deals exclusively in certified-organic fruits and vegetables…The majority of its produce is marketed to restaurants, retail food cooperatives, and grocers in the Washington, D.C. and Baltimore areas. (Peters et al., 2012, p. 39-40)
Corey Brothers..., a family-owned business, has been distributing produce in West Virginia for over a century. The Corey family began peddling produce in 1895 and has been known as Corey Brothers since 1917. Corey Brothers deals exclusively in produce. The company sells to independent and chain restaurants, hotels, resorts, schools, hospitals, and other establishments throughout most of West Virginia and border areas of contiguous states. (Peters et al., 2012, p. 43)
Our second method is based on USDA Agricultural Marketing Service terminal market average data (USDA Agricultural Marketing Service, 2013). For each commodity, we ran a report for 2012, which includes prices and characteristics of both organic and non-organic sales at markets across the United States (US). We then selected comparable organic and non-organic sales for the four markets closest to West Virginia—Atlanta, Baltimore, Philadelphia, and Pittsburgh—and only included data for which organic and non-organic sales were made at the same location with the same size package. Price premiums for each of these instances were then averaged by commodity.
For each of these fruits and vegetables, price premiums were found for USDA-certified organic produce. Using data from West Virginia distributors, these premiums are estimated to range from 209% for cucumbers to 100% for sweet corn and 22% for raspberries. In other words, we estimate that USDA-certified organic cucumbers could be sold for approximately three times the conventional prices, sweet corn for double the conventional price, and raspberries for approximately one-quarter above the conventional price.
While the price premiums estimated using our second method do not match exactly with the first method, they tell a similar story: Significant price premiums are found, which vary from 269% for cabbage to 32% for beans. Using this second method, USDA-certified organic raspberries appear to have sold for 5% less than conventional raspberries.
While both methods produce estimates only, the results are generally consistent and suggest that premiums for certified-organic products do, indeed, exist in West Virginia and can be quite substantial.
This comparison, however, should not be interpreted to suggest that organic products sold in local farmers markets could command the same premiums. TOG, the source of the organic prices in our first method, sells produce in the Washington, D.C. and Baltimore areas, where it would be expected that consumers would be willing to pay a significant premium for certified-organic products. Further, the terminals from which data were collected in our second method are for cities relatively close to, but not within, West Virginia.
Therefore, while this comparison suggests that a price premium may be achievable for organic products, it also suggests that a profitable transition to organic may also require the sale of organic produce via regional distributors to reach customers willing to pay the premium. This, in turn, has implications for many other aspects of a farmer’s operation: the scale of production that may be required at each farm, certifications (other than organic) that may be required by regional distributors, packing requirements, and other aspects. A potential transition to a profitable organic

40 | P a g e
farming model requires the consideration of not only the costs and price premium related to the products themselves, but also a more holistic analysis of whether the farmer is willing and able to transition the entire farm operation—or a significant portion of the farm’s production—into into one that can supply the appropriate products, at the appropriate time, in the appropriate packaging, and with the appropriate certifications, to enjoy the organic price premiums.
Figure 14: Estimated organic price premiums for the top ten fruit and vegetable commodities
Sources: Data for West Virginia distributors from Corey Brothers, Inc. (2012) and Taylor (2012). Data for nearby terminals from USDA Agricultural Marketing Service (2013).
-50%
0%
50%
100%
150%
200%
250%
300%
Cucumbers Cabbage Tomatoes Sweet corn Onions Potatoes Squash Beans Raspberries
Esti
mat
ed
org
anic
pri
ce p
rem
ium
For West Virginia distributors
At nearby terminals

41 | P a g e
3.5 Phase 5: Geospatial analysis
Our survey identified two broad categories of farmers: conventional farmers and potential organic converters. In this section, we summarize what has been found related to expanding markets and incomes for potential converters across West Virginia.
Maps showing our geospatial analysis of survey results are presented throughout Section 3.2. In each map, green bars signify the number potential converters in each county, and red bars signify the number of conventional farmers who responded to the survey.
Potential organic converters are found in most counties with respondents. There are particularly large numbers of potential converters in the Eastern Panhandle, North-central, Huntington-area, and Greenbrier Valley regions of the state.
Among potential converters, the highest average net incomes are found in the Preston County in north-central West Virginia, Raleigh County in southern West Virginia, and Putnam County, between the cities of Charleston and Huntington. These counties are scattered across the state and not concentrated in any one of the four regions for which distributions patters were illustrated in Section 3.2.4. This suggests that there is the potential for potential organic converters across the state to raise their incomes.
West Virginia farmers tend to have diversified farms. Also, as shown in Figure 7 and Figure 8, no obvious spatial patterns emerge regarding the types of farm products produced. In fact, in each county with respondents, at least one farmer produces at least one product in each category, which underscores the diversity of farm products grown and raised by West Virginia farmers.
Diversification is an understandable strategy for potential organic convertors. Potential waste products such as animal manure can be used as resources, polycultural farms can help reduce pest damage through the diversity of crops being planted and managing fields for intensive rotations, diversified farms provide a hedge against the failure of a particular crop, and a wide variety of crops provide a diversity of items for sale at farmers markets or via CSAs.
Farmers in different regions of West Virginia have access to different markets. As illustrated in the regional distribution maps in Section 3.2.4, farmers in all four regions sell their products within the region. However, farmers in the Eastern Panhandle tend to be oriented to the east and sell to Washington, D.C.; northern Virginia; and Baltimore, Frederick, and Hagerstown, Maryland. Farmers in north-central West Virginia, in contrast, focus more of their distribution within West Virginia, although they also access markets in Waynesburg, Pennsylvania; Garrett County, Maryland; New York City, and international markets.
Farmers within the Greenbrier Valley region sell exclusively within West Virginia. Farmers in the Huntington area, by contrast, sell within West Virginia but also to New York City; Washington, D.C.; Garrett County, Maryland; Atlanta, Georgia; and international markets. Compared with the other three areas, Huntington-area farmers report the widest diversity of destinations for their farm products.
One potential avenue for increasing sales of organic produce grown in West Virginia is to access large metropolitan areas. Because there are no large cities within West Virginia, accessing large metropolitan markets requires out-of-state distribution.
Sales to large metropolitan areas represent only one of several pathways for expanding sales of West Virginia produce. West Virginia farmers can also increase sales directly to consumers through on-farm stores, roadside stands, U-pick operations, farmers markets, community supported agriculture

42 | P a g e
arrangements, or online markets. Numerous institutional markets exist in West Virginia, such as schools and hospitals. Restaurants and grocery stores are other options. (Peters et al., 2012)
3.5.1 Geospatial supply and demand index
A lack of access to information among producers and consumers hinders the creation of a strong West Virginia food system. Additional information could help potential organic converters as they make plans to expand production, grow new crops, or seek new markets. A geospatial analysis that constructs a supply and demand index would be one method to help identify regions in West Virginia in which organic supply can be increased and demand met.
Downstream Strategies is currently working on a comprehensive web-based map application backed by extensive data—including supply and points of potential demand—to connect producers with consumers, institutional buyers, aggregators, distributors, and retailers; encourage an increase in food production; and assist future farmers in expanding food production in West Virginia.
This project was developed by the West Virginia Food &Farm Coalition, West Virginia University Extension Service, West Virginia Geographic Information System Technical Center, Downstream Strategies, and state and local government entities. The web-based mapping application will be offered through the West Virginia Food and Farm Coalition website and will provide information centered on three main user groups: producers (existing and potential), consumers (individual, commercial, institutional), and organizations/policy makers (new and existing local food organizations and academia).
The producer user group will have access to data specific to local food production topics and data points. These data will include locations and details concerning meat processing centers, co-packing facilities and community kitchens available for valued-added processing, aggregators and/or distributors, and other buyers seeking local food. These data will list details in a pop-up format and give the user the ability to query specific producer-related needs. To encourage increased food production across the state, datasets will serve information related to the production capabilities and characteristics. These data will relate to demographics and/or consumer-related statistics, which will indicate where demand is high and for what types of commodities. This tool will not only offer information regarding outlets, but will also provide an understanding of present land-based conditions that may be conducive or restrictive to future food production.
The consumer user group will have access to data that maps local food outlets. The mapped locations will have pop-up boxes that will list specific details, including hours, event type, and other information relevant to a particular outlet. These local food outlets could include farmers markets, food hubs, cooperatives, grocers, institutions and/or restaurants stocking and serving local food. This interactive map will give consumers the ability to see where they can purchase and enjoy local food across the state. In addition to these maps, a query capability will be developed that will allow a user to ask specific questions, such as distance to a location, hours of operation, and other outlet details.
The organization and policy user group will have access to various datasets relating to the state's agricultural industry. These data sets would provide a "snap-shot" of current agricultural production and conditions. Data will be broken down into useful mapping elements and data points that will facilitate efforts that would bolster existing resources to producers and outlets.
Additionally, datasets regarding agricultural education programs and other valuable resources will be displayed. These datasets could assist economic development organizations interested in identifying where and what types of investment could promote expansion of local food production, including where to site a food processing and distribution facility. These datasets could also assist small

43 | P a g e
farmers or institutions by providing access to the sometimes impenetrable data to support requests for grant funding or other project related work.
All user groups will have access to tools that allow for spatially enabled queries. For example, a user might wish to find all restaurants serving local food within a certain distance of a town they plan to visit. The user can enter that town's name into a tool, select a distance (e.g., two miles) and receive a custom map, legend, and information box highlighting the features of interest.
44 | P a g e
4. DISCUSSION AND RECOMMENDATIONS
The interviews, surveys, policy and economic research, and GIS analysis conducted in this report aim to answer three primary research questions:
1. Why are there not more organic farms in West Virginia? 2. What is the current supply and distribution of organically produced food, feed, and fiber in
West Virginia? 3. What are the potential economic gains for West Virginia farmers to be USDA-certified
organic?
4.1 Why are there not more organic farms in West Virginia?
The basis for this study’s original assumptions concerning the number of certified organic farms in West Virginia hinged on the 2007 Agriculture Census, which counted 84 farms as certified organic and 132 as in transition (USDA, 2009). However, this study was able to find only six farms that are currently USDA-organic certified and another seven that are in transition. When polling farmers about their practices, 96 indicated they practiced organic methods.
Several data points from questions in both the interviews and the mailed survey suggest why there are not more certified-organic farms in West Virginia. Emergent issues included the following: size and scale of West Virginia farms, potential consumers, cynicism about USDA-organic certification, misconceptions about USDA certification processes and costs, perception of costs versus benefits, and the need for certification in order to meet the goals of the farm.
Most surveyed farms were small. Approximately half of the responding farmers had less than $5,000 in gross sales in 2011, with another 15% having gross sales between $5,000 and $10,000. Considering the financial and time resources associated with organic field records and bookkeeping, the advantages of organic certification for smaller farmers are far less than for those whose farm sales are greater; thus, the smaller farms that participated in this study have little incentive to pursue organic certification. Farmers who participated in Phase 3 interviews confirmed this result. Respondents noted that the value of pursuing certification was less for small farms, because the costs both in time and money did not change proportionally as the size of the operation changed.
A second key constraint in West Virginia is the lack of an available market. West Virginia ranks 49th out of 50 states in household income and has a high poverty rate (US Census, 2007). As producers of organic farm products tend to charge a higher price, many farmers do not have sufficient local customers who can afford to pay a price premium. While the higher cost of organic produce makes it challenging to sell locally, a recent study of local food systems in West Virginia found a strong unmet demand for local produce (Peters et al., 2012).
Additionally, issues of distribution (marketing and sales) were the second most important factor affecting economic farm performance of survey participants. Further, 63.9% of farmers indicated that they did not feel consumers were willing to pay the higher prices generally associated with organic farm products and the participants’ responses on the demand for organic food indicated only a slight interest above conventionally grown/raised farm products. Phase 3 interview participants also discussed market availability as a constraint that stifles their pursuit of organic certification.
A final and likely market variable affecting farmers’ interest in pursuing organic certification is population centers for distribution. West Virginia has only two cities with populations in excess of 40,000, and one with a population between 30,000 and 40,000. West Virginia farmers in the Eastern Panhandle commonly sell their products in the nearby Baltimore and Washington, D.C. metropolitan

45 | P a g e
areas. However, farmers from other parts of the state have far fewer opportunities for distribution to large cities. The major points of distribution within the state were the West Virginia cities of Morgantown, Charleston, Romney, Fairmont, and Lewisburg.
Another important explanation is cynicism among farmers about USDA-organic certification and what “organic” actually means. A large group of farmers in both Phase 1 and 2 feel that the process and certification has been co-opted by large-scale industrial agriculture. Nearly half of the respondents were skeptical of USDA-organic certification, thought it had no or little value, thought that the certification had been co-opted by large-scale agricultural producers, and mentioned that government intrusion is problematic. “Potential converters” to certified-organic were more vocal about these issues than conventional farmers.
Participation in the USDA-organic certification program is also impacted by the cost, time spent on the certification process, and time spent maintaining records once certification has been granted. Respondents often indicated that USDA certification costs are too high in both time and money, with the belief that costs associated with becoming USDA certified, time maintaining certification paperwork, and time pursuing the certification are all critical roadblocks for certification. Amongst the three previously mentioned conceptions, there was no statistical difference between potential converters and conventional farmers. Additionally, potential converters felt strongly that the benefits did not outweigh the costs for certification.
In considering current policy constraints as highlighted by farmers, only a few direct policies were noted, including the following:
seed certification requirements,
rules against paraffin and Styrofoam for mushroom sealant, and
buffer areas surrounding organic acreage.
Additionally, government laws and regulations were noted as the sixth most important consideration affecting economic performance of the farm.
4.2 What is the current supply and distribution of organically produced food, feed, and fiber in West Virginia?
Among the respondents to the questionnaire, we tabulated the many farm products being grown, raised, or produced by West Virginia farmers. Amongst vegetable crops being grown and distributed in West Virginia, ordinary garden vegetables were noted most often, followed by specific items:
tomatoes,
beans,
squash,
cucumbers,
potatoes,
sweet corn,
onions,
cabbage, and
bell peppers.
Fruit and nut crops included (from most common to least):
apples,
berries,

46 | P a g e
peaches,
raspberries,
blueberries,
pears,
blackberries,
tree fruits,
strawberries, and
fruits.
Miscellaneous plants included the following:
hay,
herbs,
cut flowers,
number two field corn,
garlic,
grains,
bedding plants,
mushrooms,
timber, and
ginseng.
Meat products included:
beef,
chicken,
lamb,
pork,
goat,
rabbit,
fish,
turkey,
guinea, and
duck.
Other miscellaneous animal products included:
eggs,
honey,
dairy (goat),
wool,
alpaca fiber,
cheese,
llamas,
yogurt,
soap (goat milk), and
ice cream.

47 | P a g e
As illustrated above in Figure 7 and Figure 8, no obvious spatial patterns emerge regarding the types of farm products produced, and a diversity of farm products are grown and raised by West Virginia farmers.
Maps in Figure 9 through Figure 12 illustrate regional distribution patterns from Eastern Panhandle, north-central West Virginia, Greenbrier Valley, and Huntington-area farms. Eastern Panhandle farms distribute a considerable amount of farm products the five-county region, but also sell farm products to several nearby large cities. In contrast, farms in north-central West Virginia focus more of their distribution within West Virginia, although they do access some out-of-state markets.
Farms in the Greenbrier Valley region sell their products only within West Virginia. Huntington-area farms report the most significant sales within the two-county region, but also distribute to several other locations in West Virginia and to large out-of-state cities.
4.3 What are the potential economic gains for West Virginia farmers to be USDA-certified organic?
Data collected in this project suggest size and scale may limit West Virginia’s farms in regard to organic certification and production. Most respondents operate very small farms in terms of revenue generation, as well as acreage in production. Approximately one-half of respondents generated gross revenues of less than $5,000 per year, and approximately two-thirds generated between $5,000 and $10,000 (See Table 6). The average farm size among respondents was 78 acres, approximately one-half of respondents farmed less than 20 acres (See Table 5).
According to USDA requirements, farms that sell less than $5,000 per year need not pursue the formal certification process in order to market “organic” products. However, those farms with slightly-to-moderately higher sales are faced with strict certification requirements, and the cost involved in both time and resources may limit pursuit of organic certification.
Decisions regarding organic certification therefore consider certain tradeoffs. Growers weigh the extra expense and paperwork associated with certification against the potential price premiums that certified organic products could command in the marketplace and the potential additional costs (or savings) encountered when using organic methods.
Many respondents expressed skepticism regarding price premiums for organic products—especially conventional farmers who are the very people who would be making decisions to transition to organic. Depending on what markets are used for distribution, price premiums may or may not be available, or may be larger or smaller.
As discussed above in Section 3.4.2, a literature review showed variation in whether organic production costs are higher or lower than conventional production costs. Overall, these studies suggest that farmers considering transitioning to organic methods should expect increases in seed costs and labor requirements, but diminished chemical pesticide and fertilizer expenses. For some crops in some states, organic production costs were actually lower than those for conventional products.
Section 3.4.2 also confirmed that price premiums exist for organic produce. Data provided by two West Virginia distributors, as well as data from the USDA Agricultural Marketing Service for nearby produce terminals, are generally consistent and confirm that price premiums for certified-organic products can be quite substantial. Care must be taken in interpreting these results, however, because data are not available on price premiums for products sold in local markets. In order to take advantage of these price premiums, West Virginia farms would likely need to sell their organic produce via regional distributors to reach customers willing to pay the premium. This, in turn, has

48 | P a g e
implications for many other aspects of a farmer’s operation: the scale of production that may be required at each farm, certifications (other than organic) that may be required by regional distributors, packing requirements, and other aspects.
4.4 Conclusions and recommendations
4.4.1 Many West Virginia farmers have an interest in, value for, and motivation to adopt organic practices
First, the results of this study suggest that many West Virginia farmers do have an interest in, value for, and motivation to adopt organic practices. The data indicate that most respondents have an interest in organic production methods (mean score of 4.39/7 when asked for the level of interest for incorporating organic methods on one’s farm). Additionally, farmers indicated that the production of “high-quality food” was their strongest motivation for developing their farm’s goals, followed by “higher soil fertility rates and less pollution,” which was ranked third of 14. The importance of soil fertility is echoed by the current literature with farmers from Oregon ranking soil fertility management as the fourth-strongest barrier to organic production (Stephenson et al., 2012). Based on the size class of many West Virginia farms (small), current literature suggests that small farms are more apt to adopt organic practices than their larger conventional counterparts.
4.4.2 Several differences exist between potential converters and conventional growers
Second, among those currently using organic growing methods (grouped as “potential converters to organic”), several differences existed between them and their conventional farmer counterparts in the realm of age, shared farm responsibilities, education level, use of the Internet, setting one grew up in, and farm size. Based on the Chi-square calculations, the population from the study most likely to pursue organic certification for their farm includes a younger population, those who split the farm responsibilities between males and females, those who farm smaller acreages, those who have attained a higher level of education, those with greater access to the Internet and who use it for farming purposes, and those originally from urban or suburban areas. These findings are supported by the literature as research commonly suggests that organic farms tend to be smaller than conventional farms, women are much more likely to participate in farm management on organic farms, and organic farmers are less experienced than their conventional counterparts (Veldstraet al., 2012; Walz, 2004; Burton et al., 1999).
4.4.3 There is a need for more-knowledgeable and better-trained agricultural service providers
Third, based on the data from Phases 2 and 3, many farmers discussed the need for more-knowledgeable and better-trained federal and state agricultural extension employees. Farmers discussed having pursued organic production and certification previously, but expressed the limitations of accessing support from NRCS, USDA, and county extension agents in their region due to the lack of knowledge and experience in organic certification and production by these individuals.
This was also highlighted by data from Phase 2, in which participants with farms in transition to certified-organic indicated a slightly-below-average to a slightly-above-average score for the helpfulness of various agencies in the certification process. On a 1-7 scale, with 1 indicating “completely unhelpful” and 7 indicating “completely helpful,” the mean score for the helpfulness provided by certifying agencies was 2.96 (Median=1.0 and an N=26), while NRCS agency employees received a score of 3.63 (Median=4.0 and an N=27) and National Organic Program employees received a score of 3.24 (Median=4.0 and an N=25).

49 | P a g e
In addition, several farmers also discussed the need for a certifying agency body within their state or in the nearby vicinity. Many farmers highlighted the additional expenses associated with certification, including the travel and lodging costs associated with using a certifying body in Ohio, Pennsylvania, or Virginia to certify a farm in West Virginia, were prohibitive.
4.4.4 There is a need for farmers to increase the size and scale of their operation to make the certification costs and process beneficial for their operation
The fourth conclusion derived from this project is the need for farmers to increase the size and scale of their operation to make the certification costs and process beneficial for their operation. Certification is only beneficial once an operation’s size grows large enough where the economic benefits increase beyond the economic and resource expenditures. Where many small farms in West Virginia appear to produce a diversity of farms products, they in turn experience heightened costs and expenditures associated with the certification process as more elements on the farms need to be evaluated and assessed. This notion is echoed in a recent study considering the barriers to organic production in Oregon (Stephenson et al., 2012), which found that the cost of organic certification is a barrier and that the certification process is geared toward large-scale farms. Similar to West Virginia, Oregon farms are often tucked in small valleys, constraining farm size through land access. In addition, Veldstraet al. (2012) found through a survey of fruit and vegetable growers in the eastern US that smaller farms were less likely to pursue certification than larger farms, while smaller farm management systems were driven more by the farmers’ philosophy of practice compared to the economic drivers that are most influential for larger farms.
4.4.5 West Virginia farmers have limited access to potential markets
Fifth, much of the data suggest that West Virginia farmers have limited access to potential markets. Further consideration for mechanisms, such as food hubs and other wholesale distribution networks, should be considered to help with the distribution of West Virginia farm products to potential markets (Peters et al., 2012). Given the state’s topography, and that of central Appalachia, developing a distribution infrastructure seems paramount to fostering an increase in organic certification and production.
4.4.6 Alternative certifications systems may be most appropriate in West Virginia
The final conclusion from this study suggests that an alternative process be developed for a “Small Farm USDA Organic.” In fact, many farmers we spoke to have already begun to look at alternative certification systems that are outside of the USDA-organic certification program. Based on the data from Phases 1 through 3, an alternative organic-certification system for smaller organic farms should consider several elements as critical components to its development:
a stricter set of guidelines and requirements that is more consistent with the organic standards that existed prior to the USDA’s current certification system,
a certification process for small farms that includes those farms with gross revenue less than $100,000,
a certification system in which county extension services or other local agencies act as the certifying body, and
a certification system that minimizes costs of certification to allow developing farms to participate equitably.

50 | P a g e
4.5 Theoretical underpinning
In consideration of two of the project’s critical findings—lack of local support from county extension and NRCS agents, as well as size and scale barriers to certification—we offer the following explanations. First, a factor that seems to impede farmers’ interest in certification is the lack of localized programs and assistance. Farmers often reported that county extension agents or USDA-NRCS agents were unable to provide help or much support in the realm of organic production or certification. Additionally, farmers also noted that the lack of in-state certifiers was problematic.
These conclusions somewhat parallel the discourse in the natural resource management literature that suggests eight key principles in the management of natural areas (Ostrom, 1990). Ostrom posits that resources are better managed on a localized level when all stakeholders involved are engaged in the management process, from the development of rules to the completion of monitoring. The relation of this work to the current study is twofold. First, many participants indicated that the current USDA-organic certification process was largely developed to reflect the needs of larger-scale industrial agriculture organizations, and not reflective of more localized organic production. Secondly—and likely more poignant—is the lack of control and governance, or certification and monitoring, on a local level through agencies such as local NRCS and county extension offices.
A second point to consider as to why many engaged in organic agriculture opt not to pursue USDA-organic certification rests on the notion of economies of scale. An economy of scale is the decrease in the unit cost as size and usage levels are increased (Sullivan and Sheffrin, 2003). Though not new to agricultural research (Kislev and Peterson, 1996), a dearth of literature exists on the relationship between organic agriculture certification and economies of scale. Essentially, we propose that resource costs (economic, time, risks, and other) and organic certification work on an economies of scale framework. The smaller the farm, the less value there is for organic certification; alternatively, as the farm grows and is producing greater quantities, the value for certification will increase (Veldstra et al., 2012). Additionally, we suggest that the more homogenized an organic farm is, the greater the value for certification. Conversely, a greater diversity of farm products would lessen the certification value as resource expenditures would rise.
Consequently, further investigation is necessary to specifically comprehend the relationship of Ostrom’s principles to the factors limiting organic certification and production amongst small scale farmers, as well as the magnitude to which economies of scale affect farmers’ decisions to pursue organic certification through USDA. Understanding the relation of these two variables in conjunction with the associated theories may allow farmers and policy makers to develop programs that better suit those engaged in small-scale organic agriculture and the pursuit of organic certification.
4.6 Limitations
Though quite extensive in soliciting data from a varied group of West Virginia farmers, this study has a number of limitations. Foremost, one major assumption of this study was based on the number of various types of farms in West Virginia (organic, in-transition, and non-organic).
Our original numbers were based on the 2007 USDA Agricultural Census. On initiating the data collection and corresponding with the USDA field office in Charleston, West Virginia, we determined that the actual number of farms and organic farms in West Virginia was dissimilar from that reported in the USDA Census report. Thus, we were faced with a smaller sample size than originally planned and therefore had to amend research methods accordingly.
A second limitation to this study is in the response rate (29.2%). Though well within an acceptable level for mailed surveys (Brown, 2005; Farmer et al., 2012), we feel our response rate was lower

51 | P a g e
because the 2012 USDA Agricultural Census was being collected during the same months that our Phase 2 (mailed survey) collection process was occurring. Future research should be planned so as not to overlap with the USDA Census data collection.
A final limitation that should be remedied is the use of a tracking numbers in order to create an absolute map of farms that participated in the study. While we were able to gain an approximate location of each farm, more specific geographic location would be helpful and easily remedied. The current study opted to err on the side of anonymity for farmers participating in the study.

52 | P a g e
REFERENCES
Archer D.W. and Kludze, H. (2006). Transition to organic cropping systems under risk. American Agricultural Economics Association Annual Meeting. Long Beach, CA.
Baier, A.H and Ahramjian, L. (2012). Organic certification of farms and businesses producing agricultural products. Nov. Accessed May 15. www.ams.usda.gov/AMSv1.0/getfile?dDocName=STELPRDC5101547
Bernard R. (2006). Research methods in anthropology: Qualitative and quantitative approaches (4th ed.). New York: Alta Mira Press.
Brown, G. (2005). Mapping spatial attributes in survey research for natural resource management: methods and applications. Society and Natural Resources: An International Journal, 18:17–39.
Brumfield, Robin G., Rimal, A., and Reiners, S. (2000). Comparative cost analyses of conventional, integrated crop management, and organic methods. HortTechnology, 10:785-793.
Burton, M., Rigby, D., and Young, T. (1999). Analysis of the determinants of adoption of organic
horticultural techniques in the UK. Journal of Agricultural Economics, 50(1):47–63.
Clark, S., Klonsky, K., Livingston, P., and Temple, S. (1999). Crop-yield and economic comparisons of organic, low-input, and conventional farming systems in California’s Sacramento Valley. American Journal of Alternative Agriculture, 14:109-121.
Corey B. (2012). Chief Executive Officer, Corey Brothers, Inc. Telephone conversation with author Peters. May 24.
Corey Brothers, Inc. (2012). Annual sales to date as of Oct 15.
Crawford, J. (2012). President and CEO, Tuscarora Organic Growers Cooperative, Inc. Telephone conversation with author Peters. May 22.
Creswell, J.W. (2007). Qualitative inquiry and research design: Choosing among five traditions (2nd ed.). Thousand Oaks, CA: Sage Publications.
Creswell, J.W. and Plano-Clark, V. L. (2007). Designing and conducting mixed methods research. Thousand Oaks, CA: Sage Publications.
Delate, K., Duffy, M., Chase, C., Holste, A., Friedrich, H., and Wantate, N. (2003). An economic comparison of organic and conventional grain crops in a long-term agroecological research (LTAR) site in Iowa. American Journal of Alternative Agriculture, 18:59-69.
Dent, J.B., Morgan, O., and Grieve, R. (1999) The role of attitudes and objectives in farmer decision making: business and environmental-oriented behaviour in Scotland, Journal of Agricultural Economics, 50:286–303.
Dimitri, C. and Oberholtzer, L. (2009). Marketing US organic foods: recent trends from farms to consumers. (Report No. 58). www.ers.usda.gov/publications/eib58/
Dobbs, T.L. and Smolik, J.D. (1996). Productivity and profitability of conventional and alternative farming systems: A long-term on-farm paired comparison. Journal of Sustainable Agriculture, 9:63-77.

53 | P a g e
Fairweather, J.R. (1999). Understanding how farmers choose between organic and conventional production: Results from New Zealand and policy implications. Agriculture and Human Values, 16:51-63.
Fairweather, J.R. and Campbell, H. (1996). The decision making of organic and conventional agricultural producers. Research report No. 233. ISSN 1170-7682.
Farmer, J., Knapp, D., Meretsky, V., Chancellor, C., and Fischer, B. (2011). Place attachment and the adoption of conservation easements. Conservation Biology, 25:827-834.
Glover, J., Hinman, H., Reganold, J., and Andrews, P. (2002). A cost of production analysis of conventional vs. integrated vs. organic apple production systems. Washington State University Agricultural Research Center, Publication XB1041.
Greene, J., Caracelli, V., and Graham, W. (1989). Toward a conceptual framework for mixed method evaluation designs. Educational Evaluation and Policy Analysis, 11:255-274.
Hanson, J.C., Lichtenburg, E., and Peters, S.E. (1997). Organic versus conventional grain production in the mid-Atlantic: An economic and farming system overview. American Journal of Alternative Agriculture, 12:2-9.
Hartz, L., Eades, D., Brown, C., McConnell, T., Hereford, A., and Boettner, F. (2012). West Virginia food system: Seasonal production expansion and its impacts. Morgantown, WV: Downstream Strategies. Jan. www.downstreamstrategies.com/documents/reports_publication/ds_food_system_report_final.pdf.
Kislev, Y. and Peterson, W. (1996). The economics of agriculture (2nd ed.). Editors J. M. Antle and D. A. Sumner. Chicago, IL: University of Chicago Press.
Koesling, M., Ebbesvik, M., Gudbrand, L., Flaten, O., Valle, P.S., and Arntzen, H. (2004). Risk and risk management in organic and conventional cash crop farming in Norway. Food Economics, 1:195-206.
Kuminoff, N. V. and Wossink, A. (2009). Valuing the option to convert from conventional to organic farming. Working paper No. 2009-03.
Lillard, P.T. and Lindner, J.R. (2012). The changing interest in organic agriculture in Texas and its implication for Texas AgriLife Extension Service. Journal of Extension, 50(3):Article Number 3RIB8.
Lohr, L. and Salomonsson, L. (2000). Conversion subsidies for organic production: Results from Sweden and lessons for the United States. Agricultural Economics, 22(2):133–146.
Martin, S. (1996). Risk management strategies in New Zealand agriculture and horticulture. Review of Marketing Agricultural Economics, 64:31-44.
Moustakas, C. (1994). Phenomenological research methods. Thousand Oaks, CA: Sage Publications.
Offermann, F. and Nieberg, H. (2000). Economic Performance of Organic Farms in Europe, Organic Farming in Europe. Economics and Policy, 5. University of Hohenheim, Stuttgart.
Peters, C., Hansen, E., Clingerman, J., Hereford, A., and Askins, N. (2012). West Virginia food system: Opportunities and constraints in local food supply chains. Morgantown, WV: Downstream Strategies. Prepared for West Virginia Food & Farm Coalition. September 24. www.downstreamstrategies.com/documents/reports_publication/DS_wv_food_system_opportuities_and_constraints_in_local_food_supply_chains.pdf

54 | P a g e
Pimentel, D., Hepperly, P., Hanson, J., Douds, D., and Seidel, R. (2005). Environmental, energetic, and economic comparisons of organic and conventional farming systems. BioScience, 55:573-582.
Riddick, C.C. and Russell, R.V. (2007). Research in recreation, parks, sport, and tourism (2nd ed.). Champaign, IL: Sagamore Publishing.
Salant, P.A. and Dillman, D.A. (1994). How to conduct your own survey. New York: J. Wiley.
Sullivan, A. and Sheffrin, S. (2003). Economies: Principles in action. Upper Saddle River, NJ: Pearson Prentice Hall.
Taylor, J. (2012). Tuscarora Organic Growers Cooperative, Inc. Prices quoted to author Peters during telephone interview. Sep 19.
Thilmany, D. (2006). The US organic industry: Important trends and emerging issues for the USDA. Agribusiness Marketing Report. Colorado State University, April-2006-ABMR 06-01.
United States Census. (2007). 2007 Economic census. Retrieved on June 2, 2012 from www.census.gov/econ/census07/.
United States Department of Agriculture (USDA). (2009). 2007 Census of agriculture. Volume 1, Geographic Area Series, Part 51. Updated Dec. www.agcensus.usda.gov/Publications/2007/Full_Report/usv1.pdf
United States Department of Agriculture (USDA), Agricultural Marketing Service. (2013). Fruit & vegetable market news. Report type: Terminal market averages. http://151.121.3.194/cat/?shortcut=terminalMarket#. Accessed March 19 and 20.
Veldstra, M.D., Alexander, C.E., and Marshall, M.I. (2012). To certify or not to certify? Decomposing the organic production and certification decisions. Retrieved on April 13, 2013, from www.ifama.org/events/conferences/2012/cmsdocs/Symposium/PDF%20Symposium%20Papers/538_Paper.pdf
Walz, E. (2004). Fourth national organic farmers’ survey: Sustaining organic farms in a changing organic marketplace. Organic Farming Research Foundation, Santa Cruz, CA. Available at http://ofrf.org/publications/pubs/4thsurvey_results.pdf
Willock, J., Deary, I. J., Edwards-Jones, G., Gibson, G. J., McGregor, M. J., Sutherland, A., Dent, J. B., Morgan, O., and Grieve, R. (1999). The role of attitudes and objectives in farmer decision making: Business and environmentally-oriented behaviour in Scotland. Journal of Agricultural Economics, 50(2), 286-303
West Virginia Department of Agriculture. (2013). USDA/WVDA organic certification cost share program, 2012 – 2013: Application for reimbursement. Accessed May 15. www.wvagriculture.org/images/Marketing/OCCSProgram-Application-Revised-4-13.pdf