EFFECT OF COLLEGIATE ATHLETES' PERSONALITY TRAITS ON OCCURRENCE OF ATHLETIC
University of Kentucky University of Kentucky
UKnowledge UKnowledge
Theses and Dissertations--Dietetics and Human Nutrition Dietetics and Human Nutrition
2013
OVERALL DIET QUALITY OF COLLEGIATE ATHLETES OVERALL DIET QUALITY OF COLLEGIATE ATHLETES
Amanda N. Ireland University of Kentucky, [email protected]
Right click to open a feedback form in a new tab to let us know how this document benefits you. Right click to open a feedback form in a new tab to let us know how this document benefits you.
Recommended Citation Recommended Citation Ireland, Amanda N., "OVERALL DIET QUALITY OF COLLEGIATE ATHLETES" (2013). Theses and Dissertations--Dietetics and Human Nutrition. 14. https://uknowledge.uky.edu/foodsci_etds/14
This Master's Thesis is brought to you for free and open access by the Dietetics and Human Nutrition at UKnowledge. It has been accepted for inclusion in Theses and Dissertations--Dietetics and Human Nutrition by an authorized administrator of UKnowledge. For more information, please contact [email protected].
STUDENT AGREEMENT: STUDENT AGREEMENT:
I represent that my thesis or dissertation and abstract are my original work. Proper attribution
has been given to all outside sources. I understand that I am solely responsible for obtaining
any needed copyright permissions. I have obtained and attached hereto needed written
permission statements(s) from the owner(s) of each third-party copyrighted matter to be
included in my work, allowing electronic distribution (if such use is not permitted by the fair use
doctrine).
I hereby grant to The University of Kentucky and its agents the non-exclusive license to archive
and make accessible my work in whole or in part in all forms of media, now or hereafter known.
I agree that the document mentioned above may be made available immediately for worldwide
access unless a preapproved embargo applies.
I retain all other ownership rights to the copyright of my work. I also retain the right to use in
future works (such as articles or books) all or part of my work. I understand that I am free to
register the copyright to my work.
REVIEW, APPROVAL AND ACCEPTANCE REVIEW, APPROVAL AND ACCEPTANCE
The document mentioned above has been reviewed and accepted by the student’s advisor, on
behalf of the advisory committee, and by the Director of Graduate Studies (DGS), on behalf of
the program; we verify that this is the final, approved version of the student’s dissertation
including all changes required by the advisory committee. The undersigned agree to abide by
the statements above.
Amanda N. Ireland, Student
Kelly Webber, PhD, MPH, RD, LD, Major Professor
Kelly Webber, PhD, MPH, RD, LD, Director of Graduate Studies

OVERALL DIET QUALITY OF COLLEGIATE ATHLETES
___________________________________________
THESIS
___________________________________________
A thesis submitted in partial fulfillment of the
requirements for the degree of Master of Science in the
College of Agriculture
at the University of Kentucky
By
Amanda Nicole Ireland
Lexington, Kentucky
Director: Kelly Webber, PhD, MPH, RD, LD, Assistant Professor of Dietetics and
Human Nutrition
Lexington, Kentucky
2013
Copyright © Amanda Nicole Ireland 2013

ABSTRACT OF THESIS
OVERALL DIET QUALITY OF COLLEGIATE ATHLETES
Athletes appear healthy according to weight for height and body fat standards. Though
athletes appear to be healthy, little is known about their diets. Research states there is a
connection between athletic performance and nutrition. The objective of this study was to
determine the diet quality of 138 collegiate athletes. Data were collected in a laboratory.
Demographics were collected via survey. Anthropometrics were assessed using a free
standing stadiometer and the BodPod® for body fat assessment. Block 2005 Food
Frequency Questionnaire© was used to assess diets. The Healthy Eating Index (HEI)
2005 was used to calculate diet quality scores. The average BMI was 23.2 (2.3) kg/m2
and the average body fat was17.8 % (6.5). The average HEI score was 51.2 (8.8). Higher
HEI scores were correlated with higher body fat percentage in this sample. Diets were
adequate in: calcium, iron, and vitamin C. Diets were inadequate in: fiber, fruits and
vegetables intakes. The athletes had excessive intakes of sodium and total percent fats.
These findings demonstrate the need for nutrition education for collegiate athletes.
KEYWORDS: Diet quality, collegiate athletes, Healthy Eating Index 2005, Block 2005
Food Frequency Questionnaire, Nutrition knowledge
Amanda Nicole Ireland
July 5, 2013

OVERALL DIET QUALITY OF COLLEGIATE ATHLETES
By:
Amanda Nicole Ireland
Kelly Webber, PhD, MPH, RD, LD
Director of Thesis
Kelly Webber, PhD, MPH, RD, LD
Director of Graduate Studies
July 5, 2013
Date
iii
ACKNOWLEDGEMENTS
I would like to recognize those who have dedicated their time to help make this
thesis possible. I would like to thank Dr. Kelly Webber, my thesis committee chair. Dr.
Webber encouraged and motivated me to proceed with this thesis. Dr. Webber has been a
great inspiration and great mentor throughout my road as a graduate student. I would like
to thank Dr. Janet Kurzynske who has also supported me through this research study. Dr.
Kurzynske guided me through the thesis process and encouraged success. I would like to
thank Dr. Hazel Forsythe and Dr. Ingrid Adams who have also helped me with many
suggestions during the research process.
I would like to thank the Dietetics and Human Nutrition department chair, Dr.
Sandra Bastin, who offered support and encouragement throughout the time I have been
in graduate school. Dr. Bastin has been a great motivator to succeed and to perform to the
best of my ability.
I would like to thank my family, friends, and fellow graduate students who have
given me much support to complete this degree. These groups of people have helped
push me to my fullest potential and have supported me in all my decisions that I have
made.
iv
TABLE OF CONTENTS
ACKNOWLEDGEMENTS ............................................................................................... iii
LIST OF TABLES ...............................................................................................................v
LIST OF FIGURES ........................................................................................................... vi
CHAPTER ONE ..................................................................................................................1
Problem Statement .......................................................................................................... 1
Purpose ............................................................................................................................ 2
Research Questions: ........................................................................................................ 2
Hypotheses ...................................................................................................................... 3
Justification ..................................................................................................................... 3
Assumptions .................................................................................................................... 3
CHAPTER TWO: Literature Review ..................................................................................4
Diet Quality ..................................................................................................................... 4
Nutrition Knowledge of an Athlete................................................................................. 6
Male versus Female Athletes .......................................................................................... 9
Macronutrient Recommendation .................................................................................. 11
Micronutrients and Athletic Performance ..................................................................... 12
CHAPTER THREE: Methodology ....................................................................................16
Study Design ................................................................................................................. 16
Participants .................................................................................................................... 16
Food Frequency Questionnaire ..................................................................................... 16
The Healthy Eating Index 2005 Point System .............................................................. 17
CHAPTER FOUR: Results ................................................................................................25
CHAPTER FIVE: Discussion ............................................................................................29
Limitations .................................................................................................................... 30
CHAPTER SIX: Conclusion..............................................................................................32
APPENDECES ..................................................................................................................33
Appendix I: Healthy Eating Index 2005 ....................................................................... 33
Appendix II: Definition of Terms ................................................................................. 34
BIBLIOGRAPHY ..............................................................................................................35
VITA ..................................................................................................................................38
v
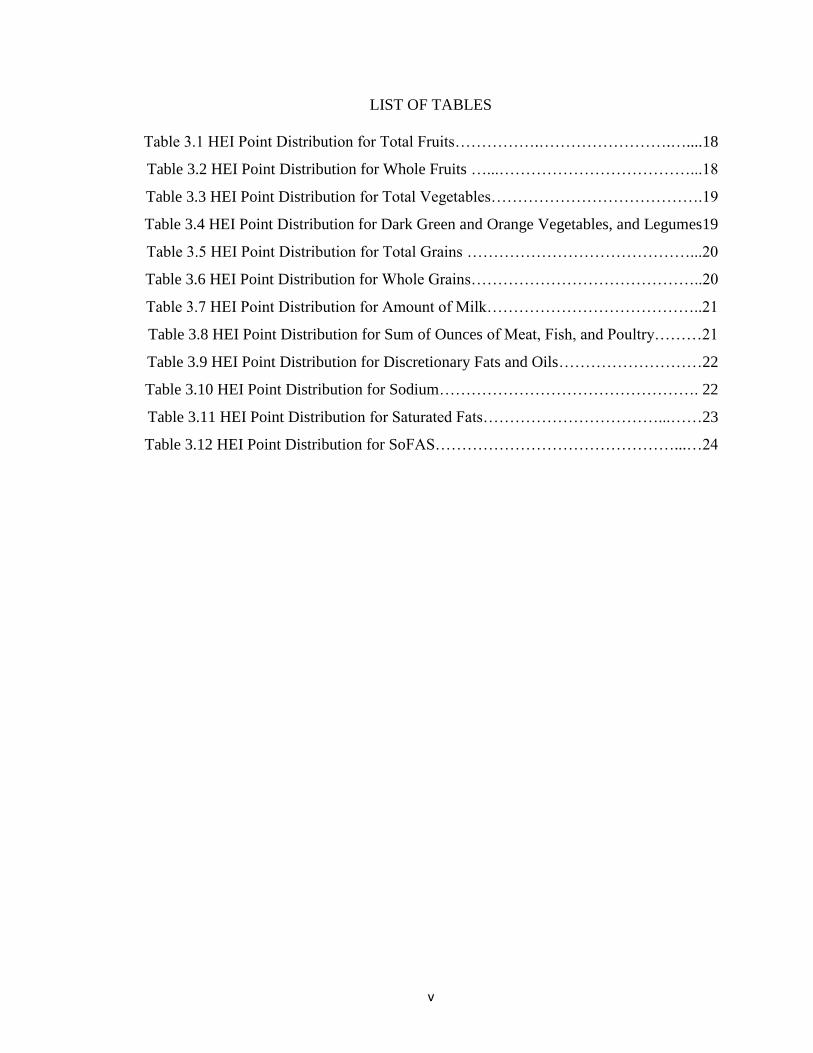
LIST OF TABLES
Table 3.1 HEI Point Distribution for Total Fruits…………….…………………….…....18
Table 3.2 HEI Point Distribution for Whole Fruits …...………………………………...18
Table 3.3 HEI Point Distribution for Total Vegetables………………………………….19
Table 3.4 HEI Point Distribution for Dark Green and Orange Vegetables, and Legumes19
Table 3.5 HEI Point Distribution for Total Grains ……………………………………...20
Table 3.6 HEI Point Distribution for Whole Grains……………………………………..20
Table 3.7 HEI Point Distribution for Amount of Milk…………………………………..21
Table 3.8 HEI Point Distribution for Sum of Ounces of Meat, Fish, and Poultry………21
Table 3.9 HEI Point Distribution for Discretionary Fats and Oils………………………22
Table 3.10 HEI Point Distribution for Sodium…………………………………………. 22
Table 3.11 HEI Point Distribution for Saturated Fats……………………………...……23
Table 3.12 HEI Point Distribution for SoFAS………………………………………...…24

vi
LIST OF FIGURES
Figure 4.1 Male and Female Recommendations compared to Intake of Fruits and
Vegetables………………………………………………………………………………..26
Figures 4.2 Male and Female Recommendations compared to Intake of Sodium and
Calcium ………………………………………………………………………………..27
Figures 4.3 Male and Female Recommendations compared to Intake of Fiber……....…27
Figure 4.4 Male and Female Recommendations compared to Intake of Vitamin C and
Iron……………………………………………………………………………………….28
Figure 4.5 Male and Female Recommendations compared to Intake of Total Percent Fat
……………………………………………………………………………………………28

1
CHAPTER ONE
Collegiate athletes are an inspiration for many younger athletes and should be an
influence on how to perform efficiently at the position that is being played. Today,
collegiate athletes are considered to be some of the healthiest people based on their body
weight composition and should have an ideal body appearance. Collegiate athletes are
required to fit a specific body appearance for their position and the sport in which they
participate. Collegiate athletes may be pressured by their coaches and strength staff to fit
a specific body size because of performance expectations and the comparison with other
competitors. Despite appearances, collegiate athletes’ overall performances may be
hindered by nutritional deficiencies.
Problem Statement
Poor dietary habits can lead an athlete to be underweight during his/her athletic
career and lead to being obese post-athletic career. Other post-athletic health problems
that may be of concern include type 2 diabetes mellitus, coronary heart disease, increased
risked of certain cancers, and osteoporosis. Most athletes do not worry about the potential
future of diseases during their collegiate years. Instead, they are focused on their athletic
performance and what the coaches expect from them.
It is known that the diet of an athlete can have an effect on his/her overall
performance (Bronci, 2011). Athletes, who have healthy and balanced diets, can perform
better due to having adequate nutrient stores built up in their body. When those stores are
maximized in the body, the body will utilize them as needed during physical activity. In
poor quality diets, these nutrient stores will not be replenished to their maximized state.
With these minimal stores, the body cannot perform to its full potential.

2
Athletes receive most of their nutrition knowledge from the coaching staff,
strength and conditioning staff, and athletic training staff; however, it is questionable how
accurate the information is (Torres-McGehee, Pritchett, Zippel, Minton, Cellamare,
Sibilia, 2012). These athletic professionals may have some general knowledge of
nutrition; however, these are not nutrition professionals. The staff of the institution who
may offer nutrition information to athletes may or may not have a strong understanding
about nutrition. A registered dietitian can give the athlete the most accurate information
on which food options are best to reach his/her goal. Registered dietitians can offer
nutrition counseling and presentations, develop meal plans for the athlete, and work
closely with the food service program at the college to check the nutritional status of the
meals that are offered.
Purpose
The purpose of this study is to assess the diet and body composition of collegiate
athletes. This study will compare and contrast the diets of collegiate athletes by sport, and
gender. The objective of this study is to determine the nutritional quality of the diet of
138 collegiate athletes.
Research Questions:
1. What are the dietary excesses and deficiencies found among the athletes?
2. Is there a relationship between body fat percentage and diet quality in the
collegiate athletes in this study?
3. Is there a difference between the diet quality of male and female athletes
in this study?
3
Hypotheses
1. Athletes will have excesses and deficiencies in their diet similar to those found in
the general population.
2. There is a negative correlation between body fat and diet quality in athletes.
3. Females will report higher diet quality than males.
Justification
According to a joint position paper written by the American Dietetic Association,
Dietitians of Canada, and American College of Sports Medicine, it was reported that for
someone who is physically active, cares about athletic performance, and strives for good
recovery from these physical performances, proper nutrition is crucial (JCSM, 2009). An
athlete’s overall performance could improve if the athlete receives proper nutrition
education. This research study will evaluate the current dietary intake of collegiate
athletes.
Assumptions
The participants in this study are a small representation of collegiate athletes. It is
assumed that athletes care about their overall performance and have the desire to perform
to their fullest potential. It is believed that the results from a food frequency questionnaire
are an accurate representation of the diet of the athletes that participated in the study. It is
believed they answered accurately to the best of their ability.

4
CHAPTER TWO: Literature Review
The overall diet for athletes could significantly affect their performance. Many
people offer nutrition advice to collegiate athletes. However, it is unclear if the
information that is being received is completely accurate. Although these athletes receive
nutrition education, some athletes ignore what is being taught or do not know how to
effectively apply the diet to their everyday life. There are certain macronutrient and
micronutrient requirements that can play a significant role in athletic performance.
Diet Quality
Diet quality is determined by the food choices that are made. A diet high in
quality consists of but not limited to whole grains, lean meats, fresh fruits and vegetables
and low-fat milk consumption. Diet quality is also based on frequency of these food
items. Those who are more conscious of their food choice are more aware of what types
of foods offer more nutrients and may be fewer calories. Some components that can
affect the diet quality are: vitamins, minerals, fiber, whole grains, healthy fats, and fruits
and vegetables (“Diet quality and nutrition”, 2013). Those who are less concerned about
the foods they are consuming, generally choose foods that are high in fat, sugar, and
sodium. These diets are low in nutrient density. When a diet has poor quality, the
concern for chronic health conditions rises. Some of these conditions are obesity, type 2
diabetes mellitus, and cardiovascular disease.
The Healthy Eating Index of 2005 (HEI-2005), created by the USDA, is a
measure of diet quality in conformance to Federal dietary guidance (Guenther, Reedy, &
Krebs-Smith, 2008). It is a standardized tool that can be used in nutrition monitoring,
interventions, and research. The standards for this measurement were created using a

5
density approach (expressed as amount per 1,000 calories). The components of the HEI-
2005 are: total fruit (including 100% juice), whole fruit (not juice), total vegetables, dark
green and orange vegetables and legumes, total grains, whole grains, meat and beans,
oils, saturated fats, sodium, and calories from solid fats, alcoholic beverages, and added
sugars. To determine the standards for scoring, intervals must be determined that will
move through the number of points allotted for that component. The scores for each
component, are then added together to determine the overall score. This determines the
overall diet quality score. One of the strengths of the HEI-2005 are assessing diets on a
1,000 calorie basis to be able to evaluate diet quality per a standard diet quantity. Other
strengths are evaluating energy-dense, nutrient-poor food consumption, as well as
evaluating American diets that are furthest from the recommendations (Guenther et al.,
2008). Some limitations of the HEI-2005 are that it does not assess the diet of those who
are younger than 2 years of age, it does not assess the diet of those whose dietary patterns
are different from the American typical diet, and it does not delineate specific fats: oils,
total fats, cholesterol, and trans fats. When evaluating participants about their average
diet, a questionnaire is one method of gathering the appropriate data. Participants can be
honest about their food choices, especially when the questionnaire covers many different
food options that are not generally mentioned when discussing food patterns with a
participant.
The Block 2005 Food Frequency Questionnaire was developed using large
surveys, such as the National Health and Nutrition Examination Survey (NHANES) to
examine food groups and physical activities. This questionnaire was designed to estimate
usual intake of a wide variety food groups (“Assessment and analysis,” 2013).

6
This self-administered diet history food frequency questionnaire was tested and
found to be valid and reliable by a study that contained 11,658 adult participants in the
Second National Health and Nutrition Examination Survey (NHANES II) for a self-
administered diet history questionnaire (Block, Hartman, Dresser, Carroll, Gannon, &
Gardener, 1986). This study evaluated the total caloric intake of the participants and
seventeen nutrients. Based on this questionnaire, composition values were determined by
how frequent these foods were consumed. When nutrient information was collected on
the survey, this food list combined with appropriate portion sizes was used to determine
amount of nutrients. This study showed correlations of r>0.70. These results are those
found nationally.
Nutrition Knowledge of an Athlete
Athletes receive their nutrition knowledge from many different sources. Some of
these sources are the athletes themselves, coaches, strength and conditioning specialists
and athletic trainers (Torres-McGehee et al., 2012). In a study by Torres-McGehee et al.,
2012, each of these groups was evaluated on basic nutrition knowledge. Individuals were
examined on how much nutrition knowledge they had to determine their confidence
levels with nutrition. There were 579 participants that consisted of 185 athletes, 131
coaches, 192 athletic trainers, and 71 strength and conditioning coaches in the study. The
participants were asked to answer questions on basic nutrition knowledge, supplements
and their relationship to performance, weight management, and hydration. To have
adequate nutrition knowledge, the participants needed to score at least a 75% in all
domains (with the highest possible score being 100%). This study found that the
participants had an average score of 68.5% in all domains. Strength and conditioning

7
specialists had the highest nutrition knowledge with 83.1%, athletic trainers with 71.4%,
coaches had 35.9%, and athletes having only a 9%. Registered dietitians were the main
resources reportedly used by the coaches’, strength and conditioning coaches’, athletic
trainers’ nutrition knowledge. It was concluded that athletic trainers and strength and
conditioning specialists offer the most adequate nutrition knowledge of all the surveyed
personnel for an athlete. The study suggested that the coaches and support staff receive
the most nutritional education and as they are around the athletes often, they may set a
good example. In addition, they may develop nutrition programs for these athletes.
There is little research available because this is a relatively new and growing area. The
small amount of research that has been done in this field has had very small participant
numbers.
If an athlete receives nutrition education, it depends on the athlete to apply the
knowledge to his/her actual diet. In a study that consisted of collegiate, female swimmers,
it was concluded that although the athletes have the nutrition knowledge for an adequate
diet, the recommended dietary allowance (RDA) for all three macronutrients (fat,
carbohydrates, protein) was not met (Hoogenboom, Morris, Morris, & Schaefer, 2009).
This study consisted of eighty-five female collegiate swimmers from six Michigan
Universities that were asked to complete a nutrition knowledge questionnaire and a 24-
hour recall survey. The purpose of this study was to determine the nutrition knowledge of
these swimmers and to assess if they effectively apply this knowledge to their everyday
diet. A limitation of this study was that the participants had difficulty remembering their
intake for the 24-hour recall and a rough estimate of the portion sizes. Although 71.75%
of the participants chose the correct answers on the nutritional knowledge questionnaire,

8
from the 24-hour recall, 95.9% of the participants did not meet the recommended dietary
allowance (RDA) for all three macronutrients. This study confirms that though some
athletes receive some nutrition education, their diet does not represent such knowledge.
Some athletes do not believe that nutrition can play a role in performance. These
athletes believe that training and practice are all that is needed for optimal performance.
A group of Division I NCAA athletes (328), were asked to complete a nutrition
knowledge questionnaire during their yearly physicals. This questionnaire was used to
determine if the nutrition knowledge from a registered dietitian is beneficial to the
athletes and if the athletes were actually applying the education to their lifestyles. This
questionnaire was used to evaluate their knowledge of specific nutrients and their roles
on the body and performance effects (Rosenbloom, Jonnalagadda, & Skinner, 2002).
Results from this study showed that 63% of men and 54% of women knew that
carbohydrates and fat were the main energy sources for activity. Out of all the
participants, 74% of men and 75% of women knew that consuming excess carbohydrates
will make them gain weight. About half of these athletes were aware that high-fat meals
should not be consumed between 2-3 hours before an event. The majority of the
participants of this study believe that consuming sugary foods and drinks prior to an
event will adversely affect performance. A little less than half of the athletes that
participated in the study believe that protein is the main energy source for the muscle.
Approximately 34% of the women and 35% of the men believe that protein supplements
are necessary. It was concluded from these results that athletes could benefit from more
information about the role of protein as an energy source as well as for improving muscle
mass. Most of these participants knew that dehydration has an effect on performance.

9
Limitations are that this sample represents a small sample of the Division I NCAA and
cannot be generalized for all collegiate athletes. Despite this limitation, this study
adequately demonstrates that athletes would benefit from in depth education on how
foods affect the body.
Male versus Female Athletes
Most male and female athletes are aware that they must consume adequate
calories to meet the needs required for the body to produce enough energy to avoid
altering performance. A study that evaluated “Personal Food Systems of Male Collegiate
Football Players: A grounded Theory Investigation” proposed a theoretical model
explaining the personal food choice processes of collegiate football players (Long, Perry,
Unruh, Lewis, & Stanek-Krogstrand, 2011). This study had fifteen football players that
were purposefully sampled. This group represented the different positions, years of
athletic eligibility, and ethnic backgrounds. These athletes were asked predetermined,
open-ended questions. They were asked about their process on making food choices. The
findings were verified by research members, an external audit, and a nutrition specialist.
The results from this study indicated that time and peer-influences were important factors
for the athletes. With the stresses from both academics and athletics, these athletes were
limited on time which influenced their food choices. An important priority for these
athletes was hydration. The athletes first choice of food were foods high in protein
because they thought their bodies needed protein to remain healthy. A limitation in this
study would be the focus group style of face-to-face interview. There is a possibility that
the athletes provided the interviewer what they thought the interviewer wanted to hear.
In addition responses may be been influenced by other participants’ responses.
10
The female athlete’s diet is a concern to many health professionals because there
are so many health risks that can be issues for women after their athletic career. Some of
the concerns that female athletes should be aware of are higher risks of arthritis, problems
with child-bearing, and obesity after their athletic career. A study of fifty-two NCAA
Division I female collegiate athletes compared the dietary intake and eating habits to the
current guidelines for sports nutrition of female athletes (Shriver, Betts, & Wollenberg,
2012). The study lasted from January 2009 to May 2010. Dietary intake was collected for
a total of three days. This may not be long enough duration to receive the most adequate
results depending on how much physical activity was performed for these days, if it was a
day the athlete had a competition, and variations of intake due to seasonal availability of
foods. The athletes completed anthropometric measurements and dietary assessment
using a 3-day food record, a 24-hour recall and the Nutrition Questionnaire that was
previously used for the Combined Events Athlete Department (CEAD) project for the
USA athletes for Track and Field. Results from this study were that these female athletes
were not meeting their recommendations on calories and carbohydrates. For athletes, the
recommended amount of carbohydrates are 6 to 10g/kg body weight per day (Rodriguez,
DiMarco, & Langley, 2009). Carbohydrates are needed to aid in training performance,
however, 75% of the participants failed to meet these requirements. Most of the
participants were not consuming a regular breakfast. Many of these female athletes did
not monitor or meet their hydration needs. This study concluded that nutrition
interventions are needed to improve the overall diet in female collegiate athletes.
Limitations of this study were a small sample size, time and commitment, and knowledge

11
of nutrition. These results cannot be generalized to all female collegiate athletes. A larger
sample size and a random selection of athlete participants should be studied.
Macronutrient Recommendation
Macronutrients are important when considering athletic performance and the
health of the athlete after his/her career. Athletes consume macronutrients (proteins,
carbohydrates, and fat) throughout their day, however, it is important to determine if
these athletes are consuming adequate amount of these nutrients to meet the demand of
the body.
According to the position paper developed by American Dietetic Association,
Dietitians of Canada, and the American College of Sports Medicine: Nutrition and
Athletic Performance, the overall physical activity and athleticism of an athlete can be
amplified by nutrition (Rodriguez et al., 2009). Consuming adequate energy intake is
important for an athlete whether his/her sport is high-intensity and/or long in duration.
Caloric intakes are based on individual basis using an individual’s height, weight, and
physical activity demands for the athlete. When an athlete consumes adequate caloric
intakes, this will help maintain body weight and distinguish training effects. If proper
caloric intake is not met, athletes may see a decreased amount of lean muscle mass and
bone density. Female athletes may suffer from the Female Athlete Triad, which is when
there is an energy deficit, osteoporosis, and cessation of menstrual cycles.
From the position statement, carbohydrate recommendations for an athlete range
from 6-10g/kg body weight per day (Rodriguez et al., 2009). An athlete requires
carbohydrates in the body because carbohydrates help maintain blood sugar levels and
help replace glycogen stores. The amount that is needed is calculated on an individual

12
basis. Some of the criteria that contribute to the determination of the needed amount are
total energy expenditure, sport, gender, and environment (Rodriguez et al., 2009). With
these recommendations, many athletes do not meet their recommended amount of
carbohydrates in their diet.
Protein needs are easily met through the diet. Most athletes do not require
supplementation for protein or amino acids. Protein recommendations for endurance and
strength-training athletes range from 1.2-1.7 g/kg, which is greater than the average adult
needs of 0.8g/kg daily (Rodriguez et al., 2009). It has been determined that protein and
amino acids are needed to produce and maintain muscle mass in the body (Phillips,
2012). With the knowledge of benefits of protein and muscle health, athletes try to
consume enough protein to ensure adequate muscle health, however, most athletes
consume more than the recommended intake of protein on a regular basis without trying.
Athletes should consume a diet with adequate amount of fat on a regular basis. If
the amount of fat is too high or too low in the diet, it can hinder athletic performance. Fat
intake should be 20%-35% of total calories. Fat is important in the diet because it
provides a source of fat-soluble vitamins, essential fatty acids, and is a good source of
energy (Rodriguez et al., 2009). Foods that contain fat should be chosen in moderation
with more healthy fats rather than the unhealthy fats. Healthier fats contain
monounsaturated fatty acids and polyunsaturated fatty acids.
Micronutrients and Athletic Performance
Calcium.
Calcium is an important mineral for athletes to have in their diet. Calcium helps
promote bone health, maintenance of calcium blood levels, regulate muscle contraction,
13
nerve conduction, and normal blood clotting (Rodriguez et al., 2009). If an athlete is
deficient in calcium, they are at a higher risk of suffering from bone fractures and/or low
bone-mineral density. If an athlete’s diet does not show sources of calcium,
supplementation of 1500 mg daily may be recommended. Because of major health
concerns for calcium supplements, it is encouraged that dietary sources of calcium are
consumed (Maughan, 1999). Adequate amount of calcium in the diet is important when
discussing diet quality as calcium ensures bone health.
Iron.
Iron is used to aid in blood cell formation and enzymes involved in energy
production. Red blood cells (which carry oxygen around the body) are particularly
essential for endurance athletes (Rodriguez et al., 2009). This helps promote oxygen flow
through the body, nervous system function, behavioral system, and immune system. Iron
requirements for endurance athletes (distance runners) are increased by approximately
70%. The Recommended Dietary Allowances for all other athletes are: women 18mg and
men 8mg. Adequate amount of iron can be used to enhance athletic performance by
lengthen the duration of physical activity by providing more oxygen through the body.
With low iron levels, red blood cells are not capable of carrying the amount of oxygen
throughout the body that is demanded during physical activity.
Vitamin C.
The recommendation for vitamin C intake for males is 90mg per day and 75mg
per day for females. If the diet is adequate in vitamin C containing food, then
supplementation is not necessary. There has not been a proven effect of vitamin C as an
ergogenic aid for athletes (Rodriguez et al., 2009). For an athlete who does not consume

14
adequate amounts of vitamin C, athletic performance may be hindered from oxidative
stress on the muscles and other cells leading to lipid peroxidation.
Sodium.
Sodium is a crucial electrolyte and mineral that is required by every person,
especially athletes. Athletes with high sweat rates (endurance athletes) and those who are
in certain environmental areas can require a higher amount. The Tolerable Upper Intake
Level is 2.3g/day (Rodriguez et al., 2009). However, most athletes reach this level
without supplementation. Sodium is found naturally in many food items, added to many
foods for preservatives and flavor and in sport beverages. According to research,
beverages that contain electrolytes (specifically sodium and potassium) can help maintain
fluid balance and can benefit performance (Rodriguez et al., 2009). These electrolytes
and fluids help with sweat replacement when nutrients and fluids are lost. Muscle cramps
and muscle fatigue are often associated with hyponatremia. Sodium also helps retain
fluids. An athlete with too much fluid retention can be damaging to the joints.
Fiber.
Though there is no research for specific fiber needs for athletes, it is important to
consider the fiber requirements for this age group. Collegiate athletes typically range
from ages 18-23 years old. The recommended intake for dietary fiber for this age group is
25 grams for females and 38 grams for males (“Position of the American Dietetic
Association: Health Implications of Dietary Fiber,” 2008). Dietary fiber has been shown
to provide many health benefits throughout the lifecycle. Adequate dietary intake can
benefit many different body systems throughout life. Some of these are: aiding in
cardiovascular health, gastrointestinal function and the immune system as well as

15
preventing stroke, type 2 diabetes mellitus, and obesity, (Anderson, Baird, Davis, Ferreri,
Knudtson, Koraym, & Williams, 2009). Fiber can be helpful for constipation and diarrhea
(“Position of the American Dietetic Association: Health Implications of Dietary Fiber,”
2008). It is important for an athlete to have regular bowel movements during performance
times because it will help keep the athlete comfortable during athletic performance.
In review, literature states that the Healthy Eating Index 2005 accurately evaluates
diet quality (Guenther, Reedy, Krebs-Smith, & Reeve, 2008). Using the information
gathered from the Block 2005 Food Frequency Questionnaire as well as the Healthy
Eating Index 2005 jointly, one can accurately assess the diet and its quality in the selected
participants. Athletes gain nutrition knowledge from a variety of sources, some of which
are not reliable. Registered dietitians may significantly help improve athletic performance
by offering accurate education about macronutrients and micronutrients, and how vital
these are throughout the body. Athletes that apply this education to their everyday
lifestyle might see a significant improvement in their performance.

16
CHAPTER THREE: Methodology
Study Design
This was a cross-sectional study and data were collected between September 2010
and January 2012 on collegiate athletes who volunteered for this study. The study
received approval from IRB prior to the start of this study. All data were taken from the
first measurement of an individual athlete which had more than one assessment during
that time period. The athletes’ height and weight were measured and his/her body
composition was determined using the BodPod®. The BodPod® is a tool to measure
body composition using air displacement plethysmography. The athlete’s demographics
were also collected by questionnaire at this initial meeting. The athletes were asked to
complete a Block 2005 Food Frequency Questionnaire to be used to evaluate their diet.
The diet quality score was calculated using the Block 2005 Food Frequency
Questionnaire© and the Healthy Eating Index 2005.
Participants
There were a total of 138 participating collegiate athletes in this study. There were
both male and female participants for the study. There were 15 African American
participants. All participants were 18 years of age and over and were on the active roster
for a collegiate sports team.
Food Frequency Questionnaire
The Block 2005 Food Frequency Questionnaire© was used to assess the athletes’
diets. The questionnaire contains questions on over 100 foods and includes portion size
and frequency of consumption. The scale for frequency was: never, a few times a year,
once per month, 2-3 times per month, once per week, 2 times per week, 3-4 times per

17
week, 5-6 times per week, and every day. The questionnaire was analyzed by the
Nutrition Quest Company and results were returned to the research team. SPSS statistical
analysis software was used to analyze the data.
The Healthy Eating Index 2005 Point System
The results of the food frequency questionnaire were used to determine the diet
quality of the athletes. The Healthy Eating Index (HEI) 2005 was used as the
measurement of diet quality. This measure of diet quality assesses diet quality that
conforms to federal dietary guidance and recommendations. The components on the HEI
2005 index and the scoring standards are shown in Appendix I (Guenther, Krebs-Smith,
Reedy, Britten, Juan, Lino, Carlson, Hiza & Basiotis, 2005). These standards are
expressed per 1,000 calories.
The scores for each of the twelve components of the HEI-2005 were determined
by the maximum and minimum standard score represented as on a designated point
system. Ten components were expressed on a “per 1,000 Calorie” basis. Two
components were based on a “percentage of energy” score. These points were added
together to determine the overall diet quality score based on these twelve components.
Scores for each of the 12 categories were calculated as follows:
First, the total Calories consumed by each participant were divided by 1000. This
variable will be called “calorie factor” throughout the remaining equations.
For the total fruit (that includes 100% juice) calculation, the total fruit in cups was
divided by “calorie factor” to give the number of cups of fruit consumed per 1000
Calories. This amount of fruit was then translated into points on a scale of 0-5 per the

18
scoring system of the HEI 2005. Any amount ≥ 0.8 cup equivalents per 1000 Calories
was given a score of 5. Consumption of 0.4 cup equivalents was given a score of 2.5.
Table 3.1 HEI Point Distribution for Total Fruits
Points 5.0 4.5 4.0 3.5 3.0 2.5 2.0 1.5 1.0 0.5 0.0
Amount
Consumed
(cups)
≥0.80 0.72 0.64 0.56 0.48 0.40 0.32 0.24 0.16 0.08 0.00
To calculate whole fruit (excluding juice), the total solid fruit in cups was divided
by “calorie factor” to give the number of cups of whole fruit consumed per 1000
Calories. The amount of solid fruit was then translated into points on a scale of 0-5 per
the scoring system of the HEI 2005. Any amount ≥ 0.4 cup equivalents per 1000
Calories was given a score of 5. Consumption of 0.2 cups equivalent received a score of
2.5 points.
Table 3.2 HEI Point Distribution for Whole Fruits
Points 5.0 4.5 4.0 3.5 3.0 2.5 2.0 1.5 1.0 0.5 0.0
Amount
Consumed
(cups)
≥0.40 0.36 0.32 0.28 0.24 0.20 0.16 0.12 0.08 0.04 0.00
For the calculation for total vegetables, the total vegetables in cups was divided
by “calorie factor” to give the number of cups of vegetables consumed per 1000 Calories.
The amount of vegetables consumed was then translated into points on a scale of 0-5 per

19
the scoring system of the HEI 2005. Any amount ≥ 1.1 cup equivalents per 1000
Calories was given a score of 5. Consumption of 0.55 cups equivalents received a point
of 2.5.
Table 3.3 HEI Point Distribution for Total Vegetables
Points 5.0 4.5 4.0 3.5 3.0 2.5 2.0 1.5 1.0 0.5 0.0
Amount
Consumed
(cups)
≥1.1 0.99 0.88 0.77 0.66 0.55 0.44 0.33 0.22 0.11 0.00
The total of dark green and orange vegetables, as well as legumes, was calculated
as the sum total of the three variables that was reported in cups and was then divided by
“calorie factor”. The amount of cups from the sum of these variables was translated into
points on a scaled of 0-5 points per the scoring system of HEI 2005. Any amount above
0.40 cup equivalent per 1,000 Calories received a score of 5.0. Consumption of 0.2 cups
received 2.5 points.
Table 3.4 HEI Point Distribution for Dark Green and Orange Vegetables, and
Legumes
Points 5.0 4.5 4.0 3.5 3.0 2.5 2.0 1.5 1.0 0.5 0.0
Amount
Consumed
(cups)
≥0.40 0.36 0.32 0.28 0.24 0.20 0.16 0.12 0.08 0.04 0.00

20
Total grains were calculated by the total amount of grains reported in ounces
divided by “calorie factor”. The amount of total grains consumed was translated in a
points scale from 0-5 points per the scoring system of HEI 2005. Any amount that was
greater than 3.0 ounces equivalent per 1,000 Calories received a score of
5.0.Consumption of 1.5 ounces received 2.5 points.
Table 3.5 HEI Point Distribution for Total Grains
Points 5.0 4.5 4.0 3.5 3.0 2.5 2.0 1.5 1.0 0.5 0.0
Amount
Consumed
(ounces)
≥3.0 2.70 2.40 2.10 1.80 1.50 1.20 0.90 0.60 0.30 0.00
Whole grains were calculated using the number of whole grains reported in
ounces divided by “calorie factor” to get whole grains in ounces. Whole grains score was
based on a 0-5 point scaled that was determined by the scoring system by HEI 2005. Any
ounces equivalent greater than 1.5 per 1,000 Calories received a score of 5.0. Points of
2.5 were given if consumption of 0.75 ounces were given 2.5 points.
Table 3.6 HEI Point Distribution for Whole Grains
Points 5.0 4.5 4.0 3.5 3.0 2.5 2.0 1.5 1.0 0.5 0.0
Amount
Consumed
(ounces)
≥1.5 1.35 1.20 1.05 0.90 0.75 0.60 0.45 0.30 0.15 0.00
21
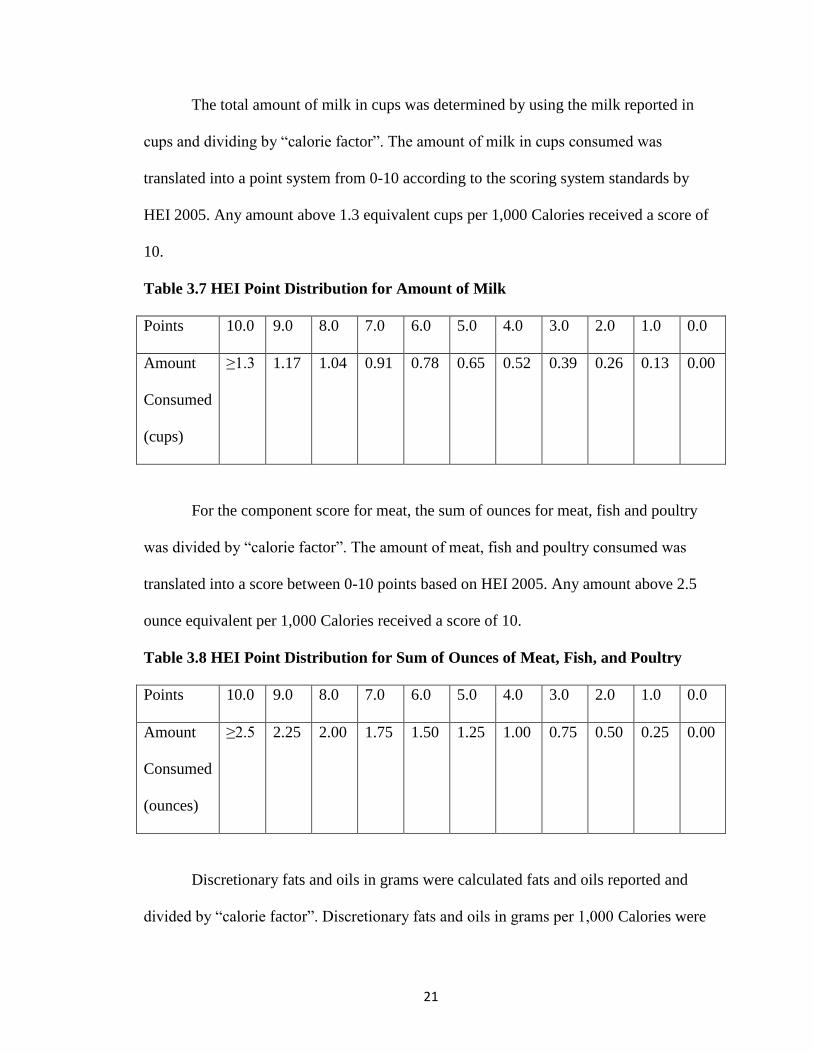
The total amount of milk in cups was determined by using the milk reported in
cups and dividing by “calorie factor”. The amount of milk in cups consumed was
translated into a point system from 0-10 according to the scoring system standards by
HEI 2005. Any amount above 1.3 equivalent cups per 1,000 Calories received a score of
10.
Table 3.7 HEI Point Distribution for Amount of Milk
Points 10.0 9.0 8.0 7.0 6.0 5.0 4.0 3.0 2.0 1.0 0.0
Amount
Consumed
(cups)
≥1.3 1.17 1.04 0.91 0.78 0.65 0.52 0.39 0.26 0.13 0.00
For the component score for meat, the sum of ounces for meat, fish and poultry
was divided by “calorie factor”. The amount of meat, fish and poultry consumed was
translated into a score between 0-10 points based on HEI 2005. Any amount above 2.5
ounce equivalent per 1,000 Calories received a score of 10.
Table 3.8 HEI Point Distribution for Sum of Ounces of Meat, Fish, and Poultry
Points 10.0 9.0 8.0 7.0 6.0 5.0 4.0 3.0 2.0 1.0 0.0
Amount
Consumed
(ounces)
≥2.5 2.25 2.00 1.75 1.50 1.25 1.00 0.75 0.50 0.25 0.00
Discretionary fats and oils in grams were calculated fats and oils reported and
divided by “calorie factor”. Discretionary fats and oils in grams per 1,000 Calories were

22
translated in a 0-10 point system per the HEI 2005 standards. Any score greater than 12
grams received a score of 10.
Table 3.9 HEI Point Distribution for Discretionary Fats and Oils
Points 10.0 9.0 8.0 7.0 6.0 5.0 4.0 3.0 2.0 1.0 0.0
Amount
Consumed
(grams)
≥12.00 10.80 9.60 8.40 7.20 6.00 4.80 3.60 2.40 1.20 0.00
Sodium was calculated by taking sodium in grams and divide by “calorie factor”.
The sodium score was determined by HEI 2005 standards and was on a scale from 0-10
points. Any amount above 0.7 grams per 1,000 Calories received a score of 10.
Table 3.10 HEI Point Distribution for Sodium
Points 10.0 9.0 8.0 7.0 6.0 5.0 4.0 3.0 2.0 1.0 0.0
Amount
Consumed
(grams)
≥0.7 0.63 0.56 0.49 0.42 0.35 0.28 0.21 0.14 0.07 0.00
Saturated fats were calculated by the total saturated fat grams consumed
multiplied by 9 Calories per gram, and then the Calories from saturated fats was divided
by the total number of Calories consumed. The amount of saturated fats that was
consumed was translated to a 0-10 point system according to HEI 2005 standards. Any
score less than 7% per 100 Calories received a score of 10.

23
Table 3.11 HEI Point Distribution for Saturated Fats
Points 10.0 9.0 8.0 7.0 6.0 5.0 4.0 3.0 2.0 1.0 0.0
Amount
Consumed
(% of
energy)
≤7% 7.80 8.60 9.40 10.2 11.00 11.80 12.6 13.4 14.2 ≥15.0
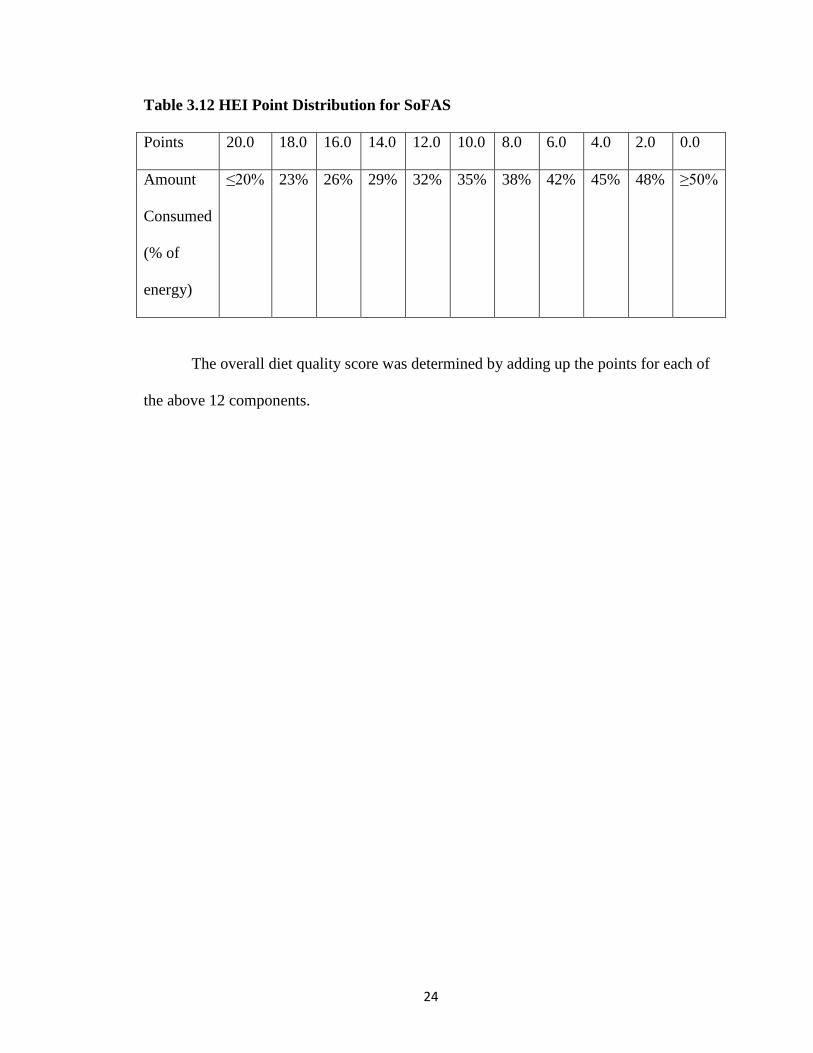
To calculate the total calories from solid fat, alcohol, and added sugar (SoFAS),
the researchers used discretionary fat in grams that was consumed and multiplied that
amount by 9 Calories fat to get Calories of fat. The percentage of Calories that came from
alcohol was multiplied by total Calorie intake. This indicated the total Calories of
alcohol. Added sugars, in teaspoon equivalents, were multiplied by 16 Calories per
teaspoon of sugar to get Calories of sugar. All three, Calories of sugar, Calories of
alcohol, and Calories of fat are added together to get the total number of SoFAS that is
then divided by the total Calories overall to get the percentage of energy. The percentage
of SoFAS consumed per 1,000 Calories was translated into a point system based on 1,000
Calories. This point system was a 0-20 point system determined by the HEI 2005
standards. Any score less than 20%, received a score of 20.
24
Table 3.12 HEI Point Distribution for SoFAS
Points 20.0 18.0 16.0 14.0 12.0 10.0 8.0 6.0 4.0 2.0 0.0
Amount
Consumed
(% of
energy)
≤20% 23% 26% 29% 32% 35% 38% 42% 45% 48% ≥50%
The overall diet quality score was determined by adding up the points for each of
the above 12 components.

25
CHAPTER FOUR: Results
There were a total of 138 participants in the study. There were 48 male and 90
female athletes participating in the study. The average age of all the participants was 19.4
years old. Of the total participants, 10.9% were African American. There were five sports
represented in this study: swim/dive, soccer, basketball, volleyball, and gymnastics.
There were five different academic class levels represented in this study. Those in their
first year of school made up 42.8% of the study. Out of all the participants, 28.3% were
in their second year of school and 18.8% were in their third year of school. Participants in
their fourth year of school were 9.4% and in the fifth year was 0.7%.
The mean body mass index for all of the participants was 23.2 (2.3) kg/m2. The
male participants had a mean body mass index of 23.6 (2.4) kg/m2. The female had a
mean body mass index of 22.9 (2.2) kg/m2 (P=0.07). All of the participants had an
average body fat of 17.8 (6.5%). The male participants had a body fat of 11.1(3.9%),
females were 24.1 (4.5%) (P<0.001). All of the participants had an average total Calories
of 2476.2 (SD 1742.9). The female participants’ mean of total Calories was 1866.9 (SD
976.8). The mean of total Calories for the male participants was 3615.8 (SD 2238.4;
P<0.001).
The average HEI score overall for all of the participants was 51.2 (SD: 8.8). The
male average HEI score was 47.7 (SD: 7.9). The overall HEI score for females was 53.1
(SD: 8.6) (p<0.001). All of the participants consumed 1.7 (SD: 1.2) cups of fruit on
average. The average amount of fruit consumed by the male participants was 1.8 (SD:
1.1) cups. The female participants consumed an average of 1.6 (SD: 1.2) cups of fruit
(P=0.40). The amount of vegetables that was consumed by all the participants was 2.4

26
(SD: 1.2) cups. The males consumed 3.1 (SD: 2.4) cups and the females consumed 2.0
(SD: 1.6) cups total vegetables (P=0.003). The dietary fiber averaged 20.5 (SD: 14.2)
grams. The females consumed 16.9 (SD: 9.8) grams and the males consumed 27.3 (SD:
18.4; P<0.001). The Calories from solid fats, alcoholic beverages, and added sugars
(SoFAS) that were consumed by the group as a whole was 1231.3 (SD: 907) Calories.
The Calories from SoFAS that were consumed by males were an average of 1844.6 (SD:
1174.1). The females had 900.6 (SD: 468.2) of SoFAS that contributed to their Calorie
intake(P<0.001).
Sodium consumption for all the participants was 3893.7 (SD: 3001.1) milligrams.
The male participants consumed 5803.2 (SD: 3996.5) milligrams. The females had an
average consumption of sodium of 2875.3 (SD: 1553.6) milligrams (P<0.001).
There is a negative correlation between diet score and percent body fat (r= -0.481;
P<0.001). as no correlation between BMI and diet score, r=0.031; P=0.722.
Figure 4.1 Male and Female Recommendations compared to Intake of Fruits and
Vegetables

27
Figures 4.2 Male and Female Recommendations compared to Intake of Sodium and
Calcium
Figures 4.3 Male and Female Recommendations compared to Intake of Fiber
28
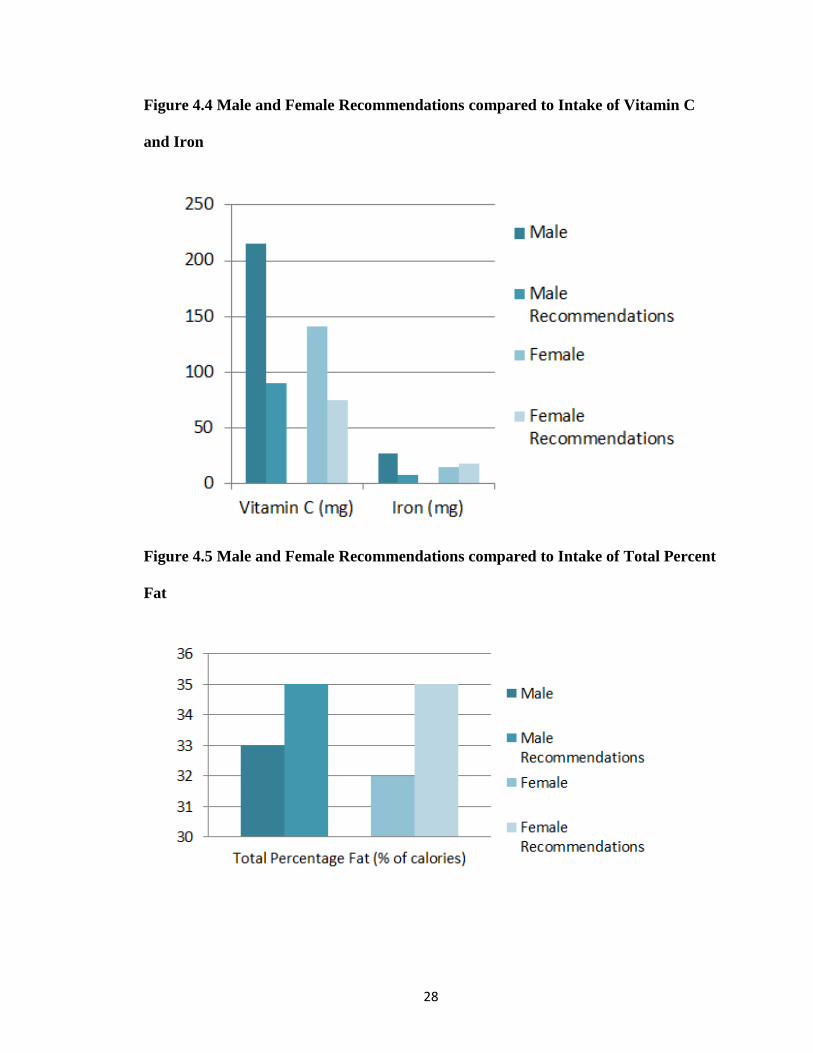
Figure 4.4 Male and Female Recommendations compared to Intake of Vitamin C
and Iron
Figure 4.5 Male and Female Recommendations compared to Intake of Total Percent
Fat

29
CHAPTER FIVE: Discussion
The purpose of this study was to assess and compare the diet quality between
male and female collegiate athletes in the sample. These results were compared to diet
recommendations for the age and gender of these athletes. The average age of these
participants were 19.4 (± 1.2) years. Out of all the participants, 65% were female athletes.
The average diet quality score was 51 (SD: 8.75). Based on these findings, athletes do not
have a high diet quality score.
Athletes’ knowledge concerning nutrition and their diets, generally, do not come
from a registered dietitian, however, they receive basic knowledge from various positions
surrounding athletics. This research demonstrates that athletes could benefit from
additional education from dietitians. Dietitians can offer more accurate information as
well as being more individualized for the athlete and specific sport. With continuous
education on nutrition, athletes may be more accepting to the changes needed in their diet
to affect their athletic performance.
Based on these findings from this study, there are some nutrients that athletes are
consuming in excess, others are consumed in adequate amounts, and still others are
deficient in the athletes’ diets. These variations in consumption may affect the overall
performance for an athlete. Iron was found to be an excess in males but deficient in
females. This could be related to the higher consumption of meat products in male
athletes. Both male and female athletes consumed an excess of sodium. This could be a
result of the types of foods consumed as well as sport beverages which are often high in
sodium. Based on the recommended intake for both calcium and vitamin C, both males
and females receive an excess of these nutrients. Calcium consumption can be associated
30
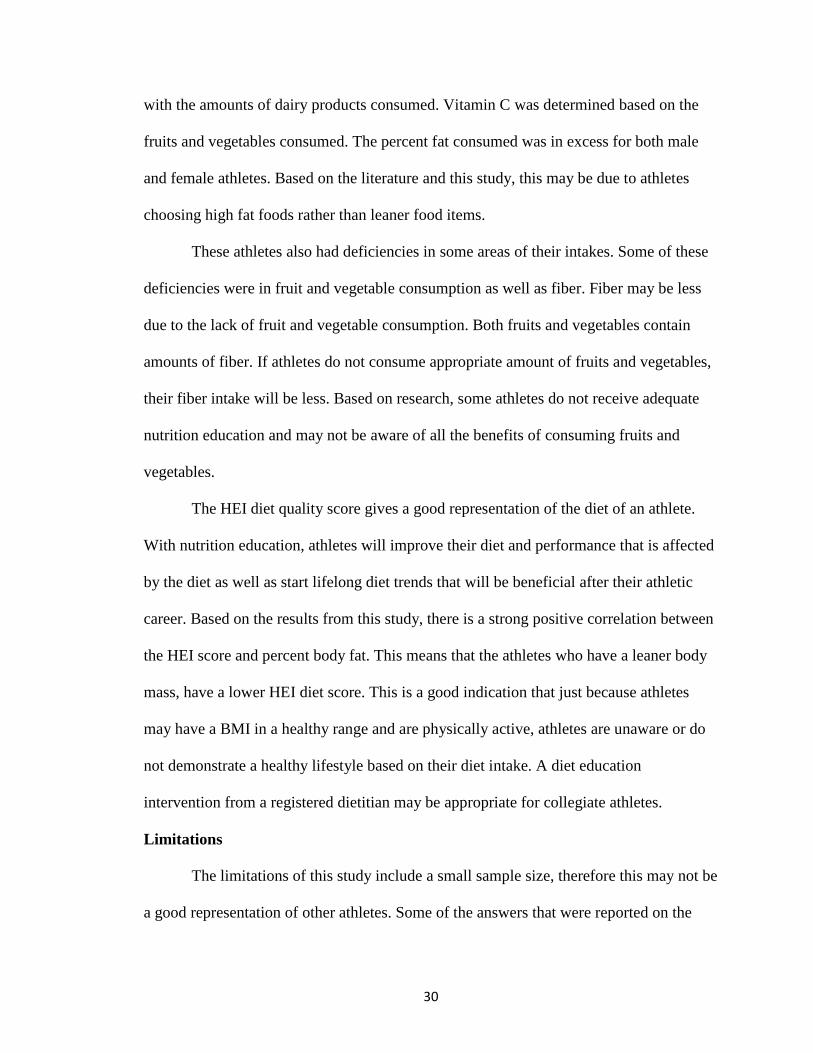
with the amounts of dairy products consumed. Vitamin C was determined based on the
fruits and vegetables consumed. The percent fat consumed was in excess for both male
and female athletes. Based on the literature and this study, this may be due to athletes
choosing high fat foods rather than leaner food items.
These athletes also had deficiencies in some areas of their intakes. Some of these
deficiencies were in fruit and vegetable consumption as well as fiber. Fiber may be less
due to the lack of fruit and vegetable consumption. Both fruits and vegetables contain
amounts of fiber. If athletes do not consume appropriate amount of fruits and vegetables,
their fiber intake will be less. Based on research, some athletes do not receive adequate
nutrition education and may not be aware of all the benefits of consuming fruits and
vegetables.
The HEI diet quality score gives a good representation of the diet of an athlete.
With nutrition education, athletes will improve their diet and performance that is affected
by the diet as well as start lifelong diet trends that will be beneficial after their athletic
career. Based on the results from this study, there is a strong positive correlation between
the HEI score and percent body fat. This means that the athletes who have a leaner body
mass, have a lower HEI diet score. This is a good indication that just because athletes
may have a BMI in a healthy range and are physically active, athletes are unaware or do
not demonstrate a healthy lifestyle based on their diet intake. A diet education
intervention from a registered dietitian may be appropriate for collegiate athletes.
Limitations
The limitations of this study include a small sample size, therefore this may not be
a good representation of other athletes. Some of the answers that were reported on the
31
food frequency questionnaire may not be completely accurate for some of the individuals
of the study. Another limitation is that the researchers did not assess if athletes were
currently in or out of season; this could influence some of their dietary choices depending
on their current physical activity state. The research also did not attempt to assess current
levels of physical activity. The results for the specific nutrient intakes was based on entire
diet reports from the FFQ, however, HEI score was based on a “per 1,000 Calories”
score.

32
CHAPTER SIX: Conclusion
Based on this study and the related research to this study, it is clear that though
athletes appear to be very healthy, they may not know how to choose appropriate food
items. A dietary intervention is appropriate for athletes to help them achieve their highest
athletic ability and may improve their overall performance. It will be most beneficial for
athletes to receive this nutrition information from registered dietitians because this is the
area in which they are educated and can give the most accurate information to these
athletes.

33
APPENDECES
Appendix I: Healthy Eating Index 2005
Component Maximum Points Standard for
Maximum Score
Standard for
minimum score of
zero
Total Fruit (includes
100% juice)
5 ≥0.8 cups equiv. per
1,000 Calorie
No Fruit
Whole Fruit (not
juice)
5 ≥0.4 cups equiv. per
1,000 Calorie
No Whole Fruit
Total Vegetables 5 ≥1.1 cups equiv. per
1,000 Calorie
No Vegetables
Dark Green and
Orange Vegetables
and Legumes
5 ≥0.4 cups equiv. per
1,000 Calorie
No Dark Green or
Orange Vegetables
or Legumes
Total Grains 5 ≥3.0 cups equiv. per
1,000 Calorie
No Grains
Whole Grains 5 ≥1.5 cups equiv. per
1,000 Calorie
No Whole Grains
Milk 10 ≥1.3 cups equiv. per
1,000 Calorie
No Milk
Meat and beans 10 ≥2.5oz equiv. per
1,000 Calorie
No Meat or Beans
Oils 10 ≥12 grams equiv.
per 1,000 Calorie
No Oil
Saturated Fat 10 ≤7% of energy ≥15% of energy
Sodium 10 ≥0.7 grams equiv.
per 1,000Calorie
≥2.0 grams of 1,000
Calorie
Calories from Solid
Fats, Alcoholic
beverages, and
added sugars
(SoFAS)
20 ≤20% of energy ≥50% of energy

34
Appendix II: Definition of Terms
1. Diet Quality: is the food choices that are made on a regular basis. An example of
food items are: whole grains, lean meats, fresh fruits and vegetables and low-fat
milk consumption.
2. Collegiate Athletes: People who perform in sports during their college career
3. Healthy Eating Index 2005: a point system that was developed to determine a
diet’s quality that evaluates twelve different components based on the federal
guidelines
4. Block 2005 Food Frequency Questionnaire©: a questionnaire that evaluates
different food groups and physical activity
5. Nutrition Knowledge: the amount of information from education and experiences
about nutrition that one knows

35
BIBLIOGRAPHY
Assessment and analysis services: Questionnaires and screeners. (2013). Retrieved from
http://www.nutritionquest.com/assessment/list-of-questionnaires-and-screeners/
Bonci, L. J. (2011). Eating for performance: bringing science to the training table. Clinics
in sports medicine, 30(3), 661.
Diet quality and nutrition. (2013). Retrieved from http://www.ers.usda.gov/topics/food-
choices-health/diet-quality-nutrition.aspx
Fields, D., Hunter, G., & Goran, M. (2000). Validation of the BOD POD with hydrostatic
weighing: influence of body clothing. International journal of obesity and related
metabolic disorders: journal of the International Association for the Study of
Obesity, 24(2), 200.
Franko, D. L., Cousineau, T. M., Trant, M., Green, T. C., Rancourt, D., Thompson, D., . .
. Ciccazzo, M. (2008). Motivation, self-efficacy, physical activity and nutrition in
college students: Randomized controlled trial of an internet-based education
program. Preventive medicine, 47(4), 369-377.
Guenther, P. M., Krebs-Smith, S. M., Reedy, J., Britten, P., Juan, W. Y., Lino, M.,
Carlson, A., & Basiotis, P. P. (2005). Healthy eating index-2005. Retrieved from
website:
http://www.cnpp.usda.gov/Publications/HEI/healthyeatingindex2005factsheet.pdf
Guenther, P. M., Reedy, J., & Krebs-Smith, S. M. (2008). Development of the Healthy
Eating Index-2005. Journal of the American Dietetic Association, 108(11), 1896.

36
Hoogenboom, B. J., Morris, J., Morris, C., & Schaefer, K. (2009). Nutrition Knowledge
And Eating Behaviors Of Female, Collegiate Swimmers North American Journal
of Sports Physical Therapy 4(3), 139-148.
Long, D., Perry, C., Unruh, S. A., Lewis, N., & Stanek-Krogstrand, K. (2011). Personal
food systems of male collegiate football players: a grounded theory investigation.
Journal of Athletic Training, 47(1), 688-695.
Maughan, R. J. (1999). Role of micronutrients in sport and physical activity. British
medical bulletin, 55(3), 683-690.
Phillips, S.M. (2012). Dietary protein requirements and adaptive advantages in athletes
British Journal of Nutrition, 108, S158.
Position of the American Dietetic Association: Health Implications of Dietary Fiber.
(2008). Journal of the American Dietetics Association, 108(10), 1716-1731. doi:
http://dx.doi.org/10.1016/j.jada.2008.08.007
Rodriguez, N.R. DiMarco, N.M., & Langley, S. (2009). Position of the American
dietetics association, dietitians of Canada, and the American college of sports
medicine: nutrition and athletic performance. Journal of the American Dietetic
Association, 109(3), 509-527.
Rosenbloom, C. A., Jonnalagadda, S. S., & Skinner, R. (2002). Nutrition knowledge of
collegiate athletes in a Division I National Collegiate Athletic Association
Institution. Journal of the American Dietetic Association, 102(3), 418-420.
37
Shriver, L.H., Betts, N.M., & Wollenberg G. (2012). Dietary Intakes and Eating Habits of
College Athletes: Are Female College Athletes Following the Current Sports
Nutrition Standards? Journal of American College Health, 61(1), 10-16. doi:
10.1080/07448481.2012.747536
Torres-McGehee, T. M., Pritchett, K. L., Zippel, D., Minton, D. M., Cellamare, A., &
Sibilia, M. (2012). Sports Nutrition Knowledge Among Collegiate Athletes,
Coaches, Athletic Trainers, and Strength and Conditioning Specialists. Journal of
Athletic Training, 47(2), 205-211.

38
VITA
Amanda Nicole Ireland from LaGrange, Kentucky received her Bachelor of Science
degree from Western Kentucky University in 2010. Her major was Hospitality
Management and Dietetics. Scholastic honors received were Dean’s List (2007);
President’s List (2008), Outstanding Academic Achievement (2008). Amanda was a
member of Phi Upsilon Omicron Honor Society. Profession positions that were held were
Dietetic Intern, Teaching and Research Assistant. Amanda was the recipient of the Alda
Henning Scholarship in the 2011-2012. Amanda has had the opportunity to present a
research poster at the International Sport and Society Conference in 2013.