Outsiders and Regional Trade Agreements among Small...
33
P OLICY R ESEARCH W ORKING P APER Outsiders and Regional Trade Agreements among Small Countries The Case of Regional Markets Anju Gupta Maurice Schiff The World Bank Development Research Group November 1997 1847 Regional trade agreements among small countries may have negative welfare implications for nearby countries excluded from the agreement — but they sometimes benefit from being excluded.
Transcript of Outsiders and Regional Trade Agreements among Small...

POLICY RESEARCH WORKING PAPER
Outsiders and RegionalTrade Agreements amongSmall Countries
The Case of Regional Markets
Anju GuptaMaurice Schiff
The World BankDevelopment Research GroupNovember 1997
1847
Regional trade agreements
among small countries may
have negative welfare
implications for nearby
countries excluded from the
agreement — but they
sometimes benefit from being
excluded.

POLICY RESEARCH WORKING PAPER 1847
Summary findings
Standard theory says that a country's welfare isunaffected by being excluded from a small regional tradeagreement. But for most products "small" countries andregional trade agreements do have some measure ofmarket power. Such market power can arise if
� Supply is geographically concentrated.� Tastes differ.� There is product differentiation (such as quality).� Transport costs are high.� The principal importing countries impose
quantitative restrictions.� There is hysterisis because of irreversible costs.Gupta and Schiff show, based on two case studies, that
regional trade agreements among small countries mayhave negative welfare implications for outside countries.In the first case, they find that Argentina's cattle and beefexports to Peru fell when Peru formed a regional tradeagreement (the Andean Pact) with various countries,including Colombia, an exporter of the same products.Argentina also lost because of the higher unit price itreceived on its exports to Peru. Interestingly, Venezuela's
entry into the Andean Pact (that is, the formation of alarger bloc) seems to have resulted in a welfare gain for theoutside country (Argentina)
In the second case, rather than examine whetherformation of the Central American Common Market(CACM) had a negative impact on outside countries (forwhich they lacked data), they examine the impact of theCACM's breakdown on member countries. Although theCACM has essentially been trade-diverting formanufactures, it seems to have been trade-creating forwhite maize, with both importing and exporting membercountries gaining from the regional trade agreement. So,one would expect that a breakdown of the CACM,which resulted in member countries becoming relativelymore "outsiders" to the bloc, may have led to a declinein the welfare of both the exporting and importingmember countries. This is supported by the data, andimplies that if one of the five member countries had beenleft out of the CACM, it would have been worse offwhere white maize was concerned.
This paper � a product of the Development Research Group � is part of background work for the group�s program onregionalism and development. Copies of this paper are available free from the World Bank, 1818 H Street NW, Washington,DC 20433. Please contact Jennifer Ngaine, room N5-056, telephone 202-473-7947, fax 202-522-1159, Internet [email protected]. November 1997. (27 pages)
The Policy Working Paper Series disseminates the findings of work in progress to encourage the exchange of ideas aboutdevelopment issues. An objective of the series is to get the findings out quickly, even if the presentations are less than fully polished.The papers carry the names of the authors and should be cited accordingly. The findings, interpretations, and conclusions expressedin this paper are entirely those of the authors. They do not necessarily represent the view of the World Bank, its Executive Directors,or the countries they represent.
Produced by the Policy Research Dissemination Center

Foreword
As regional trading arrangements (RTAs) have spread, enlarged and deepened over the lastdecade, they have posed challenges to economists on both intellectual and policy levels. On theformer, do RTAs stimulate growth and investment, facilitate technology transfer, shift comparativeadvantage towards high value-added activities, provide credibility to reform programs, or inducepolitical stability and cooperation? Or do they, on the other hand, divert trade in inefficientdirections and undermine the multilateral trading system?
The answer is probably “all of these things, in different proportions according to theparticular circumstances of each RTA.” This then poses the policy challenge of how best tomanage RTAs in order to get the best balance of benefits and costs. For example, should technicalstandards be harmonized and, if so, how; do direct or indirect taxes need to be equalized; howshould RTAs manage their international trade policies in an outward-looking fashion?
Addressing these issues is one important focus of the international trade research programof the Development Research Group of the World Bank. It has produced a number ofmethodological innovations in the traditional area of trade effects of RTAs and tackled four newareas of research: the dynamics of regionalism (e.g., convergence, growth, investment, industriallocation and migration), deep integration (standards, tax harmonization), regionalism and the rest ofthe world (including its effects on the multilateral trading system), and certain political economydimensions of regionalism (e.g., credibility and the use of RTAs as tools of diplomacy).
In addition to thematic work, the program includes a number of studies of specific regionalarrangements, conducted in collaboration with the Regional Vice Presidencies of the Bank. SeveralEU-Mediterranean Association Agreements have been studied and a joint program with the staff ofthe Latin American and Caribbean Region entitled “Making the Most of Mercosur” is under way.Future work is planned on African and Asian regional integration schemes.
Regionalism and Development findings have been and will, in future, be released in anumber of outlets. Recent World Bank Policy Research Working Papers concerning these issuesinclude:
Glenn Harrison, Tom Rutherford and David Tarr, “Economic Implications for Turkeyof a Customs Union with the European Union,” (WPS 1599, May 1996).
Maurice Schiff, “Small is Beautiful, Preferential Trade Agreements and the Impact ofCountry Size, Market Share, Efficiency and Trade Policy,” (WPS 1668, October 1996).
L. Alan Winters, “Regionalism versus Multilateralism,” (WPS 1687, November 1996).
Magnus Blomström and Ari Kokko, “How Foreign Investment Affects Host Countries”(WPS1745, March 1997)

ii
Magnus Blomström and Ari Kokko, “Regional Integration and Foreign DirectInvestment: A Conceptual Framework and Three Cases” (WPS1750, April 1997)
Eric Bond, “Using Tariff Indices to Evaluate Preferential Trading Arrangements: AnApplication to Chile” (WPS1751, April 1997)
Pier Carlo Padoan, “Technology Accumulation and Diffusion: Is There a RegionalDimension?” (WPS1781, June 1997)
Won Chang and L. Alan Winters, “Regional Integration and the Prices of Imports: AnEmpirical Investigation” (WPS1782, June 1997)
Glenn Harrison, Thomas Rutherford and David Tarr, “Trade Policy Options for Chile:A Quantitative Evaluation” (WPS1783, June 1997)
Anthony Venables and Diego Puga, “Trading Arrangements and IndustrialDevelopment” (WPS1787, June 1997)
Maurice Schiff and L. Alan Winters, “Regional Integration as Diplomacy”(WPS1801, August 1997)
Raquel Fernández, “Returns to Regionalism: An Evaluation of Nontraditional Gainsfrom Regional Trade Agreements” (WPS1816, August 1997)
Planned future issues in this series include:
Sherry Stephenson, “Standards, Conformity Assessments and Developing Countries”
Valeria De Bonis, “Regional Integration and Factor Income Taxation” and “RegionalIntegration and Commodity Tax Harmonization
Eric W. Bond, “Transportation Infrastructure Investment and Regional TradeLiberalization
Other papers on regionalism produced by DECRG include:
Ahmed Galal and Bernard Hoekman (eds), Regional Partners in Global Markets: Limitsand Possibilities of the Euro-Med Initiative. CEPR 1997.
Bernard Hoekman and Simeon Djankov, “Imports of Inputs, Foreign Investment andReorientation of East European Trade,” World Bank Economic Review (forthcoming)
Bernard Hoekman and Simeon Djankov, “The EU’s Mediterranean Free Trade Initiative,”World Economy
iii
Bernard Hoekman and Simeon Djankov, “Effective Protection in Jordan and Egypt in theTransition to Free Trade with Europe,” World Development.
Bartlomiej Kaminski, “Establishing Economic Foundations for a Viable State of Bosnia andHercegovina: Issues and Policies”.
In addition, Making the Most of Mercosur issued the following papers:
Alexander J. Yeats, “Does Mercosur’s Trade Performance Raise Concerns About theEffects of Regional Trade Arrangements?” (WPS1729, February 1997))
Azita Amjadi and L. Alan Winters, “Transport Costs and ‘Natural’ Integration inMercosur” (WPS1742, March 1997)
Claudio Frischtak, Danny M. Leipziger and John F. Normand, “Industrial Policy inMercosur: Issues and Lessons”
Sam Laird (WTO), “Mercosur Trade Policy: Towards Greater Integration”
Margaret Miller and Jerry Caprio, “Empirical Evidence on the Role of Credit for SMEExports in Mercosur”
Malcom Rowat, “Competition Policy within Mercosur”
For copies of these papers or information about these programs contact Maurice Schiff, TheWorld Bank, 1818 H Street NW, Washington, D.C. 20433.
L. Alan WintersResearch Manager
Development Research Group

Outsiders and RTAs among Small Countries:
The Case of Regional Markets
Anju Gupta and Maurice Schiff
International Trade DivisionInternational Economics Department
World BankWashington, D.C.
The views expressed here are those of the authors. They do not necessarily represent those of theWorld Bank or any of its member governments. The authors are grateful to Alan Winters forcomments on an earlier draft.
1
ABSTRACT
Standard theory says that a country’s welfare is unaffected from being excluded from a
small regional trade agreement (RTA). However, for most products, “small” countries and RTAs
do have some measure of market power. Such market power can arise if -- i) supply is
geographically concentrated, ii) tastes differ, iii) there is product differentiation (such as
quality), iv) transport costs are high, v) the principal importing countries impose quantitative
restrictions, or vi) hysterisis due to irreversible costs.
In this paper we show - based on two case studies - that RIAs among small countries may
have negative welfare implications for outside countries. In the first case study, we find that
Argentina’s cattle and beef exports to Peru fell when Peru formed a RTA (Andean Pact) with
Colombia, an exporter of the same products. Argentina also lost due to the higher unit price it
received on its exports to Peru. Interestingly, the entry of Venezuela into the Andean Pact (i.e.,
the formation of a larger bloc) seems to have resulted in a welfare gain for the outside country
(Argentina).
In the second case study, rather than examining whether formation of the CACM had a
negative impact on outside countries, due to lack of data, we examine the impact of the
breakdown of the CACM on member countries. Though the CACM has essentially been trade
diverting in the case of manufactures, it seems to have been trade creating in the case of white
maize, with both importing and exporting member countries gaining from the RTA.
Consequently, one would expect that a breakdown of the CACM, which resulted in member
countries becoming more “outsiders” to the bloc, may have led to a decline in the welfare of both
the exporting and the importing member countries. This is supported by the data, and implies

2
that if one of the five member countries had been left out of the CACM, it would have been
worse off as far as white maize is concerned.

3
Outsiders and RTAs among Small Countries:
The Case of Regional Markets
I. INTRODUCTION
If countries forming a regional trade agreement (RTA) are large, and if their external
trade barriers remain unchanged following integration, the rest of the world (ROW) will lose due
to a worsening in its terms of trade (because the RTA will export less to and import less from the
ROW). The question examined here is : What happens to countries left out if the RTA is made
up of small countries?
For products for which the RTA as a whole is a price taker, the literature states that the
formation of the RTA should have no impact on third countries (ROW). For instance, Winters
(1996) shows that if the ROW is large, a RTA has no impact on the terms of trade between the
ROW and the RTA, and as long as competition and free trade hold in the ROW, welfare in the
ROW is unaffected by the policies of the RTA member countries. On the other hand, under trade
barriers in the ROW, changes in ROW imports due to formation of the RTA will have some
effect on ROW welfare, but given that the RTA is small relative to the ROW, this effect is likely
to be small. We focus here on the effect of formation of a RTA on its terms of trade with the
ROW.
Even a small RTA may have market power in certain products. Such market power can
arise if -- i) supply is geographically concentrated, ii) tastes differ, iii) there is product

4
differentiation (such as quality), iv) transport costs are high1, v) the principal importing
countries impose quantitative restrictions, and vi) hysterisis due to irreversible costs.
In this paper we show - based on two case studies - that RIAs among small countries may
have negative welfare implications for outside countries. We do not appeal here to product
differentiation. Rather, the products in the two case studies are basic commodities with a high
degree of homogeneity. The first case study deals with bovine cattle and meat in the Andean
Pact, and the second one examines the case of white maize in the Central American Common
Market. A theoretical analysis is presented in the appendix.
II. CASE STUDIES
A study to capture the impact of the formation of a RTA requires data on the countries
both before and after formation of the bloc. A number of South-South RTAs have not been
effectively implemented, while data on many others (e.g. RTAs among African nations) are not
available. We did find some data on the Andean Pact and the CACM which seem to provide
support for the negative welfare implications for outside countries.
Case A: Impact of Andean Pact formation on Argentinean Bovine Cattle and Meat (Beef) exports
The Cartagena Agreement created the Andean Pact on May 26, 1969 between Bolivia,
Chile, Colombia, Ecuador and Peru. Venezuela joined in 1973, and Chile withdrew in 1976
(Bywater, 1990). Its objectives were to harmonize social and economic policies, to accelerate
1 Amjadi and Winters (1997) show that geographic proximity and low transport costs may not be enough to reap big
rewards as a “natural” trading bloc in the case of Mercosur.
5
development of agriculture, to promote joint industrial program, to reduce bilateral tariffs among
trading partners and to have a common external tariff. Andean member countries planned to
eventually form a common market. Preferential treatment was extended towards Bolivia and
Ecuador (Wallender, 1973).
The intra-Andean trade liberalization process started in 1970 with the removal of tariffs
and NTBs on 1975 items on the LAFTA’s Common List. The second step was the removal of
NTBs on all intra-Andean trade. The third step was to set common and low tariffs on intra-area
trade in products subject to progressive liberalization. However, trade flows within the bloc,
after an initial boost, stagnated and remained at a low level (Josling, 1996).
Unlike many other RTA’s, specific provisions were made to address the agricultural
sector (Wong, 1986). A list of agricultural products were selected and the products on this list
were subject to national escape clause action. Under the system of national escape clause, an
importing country could block imports of agricultural products to the quantities necessary to
cover deficits in internal production, but not to reduce the usual consumption of the product or to
increase its uneconomic production (Wardlaw, 1973).
At the time of the formation of Andean Pact, trade among member countries accounted
for less than 5% of the total trade. Further, trade was heavily concentrated in a few primary
products, including cotton, cattle and beef, sugar, cocoa, bananas, and fishmeal (Morawetz,
1974). Beef was one of the products subject to national escape clause (Wardlaw, 1973). We
focus here on the exports of bovine cattle and bovine meat (beef) from Argentina.
Among the Andean Pact countries, Peru and Venezuela are importers of bovine cattle and
beef, and Colombia is an exporter. Argentina, a neighboring country, is one of the large
6
exporters of bovine cattle and beef. There exists a world market for beef, but trade in bovine
cattle is restricted to the region due to high transportation costs. Further, the world cattle market
is restricted by various forms of non tariff barriers (NTBs).
Bovine Cattle
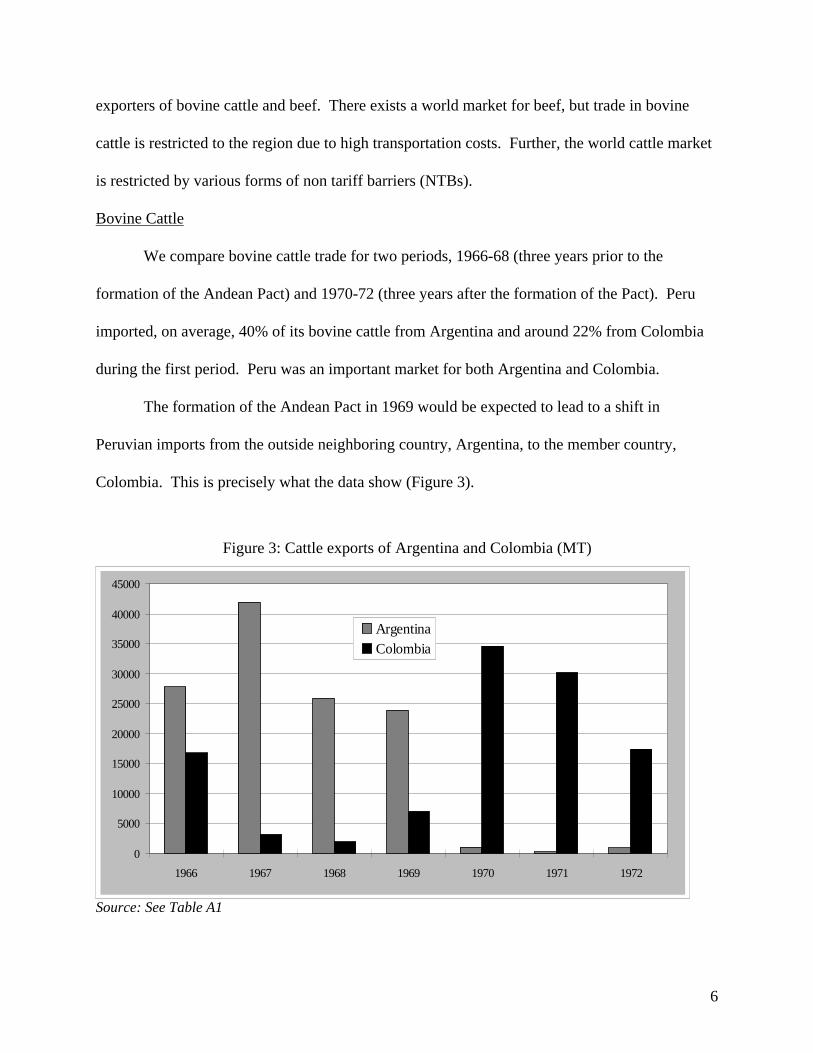
We compare bovine cattle trade for two periods, 1966-68 (three years prior to the
formation of the Andean Pact) and 1970-72 (three years after the formation of the Pact). Peru
imported, on average, 40% of its bovine cattle from Argentina and around 22% from Colombia
during the first period. Peru was an important market for both Argentina and Colombia.
The formation of the Andean Pact in 1969 would be expected to lead to a shift in
Peruvian imports from the outside neighboring country, Argentina, to the member country,
Colombia. This is precisely what the data show (Figure 3).
Figure 3: Cattle exports of Argentina and Colombia (MT)
0
5000
10000
15000
20000
25000
30000
35000
40000
45000
1966 1967 1968 1969 1970 1971 1972
ArgentinaColombia
Source: See Table A1

7
Argentina’s exports to Peru fell from 32,000 MT in 1966-68 to less than 1000 MT in
1970-72 and Peru’s share in Argentina’s exports fell from an average of 30% in 1966-68, to 2%
in 1970-72, a decline of over 96% in the trade volume. Colombian exports to Peru, on the other
hand, increased from an average of 7 thousand MT to over 27 thousand MT, for the same time
period.
Argentina lost 15 mln US$ a 48% fall in its total trade earnings from bovine cattle
exports (with a 96% fall in earrings from its exports to Peru). Colombia, on the other hand,
gained 12 mln US$ for the same period (See Table 1) of which 10.6 mln was in Peru’s market.
Table 1: Cattle Exports of Argentina and Colombia (mln US$)
Argentina ColombiaWorld Peru Other LAC ROW World Peru Other LAC ROW
66-68 31.9 10.4 21.2 0.3 3.05 2.4 0.2 0.5
70-72 16.7 0.4 16.2 0.06 15.8 13.0 0.6 2.2
% change -48% -96% -23% -79% 417% 444% 302% 328%
Source: See Table A1
In terms of unit export values, Argentina obtained a higher unit value on exports to Peru
than on its total cattle exports, though the premium on its exports to Peru fell from 7% to 4%
after the formation of the bloc. On the other hand, Colombia unit export value on exports to Peru
was lower than on its total exports in 1966-68 (by about 3%) and became higher in 1970-72 (by
about 2%).
Thus, the excluded neighboring country, Argentina, seems to have lost from the
formation of the Andean Pact while Colombia seems to have gained. However, this is an
incomplete story because bovine meat or beef is a substitute for bovine cattle, even if an

8
imperfect one, and unlike cattle, beef is traded on the world market. We examine below what
happened to the total trade of cattle and beef.
Bovine Cattle and Beef
Figure 4 presents Argentina’s exports of bovine cattle and meat to Peru for the period
1962-94 and Table 2 presents three period averages: 1962-69 (prior to Andean Pact), 1970-73
(prior to Venezuela becoming a member of Andean Pact) and 1974-94. In the first period, 5% of
Argentinean exports went to Peru (10.9 mln US$ worth of exports). The exports declined to 1%
(around 2.5 mln US$ for 1970-73 and 3.9 mln US$ for the period 1974-94) of the total exports
thereafter.
Figure 4: Argentina’s Exports to Peru (Mln US$)
0
5000
10000
15000
20000
62 64 66 68 70 72 74 76 78 80 82 84 86 88 90 92 94
3.9 mln US$
10.9 mln US$
2.5 mln US$
Source: See Table A1

9
Table 2: Bovine Cattle and Meat Exports (mln US$)
Argentina Colombia
WORLD PERU Other LAC ROW WORLD PERU Other LAC ROW
62-69 231.8 10.9 28.9 202.9 4.9 3.0 1.9 0.0
5% 12% 88% 62% 38% 0%
70-73 380.9 2.5 43.4 337.6 32.9 13.1 19.8 0.0
1% 11% 89% 40% 60% 0%
74-94 348.4 3.9 38.5 309.8 30.5 6.2 24.3 0.0
1% 11% 89% 20% 80% 0%
Source: See Table A1
If Peru were a large trading partner for Argentina and the latter were unable to sell in the
ROW without a loss in its terms of trade once Peru started importing from a member country,
then the bloc formation would be expected to lead to a decline in Argentinean welfare. This
occurred in the case of cattle. However, Peru was not an important market for Argentina in the
case of beef. Nevertheless, Argentina may have lost somewhat from the formation of the Andean
Pact and the fall in the export share going to Peru since it obtained a higher price for its exports
in the Peruvian market than in the rest of the world.
Table 2 also indicates that the Colombian annual exports of cattle and beef to Peru
increased from less than 3 mln US$ in 1962-69 to over 13 mln US$ in 1970-73 (a 447%
increase) before falling to 6.2 mln US$ in 1974-942 (see Figure 5). Peru’s share in Colombian
exports declined from about 40% to 20%. Why do we observe this decline in Colombian exports
to Peru in absolute level and in its share in total exports?
2 Note that this is still about double the level in 1962-69, prior to the formation of the Andean Pact. presents
Colombia’s exports of bovine cattle and meat to Peru.

10
Figure 5: Colombian Exports to Peru (Mln US$)
Meat
0
5000
10000
15000
20000
62 64 66 68 70 72 74 76 78 80 82 84 86 88 90 92
2.5 mln US$
6.2 mln US$
13.1 mln US$
Source: See Table A1
Venezuela, a net importer of bovine cattle and beef, joined the Andean Pact in 1973. It
imported mainly from Colombia, though in small quantities prior to 1974. When Venezuela
joined the Andean Pact in 1974, it increased its imports from Colombia, and exports from
Colombia to Peru declined. As shown in Table 2 and Figure 5, Colombia’s annual exports to
Peru declined from 13.1 mln US$ in 1970-73 to 6.2 mln US$ in 1974-94. Consequently, as
shown in Table 2 and Figure 4, Argentina’s exports to Peru increased by 55% after 1974.
Standard models of the impact of bloc formation on outsiders show that outsiders lose
from the formation of a bloc because it leads member countries to trade more with each other and
trade less with the outside world. Thus, the finding that Argentina's volume of exports to Peru
increased following the enlargement of the Andean Pact in 1973 (when Venezuela joined) is
somewhat surprising.

11
The Andean Pact before 1973 can be thought of as a single economy which then formed a
RTA with Venezuela in 1973. Why was the positive impact on Argentina opposite to the
predictions of the standard models? These models typically assume that all member countries
have the same initial MFN tariffs and assume zero transportation costs. Relaxing either of the
two assumptions can lead to an increase in trade between bloc members and the ROW after bloc
formation, and can generate the result we obtained for Argentina3.
Note that Wonnacott and Wonnacott (1994) are able generate welfare gains from bloc
formation under transport costs only if the pattern of trade changes. Below we describe a case of
transport costs where bloc formation does not affect the pattern of trade but still results in a
welfare gain.
We start with the case of differentiated barriers and abstract from transport costs.
Assume two countries denoted Country 1 and Country 2. Assume both are net importers.
Country 1 has a high tariff T1 on imports prior to bloc formation so that its imports are low,
while Country 2 has a lower tariff T2 < T1. Assume now that they form a customs union (CU)
and set the common external tariff (CET) at the level CET = T2. Then, imports by Country 2 are
not affected but those of Country 1 increase, so that total imports increase following bloc
formation. The reason is that formation of the bloc resulted in liberalization of trade with the
ROW and thus in higher imports from the ROW. World welfare increases following bloc
3 There are simulation studies on EEC formation which had trade creation effects with rest of the world, for instance
Balassa (1974). There are also studies on European integration showing that integration can raise trade with the
ROW (The European Economy, 1997). The effects in both studies are due to the associated income effects. We
abstract from any income effects below.

12
formation. Welfare for the bloc as a whole increases if it has no market power4, and it increases
for the ROW if the bloc has market power.
Prior to 1973, Venezuela did not import cattle or beef from Latin American countries due
to restrictive trade barriers. After joining the Andean Pact, Venezuela lowered its barriers to the
level of Andean Pact’s CET and started importing. In fact, Venezuela imported from Colombia
at zero tariff. Nevertheless, it did pay an implicit tariff equal to the CET. Since Colombia
exported to both Venezuela and Peru, arbitrage implies that it obtained the same price on its
exports to both countries. Peru imported from both Colombia and Argentina, and arbitrage
implies it paid the same price to both. Since Peru’s imports from Argentina were charged the
CET, Venezuela's import price from Colombia included the CET as well.
We now turn to the second explanation. The result, that total imports by member
countries increased after bloc formation, can also be obtained by assuming that the members
have the same tariffs before bloc formation but with transport costs within one of the member
countries.
Assume that the Andean Pact prior to 1973 consists of one economy with two 'regions',
Colombia and Peru. Colombia, the exporting region, is located in the North, while Peru, the
importing region, is located in the South. Assume that transport costs between Colombia and
Peru are TC = 2. Both Argentina and Peru are located in the South so assume there are no
transport costs between them. Similarly, assume zero transport costs for exports from Colombia
to its neighbor Venezuela. The tariff of the Andean Pact and of Venezuela is T = 3, and
4 With market power, whether bloc welfare rises or falls depends on the level of tariffs relative to the optimum
tariffs.

13
Argentina’s export price is Pa = 10. Then, Peru’s import price (on imports from Argentina) is Pp
= Pa + T = 13. Since Colombia also sells to Peru, it receives Pc = Pp - TC = 11. And since
Venezuela pays tariffs on its imports from Colombia, the price in Venezuela is Pv = Pc + T = 14.
Argentina does not export directly to Venezuela because that would result in a higher
import price for Venezuela, namely Pa + TC + T = 15. The price in Venezuela on imports from
Colombia is Pv = Pa + 2T - TC. Thus, as long as TC > T/2, it is cheaper for Peru to import from
Colombia and Argentina will not export directly to Venezuela.
Following its entry into the Andean Pact, Venezuela’s import price falls to Pv = Pc = Pa +
T - TC = 11. Thus, its demand for imports increases, Colombia shifts some of its exports from
Peru to Venezuela, and Peru shifts some its imports from Colombia to Argentina. In this case as
well, total imports by member countries increases following formation of the bloc5. What
happened is not that trade with the ROW is liberalized following bloc formation, but rather that
the import price of Venezuela now includes the tariff only once rather than twice. World welfare
also rises in this case, and the welfare of the member countries rises if the ROW (Argentina here)
is large relative to the bloc6.
5 Alternatively, Argentina could ship its beef directly to Venezuela without going through Peru and Columbia. Say
the transport cost is TCAV. The price in Venezuela from buying directly from Argentina would be Pa+TCAV+T. As
long as TCAV > T-TC, Venezuela will import from Colombia, and will increase its imports after joining the Andean
Pact. If TCAV < T-TC, then Venezuela would initially import from Argentina, but would shift to Colombian imports
after joining the Andean Pact (because TCAV > -TC) and would increase its imports as well.
6 Venezuela gains from the price reduction. If Argentina is large, the bloc’s import price remains unchanged and the
bloc as a whole gains. However, if Argentina is small, the bloc’s import price rises after entry of Venezuela, and the
impact on bloc welfare is ambiguous.
14
A variant of the bloc formation and internal transport cost story is provided in Srinivasan
(1994) where both the Northern and the Southern countries join the bloc. He also simulates the
impact of an exporter, Bangladesh, forming a bloc with India and replacing sales from Western
to Eastern India.
Case B: The Impact of the Breakdown of CACM on the Trade of White Maize
Economic integration initiatives in Central America started in the fifties with the
conclusion of several bilateral free-trade treaties. The Central American Common Market
(CACM) was officially created in 1960 among five countries: Costa Rica, Guatemala, El
Salvador, Honduras and Nicaragua. The main goals of the CACM were to establish a CET to
protect the region’s industry; to remove any intra-trade barriers; and to promote extraregional
exports to make the regional economy a player in the world economy. Preferential treatment was
to be extended to the relatively underdeveloped countries within the CACM. CACM was,
however, only a limited customs union since intraregional trade was restricted and countries did
not adhere to the CET. Basic agricultural commodities were virtually excluded from the
liberalization of trade.
As discussed by Lachler et al. (1990), the formation of the bloc, nevertheless, had a
considerable impact on intraregional trade which increased from less than 5% of total trade to
over 20% after formation of the bloc. Though intraregional trade in manufactures saw a rapid
growth in the sixties, the products were not competitive on the world market and CACM was
unable to meet its objective of expanding extraregional trade. Further, no preferential treatment
15
was extended to the less developed economies of the region due to protectionist policies of the
member countries. The external debt crisis and trade imbalance among member countries of the
region in the late 70s led to restrictive trade policies. Total imports declined and intraregional
trade saw an even greater decline7.
The data on CACM countries start in 1963, leaving us no observations prior to the
formation of the bloc. We will, thus, concentrate on the impact of the breakdown of CACM on
intraregional trade in white maize. The breakdown -- due to increased trade and other barriers --
means that member countries found themselves more “outside” the bloc than before.
White maize is a product with a localized market. Over 35% of total world production of
white maize is produced and consumed in the region (Latin American and Caribbean (LAC)
countries) and is not connected to the other “local” or regional white maize markets (e.g.
Southern Africa). Thus, one can reasonably assume that these CACM countries had some
market power in the trade of white maize.
There are three problems in analyzing the impact of the CACM breakup on the trade of
white maize. First, data on white maize are nonexistent since most of the data sources report
white and yellow maize together. Since imports from the US and countries outside the LAC are
essentially yellow maize, we assume that white maize imports consist exclusively of
intraregional imports and imports from Mexico and Panama.
Second, data on the intraregional trade in maize are not very reliable since regional trade
was often not registered. Registration occurred not for statistical purposes but rather to prevent
smuggling, and anecdotal evidence suggests that little registration took place when there were no
7 See Lachler et al. (1990) for further details of the impact of CACM on manufactures.

16
controls, while smuggling occurred when there were controls on intraregional trade. Thus data
are likely to under-report the actual transactions.
Third, converting local currency prices to dollar prices using official exchange rates may
not give us a precise picture of relative intraregional prices at times when bilateral exchange rates
were used. Variable inflation across member countries in the 1980s and balance of payment
pressures resulted in differential devaluations across member countries and in sharp instability in
nominal and real bilateral exchange rates (Lizano, 1993).
This led to a further breakdown in intraregional trade. It is the impact of this breakdown
in intraregional trade which we aim to examine in the case of white maize where member
countries are likely to have some market power.
Guatemala is the largest producer of white maize within the CACM countries, followed
by El Salvador and Honduras. Guatemala is also a large consumer of the product and thus a net
importer of maize (both white and yellow). Honduras was the only net exporter within CACM,
and only in the sixties.
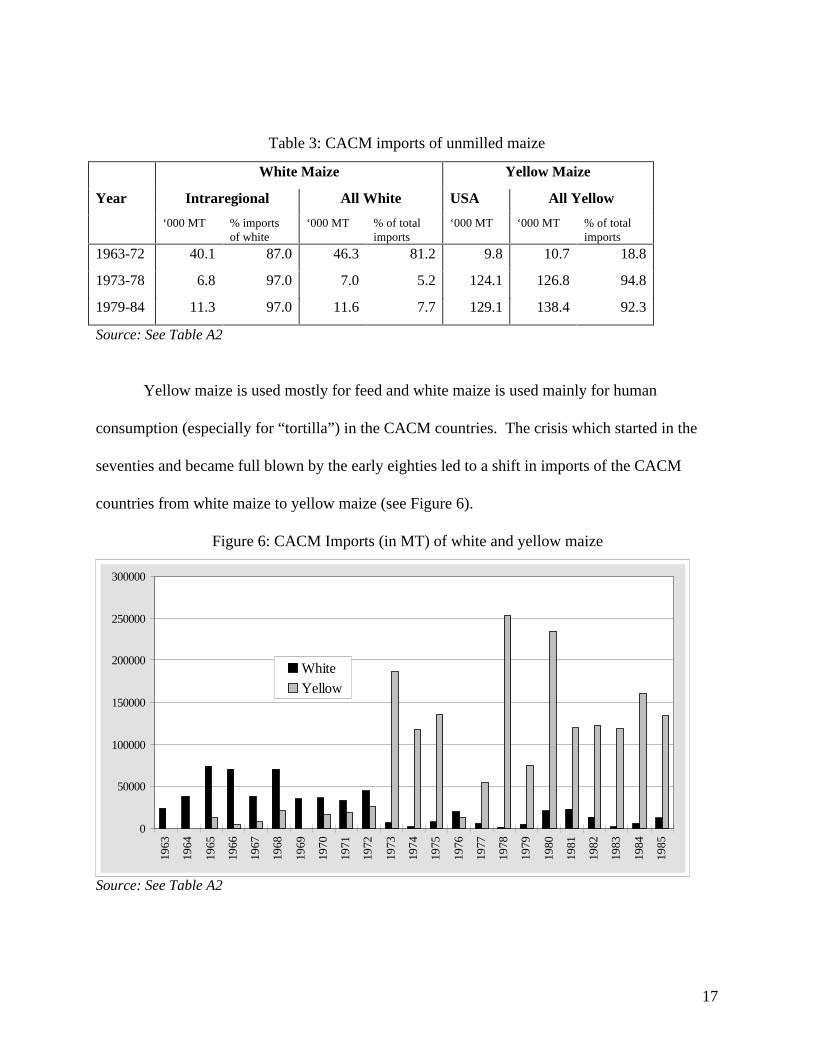
Table 3 presents four period averages of CACM imports of unmilled maize (both yellow
and white) from CACM, and the USA. For the period 1963-72, intraregional imports accounted
for 87% of the imports of white maize, and increased to 97% in 1973-84. However, imports of
white maize declined in absolute amount and also as a ratio of total imports of maize due to
increased imports of yellow maize mostly from the US. CACM imports of white maize declined
from 81% in 1963-72 to 5.2% in 1973-78 and those of yellow maize increased from less than
20% to 95%.
17
Table 3: CACM imports of unmilled maize
White Maize Yellow Maize
Year Intraregional All White USA All Yellow
‘000 MT % importsof white
‘000 MT % of totalimports
‘000 MT ‘000 MT % of totalimports
1963-72 40.1 87.0 46.3 81.2 9.8 10.7 18.8
1973-78 6.8 97.0 7.0 5.2 124.1 126.8 94.8
1979-84 11.3 97.0 11.6 7.7 129.1 138.4 92.3
Source: See Table A2
Yellow maize is used mostly for feed and white maize is used mainly for human
consumption (especially for “tortilla”) in the CACM countries. The crisis which started in the
seventies and became full blown by the early eighties led to a shift in imports of the CACM
countries from white maize to yellow maize (see Figure 6).
Figure 6: CACM Imports (in MT) of white and yellow maize
0
50000
100000
150000
200000
250000
300000
1963
1964
1965
1966
1967
1968
1969
1970
1971
1972
1973
1974
1975
1976
1977
1978
1979
1980
1981
1982
1983
1984
1985
WhiteYellow
Source: See Table A2

18
The change in the relative consumption of white and yellow maize due to the breakdown in
intraregional trade in CACM must have had a negative impact on the member countries’ welfare
since yellow maize is considered a poor substitute for white maize in these countries.
Among the five CACM countries, Costa Rica is the main importer of maize. It imported
from member countries El Salvador, Nicaragua and Honduras (See Table 4). About 50% of the
total imports of Costa Rica prior to 1973 were from member countries (with over 60% of those
from Nicaragua). In the crisis period, from the late 1970s to the early eighties, El Salvador
became the main supplier of white maize to Costa Rica. However, the imports from member
countries fell to less than 9% and those from the US increased to 91% for the period 1979-84.
Table 4: Costa Rica’s Imports of Unmilled Maize (in MT)
WORLD CACM NICARAGUA ElSALVADOR
HONDURAS USA
1963-72 12572 6191 (49%) 3767 1434 943 3533 (28%)
1973-78 17329 1931 (11%) 1145 462 310 13184 (76%)
1979-84 32601 2810 (8.6%) 594 1383 833 29776 (91%)
Source: See Table A3Note: Percent in imports from the world are given in parenthesis
As shown in Table 5, the deflated import price of white maize for Costa Rica (Pwcri)
relative to the deflated unit import price of yellow maize (Pycri) increased from an average of 0.75
in 1965-72 to 2.22 in 1973-78 and remained above one for all years after 1979(See Table A4).
Thus, in the late 1970s, imports of white maize in Costa Rica had become more costly than
importing yellow maize from the US. This would seem to suggest that Costa Rica’s welfare fell.

19
Table 5: Import and Producer prices (in US$/MT)
Pwcri Py
cri Pwcri /P
ycri PPslv PPslv/P
wcri PPslv/P
ycri
1965-72 87.7 117.0 0.75 78.8 0.89 0.67
1973-78 365.2 163.7 2.22 139.0 0.38 0.85
1979-84 292.1 179.8 1.63 186.2 0.64 1.04
Source: See Table A4.
The main exporting member country, El Salvador, was also adversely affected. Producer
prices in El Salvador (PPslv) increased over time, but the increase was relatively lower than that
of the import price of white maize in Costa Rica. As expected the breakdown in the CACM
resulted in a fall in the price of white maize in the exporting countries relative to that in the
importing countries. The relative producer price of El Salvador to import price of white maize of
Costa Rica decreased from 0.89 in 1965-72 to 0.38 in 1973-78 and to 0.64 in 1979-84. Thus, the
breakdown of the CACM --which resulted in each member country being left more “outside” the
other CACM member countries -- seem to have had a negative impact on both importers and
exporters within the bloc.
III. CONCLUSION
Standard theory says that a country’s welfare is unaffected from being excluded from a
small RTA. However, for most products, “small” countries and RTAs do have some measure of
market power. Regional markets are pervasive whether due to localized production and/or high
transport costs, taste and quality differences resulting in imperfect or low substitution,
irreversibility and high adjustment costs in changing markets, and more. These occur both at the
20
domestic level (e.g. imagine the losses for a village in Africa suddenly locked out from selling to
or buying from a nearby market) and at the international level. This was illustrated with two case
studies: Bovine cattle and beef trade in the Andean Pact region, and white maize in CACM.
In the first case, we find that Argentina’s cattle exports to Peru fall when Peru formed a
RTA with Colombia, an exporter of the same product. When we consider exports of cattle plus
beef, Argentina also lost market share to Colombia in Peru’s market, though the percentage loss
is not as pronounced. Though the percentage loss is smaller in volume terms in the latter case,
Argentina seems also to have lost from the lower exports to Peru because it obtained a higher
price in Peru than in other export markets. Interestingly, the entry of Venezuela into the Andean
Pact (i.e., the formation of a new, larger bloc) seems to have resulted in a welfare gain for the
outside country (Argentina).
In the second case, we find that a breakdown of an existing bloc, CACM, which results in
member countries becoming more “outsiders” to the bloc, may lead to a decline in the welfare of
both the exporting and the importing member countries.

21
Appendix
Consider three neighboring countries, 1, 2 and 3. Country 2 and Country 3 export
commodity X to Country 1 and to the rest of the world (ROW). Assume no transport costs
between the three neighboring countries and the ROW. Further, assume, Countries 1 and 2
initially have the same MFN import tariff T, and now form a RTA. Then demand for exports
from the outside country, Country 3, by the RTA falls because Country 1 shifts from importing X
from Country 3 to importing X from Country 2. Similarly, supply of exports of the commodities
by the RTA to Country 3 falls as well.
Case 1: If Country 3 is small in the market for its exports (and imports), it will simply reallocate
its trade to the non-RTA (ROW) market, and will not be affected in terms of its volume and/or
price of exports (or imports)8.
Case 2: Assume, on the other hand, that the market for Country 3’s exports is regional (or local)
- i.e. it is concentrated geographically to Countries 1, 2 and 3 (and/or a few other neighboring
8 Note that the price at which Country 1 imports after the formation of the RTA depends on the shift in the
export supply curve of Country 2, S2. If the shift in S2 is such that Country 1 continues to import from Country 3
and the ROW after formation of the RTA, the price in Country 1 remains PW+T (where PW is the world price and T
is its MFN tariff), and Country 2 receives now a price PW+T for its exports to Country 1 rather than PW. If, after
formation of the RTA, S2 shifts out to the point where the sum, S2+S3, of the exports of Country 2 and Country 3 at
price PW+T is larger then import demand by Country 1, the price will still remain at PW+T because Country 3 --
which continues to pay tariff T on exports to the RTA -- will export any excess to the ROW at price PW. However, if
after the formation of the RTA, S2 shifts out to a point beyond the excess demand of Country 1 at price PW+T, then
Country 1 will no longer import from Country 3 and the ROW and the price in Country 1 will fall. Thus, the
formation of a RTA alters the terms of trade only if the pattern of trade between Country 1 and Country 3 changes.
Wonnacott and Wonnacott (1994) examine a simpler case of two small countries and the ROW in a general
equilibrium framework, and also find that a RTA between the two small countries affects the terms of trade only if
the pattern of trade with the ROW changes.

22
countries). Then, Country 3 may lose from formation of the RTA between Countries 1 and 2,
both in terms of volume of exports and unit value (and similarly for imports).
Figure 1 depicts this case. The import demand for commodity X by Country 1 is given by
D1. The export supply, inclusive of tariffs, is from two sources - Country 2 (S2), and Country 3
(S3), with a total supply S2+3. The demand of Country 1 is 0q1 with 0q3 supplied by Country 3
and the rest by Country 2. The domestic price in country 1 is p and the export price in Countries
2 and 3 is p-T (not shown in the figure).
Figure 1
D1
q1
p
S3
q3
S2
0
S3+2
S’2
S’3+2
q’1q’3
p’
A
B
g
g’h
h’

23
After the formation of the RTA, the supply curve of Country 2 shifts out to S’2 and S3+2
shifts out to S3+2’. The quantity demanded by Country 1 increases to 0q’1. Imports from Country
3 fall from 0q3 to 0q’3 and imports from Country 2 increase from q3q1 to q’3q’1.
More importantly, Country 3 loses because its volume of exports decline from 0q3 to 0q’3
and its export price falls from p-T to p’-T, with its producer surplus falling from Apg to Ap’g’.
Country 2 gains because of an increase in the volume of exports as well as an increase in its
export price from p-T to p’, with its producer surplus increasing from Aph to Bp’h’. In this case,
the country left out of the RTA, Country 3, loses.
Case 3: The above cases abstract from transportation costs. Introducing transportation costs
with the ROW drives a wedge between the price of imports from the ROW and the price of
exports to the ROW for the three countries. This is shown in Figure 2.
Country 1 can import from the ROW at price P. Country 2 and Country 3 can export to
the ROW at price p (< P), and can export to Country 1 at any price smaller or equal to P. The
world price is PROW = (P + p)/2; with transport cost = (P - p)/2 between the ROW and the region
(Countries 1, 2, and 3).
Assuming that prior to the formation of the RTA, Country 1 imports 0q1 at price P, and
with 0q3 imported from Country 3, q2+3q3 imported from Country 2 and q2+3q1 imported from the
ROW.
After the formation of the RTA, the supply curve of Country 2 shifts out to S’2. If supply
S’3+2 < 0q1 at price P, then there is no impact on the import price, on Country 3’s volume of
exports or on its welfare (Country 1 simply reduces imports from the ROW in the same amount
as it increases imports from Country 2). This is just like Case 1.

24
However, if S’3+2 > 0q1 at price P, then the quantity demanded by Country 1 increases to
0’q1, imports from Country 3 fall from 0q3 to 0’q3 and imports from Country 2 rise from q3q1 to
q’3q’1, with the price p’ < P.
Figure 2
As in case 2, Country 3 loses while Country 2 gains, i.e., the country left out of the RTA
loses. Note that in this case, the countries in the region stop trading with the ROW (if S’3+2
intersects D1 to the right of point A). Country 3 loses even more if S’2 increases by so much that
D1
q1
p
S3
q3
S2
0
S3+2
S’2
S’3+2
q’1=q3+2’q’3
p’
A
B
DROW
SROWP
q2+3
A

25
the region becomes an exporter to the ROW. Thus, in order for Country 3 to lose from a RTA
between Country 1 and Country 2, the pattern of trade with the ROW must change. In other
words, the ROW must change from being an exporter to the bloc, to either not trading with the
bloc or importing from it. Note however that in the case of differentiated products, Country 3
can lose even if the pattern of trade is not affected.
We believe that the phenomenon of local or regional markets -- due to product specificity,
differentiated products (lower quality), quantitative restrictions and/or transportation costs on
trade with the ROW -- is quite prevalent. This is also prevalent for trade within individual
countries , especially in the developing world, where high domestic transport costs and
quantitative restrictions often generate local market power. However, despite the presumed
prevalence of such phenomena, hard evidence is very difficult to come by, particularly given our
focus on developing countries.

26
REFERENCES:
Azita Amjadi and L. Alan Winters (1997), “Transport Costs and “Natural” Integration inMercosur,” The World Bank, Policy Research Working Paper 1742.
Balassa, Bela (1974) "Trade Creation and Trade Diversion in the European Common Market:AnAppraisal of the evidence," Manchester School of Economic and Social Studies; Vol. 42, pages93-135.
Bywater, Marton (1990), Andean Integration: A New Lease of Life?,” The EconomistIntelligence Unit, Special Report No. 2018.
Clavijo, S. (1995) “A Survey of Economic Policies and Macroeconomic Performance in Chileand Colombia, 1970-95,” IMF Working Paper 139.
European Commission (1996) “European Economy: Economic Evaluation of the InternalMarket, ” The European Commission.
Josling, T. (1996) “Agricultural Trade Policies in the Andean Group: Issues and Options”, Areport prepared for the Latin American and Caribbean Division of the World Bank.
Lachler Ulrich et. al. (1990) “Trade liberalization and Economic Integration in Central America,”World Bank Report No. 7625-CAM, Trade, Finance & Industry Division, Country OperationsDepartmant II, Latin America and the Caribbean, The World Bank.
Lizano, Eduardo (1993) “Economic Development and Regional Integration in CACM,” A reportprepared for the special session on the above mentioned subject held during the first meeting ofthe Regional Consultative group for Central America.
Morawetz, D. (1974) The Andean Group: A Case Study in Economic Integration amongDeveloping Countries, MIT Press, Cambridge, MA.
Srinivasan, T.N. (1994) “Regional Trading Arrangements and Beyond Exploring Some Optionsfor South Asia: Theory, Empirics and Policy” World Bank Report No. IDP - 142.
Wardlaw, A.B. (1973) The Andean Integration Movement, A report prepared under contract forthe U.S. Department of State, Library of Congress Catalog Card no. 73-600269.
Winters, L. Alan (1996) “Intôgration Europôenne et bien - ître ôconmique dans le Reste duMonde,” Economie Internationale No. 65 (1): pp 123-42.
Wong, John (1986) Regional industrial Cooperation: Experiences and Perspective of ASEANand the ANDEAN Pact, UNIDO, Vienna.

27
Wonnacott, P. and Wonnacott, R. (1981) "Is Unilateral Tariff Reduction Preferable to a CustomsUnion? The Curious Case of the Missing Foreign Tariffs," American Economic Review, Vol. 71(4), pages 704-14.