Outlook for U.S. Agricultural Trade - Cornell...
18
United States Department of Agriculture Electronic Outlook Report from the Economic Research Service and Foreign Agricultural Service www.ers.usda.gov www.fas.usda.gov Fiscal 2013 agricultural exports are forecast at a record $145 billion, up $1.5 billion from the August forecast and $9.2 billion above fiscal 2012 exports. Grain and feed exports are forecast down $1.9 billion mostly due to lower corn exports. Oilseed exports are up $3.3 billion on much higher volumes and record prices. Cotton exports are forecast down $200 million in part due to reduced Chinese demand. Horticultural exports are unchanged at a record $32 billion. The forecast for livestock, poultry and dairy is down $100 million on lower poultry, beef, and cattle exports. U.S. imports are projected at a record $115 billion in fiscal 2013, up 11 percent from 2012’s imports of $103.4 billion, but down $2 billion from the August forecast for 2013. The reduced forecast for 2013 is largely due to significantly lower prices for tropical oils, processed fruits and vegetables, sugar, coffee, rubber, and cocoa. The forecast trade balance for fiscal 2013 shows a surplus of $30 billion, down $2.4 billion from 2012. AES-76 Nov. 29, 2012 Outlook for U.S. Agricultural Trade FY 2013 Exports Forecast at a Record $145 Billion; Imports at a Record $115 Billion Economic Outlook Export Products Regional Exports Import Products Regional Imports Contact Information Tables Macro Trends Commodity Exports Regional Exports Commodity Imports Regional Imports Reliability Tables Web Sites U.S. Trade Data FAQ & Summary Data Articles on U.S. Trade ---------------- The next release is February 21, 2013 Contents Approved by the World Agricultural Outlook Board.
-
Upload
phamnguyet -
Category
Documents
-
view
217 -
download
0
Transcript of Outlook for U.S. Agricultural Trade - Cornell...

United StatesDepartmentof Agriculture
Electronic Outlook Report from the Economic Research Service and Foreign Agricultural Service
www.ers.usda.gov www.fas.usda.gov
Fiscal 2013 agricultural exports are forecast at a record $145 billion, up $1.5 billion from the August forecast and $9.2 billion above fiscal 2012 exports. Grain and feed exports are forecast down $1.9 billion mostly due to lower corn exports. Oilseed exports are up $3.3 billion on much higher volumes and record prices. Cotton exports are forecast down $200 million in part due to reduced Chinese demand. Horticultural exports are unchanged at a record $32 billion. The forecast for livestock, poultry and dairy is down $100 million on lower poultry, beef, and cattle exports. U.S. imports are projected at a record $115 billion in fiscal 2013, up 11 percent from 2012’s imports of $103.4 billion, but down $2 billion from the August forecast for 2013. The reduced forecast for 2013 is largely due to significantly lower prices for tropical oils, processed fruits and vegetables, sugar, coffee, rubber, and cocoa. The forecast trade balance for fiscal 2013 shows a surplus of $30 billion, down $2.4 billion from 2012.
AES-76 Nov. 29, 2012
Outlook for U.S. Agricultural Trade FY 2013 Exports Forecast at a Record $145 Billion; Imports at a Record $115 Billion
Economic Outlook Export Products Regional Exports Import Products Regional Imports Contact Information Tables Macro Trends Commodity Exports Regional Exports Commodity Imports Regional Imports Reliability Tables Web Sites U.S. Trade Data FAQ & Summary Data Articles on U.S. Trade ---------------- The next release is February 21, 2013
Contents
Approved by the World Agricultural Outlook Board.

Economic Outlook
2 Outlook for U.S. Agricultural Trade/AES-76/November 29, 2012
Economic Research Service, USDA
Economic Outlook
World Growth Rebounds in 2013 World 2012 growth is expected to have slowed to 2.4 percent. Trade growth dropped to an estimated 2 percent, a sharp slowing from the 7 percent rate of 2011. As a result, manufacturing expansion slowed sharply in United States and the developing economies in the first 10 months of 2012. The dollar will likely appreciate in 2012. The dollar strengthened against the euro as the Eurozone recession, coupled with the evolving euro debt situation, induced flows into dollar-based assets. Asian growth has slowed as the European export market dried up. Western Hemisphere growth partly offset the European recession's impact on developing economies’ exports and growth. Monetary authorities have been boosting credit availability as growth has slowed. In the developing world, prior tight credit, currency appreciation, and a continuing recession in much of Europe are slowing growth prospects and will provide a drag on world growth into early 2013. China is expected to have faster export growth, but rising wages, and reluctance by both households and businesses to increase borrowing may curtail the growth impact of eased credit policies. In Brazil and Argentina—due to strong export growth, higher investment and high commodity prices—faster growth is expected in 2013. The main risk to world growth in 2013—a significant spillover of the Eurozone problem to North American and Asian financial institutions and markets—seems to be subsiding. The expected end of the Eurozone recession, coupled with higher expected U.S. growth in 2013,will move the world economy in 2013 to a higher growth path. The small dollar appreciation seen in 2012 but depreciation is expected in 2013. The dollar and low interest rates will facilitate continued inexpensive credit for financing trade. Total world trade growth is expected to be between 4 and 5 percent in 2013. Higher expected world growth, especially in developing economies, lower energy prices, and available credit make the outlook for U.S. agricultural trade promising in 2013. The expected depreciation of the dollar will have a small positive impact on trade in 2013.

3 Outlook for U.S. Agricultural Trade/AES-76/November 29, 2012
Economic Research Service, USDA

4 Outlook for U.S. Agricultural Trade/AES-76/November 29, 2012
Economic Research Service, USDA
Export Products
Fiscal 2013 grain and feed exports are forecast at $37.1 billion, down $1.9 billion from the August estimate, due to both lower volume and values across most grains, except some higher-value products. Coarse grain exports are forecast at $11.6 billion, down $1.4 billion, due to sluggish corn export sales and weakening prices amidst stiff foreign competition. Corn volume is forecast at 31.0 million tons, down 2.5 million. Feeds and fodders are down $300 million largely due to lower exports of DDGS with strong domestic demand for feedstuffs. Fiscal 2013 wheat exports are forecast at $11.6 billion, a decrease of $700 million from the August forecast due to lower prices and volume. Although prices are down somewhat, values are still high from an historical perspective and expected to remain strong through the summer months. Volume is down slightly as a result of higher competition from India, Russia, and Ukraine. Rice exports are up $200 million to $2.1 billion due to higher prices and volumes. Trade volume is up 0.2 million to 3.6 million tons with strong sales to South America. Fiscal 2013 oilseed and product exports are forecast at $31.4 billion, up $3.3 billion from the August forecast, propelled by a 6.4-million ton (20 percent) rise in forecast soybean exports and continued record soybean and soybean meal prices. Early September rainfall from hurricane Isaac contributed to higher yields resulting in a significant rise in exportable supplies. Strong demand by China, coupled with limited South American competition has kept exports brisk while supporting prices at record levels. Soybean meal exports are forecast higher on strong demand and larger crush attributed to the increased crop. Fiscal 2013 cotton exports are forecast at $4.6 billion, down $200 million from the August estimate. Unit value is unchanged, while export volume is forecast 100,000 metric tons lower, at 2.5 million tons. The decline in exports is in response to a slightly smaller U.S. crop and falling global import demand, primarily in China. High domestic support prices in China continue to weaken the spinning industry. The fiscal 2013 export forecast for livestock, poultry, and dairy is lowered $100 million to $29.8 billion, with losses in poultry, beef, and cattle outweighing gains. Beef exports are forecast at $4.8 billion, down $150 million as marginally higher prices do not offset slightly lower volumes. Tight supplies on lower U.S. production constrain shipments despite strong global demand. Despite higher broiler meat exports, poultry exports are forecast down $100 million to $6.1 billion, due to lower unit values and volumes for turkey meat and poultry offals. Exports of dairy products are forecast higher by 4 percent to $5 billion as stronger international prices are expected to offset lower volume sales, particularly of cheese, skim milk powder, and butterfat. The fiscal 2013 export forecast for horticultural products is unchanged at a record $32.0 billion. Fresh fruit and vegetable exports are forecast at a record $7.6 billion. Exports to Canada, Europe and Japan are expected to continue expanding. Processed fruit and vegetable exports are forecast at $7.4 billion. Unit values for several processed products are expected to continue rising with demand from major markets. Whole and processed tree nuts are forecast at $7.0 billion.

5 Outlook for U.S. Agricultural Trade/AES-76/November 29, 2012
Economic Research Service, USDA

6 Outlook for U.S. Agricultural Trade/AES-76/November 29, 2012
Economic Research Service, USDA
Regional Exports
Agricultural exports in fiscal 2013 are forecast at $145 billion, which is $9.2 billion above final fiscal 2012 exports of $135.8 billion. The fiscal 2013 forecast is raised $1.5 billion from the August forecast, with most of the increase expected in China, Indonesia, and the EU due to greater soybean demand. Asia Exports to China are forecast up $700 million to $21.2 billion. The soybean export value is expected up on strong Chinese demand coupled with high U.S. prices. Though the forecast is raised from the initial fiscal 2013 forecast issued in August, exports are expected down from the fiscal 2012 record of $23.4 billion. Meat, dairy products, tree nuts, and soybean exports are expected to be strong in fiscal 2013, but corn and cotton shipments should fall from the records set last year. China is forecast to remain the top U.S. market ahead of Canada. Japan is forecast up $200 million from the August forecast primarily due to greater soybean unit values. In addition, corn exports are expected up from fiscal 2012 on slightly higher Japanese feed consumption. South Korea is also forecast up $200 million on greater corn demand. In fiscal 2012, U.S. corn exports to South Korea were restrained by strong competition from other corn exporters. In addition, U.S. corn exports were replaced by Korean imports of Australian feed quality wheat and to a lesser extent, U.S. feed quality wheat. Indonesia is raised $500 billion as recent data reveals very strong shipments in the final months of fiscal 2012. This shipment pace is expected to continue strong, particularly for soybeans, which is the largest agricultural product shipped to Indonesia. Indonesia is now forecast even with fiscal 2012 exports of $2.5 billion. Western Hemisphere The Western Hemisphere is unchanged at $53.6 billion. The forecast for Mexico remains at $19.0 billion. An expected increase in soybean exports is offset by a reduction in corn shipments. Greater corn supplies in Mexico from a production rebound and tighter U.S. supplies reduce sales prospects. Though Mexican import demand for corn is expected down, the United States should remain the dominant supplier. Europe, Africa, and the Middle East Exports to the EU are forecast up $200 million due to both a greater volume of soybeans and higher soybean unit values. The sunflower seed and rapeseed crops in the EU are reduced from last year’s levels, thereby increasing overall demand for imported soybeans. With the South American harvest still several months away, the United States will be the primary supplier and benefit from this increased demand at least until this coming spring. Egypt is forecast down $200 million from the August forecast due to increased competition from Russian and Ukrainian wheat supplies. However, the forecast for fiscal 2013 is still $800 million greater than the total in fiscal 2012, in part due to expected greater wheat exports, especially after Black Sea supplies are exhausted in December.

7 Outlook for U.S. Agricultural Trade/AES-76/November 29, 2012
Economic Research Service, USDA

Import Products
8 Outlook for U.S. Agricultural Trade/AES-76/November 29, 2012
Economic Research Service, USDA
The slower U.S. economic growth is reducing the forecast for U.S. agricultural imports in fiscal 2013 from $117 billion in August to $115 billion. This value still represents a 11-percent increase from 2012’s $103.4 billion import bill, which is higher than 2012’s 9.4-percent rise from 2011. The reduced forecast for 2013 is largely due to lower prices for tropical oils, processed fruits and vegetables, sugar, coffee, rubber, and cocoa. U.S. import demand for food is also weak as seen in zero growth in expenditures for food (consumed at home) from the second half of 2011 to the first half of 2012. This is in part the result of three consecutive declines in quarterly real personal disposable income in 2011. Higher food imports in fiscal 2012 were helped by a 3.2 percent growth in spending for food services. Compared with 2012, sugar and tropical product imports are up $4 billion and imported horticulture products are $2.8 billion larger. The remaining import gains are posted by oilseeds and products (up $1.3 billion), grains and feed (up $2.1 billion), and livestock and dairy products (up $900 million). Total U.S. agricultural imports grew by 12.2 percent annually on average during 2010-12, following the recession-induced decline in 2009. The corresponding average growth in import volume was 5.2 percent, which indicates that import prices rose over the past 3 years. However, the strong import volume expansion of 9 percent in 2012 (based on aggregate metric ton units), after 5 percent in 2011 and 1.5 percent in 2010, suggests a strengthening trend in real import demand in 2013. This scenario assumes no significantly higher taxes or large domestic spending cuts by the Government in 2013. Although the sharpest forecast reductions are for sugar and tropical products, their gain from 2012 represents 38 percent of the overall $10.6 billion additional imports expected in 2013. The downward adjustments from the previous projections are accounted for by lower prices for sugar, coffee beans, and natural rubber in 2012 from 2011. Tropical commodity prices peaked recently during the first two quarters of 2011 and have sharply declined since then. The U.S. import price for sugar fell from 38 cents per pound in October 2011 to 24 cents in October 2012. Imported coffee bean prices dropped from $2.50 per pound to $1.70 over the past year. Lower tropical product prices also apply to coconut, palm, and palm kernel oils. Coconut oil prices dropped by more than $300 per metric ton in the past year and by $150 per metric ton for palm oil. While these prices appear to continue falling, the price of olive oil (extra virgin) is climbing sharply. Average prices of tropical oils are significantly lower between 2011 and 2012. These favorable lower import costs resulted in a 1.5-percent reduction in the U.S. import bill for tropical oils in 2012 despite a 6.2-percent rise in their import volume. Even if these prices continue to fall or stabilize, the sharp gain in olive oil price since July will partly offset their lower import cost. Although reduced $100 million from August, the beef import forecast for 2013 shows a 13-percent gain in import value over 2012 as domestic beef supplies tighten and demand for processing-type beef remains strong. Fewer cattle imports are expected in 2013 as cattle inventories in Mexico are lower and herds are rebuilt in Canada. However, the forecast is unchanged from August. The pork import estimatefor 2013 is lowered $30 million from the August forecast to $1.3 billion because of relatively tight exportable

9 Outlook for U.S. Agricultural Trade/AES-76/November 29, 2011
Economic Research Service, USDA
supplies in Canada, our top supplier. Similarly, expected swine imports are trimmed by $24 million. U.S. demand for imported grain products has continued to rise in fiscal 2013, with an additional $500 million expected, and bulk grain imports are expected to jump by $1.5 billion. With the U.S. corn crop hurt by drought in 2012, there is a strong incentive for East Coast pork and poultry producers to import corn from South America, especially during their harvest price lows, around April 2013. In 2012, import demand for grain products—wheat, wheat products, barley, oats, coarse grain products, and processed animal feeds—all posted greater volumes and unit values. In value, the top suppliers of grains and products to the United States are Canada (wheat, grain products, and feeds), Mexico (grain products), Thailand (rice), and China (animal feeds). Imported grains, grain products, and feeds are projected to total more than livestock and meat imports in 2013. Grains and feed products are also larger than oilseeds and products in import value. In fact, grain products, such as baked goods and snacks, will likely outpace vegetable oils in 2013as tropical oil prices deflate and as wheat prices hover around $360 per metric ton. Lower prices for processed fruits and vegetables and for tree nuts are behind the reduced import forecasts for these products in 2013. Nevertheless, these high-value products (along with fresh fruits) posted positive growth in import volume and unit values in 2012, demonstrating continuing firm demand. Their combined estimate in 2013 amounts to more than $740 million worth of additional imported products. The bulk of the $2.8-billion growth in 2013 horticulture imports is attributed to expected $800 million more fresh fruits and vegetables, $600 million more wine and beer, and about $200 million more essential oils and nursery products. For over two decades, the U.S. import value for horticultural crops and products has registered positive annual gains, except during the last recession in 2009.

10 Outlook for U.S. Agricultural Trade/AES-76/November 29, 2012
Economic Research Service, USDA

Regional Imports
11 Outlook for U.S. Agricultural Trade/AES-76/November 29, 2012
Economic Research Service, USDA
U.S. imports expanded the fastest from South and Southeast Asia in the past decade. Imports of tropical products (sugar, coffee, cocoa, rubber), vegetable oils (coconut, palm, palm kernel), fruits/vegetables/nuts, and grains (rice) topped the rankings. Processed fruit (apple juice) and vegetables and feeds are China’s main exports. From India, the chief imports include food thickeners (mucilages), spices, cashew nuts, and essential oils. Indonesia is a key source of rubber, coffee, and coconut oil; Thailand supplies rubber, fruits, and rice. From South and Central America, horticultural and tropical products are the principal imports. Among the top horticultural imports from South America are fresh fruits, fruit juices, wine, cut flowers, fresh and processed vegetables, and tree nuts. The major tropical products from South America are coffee, sugar, and cocoa. Beef and veal from Brazil, Uruguay, and Argentina are also a major import. Central America’s largest exports to the United States are bananas, pineapples, melons, vegetables, coffee, and sugar.

12 Outlook for U.S. Agricultural Trade/AES-76/November 29, 2012
Economic Research Service, USDA
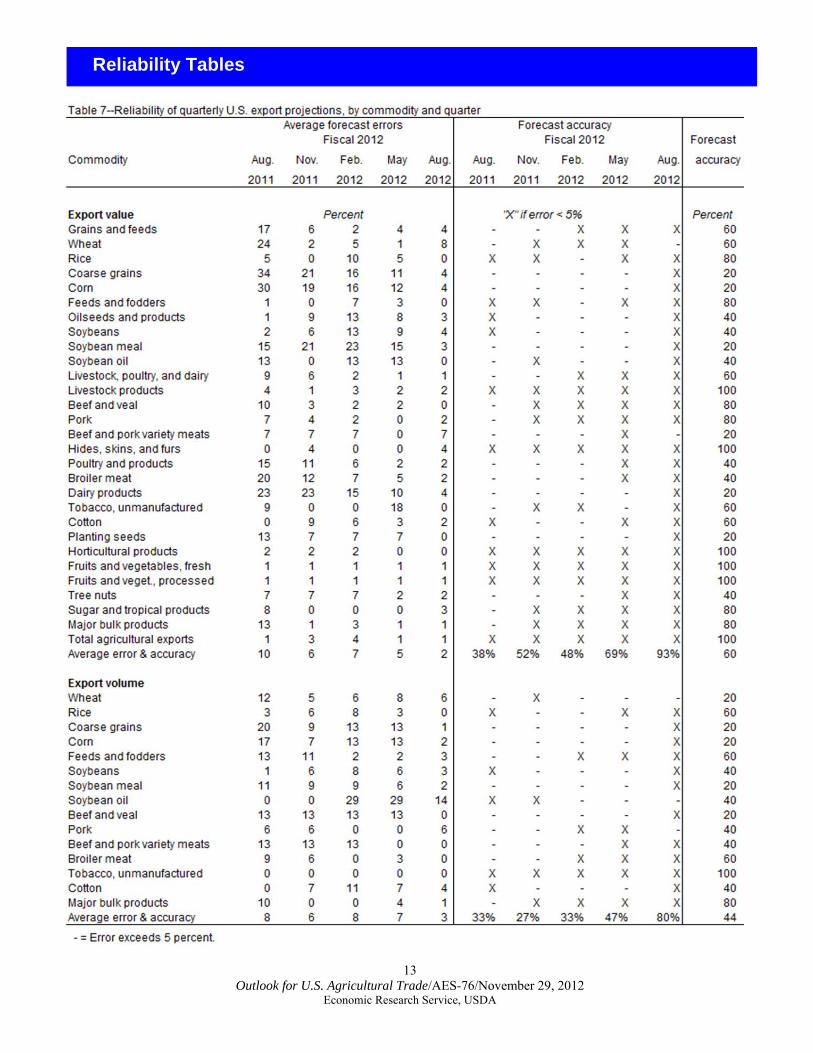
Reliability Tables
13 Outlook for U.S. Agricultural Trade/AES-76/November 29, 2012
Economic Research Service, USDA

14 Outlook for U.S. Agricultural Trade/AES-76/November 29, 2012
Economic Research Service, USDA

15 Outlook for U.S. Agricultural Trade/AES-76/November 29, 2012
Economic Research Service, USDA

16 Outlook for U.S. Agricultural Trade/AES-76/November 29, 2012
Economic Research Service, USDA

USDA is an equal opportunity provider and employer. USDA is an equal opportunity provider and employer.
February 21-22, 2013Crystal Gateway Marriott HotelArlington, Virginia
February 21-22, 2013Crystal Gateway Marriott HotelArlington, Virginia
www.usda.gov/oce/forum

Contact Information
18 Outlook for U.S. Agricultural Trade/AES-76/November 29, 2012
Economic Research Service, USDA
Forecast Coordinators (area code 202) Exports: Oliver Flake/FAS, 720-1226, [email protected] Imports: Andy Jerardo/ERS, 694-5266, [email protected] Commodity Specialist Contacts (area code 202) Grains and Feeds: Coarse Grains: Edward W. Allen/ERS, 694-5288 Rich ard O’Meara/FAS, 720-4933 Wheat: Edward W. Allen/ERS, 694-5288 Teresa McKeivier/FAS, 690-1151 Rice: Nathan Childs/ERS, 694-5292 Debbie Rubas/FAS, 720-1073 Oilseeds: Mark Ash/ERS, 694-5289 Bill George/FAS, 720-6234 Cotton: James Johnson/FAS, 690-1546 Leslie Meyer/ERS, 694-5307 Livestock, Poultry & Dairy Products: Beef & Cattle: Claire Mezoughem/FAS, 720-7715 Pork & Hogs: Leslie Ahmed/FAS, 720-2781 Poultry: Dave Harvey/ERS, 694-5177 Lazaro Sandoval/FAS, 690-8478 Dairy Products: Paul Kiendl/FAS, 720-8870 Horticultural & Tropical Products: Deciduous Fresh Fruit: Meyra Mendoza-Reeder/FAS, 720-0262 Fresh Citrus: Reed Blauer/FAS, 720-0898 Vegetables & Preparations: Andy Sowell/FAS, 720-0262 Tree Nuts: Tony Halstead/FAS, 690-4620 Sugar and Tropical Products: Reed Blauer/FAS, 720-0898 Sugar: Ron Lord/FAS, 720-6939 Macroeconomics Contact (area code 202) David Torgerson/ERS, 694-5334, [email protected] Publication Coordinator (area code 202) Stephen MacDonald/ERS, 694-5305, [email protected] Related Websites Outlook for U.S. Agricultural Trade http://usda.mannlib.cornell.edu/MannUsda/viewDocumentInfo.do?documentID=1196 Foreign Agricultural Service homepage: http://www.fas.usda.gov/ Economic Research Service homepage: http://www.ers.usda.gov/ U.S. Trade Data: http://www.fas.usda.gov/gats FAQ & Summary Data: hhttp://www.ers.usda.gov/data-products/foreign-agricultural-trade-of-the-united-states-(fatus).aspx Articles on U.S. Trade: http://www.ers.usda.gov/topics/international-markets-trade/us-agricultural-trade.aspx
The U.S. Department of Agriculture (USDA) prohibits discrimination in all its programs and activities on the basis of race, color, national origin, age, disability, and, where applicable, sex, marital status, familial status, parental status, religion, sexual orientation, genetic information, political beliefs, reprisal, or because all or a part of an individual’s income is derived from any public assistance program. (Not all prohibited bases apply to all programs.) Persons with disabilities who require alternative means for communication of program information (Braille, large print, audiotape, etc.) should contact USDA’s TARGET Center at (202) 720-2600 (voice and TDD). To file a complaint of discrimination write to USDA, Director, Office of Civil Rights, 1400 Independence Avenue, S.W., Washington, D.C. 20250-9410 or call (800) 795-3272 (voice) or (202) 720-6382 (TDD). USDA is an equal opportunity provider and employer.
E-mail Notification Readers of ERS outlook reports have two ways they can receive an e-mail notice about release of reports and associated data. • Receive timely notification (soon after the report is posted on the web) via USDA’s Economics, Statistics and Market Information System (which is housed at Cornell University’s Mann Library). Go to http://usda.mannlib.cornell.edu/MannUsda/aboutEmailService.do and follow the instructions to receive e-mail notices about ERS, Agricultural Marketing Service, National Agricultural Statistics Service, and World Agricultural Outlook Board products. • Receive weekly notification (on Friday afternoon) via the ERS website. Go to http://www.ers.usda.gov/Updates/ and follow the instructions to receive notices about ERS outlook reports, Amber Waves magazine, and other reports and data products on specific topics. ERS also offers RSS (really simple syndication) feeds for all ERS products. Go to http://www.ers.usda.gov/rss/ to get started.