Outlook for Renewable Energy Marketeneken.ieej.or.jp/data/6927.pdf-term Outlook:Germany Renewable...
20
IEEJ:September 2016 © IEEJ2016 Outlook for Renewable Energy Market The Institute of Energy Economics, Japan Yoshiaki Shibata Senior Economist, Manager, New and Renewable Energy Group, New and Renewable Energy & International Cooperation Unit 423 rd Forum on Research Works on July 26, 2016
Transcript of Outlook for Renewable Energy Marketeneken.ieej.or.jp/data/6927.pdf-term Outlook:Germany Renewable...

IEEJ:September 2016 © IEEJ2016
Outlook for Renewable Energy Market
The Institute of Energy Economics, Japan
Yoshiaki Shibata
Senior Economist, Manager, New and Renewable Energy Group, New and Renewable Energy & International Cooperation Unit
423rd Forum on Research Works on July 26, 2016

IEE
J ©
201
6
0
200
400
600
800
1,000
1,200
1,400
1,600
1,800
2,000
200
5
200
6
200
7
200
8
200
9
201
0
201
1
201
2
201
3
201
4
201
5
GW
Marine
Solar
Wind
Geothermal
Biomass
Hydro
0%
5%
10%
15%
20%
25%
0
1,000
2,000
3,000
4,000
5,000
6,000
7,000
8,000
200
5
200
6
200
7
200
8
200
9
201
0
201
1
201
2
201
3
201
4
201
5
TWh
World Renewable Energy Expansion
Renewable energy power generation capacity exceeded 1,800 GW in 2015. Renewable
power generation accounted for 24% of total power generation (the share includes 17
percentage points for hydro, 4 points for wind and 1 point for solar energy).
1 Source: Estimated from IEA, IRENA, REN21
Note: Including large-scale hydro power generation, excluding pumped-storage power generation
Accumulated capacity
Share of total power
generation (right scale)
Power generation
IEEJ:September 2016 © IEEJ2016
IEE
J ©
201
6
0
20
40
60
80
100
2005 2006 2007 2008 2009 2010 2011 2012 2013 2014 2015
GW/year
Others
Africa
Middle East
Oceania
Asia
Non-OECD Europe
OECD Europe
Latin America
North America
0
10
20
30
40
50
2005 2006 2007 2008 2009 2010 2011 2012 2013 2014 2015
GW/year
Others
Africa
Middle East
Oceania
Asia
Non-OECD Europe
OECD Europe
Latin America
North America
31
8
6
3 01
0
20
40
60
80
100
120
140
160
180
GW
Δ2015
Δ2014
2013
151
10
7
0
4
0
10
20
30
40
50
60
GW
Δ2015
Δ2014
2013
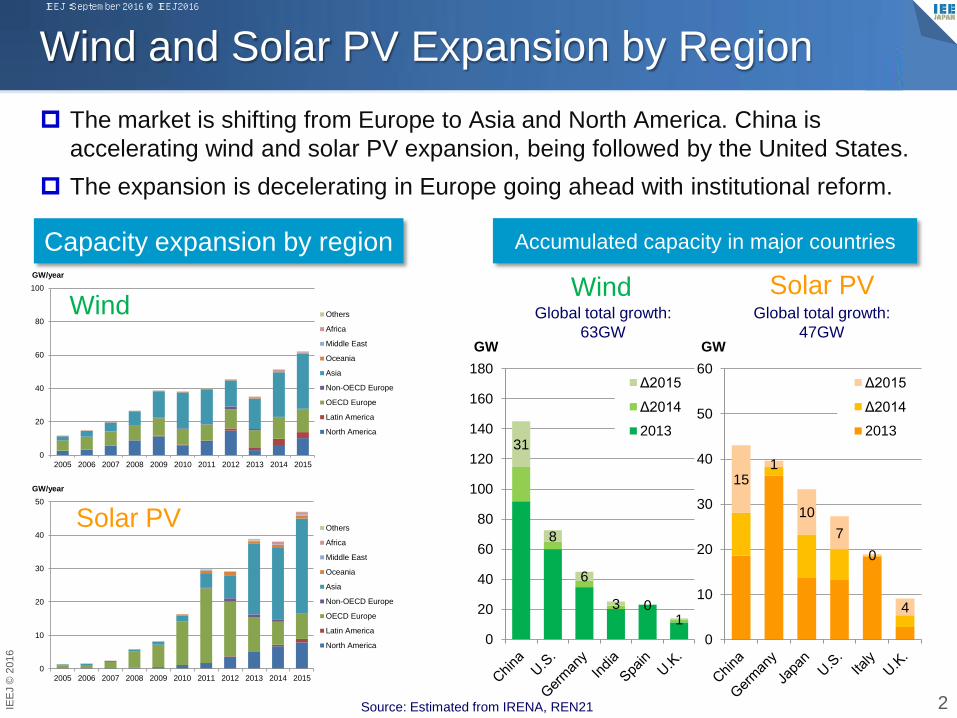
Wind and Solar PV Expansion by Region
The market is shifting from Europe to Asia and North America. China is
accelerating wind and solar PV expansion, being followed by the United States.
The expansion is decelerating in Europe going ahead with institutional reform.
2 Source: Estimated from IRENA, REN21
Capacity expansion by region Accumulated capacity in major countries
Global total growth:
63GW
Wind
Solar PV
Wind Solar PV Global total growth:
47GW
IEEJ:September 2016 © IEEJ2016
IEE
J ©
201
6
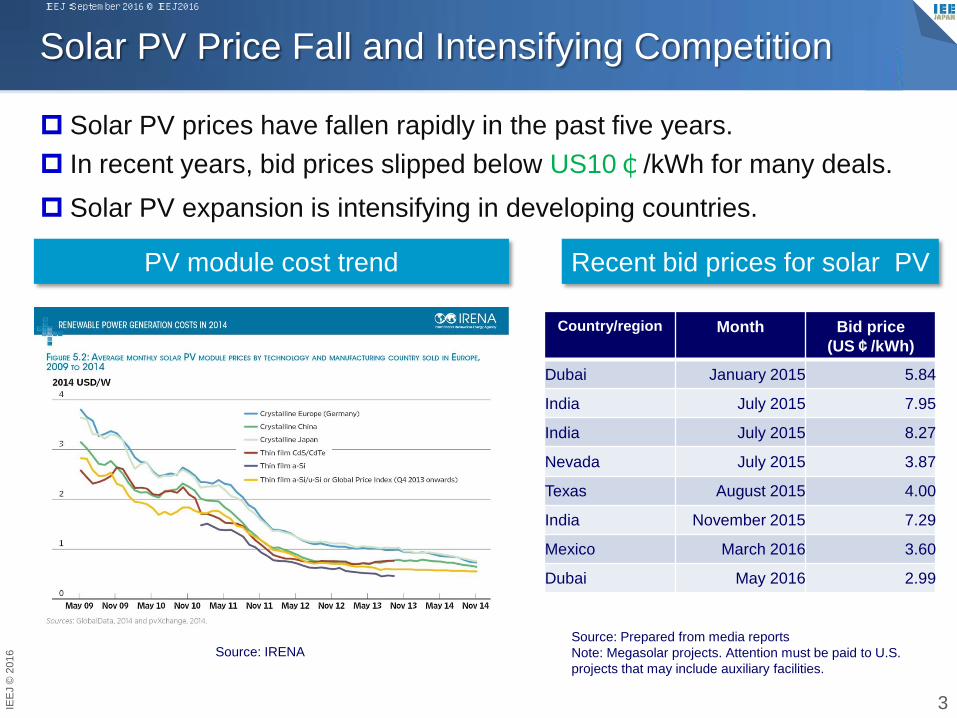
Solar PV Price Fall and Intensifying Competition
Solar PV prices have fallen rapidly in the past five years.
In recent years, bid prices slipped below US10¢/kWh for many deals.
Solar PV expansion is intensifying in developing countries.
3
Source: IRENA
PV module cost trend Recent bid prices for solar PV
Source: Prepared from media reports
Note: Megasolar projects. Attention must be paid to U.S.
projects that may include auxiliary facilities.
Country/region Month Bid price
(US¢/kWh)
Dubai January 2015 5.84
India July 2015 7.95
India July 2015 8.27
Nevada July 2015 3.87
Texas August 2015 4.00
India November 2015 7.29
Mexico March 2016 3.60
Dubai May 2016 2.99
IEEJ:September 2016 © IEEJ2016
IEE
J ©
201
6
0
100
200
300
400
500
600
700
800
900
1000
2010 2011 2012 2013 2014 2015
TWh PV Germany
Italy
Spain
France
U.K.
Others
Wind Germany
Italy
Spain
Sweden
France
Others
0
100
200
300
400
500
600
700
800
900
1000
2010 2011 2012 2013 2014 2015
TWh
Steam coal Germany
U.K.
Poland
Spain
Italy
Others
Brown coal Germany
Poland
Czech Republic
Greece
Bulgaria Others0
100
200
300
400
500
600
700
800
900
1000
2010 2011 2012 2013 2014 2015
TWh
Italy
Others
Spain
U.K.
Germany
Netherlands
768 485
679923
0
500
1000
1500
2000
2500
3000
3500
4000
2010 2011 2012 2013 2014 2015
TWh
Nuclear
Coal
Natural gas
Renewables
3,2043,337
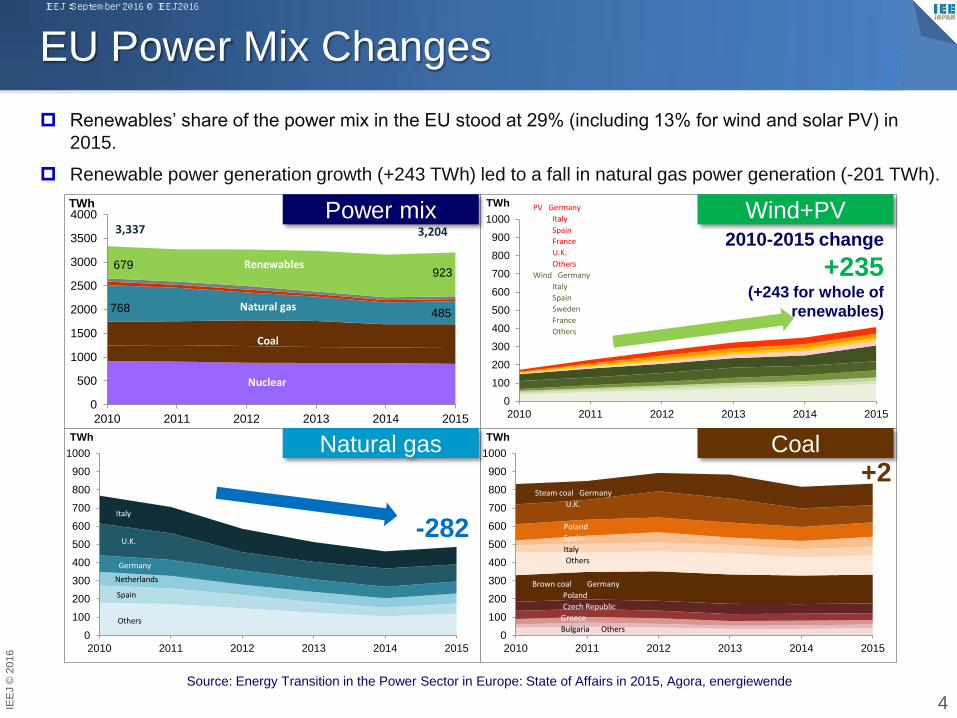
EU Power Mix Changes
Renewables’ share of the power mix in the EU stood at 29% (including 13% for wind and solar PV) in
2015.
Renewable power generation growth (+243 TWh) led to a fall in natural gas power generation (-201 TWh).
4
Wind+PV
Coal Natural gas
Source: Energy Transition in the Power Sector in Europe: State of Affairs in 2015, Agora, energiewende
2010-2015 change
+235 (+243 for whole of
renewables)
-282
+2
Power mix
IEEJ:September 2016 © IEEJ2016

IEE
J ©
201
6
8
-32
-76
-3
30
3
17
8 2
-100
-80
-60
-40
-20
0
20
40
TWh
-49
10
-30
-3
50
-2
15
27
1
-60
-40
-20
0
20
40
60
TWh
Electricity source shift: Germany, U.K.
Germany Renewables’ share of the power mix stood at 30.1% (19%
for wind and solar PV) in 2015 (their share of total power
consumption stood at 32.6%).
In the past five years, wind and solar PV power generation
expanded substantially, with natural gas power generation
falling substantially.
5
U.K. Renewables’ share of the power mix stood at 25.7% (14%
for wind and solar PV) in 2015.
While power demand declined, wind and biomass power
generation increased substantially in the past five years,
with natural gas and coal power generation decreasing
substantially.
Sources: Energy Trends, DECC, etc. Sources: AGEB, etc.
Changes by electricity source
(2010⇒2015)
Changes by electricity source
(2010⇒2015)
IEEJ:September 2016 © IEEJ2016
IEE
J ©
201
6
0
1,000
2,000
3,000
4,000
5,000
2013 2014 2015 2016 2017
MWOnshore wind power generation
5000
1,000
2,000
3,000
4,000
2013 2014 2015 2016 2017
MWSolar PV
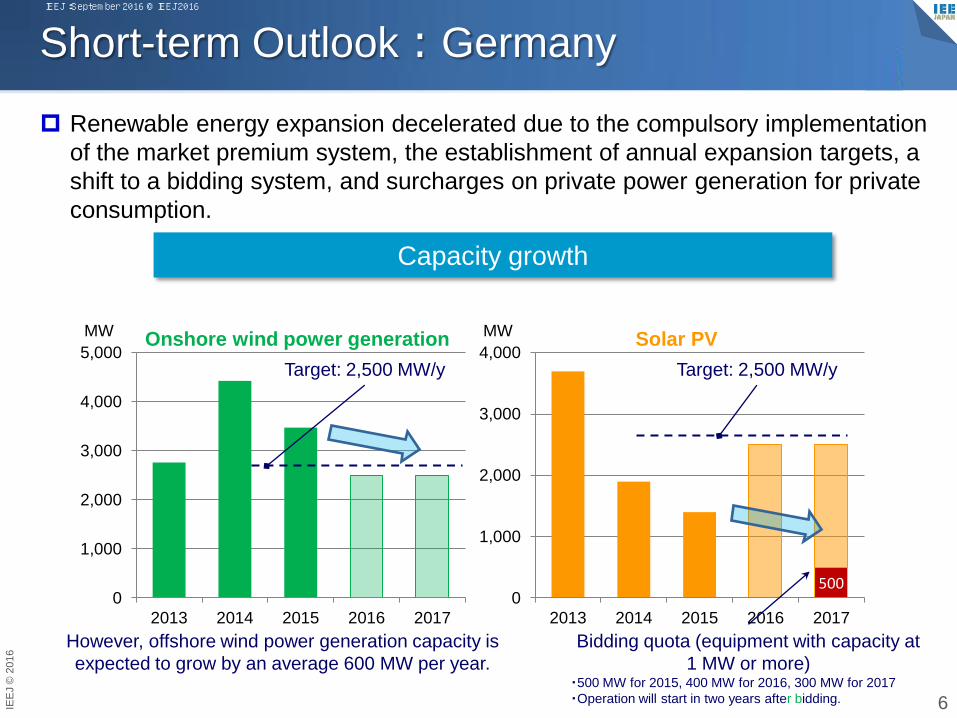
Short-term Outlook:Germany
Renewable energy expansion decelerated due to the compulsory implementation
of the market premium system, the establishment of annual expansion targets, a
shift to a bidding system, and surcharges on private power generation for private
consumption.
6
Capacity growth
Target: 2,500 MW/y Target: 2,500 MW/y
Bidding quota (equipment with capacity at
1 MW or more) ・500 MW for 2015, 400 MW for 2016, 300 MW for 2017
・Operation will start in two years after bidding.
However, offshore wind power generation capacity is
expected to grow by an average 600 MW per year.
IEEJ:September 2016 © IEEJ2016
IEE
J ©
201
6
0
500
1,000
1,500
2,000
2013 2014 2015 2016 2017
MW Onshore wind power generation
0
1,000
2,000
3,000
4,000
2013 2014 2015 2016 2017
MW Solar PV
0
500
1,000
1,500
2,000
2013 2014 2015 2016 2017
MW Offshore wind power generation
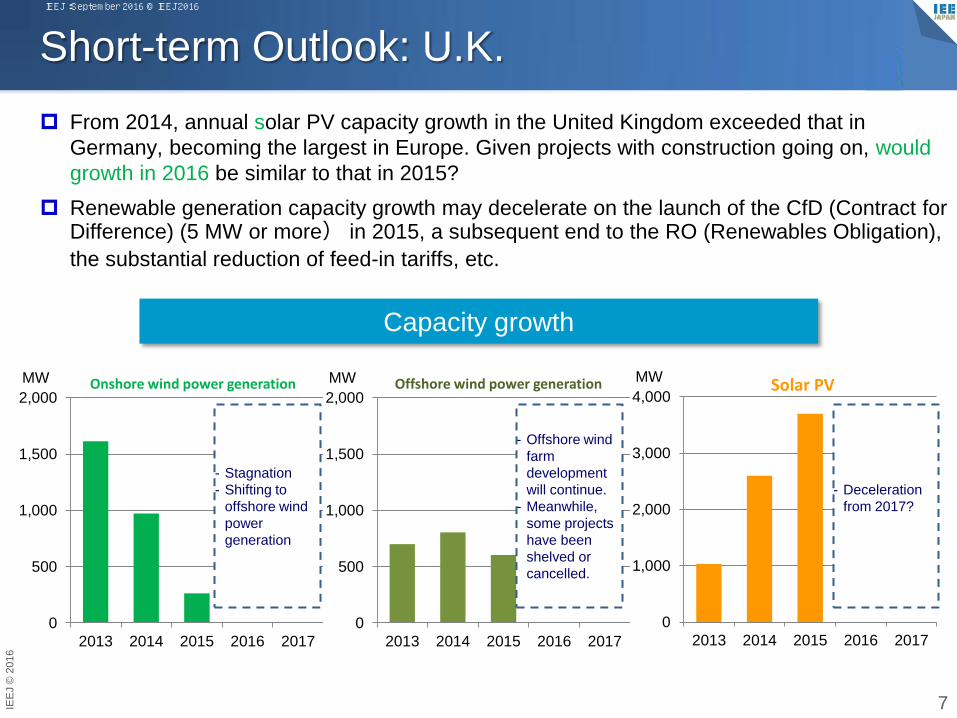
Short-term Outlook: U.K.
From 2014, annual solar PV capacity growth in the United Kingdom exceeded that in
Germany, becoming the largest in Europe. Given projects with construction going on, would
growth in 2016 be similar to that in 2015?
Renewable generation capacity growth may decelerate on the launch of the CfD (Contract for Difference) (5 MW or more) in 2015, a subsequent end to the RO (Renewables Obligation),
the substantial reduction of feed-in tariffs, etc.
7
Capacity growth
- Deceleration
from 2017?
- Offshore wind
farm
development
will continue.
- Meanwhile,
some projects
have been
shelved or
cancelled.
- Stagnation
- Shifting to
offshore wind
power
generation
IEEJ:September 2016 © IEEJ2016
IEE
J ©
201
6
0
2,000
4,000
6,000
8,000
10,000
12,000
14,000
16,000
2001 2004 2007 2010 2013
MWOnshore power generation
-10
-491
349
-9
96
-9
8 25 1 2
-600
-500
-400
-300
-200
-100
0
100
200
300
400
TWh
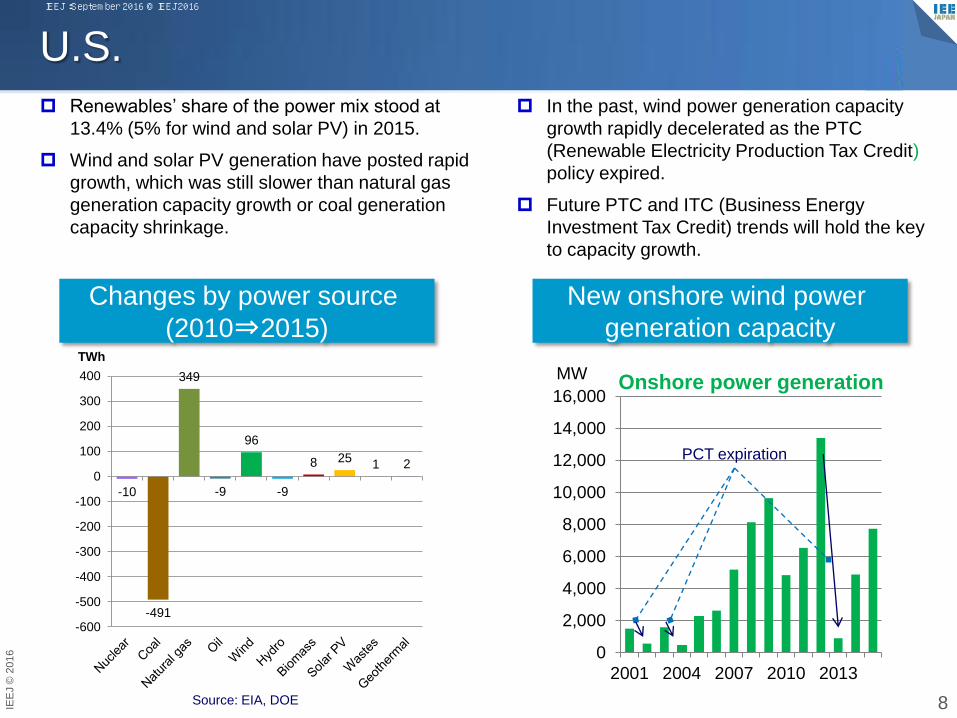
U.S.
Renewables’ share of the power mix stood at
13.4% (5% for wind and solar PV) in 2015.
Wind and solar PV generation have posted rapid
growth, which was still slower than natural gas
generation capacity growth or coal generation
capacity shrinkage.
8 Source: EIA, DOE
In the past, wind power generation capacity
growth rapidly decelerated as the PTC
(Renewable Electricity Production Tax Credit)
policy expired.
Future PTC and ITC (Business Energy
Investment Tax Credit) trends will hold the key
to capacity growth.
Changes by power source
(2010⇒2015)
New onshore wind power
generation capacity
PCT expiration
IEEJ:September 2016 © IEEJ2016

IEE
J ©
201
6
Summary of World Trends
Developed countries After driving renewable energy expansion, major European countries,
though expected to expand renewable energy further over a long term,
are exploring how best to reduce the burden on consumers and
integrate renewable energy into the electricity market to break away
from the FIT system.
Amid the institutional reform, renewable energy expansion will
decelerate over a short term.
Developing countries
Solar PV is expanding in developing countries as well thanks to cost
cuts and competitive bidding. The elimination of subsidies for
traditional energy sources also supports renewable energy expansion.
However, developing countries are required to address a great
number of challenges including grid stabilization, the rising burden on
consumers under the FIT system and an industrial shakeout under
excessive competition. 9
IEEJ:September 2016 © IEEJ2016
IEE
J ©
201
6
0
10
20
30
40
50
60
70
80
90
100
7 10 1 4 7 10 1 4 7 10 1 4 7 10 1
2012 2013 2014 2015 2016
GW Small/medium-scale hydro
Geothermal
Biomass
Wind
Non-residential solar PV
Residential solar PV
0
5
10
15
20
25
30
7 10 1 4 7 10 1 4 7 10 1 4 7 10 1
2012 2013 2014 2015 2016
GW Small/medium-scale hydro
Geothermal
Biomass
Wind
Non-residential solar PV
Residential solar PV
0
10
20
30
40
50
Solar PV(non-residential)
Wind Solar PV(residential)
Others
Trilli
on y
en Approved
capacity
Approvedcapacity inoperation
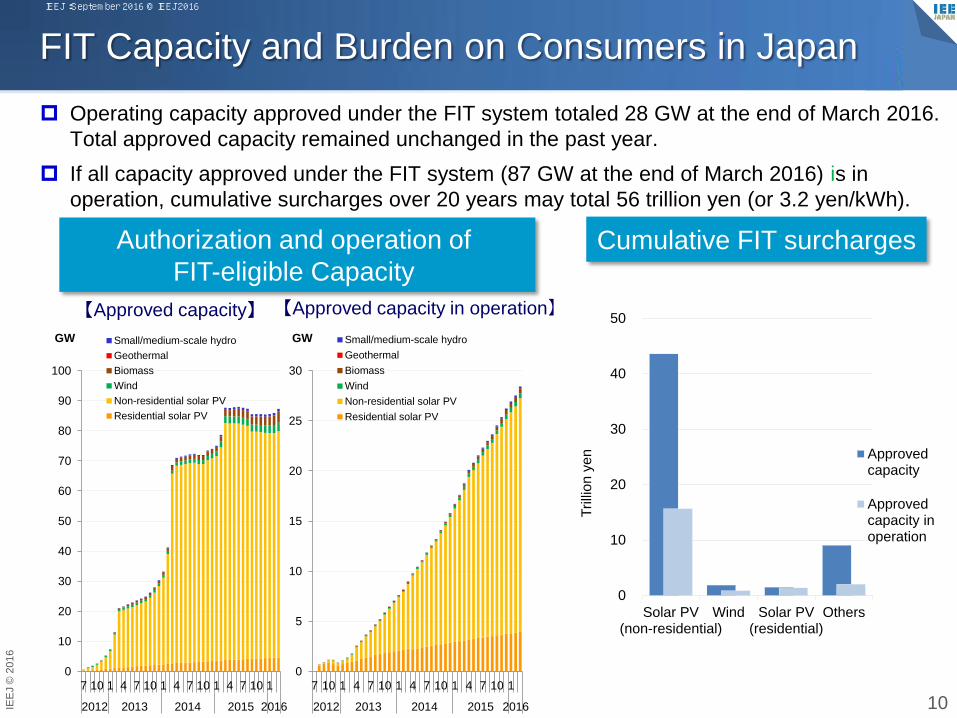
FIT Capacity and Burden on Consumers in Japan
Operating capacity approved under the FIT system totaled 28 GW at the end of March 2016.
Total approved capacity remained unchanged in the past year.
If all capacity approved under the FIT system (87 GW at the end of March 2016) is in
operation, cumulative surcharges over 20 years may total 56 trillion yen (or 3.2 yen/kWh).
10
Cumulative FIT surcharges Authorization and operation of
FIT-eligible Capacity
【Approved capacity】 【Approved capacity in operation】
IEEJ:September 2016 © IEEJ2016
IEE
J ©
201
6
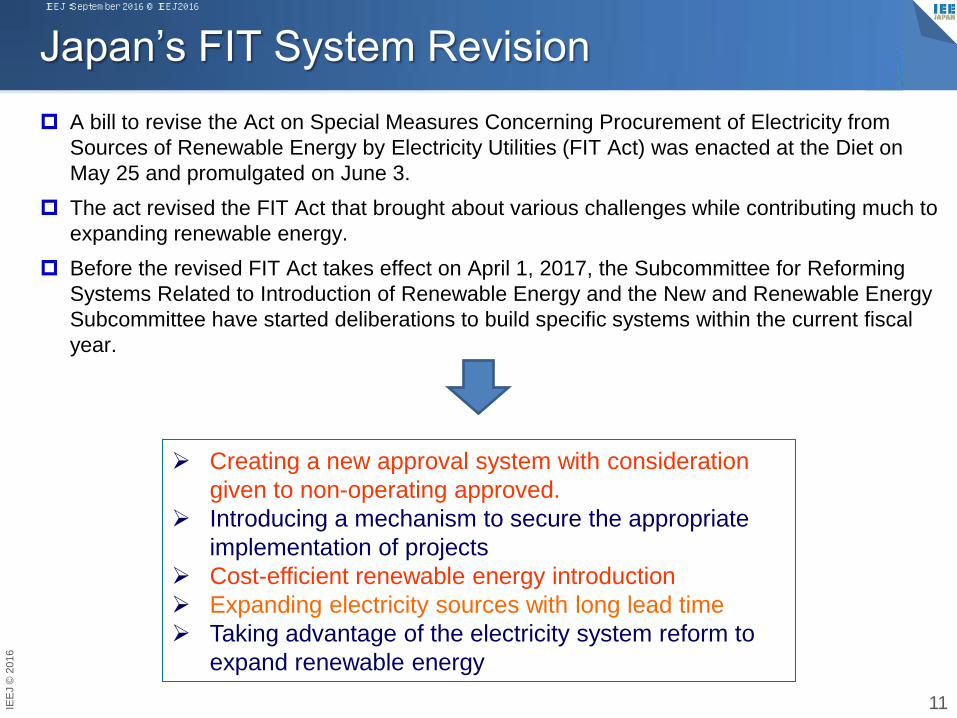
Japan’s FIT System Revision
A bill to revise the Act on Special Measures Concerning Procurement of Electricity from
Sources of Renewable Energy by Electricity Utilities (FIT Act) was enacted at the Diet on
May 25 and promulgated on June 3.
The act revised the FIT Act that brought about various challenges while contributing much to
expanding renewable energy.
Before the revised FIT Act takes effect on April 1, 2017, the Subcommittee for Reforming
Systems Related to Introduction of Renewable Energy and the New and Renewable Energy
Subcommittee have started deliberations to build specific systems within the current fiscal
year.
11
Creating a new approval system with consideration
given to non-operating approved.
Introducing a mechanism to secure the appropriate
implementation of projects
Cost-efficient renewable energy introduction
Expanding electricity sources with long lead time
Taking advantage of the electricity system reform to
expand renewable energy
IEEJ:September 2016 © IEEJ2016
IEE
J ©
201
6
35
14
2629
0
5
10
15
20
25
30
35
40
Approved Operating
GW
40
9
1416
0
5
10
15
20
25
30
35
40
45
Approved Operating
GW
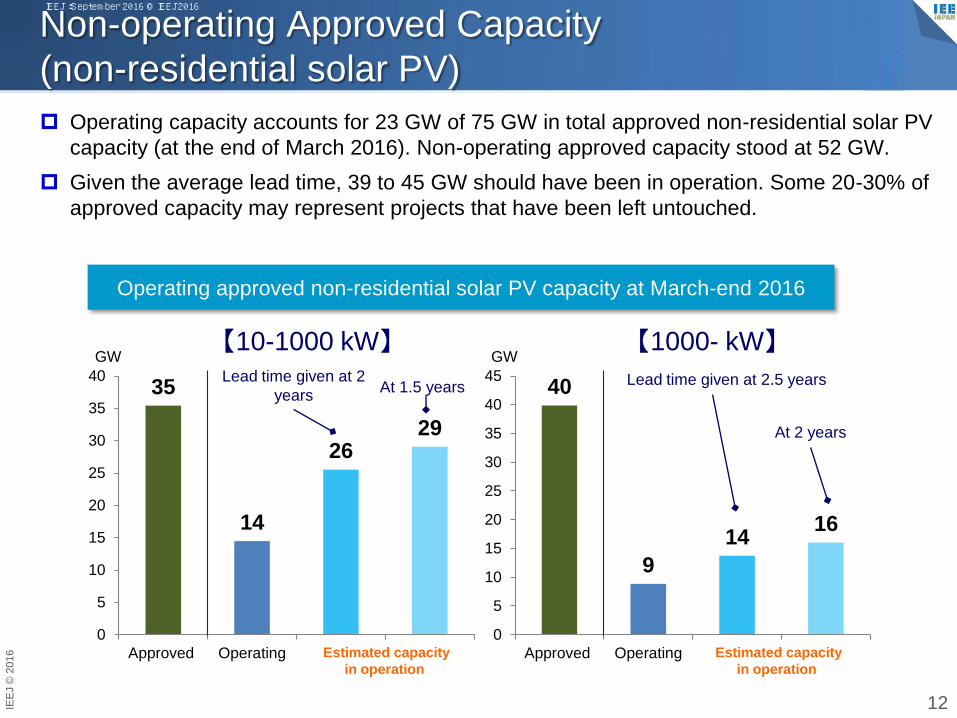
Non-operating Approved Capacity
(non-residential solar PV)
Operating capacity accounts for 23 GW of 75 GW in total approved non-residential solar PV
capacity (at the end of March 2016). Non-operating approved capacity stood at 52 GW.
Given the average lead time, 39 to 45 GW should have been in operation. Some 20-30% of
approved capacity may represent projects that have been left untouched.
12
Operating approved non-residential solar PV capacity at March-end 2016
【10-1000 kW】 【1000- kW】 Lead time given at 2
years Lead time given at 2.5 years
Estimated capacity
in operation
Estimated capacity
in operation
At 1.5 years
At 2 years
IEEJ:September 2016 © IEEJ2016
IEE
J ©
201
6
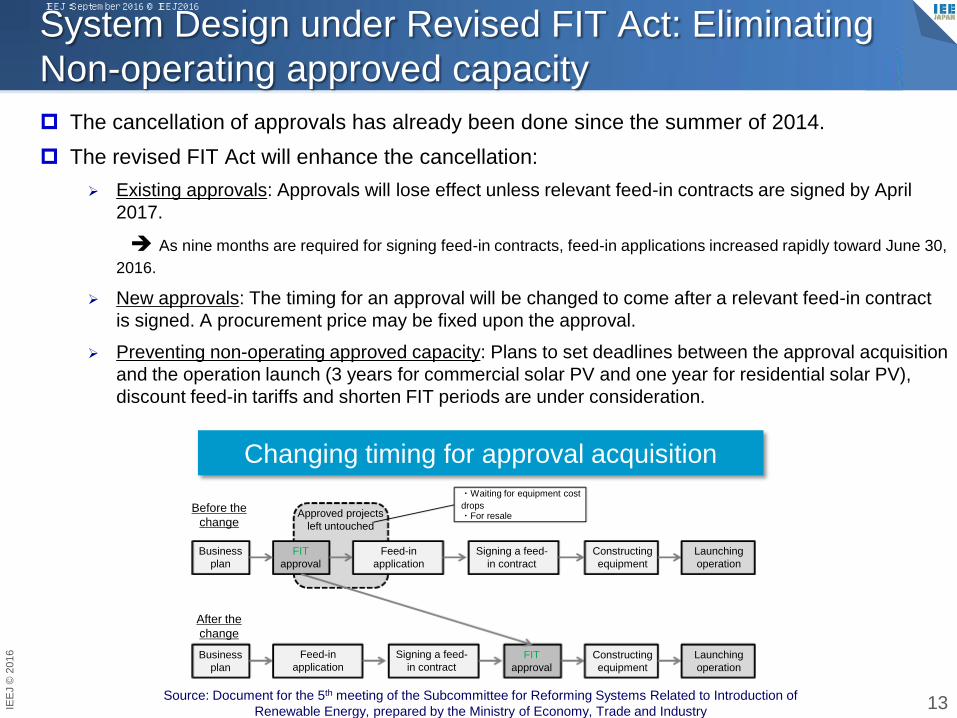
System Design under Revised FIT Act: Eliminating
Non-operating approved capacity
The cancellation of approvals has already been done since the summer of 2014.
The revised FIT Act will enhance the cancellation:
Existing approvals: Approvals will lose effect unless relevant feed-in contracts are signed by April
2017.
As nine months are required for signing feed-in contracts, feed-in applications increased rapidly toward June 30,
2016.
New approvals: The timing for an approval will be changed to come after a relevant feed-in contract
is signed. A procurement price may be fixed upon the approval.
Preventing non-operating approved capacity: Plans to set deadlines between the approval acquisition
and the operation launch (3 years for commercial solar PV and one year for residential solar PV),
discount feed-in tariffs and shorten FIT periods are under consideration.
13 Source: Document for the 5th meeting of the Subcommittee for Reforming Systems Related to Introduction of
Renewable Energy, prepared by the Ministry of Economy, Trade and Industry
Changing timing for approval acquisition
Business
plan
FIT
approval
Feed-in
application
Signing a feed-
in contract
Constructing
equipment
Launching
operation
Launching
operation
FIT
approval
Approved projects
left untouched
・Waiting for equipment cost
drops ・For resale
Before the
change
After the
change
Business
plan
Feed-in
application
Signing a feed-
in contract Constructing
equipment
IEEJ:September 2016 © IEEJ2016
IEE
J ©
201
6
0
5
10
15
20
25
30
35
40
45
2012 2013 2014 2015 2016
Yen/kWh
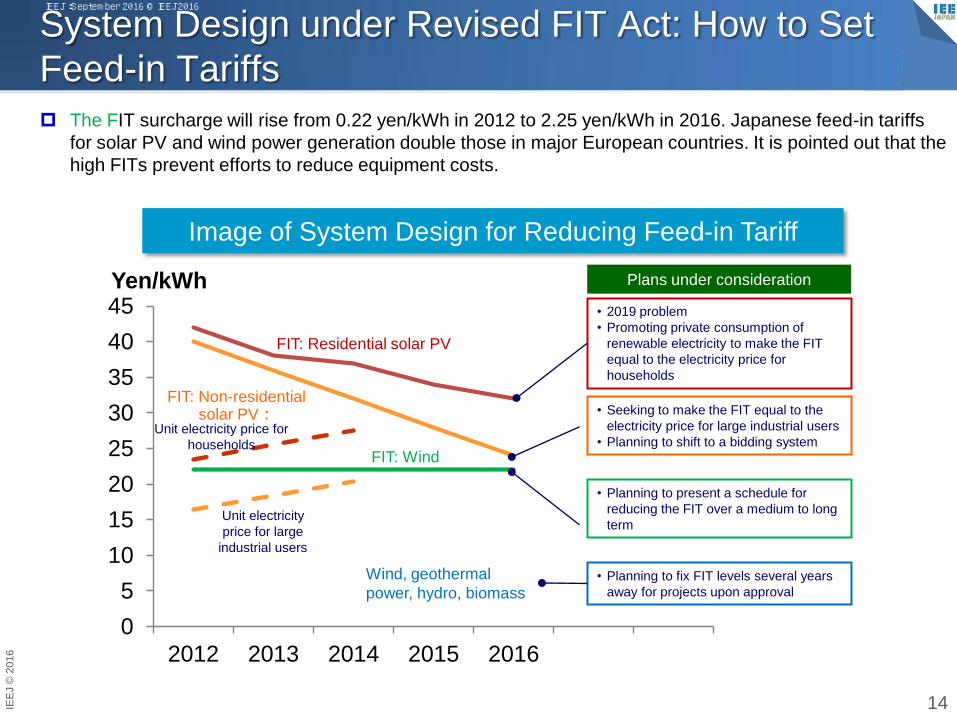
System Design under Revised FIT Act: How to Set
Feed-in Tariffs
The FIT surcharge will rise from 0.22 yen/kWh in 2012 to 2.25 yen/kWh in 2016. Japanese feed-in tariffs
for solar PV and wind power generation double those in major European countries. It is pointed out that the
high FITs prevent efforts to reduce equipment costs.
14
Image of System Design for Reducing Feed-in Tariff
FIT: Wind
FIT: Residential solar PV
FIT: Non-residential solar PV:
Unit electricity
price for large
industrial users
Unit electricity price for
households
• 2019 problem
• Promoting private consumption of
renewable electricity to make the FIT
equal to the electricity price for
households
• Seeking to make the FIT equal to the
electricity price for large industrial users
• Planning to shift to a bidding system
• Planning to present a schedule for
reducing the FIT over a medium to long
term
• Planning to fix FIT levels several years
away for projects upon approval
Wind, geothermal
power, hydro, biomass
Plans under consideration
IEEJ:September 2016 © IEEJ2016
IEE
J ©
201
6
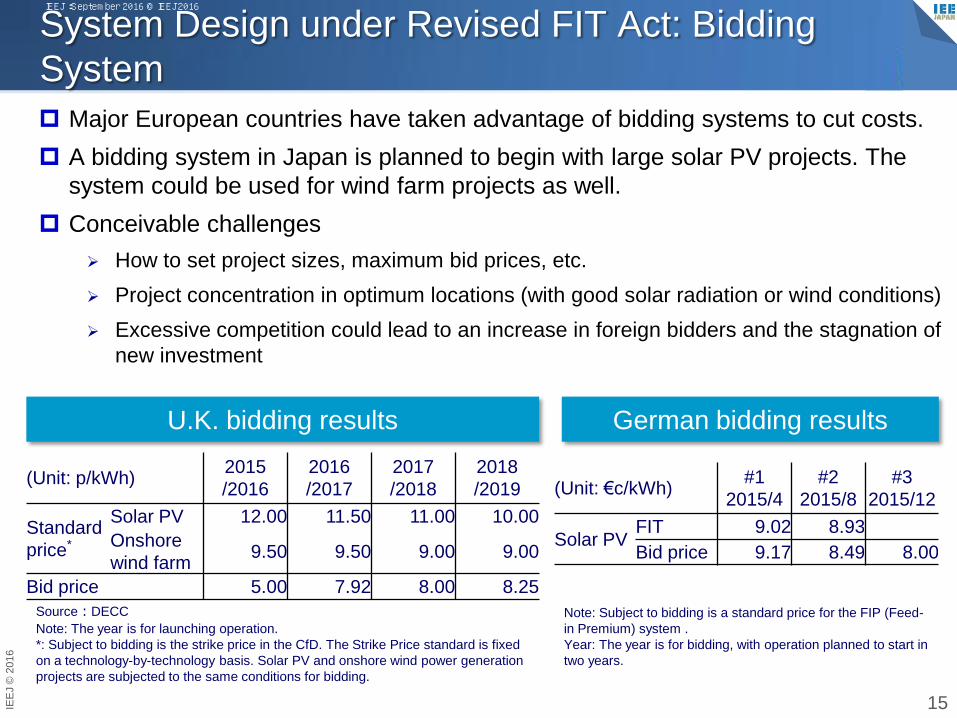
System Design under Revised FIT Act: Bidding
System
Major European countries have taken advantage of bidding systems to cut costs.
A bidding system in Japan is planned to begin with large solar PV projects. The
system could be used for wind farm projects as well.
Conceivable challenges
How to set project sizes, maximum bid prices, etc.
Project concentration in optimum locations (with good solar radiation or wind conditions)
Excessive competition could lead to an increase in foreign bidders and the stagnation of
new investment
15
U.K. bidding results
(Unit: p/kWh) 2015
/2016
2016
/2017
2017
/2018
2018
/2019
Standard
price*
Solar PV 12.00 11.50 11.00 10.00
Onshore
wind farm 9.50 9.50 9.00 9.00
Bid price 5.00 7.92 8.00 8.25
(Unit: €c/kWh) #1
2015/4
#2
2015/8
#3
2015/12
Solar PV FIT 9.02 8.93
Bid price 9.17 8.49 8.00
Source:DECC
Note: The year is for launching operation.
*: Subject to bidding is the strike price in the CfD. The Strike Price standard is fixed
on a technology-by-technology basis. Solar PV and onshore wind power generation
projects are subjected to the same conditions for bidding.
German bidding results
Note: Subject to bidding is a standard price for the FIP (Feed-
in Premium) system .
Year: The year is for bidding, with operation planned to start in
two years.
IEEJ:September 2016 © IEEJ2016
IEE
J ©
201
6
0
20
40
60
80
100
120
140
160
180
200
China U.S. Germany Japan India Italy Spain
GW
Solar
Wind
Geothermal
Biomass
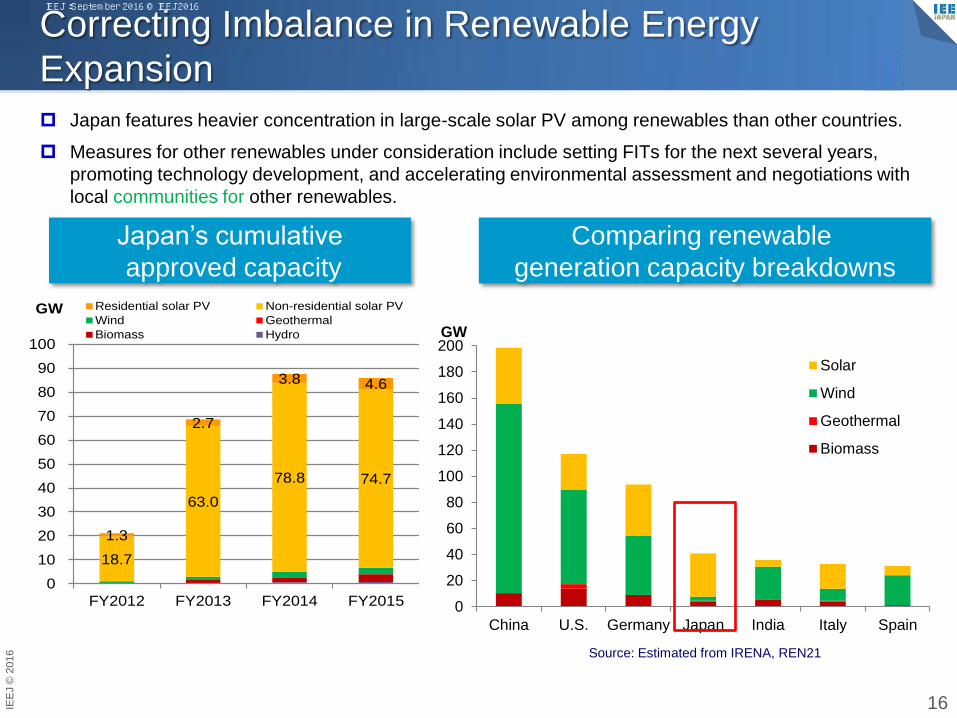
18.7
63.0
78.8 74.7
1.3
2.7
3.8 4.6
0
10
20
30
40
50
60
70
80
90
100
FY2012 FY2013 FY2014 FY2015
GW Residential solar PV Non-residential solar PV
Wind Geothermal
Biomass Hydro
Correcting Imbalance in Renewable Energy
Expansion
Japan features heavier concentration in large-scale solar PV among renewables than other countries.
Measures for other renewables under consideration include setting FITs for the next several years,
promoting technology development, and accelerating environmental assessment and negotiations with
local communities for other renewables.
16
Comparing renewable
generation capacity breakdowns
Source: Estimated from IRENA, REN21
Japan’s cumulative
approved capacity
IEEJ:September 2016 © IEEJ2016

IEE
J ©
201
6
0
20
40
60
80
100
120
140
0
50
100
150
200
250
300
Jan-1
2
Apr-
12
Jul-1
2
Oct-
12
Jan-1
3
Apr-
13
Jul-1
3
Oct-
13
Jan-1
4
Apr-
14
Jul-1
4
Oct-
14
Jan-1
5
Apr-
15
Jul-1
5
Oct-
15
Jan-1
6
Million units
Yen/Ah
Topic: Storage Battery Trends
In March 2016, one of the world’s largest NaS sodium-sulfur batteries (with
capacity at 300 MWh) started operation (on the grid side) in Buzen, Kyushu.
Prices of lithium-ion batteries for electric vehicles have declined rapidly. Storage
batteries on the demand side are expected to help stabilize the grid.
17
Source: Björn Nykvist and Måns Nilsson, ”Rapidly falling costs of battery packs for electric vehicles,” 2015 Source: Estimated from machinery production
statistics
World Japan
Unit price: Down 60% in
past 4 years
Sales
volume
Unit price
Lithium-ion battery (for vehicles) price trends
IEEJ:September 2016 © IEEJ2016
IEE
J ©
201
6
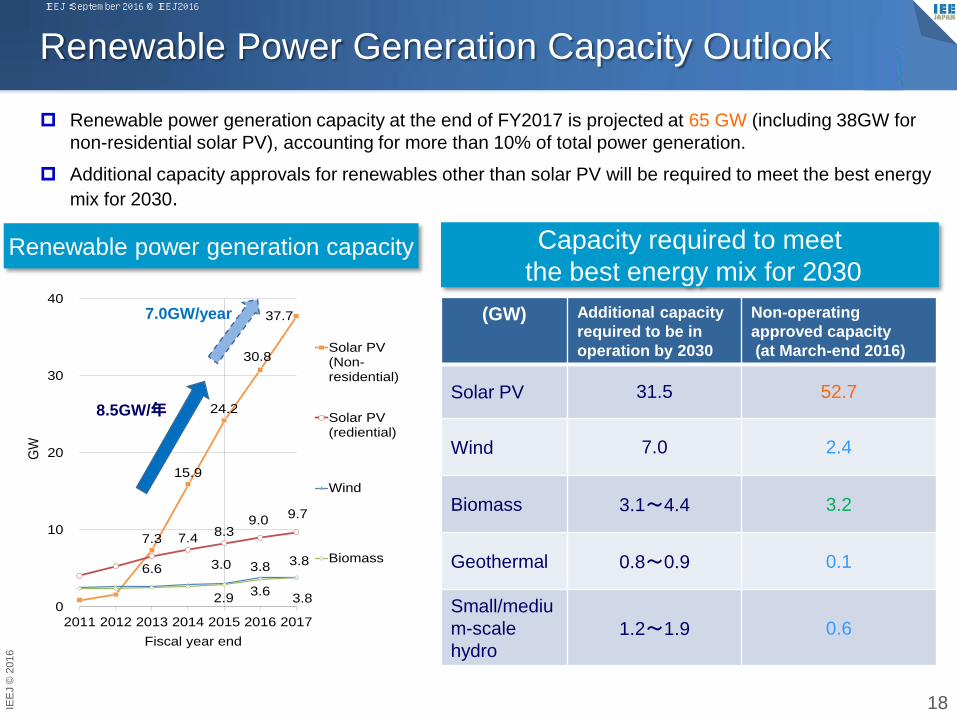
7.3
15.9
24.2
30.8
37.7
6.6
7.48.3
9.09.7
3.0 3.8 3.8
2.93.6
3.80
10
20
30
40
2011 2012 2013 2014 2015 2016 2017
GW
Fiscal year end
Solar PV(Non-residential)
Solar PV(rediential)
Wind
Biomass
Renewable Power Generation Capacity Outlook
Renewable power generation capacity at the end of FY2017 is projected at 65 GW (including 38GW for
non-residential solar PV), accounting for more than 10% of total power generation.
Additional capacity approvals for renewables other than solar PV will be required to meet the best energy
mix for 2030.
18
Renewable power generation capacity
8.5GW/年
7.0GW/year (GW) Additional capacity
required to be in
operation by 2030
Non-operating
approved capacity
(at March-end 2016)
Solar PV 31.5 52.7
Wind 7.0 2.4
Biomass 3.1~4.4 3.2
Geothermal 0.8~0.9 0.1
Small/mediu
m-scale
hydro
1.2~1.9 0.6
Capacity required to meet
the best energy mix for 2030
IEEJ:September 2016 © IEEJ2016
IEE
J ©
201
6
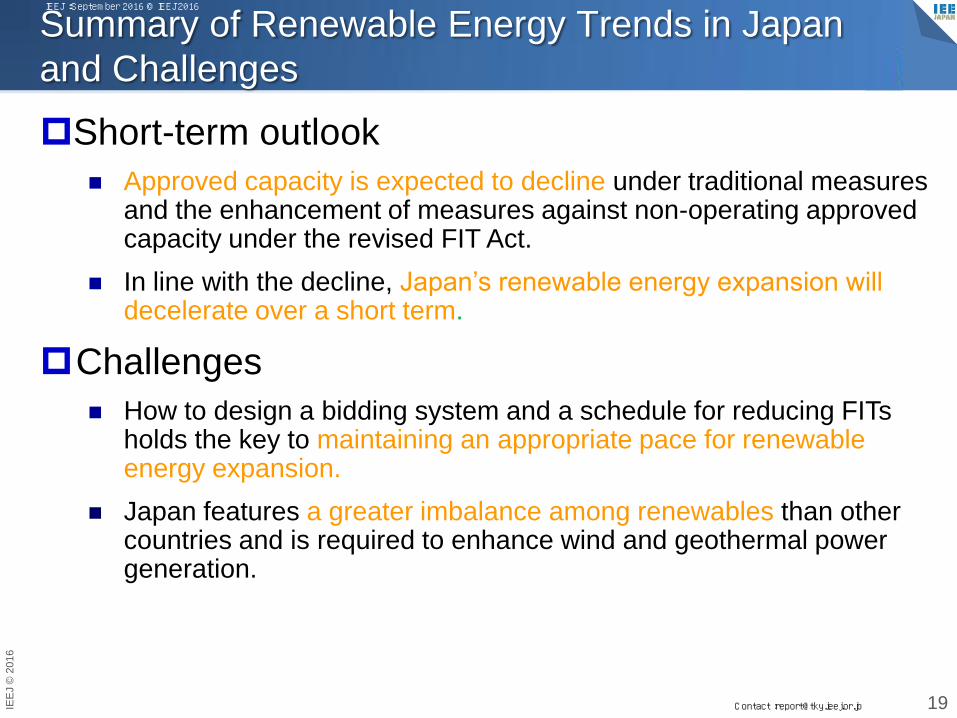
Summary of Renewable Energy Trends in Japan
and Challenges
Short-term outlook
Approved capacity is expected to decline under traditional measures and the enhancement of measures against non-operating approved capacity under the revised FIT Act.
In line with the decline, Japan’s renewable energy expansion will decelerate over a short term.
Challenges
How to design a bidding system and a schedule for reducing FITs holds the key to maintaining an appropriate pace for renewable energy expansion.
Japan features a greater imbalance among renewables than other countries and is required to enhance wind and geothermal power generation.
19
IEEJ:September 2016 © IEEJ2016
Contact :[email protected]


![Resources [renewable and non renewable]](https://static.fdocuments.us/doc/165x107/55643cd7d8b42ad3308b522b/resources-renewable-and-non-renewable.jpg)