Outlook for Competitive LNG Supply - NG 142F · LNG projects compete with other LNG and energy...
44
March 2019 OIES PAPER: NG 142 Outlook for Competitive LNG Supply Claudio Steuer, Senior Research Fellow, OIES
Transcript of Outlook for Competitive LNG Supply - NG 142F · LNG projects compete with other LNG and energy...

March 2019
OIES PAPER: NG 142
Outlook for Competitive LNG Supply
Claudio Steuer, Senior Research Fellow, OIES

i
Outlook for Competitive LNG Supply – March 2019
The contents of this paper are the author’s sole responsibility. They do not necessarily represent the views of the Oxford Institute for Energy Studies or any of
its members.
Copyright © 2019 Oxford Institute for Energy Studies
(Registered Charity, No. 286084)
This publication may be reproduced in part for educational or non-profit purposes without special permission from the copyright holder, provided acknowledgment of the source is made. No use of this publication may be made for resale or for any other commercial purpose whatsoever without prior permission in writing from the Oxford Institute for Energy Studies.
ISBN: 978-1-78467-131-0
DOI: https://doi.org/10.26889/9781784671310

ii
Outlook for Competitive LNG Supply – March 2019
Acknowledgements My grateful thank you to OIES colleagues for their review, insightful comments and suggestions: James Henderson, Howard Rogers, David Ledesma and Mike Fulwood. Special thank you to John Elkins for the thoughtful and excellent editing suggestions, and Kate Teasdale for her usual efficiency.
My appreciation for the data and comments provided by Giles Farrer and Andrew Buckland from Wood Mackenzie, Matthew Drinkwater from Argus Global LNG, Alex Thackrah from ICIS Global LNG, Thomas Thorkildsen from Höegh LNG and Hadi Farhoud from GTT.
The views expressed, and any mistakes that remain are solely my responsibility.

iii
Outlook for Competitive LNG Supply – March 2019
Preface Fifteen months ago Jonathan Stern published a paper entitled “Challenges to the Future of Gas: unburnable or unaffordable?” in which he argued that while the potential for gas demand in Europe would rely on meeting the challenge of decarbonisation, in many other parts of the world the key question would be whether the fuel could be competitive enough to encourage growing consumption. Indeed, in order to have a secure future in the non-OECD world Stern argued that LNG, which will be the key source of traded gas, would need to be priced in a range of US$6-8/mmbtu, and he challenged the industry to meet this goal.
This paper by Claudio Steuer seeks to address this challenge, as the author sets out his views on the next likely projects to reach FID in 2019-20, cost of delivered LNG from various supply sources to high and low-income market destinations. He provides an overview of upstream costs and analyses the likely transportation costs along multiple shipping routes, but perhaps most importantly provides a detailed analysis of the long-term trends in LNG liquefaction costs which will ultimately be a key driver in the future cost of delivered LNG.
He ultimately provides a relatively positive conclusion for the future of gas in terms of its affordability, as innovations in technology, upstream and midstream integration, project execution, and logistics indicate scope for further cost reductions, and suggests that while the need for improved air quality will be a key driver of gas demand there will also be a longer-term requirement to demonstrate how gas can contribute to global decarbonisation efforts.
James Henderson Director, Natural Gas Programme Oxford Institute for Energy Studies March 11th, 2019

iv
Outlook for Competitive LNG Supply – March 2019
Contents Acknowledgements .............................................................................................................. ii
Preface ................................................................................................................................ iii
Contents .............................................................................................................................. iv
Figures .................................................................................................................................. v
Tables ................................................................................................................................... v
Context for the paper ........................................................................................................... 1
Introduction ......................................................................................................................... 2
LNG Canada Ushers in a New Wave of LNG FIDs in 2019-20? ............................................... 3
Upstream Gas Supply Costs for 2025 .................................................................................... 5
Cost of Liquefaction Plant Projects ....................................................................................... 8
LNG Shipping Costs for 2025............................................................................................... 15
Gas and LNG Prices Outlook for 2025 ................................................................................. 18
Affordability and Competitiveness for High-Income and Low-Income Markets ................. 20
Conclusions ........................................................................................................................ 25
APPENDIX: LNG Shipping Technology Evolution and Costs post IMO 2020 ........................ 26
Glossary .............................................................................................................................. 36

v
Outlook for Competitive LNG Supply – March 2019
Figures Figure 1: Gazprom Reported Average Price of Production - $/mmBtu ................................................ 7 Figure 2: LNG Onshore Train Size Mtpa Growth – Past, Present, and Future 1975–2025 .................. 9 Figure 3: LNG Train Size Mtpa vs. Facility Size Mtpa (Recent and Proposed Initial Phase) .............. 10 Figure 4: Oil Price and LNG Plant Costs ($/tpa MOD) at FID 1967 – 2017 ........................................ 10 Figure 5: Oil Price and Cumulative Average LNG Plant ($/tpa US$ 2018) at FID 1967–2017 ............ 11 Figure 6: Five Year Moving Average of Oil and LNG Plant ($/tpa US$ 2018) at FID 1967–2017 ....... 12 Figure 7: Regression of LNG Plant ($/tpa MoD) at FID [All and High Cost Locations] vs. Oil Price 1967–2017 ...................................................................................................................................... 13 Figure 8: Global LNG Fleet .............................................................................................................. 15 Figure 9: LNG Fleet Propulsion Technology ..................................................................................... 16 Figure 10: Global LNG Fleet Orderbook by Propulsion Type ............................................................ 16 Figure 11: Main Energy Price Benchmarks, Short- and Long-Term Price Estimates to 2030 ............. 18 Figure 12: LNG Project Competitiveness $/mmBtu – High-Income Market Test – NWE 2025 ........... 21 Figure 13: LNG Project Competitiveness $/mmBtu – High-Income Market Test – JKTC 2025 ........... 21 Figure 14: LNG Project Competitiveness $/mmBtu – Low-Income Market Test – NWE 2025 ............ 22 Figure 15: LNG Project Competitiveness $/mmBtu – Low-Income Market Test – IPB 2025............... 22 Figure 16: LNG Ships Newbuild ($M) ............................................................................................... 26 Figure 17: Newbuild LNG Ship Price Indications .............................................................................. 27 Figure 18: Estimated Long-term and Spot Charter Rates US$ 000/day, 2011–2019 ......................... 28 Figure 19: IMO 2020 – Sulphur Content Specification – Global and Emission Control Areas ............ 29 Figure 20: 380cst RDAM HSFO Regression..................................................................................... 30 Figure 21: French Gasoil NWE Regression ...................................................................................... 30 Figure 22: 380cst SING HSFO Regression ...................................................................................... 31 Figure 23: Marine Gasoil SING Regression ...................................................................................... 31
Tables
Table 1: Potential LNG and FLNG Projects Aiming for FID in 2019–2020 ........................................... 4 Table 2: Plant Liquefaction Scope Complexity and Capital Investment Factor .................................. 14 Table 3: Indicative Liquefaction Plant Cost in $/tpa US$ 2018 and $/mmBtu US$ 2018 .................... 14 Table 4: LNG Shipping Costs $/mmBtu – January 2025 ................................................................... 17 Table 5: Energy Benchmarks - Gas/LNG Spot and Contract Prices $/mmBtu – January 2025 .......... 19 Table 6: LNG Shipping Costs US GOM $/mmBtu – 180K m3 ME-GI Tanker – January 2025 ........... 33 Table 7: LNG Shipping Costs W. Canada $/mmBtu – 180K m3 ME-GI Tanker – January 2025 ........ 33 Table 8: LNG Shipping Costs Mozambique $/mmBtu – 180K m3 ME-GI Tanker – January 2025 ...... 34 Table 9: LNG Shipping Costs Nigeria $/mmBtu – 180K m3 ME-GI Tanker – January 2025 .............. 34 Table 10: LNG Shipping Costs Qatar $/mmBtu – 267K m3 QMax SSD Tanker – January 2025........ 35 Table 11: LNG Shipping Costs Sakhalin $/mmBtu – 180K m3 ME-GI Tanker – January 2025 .......... 35

1
Context for the paper In October 2018, Shell, Petronas, Mitsubishi Corp., PetroChina Co. and Korea Gas Corp. announced the long-awaited final investment decision (FID) for LNG Canada, a $31.2 billion investment in unconventional gas supply from the vast resources in the Montney area comprising reserves development, a pipeline (GasLink) to the Port of Kitimat in Western Canada1 and a liquefaction plant with an initial capacity of 14 Mtpa. The planned in-service date is 2023.2
This is the first major greenfield LNG FID in a remote location since Yamal LNG took FID nearly 6 years ago, and adds more new LNG supply capacity worldwide than was added during 2016 and 2017 combined. It raises expectations for new FIDs in 2019-20 involving greenfield and brownfield LNG projects in Mozambique, Nigeria, Qatar, Russia and the United States. There are some 303 Mtpa of LNG projects under development seeking an FID over the next two years.
In OIES paper NG 125, Jonathan Stern examined the challenges facing the future of natural gas as a ‘transition fuel’ as the world steps up its efforts to meet the UN Conference of Parties COP21 targets up to 2030 and particularly beyond 2040 by decarbonizing power generation, space heating and transport. According to Stern, the key to natural gas fulfilling its potential as a ‘transition fuel’ is its ability to be delivered to high-income markets below $8/mmBtu, and to low-income markets below $6/mmBtu, to ensure that it does not become unaffordable and/or uncompetitive, long before its emissions make it unburnable. 3
In OIES paper NG 137, Brian Songhurst examined the significant capital cost reductions achieved by liquefaction plants mainly in the US Lower 48 states since the highs of LNG plants built during 2010–14. Costs have fallen from $2,000/tpa to $600–1,400/tpa – a reduction of 30 to 50% or more.4
The present paper seeks to examine trends in liquefaction plant costs over a long time period, LNG shipping costs post implementation of IMO 2020, and energy prices for 2025. This will form the background to an outlook for LNG supply with a particular focus on 5 key widespread areas for LNG supply seeking an FID between 2019-20 (Qatar, USA, Russia, Mozambique, and Nigeria). This paper also seeks to examine how well those LNG projects are able to meet Jonathan Stern’s affordability and competitiveness challenge for the future of gas, given the current perception of a “lower for longer” energy price environment.
1 ‘Shell, partners OK first major Canadian LNG project’, Argus Global LNG, Volume XIV, 10 October 2018, page 2 2 https://www.transcanada.com/en/announcements/2018/2018-10-02transcanada-to-construct-coastal-gaslink-pipeline-project/ 3 ‘Challenges to the Future of Gas: unburnable or unaffordable?’, Jonathan Stern, OIES Paper NG 125, December 2017 4 ‘LNG Plant Cost Reduction 2014-18’, Brian Songhurst, OIES Paper NG 137, October 2018

2
Introduction The competitiveness of an LNG project is defined by the capital costs of the liquefaction plant and also by upstream gas supply and LNG shipping costs, which can significantly strengthen or weaken its overall dynamic competitiveness. LNG projects seek to maximize profit and minimise volume and credit risk preferring LNG buyers offering the highest plant netback, high take-or-pay commitment and investment grade credit rating. These reduce the complexity of financing the approximate $20 billion of upstream and downstream investments a 10 Mtpa world-scale LNG plant tends to require.
Conversely, LNG buyers seek to minimize the delivered cost of LNG and take-or-pay commitments. Preference is given to LNG suppliers offering lowest cost and maximum operational and commercial flexibility to facilitate the management of take-or-pay commitments.
LNG projects compete with other LNG and energy alternatives available to the buyer. A growing number of LNG agreements offer time-bound and criteria-driven mechanisms to review prices fairly from the original commitment or last review to the present market reality over the life of the agreement. A 1 Mtpa 20-year LNG agreement is valued at approximately $9.6 billion based on a JKTC price of $8.75/mmBtu.
The future of gas is in large part intrinsically connected with the dynamic competitiveness of LNG projects in supplying the growing demand for gas distribution, power generation and transportation fuel. Success in replacing transportation fuels at sea and on land could unlock the ability to double current global LNG demand, and greatly accelerate the commoditisation of LNG.
This paper seeks to answer the following questions:
• What are the most promising areas/projects for new LNG FIDs in 2019-20?
• What are the indicative LNG plant costs for new LNG FIDs in 2019-20?
• How affordable and competitive are the new LNG FIDs in 2019-20?
In order to answer those questions, the paper adopts the following approach:
Research order of magnitude of LNG projects aiming for an FID in 2019-20, and select 5 key LNG supply areas capable of having new supplies available by 2025 over a wide geographic area.
Research and develop estimates for upstream gas supply costs; quantitative analysis of long-term LNG plant liquefaction costs and formulation of indicative cost benchmarks in $/tpa in 2018 US dollars; and modelling of LNG shipping costs under long-term time charters from the 5 selected LNG supply areas to the selected high/low income markets for 2025.
LNG affordability and competitiveness is assessed based on the estimated energy prices and LNG plant netback (excluding impact of taxes, royalties, fees, and financing cost) from high-income markets ($8/mmBtu) and low-income markets ($6/mmBtu) in line with Jonathan Stern’s paper “Challenges to the Future of Gas: unburnable or unaffordable?” of December 2017.

3
LNG Canada Ushers in a New Wave of LNG FIDs in 2019-20? Among the significant challenges faced by LNG Canada was the requirement for each partner to source its share of feedgas. When Petronas joined the project in May 2018 with a 25% shareholding it brought with it 52 Tcf of reserves in the North Montney area5 and increased the certainty of FID being taken.
Although other challenges remain, including environmental permitting, challenging terrain, severe cold temperatures, remote locations and potential cost inflation from competing oil sands projects, first production is planned for 2023.
Investment in the first 14 Mtpa of production capacity is expected to total $31.2 billion - $12.4 billion upstream, $4.8 billion for the gas pipeline, and $14 billion for the liquefaction plant. The estimated cost of LNG supply to Asia is $7/mmBtu (gas supply and pipeline transportation $2.50/mmBtu, liquefaction $3.50/mmBtu, and LNG shipping $1/mmBtu). 6 7 Western Canada has an estimated 300 Tcf of gas that could be extracted for less than $3/mmBtu and Shell has a working interest in more than 9 Tcf of regional gas supply costing approximately $2/mmBtu. Assuming a delivered LNG price to Tokyo of $8.50/mmBtu, LNG Canada is expected to achieve an internal rate of return of 13%.8
Based on Shell’s statements and assuming an LNG price formula to Japan of 13.5% Brent + $0.50/mmBtu, LNG Canada breakeven needs a Brent price of approximately $48.15/bbl. A 13% rate of return can be achieved with a Brent price of approximately $59/bbl.
LNG buyers and sellers remain cautious about the costs of such large projects and, in the absence of a convergent view between LNG buyers and sellers, LNG Canada and more recently Golden Pass LNG have decided to go long on LNG ahead of improved market conditions and willing LNG buyers ready to commit to new long-term contracts.
In the meantime, LNG project developers in geographic locations able to deliver new projects with access to significant low-cost resources, proximity to high volume and/or high value markets, and opportunity to achieve competitive liquefaction project costs, have a significant advantage. This places five geographic locations in high-profile for FIDs over the next two years: Qatar, USA, Russia, Mozambique, and Nigeria. Table 1 shows the significant number of LNG projects under development aiming for an FID during 2019-20 and totalling 302.7 Mtpa.
Financing multi-billion projects involves equity investments, shareholder and commercial loans, and where applicable, project finance with the involvement of export credit agencies and the World Bank providing political risk insurance for countries lacking sufficient regulatory and megaproject track record. In such a complex and challenging business environment, expansions of existing projects with a proven track record and strong balance sheet have significant competitive advantages.
Table 1 shows a total of 98.6 Mtpa of brownfield LNG projects and 7.8 Mtpa of African FLNG projects under development. Brownfield LNG projects benefit from existing infrastructure from an LNG export or import terminal. FLNG projects with a much smaller investment requirement and the possibility of a leased/operated business model are also well positioned.
5 ‘Malaysia’s Petronas buys 25 % stake in LNG Canada Project’, https://www.reuters.com/article/us-petronas-lng-canada-idUSKCN1IW11431 6 ‘Shell gives green light to invest in LNG Canada’, Shell Press Release and Presentation, 2 October 2018 7 ‘Shell, partners OK first major Canadian LNG project’, Argus Global LNG, Volume XIV, 10 October 2018, page 2 8 ‘Shell gives green light to invest in LNG Canada’, Shell Press Release and Presentation, 2 October 2018

4
Table 1: Potential LNG and FLNG Projects Aiming for FID in 2019–2020
Source: Reuters, Bloomberg, Upstream, Petroleum Economist, ICIS Global LNG Markets, and Argus Global LNG Brownfield LNG and FLNG projects should find it less challenging to come to market than greenfield LNG projects, unless the greenfield projects have the backing of major IOCs and LNG buyers prepared to equity invest and equity lift LNG volumes, as is the case with LNG Canada. Projects with strong shareholder backing can refinance once the new LNG project is operating removing the need for completion guarantees and minimising doubts over the credit risk of new LNG buyers.
The five key areas selected for further analysis in this paper are: Mozambique, Nigeria, Qatar, Russia and the United States.
Mozambique has 28.1 Mtpa of greenfield LNG projects under development in a remote location with very limited infrastructure, and deep-water lean gas supply – but with strong energy majors and multinational partners supporting both projects. Mozambique should inaugurate LNG exports in 2022 with the start-up of the 3.4 Mtpa South Coral FLNG project.9 Mozambique is one of the most promising new sources of LNG supply for the growing markets of South Asia and Southeast Asia.
9 ‘Eni begins construction of the Hull for Coral South Floating LNG Unit’, ENI, 06 September 2018
LNG Projects Country Leader Type FID Start-Up MtpaCalcasieu Pass USA Venture Global Greenfield 2019 2022 10.0Magnolia USA LNG Limited Greenfield early 2019 2022 8.0Golden Pass USA Qatar Petroleum Brownfield end 2018 2023 15.6Cameron T4-5 USA Sempra Brownfield 2019 2023 10.0Plaquemines USA Venture Global Greenfield end 2019 2023 20.0Port Arthur USA Sempra Greenfield 2019 2023 13.5Driftwood USA Tellurian Greenfield 2019 2023 27.6Rio Grande USA Next Decade Greenfield 2019 2023 27.0Goldboro LNG Canada Pieridae Energy Greenfield 2019 2023 10.0Sabine Pass T6 USA Cheniere Brownfield 2019 2023 4.5Costa Azul Mexico Sempra Brownfield late 2019 2023 2.5Jordan Cove USA Pembina Greenfield 2019 2023 7.8Lake Charles T2-3 USA Energy Transfer Brownfield 2019-20 2023-24 11.2Texas LNG T1-2 USA Texas LNG Greenfield 2019-22 2023-26 4.0Bear Head T1-4 Canada LNG Limited Greenfield 2020-21 2024-25 8.0Corpus Christi T1-7 USA Cheniere Greenfield 2020-21 2024-26 9.5Annova LNG T1-6 USA Exelon Greenfield 2020-21 2024-26 3.0Americas Total 192.2Tortue FLNG Mauritania BP FLNG end 2018 2022 2.5Fortuna FLNG Equatorial Guinea Ophir FLNG 2019 2022 2.5Nigeria LNG T7 Nigeria Nigeria LNG Brownfield 2019 2023 8.0Cameroon FLNG Cameroon NewAge FLNG 2019 2023 1.4Mozambique LNG Mozambique Anadarko Greenfield early 2019 2024 12.9Rovuma LNG Mozambique ExxonMobil Greenfield 2019 2024 15.2Congo FLNG Congo Brazzaville NewAge FLNG 2020 2024 1.4Africa Total 43.9Sakhalin T3 Russia Shell / Gazprom Brownfield 2019 2023 5.4Qatar T8-11 Qatar Qatar Petroleum Brownfield 2019 2024 33.4Arctic 2 T1-2-3 Russia Novatek Greenfield 2019-20 2024-26 19.8Papua LNG T3 Papua New Guinea ExxonMobil Brownfield 2019 2024 8.0Qatar / Russia / Papua New Guinea Total 66.6Grand Total of LNG Projects Seeking an FID in 2019-2020 302.7Brownfield LNG Projects 98.6Greenfield LNG Projects 204.1

5
Nigeria has 8.0 Mtpa of brownfield LNG projects under development by Nigeria LNG, which has a reliable track record, is debt free and is backed by three strong international oil majors. The last LNG FID in Nigeria was in July 2004 and the country could benefit from new natural gas development for the domestic and export markets. In October 2019 Nigeria LNG will complete 20 years since exporting the first of nearly 4,750 LNG cargoes.
Qatar has 33.4 Mtpa of brownfield LNG projects under development in an ambitious move to maintain its position as the leading LNG exporter, which is under threat from Australia and the United States. Qatar initiated LNG exports in December 1996 and in less than 10 years surpassed Indonesia as the world’s leading LNG producer. As the country seeks to expand production from the North Field, the industry expects a new wave of the lowest cost LNG to find willing LNG buyers, displacing competing alternatives.
Russia has 25.2 Mtpa of LNG projects under development, 19.8 Mtpa of greenfield development in one of the most challenging and remote locations in the Arctic with ambitious low-cost targets considering the location, and a 5.4 Mtpa brownfield expansion of the pioneer LNG project (Sakhalin LNG) which has exported close to 1,615 LNG cargoes in March 2019 since start-up 10 years earlier. 10 According to GECF11, Russia held close to 24% of the world’s proven gas reserves in 2017 with 47,805 Bcm. LNG is of strategic importance as the country seeks to open new markets to monetise these vast reserves.
The Americas have a staggering 192.2 Mtpa of brownfield and greenfield LNG projects under development, and if we exclude the projects in Canada and Mexico, the US still has an impressive 171.7 Mtpa under development.
The recent FID by Qatar Petroleum and ExxonMobil on the 15.6 Mtpa Golden Pass LNG project, estimated to cost $10 billion,12 indicates it could be a competitive LNG supplier. ConocoPhillips will not participate and its 12.4% stake is likely to be acquired by ExxonMobil. Golden Pass LNG has a 2.21 Bcf/d export permit to non-FTA nations13, but no known executed long-term SPAs. ExxonMobil is the 2nd largest producer of natural gas in the Lower 48 US states14 with important assets in the Permian and Eagle Ford shale basins through XTO Energy, and Golden Pass is one of the last brownfield LNG projects to benefit from existing LNG regasification terminals.
New US LNG projects are exploring innovations in technology, equipment, procurement, financing, business models and vertical integration with upstream assets – in a quest to achieve lowest cost. If the US is successful with a third of the LNG projects under development, it could become the leading global LNG exporter by 2026.
Upstream Gas Supply Costs for 2025 The competitiveness of an LNG project is not solely defined by the capital costs of the liquefaction plant. The economic efficiency of the upstream gas supply component, and whether the overall energy project includes valuable crude oil, condensate and LPG components can significantly enhance the competitiveness of the LNG project due to a much larger revenue potential with which to amortize all the investments needed.
The upstream component of an LNG project can vary significantly in capital cost due to the location of hydrocarbon reserves, and the infrastructure investments needed to produce and transport the natural
10 ‘Russia’s Sakhalin LNG plant ships milestone cargo to Japan’, LNG World News, 27 June 2018 11 ‘GECF Annual Statistical Bulletin 2018, Table 3.1.1 Gas Proven Reserves of GECF Countries (Bcm)’ 12 ‘Qatar, Exxon to proceed with $10 billion Texas LNG project’, Ron Russo, Jessica Resnick-Ault, Reuters, 1 February 2019 13 ‘QP, ExxonMobil to advance Golden Pass LNG export project’, LNG World News, 4 February 2019 14 ‘Golden Pass crests second wave of US LNG’ Wood Mackenzie News Release, 5 February 2019

6
gas supply to the LNG plant. It is not uncommon to require as much investment, if not more, in the upstream project as in the liquefaction plant itself.
Specific information about the dedicated upstream natural gas investments required for an LNG project are rarely known due to commingled investment and production facilities without clear allocation of capital investment and operating expenses, and the upstream fiscal arrangements with host governments. Each LNG project can be a unique value chain from well to burner tip complicating the industry’s ability to benchmark costs on a like for like basis.
LNG Canada’s FID presentation15 provides some useful indicative figures and % of Delivery at Terminal (DAT) price:
Upstream cost of lean unconventional gas supply: $2.00/mmBtu 23.53%
Tariff on 670km of 48” gas pipeline16,17: $0.50/mmBtu 5.88%
Into LNG plant gas supply price: $2.50/mmBtu 29.41%
Liquefaction Cost (14 Mtpa @ $1,000/tpa): $3.50/mmBtu 41.18%
LNG shipping W Canada/Kitimat to JKTC: $1.00/mmBtu 11.76%
Gross Margin: $1.50/mmBtu 17.64%
DAT JKTC: $8.50/mmBtu 100%
Mozambique. There is limited public information about upstream costs, fiscal arrangements or indicative gas transfer pricing. The LNG site is 40km from the gas fields and in water depths of 1,600m18. Mozambique government is likely to provide fiscal incentives to the LNG projects to assist the development of all associated infrastructure and support project financing. Utilizing LNG Canada and Nigeria LNG as indications for potential gas supply and transportation costs to the LNG plant in Mozambique, and assuming a mix of onshore and offshore gas supply projects coupled with a significant gas transportation pipeline, an upstream cost equivalent to 29% of the final DAT price is assumed.
Nigeria. According to Nigeria LNG Financial Transparency information19, the company had revenues of $101.1 Billion from inception until the end of 2017, and made payments of $25.8 Billion for gas supply, which is equivalent to 25.5% of the final price achieved for LNG and liquids sold. Upon closer review over the nearly 20-year history, it can be observed that payments for gas supply were approximately 16% of the final price achieved, and over the period 2011-17 averaged 29.86%. Nigeria LNG was responsible for building and financing the first gas transmission pipeline, but all four subsequent gas transmission systems were developed and paid for by the upstream gas suppliers. Hence, this paper will adopt a premise of 30% of the final price for gas supply payments from NLNG T7.
Qatar. According to GECF20, Qatar held 24,500 Bcm of proven gas reserves at the end of 2017. The North Field is the world’s largest non-associated gas reservoir, discovered in 1971 and appraised to hold 900 Tcf of recoverable gas reserves, or 10% of world reserves, at the time.21 The country produced 1.92 million bbl/d of oil and liquids in 2017 - most of Qatar’s condensates and NGLs are produced from the North Field.22 Howard Rogers, estimated the break-even destination market LNG price for a new 15 ‘Shell gives green light to invest in LNG Canada’, Shell Press Release and Presentation, 2 October 2018 16 ‘Transcanada, Coastal GasLink Pipeline Project’ 17 ‘Regulator schedules hearings for B.C. LNG natural gas pipeline challenge’, Financial Post, 12 December 2018 18 ‘Mozambique Offshore Area 1 Project’, https://www.offshore-technology.com/projects/mozambique-offshore-area-1-project/ 19 ‘NLNG Facts and Figures 2018’ NLNG 20 ‘GECF Annual Statistical Bulletin 2018, Table 3.1.1 Gas Proven Reserves of GECF Countries (Bcm)’ 21 ‘Qatargas about North Field’, http://www.qatargas.com/english/aboutus/north-field 22 ‘Qatar Overview’ https://www.theoilandgasyear.com/market/qatar/

7
Qatar LNG plant would be $5.2/mmbtu taking into account the lower condensate yield achieved at the Barzan project when compared with the higher yield of Rasgas 2 and 3 LNG projects (almost 10 times the quantity of condensate per unit of gas production). He indicated that this could be the consequence of inaccurate data reporting. If the condensate (and other co-product yields) were to be more in line with the Rasgas projects, the destination market break-even price of new Qatari LNG projects would fall to below $2/mmbtu.23 According to Rystad Energy, Qatar possesses the lowest breakeven gas supply cost of approximately $2.00/mmBtu.24 Given the uncertainties about the ratio of future natural gas and condensate production, and about the support Government could extend to them through favourable feedgas pricing, this paper adopts $2.00/Mmbtu as the feedgas premise for both high and low-income tests for the new Qatar LNG projects.
Russia. According to GECF25, Russia held 47,805 Bcm of proven gas reserves at the end of 2017, approximately 24% of the world’s proven gas reserves. Russia has a significant competitive advantage on a long-run marginal cost basis, which includes all the full-cycle investments required to bring additional supplies to the market. Upstream costs are very low, below $1/mmBtu including taxes as shown on Figure 1.26 The duty for the export of natural gas is 30% of its customs value, but in 2013 Russia introduced a 0% tax rate for liquefied natural gas exports.27
Yamal LNG has secured significant tax concessions from the Russian government: exemption from export tax, mineral extraction tax (MET), property tax exemption for 12 years, and a 13.5% reduction of profit tax. In addition, the government is financing infrastructure construction: airport, sea port, ice-breaking and cargo fleet. In comparison, natural gas exported via pipeline provides to government approximately 900 rubles/1000m3 (MET) and a 30%/1000m3 export tax. 28
Mark Gyetvay, Novatek’s Chief Financial Officer claimed that the Arctic LNG 2 project is expected to receive the same tax breaks as Yamal LNG.29 Olivier Lazar, Shell’s CEO in Russia noted the special tax concessions provided for Yamal LNG and indicated it would ask for similar benefits for the Baltic LNG and Sakhalin II T3 projects.30
Figure 1: Gazprom Reported Average Price of Production - $/mmBtu
Source: Gazprom
23 ‘Qatar Lifts its LNG Moratorium’, Howard Rogers, Oxford Energy Comment, April 2017 24 ‘Qatar could win the race for new liquefaction projects FIDs’, Rystad Energy, 4 July 2018 25 ‘GECF Annual Statistical Bulletin 2018, Table 3.1.1 Gas Proven Reserves of GECF Countries (Bcm)’ 26 ‘The Impact of US LNG on Russian Natural Gas Export Policy’, Mitrova and Boersma, Columbia Center on Global Energy Policy, 17 December 2018 27 ‘Oil and gas regulation in the Russian Federation: overview’, Jennifer Josefson and Alexandra Rotar, King & Spalding LLP 28 ‘Gazprom fears Yamal LNG may hurt pipeline gas supply to Europe’, EurAsia Daily, 6 December 2017 29 ‘Russia's Novatek says LNG-2 to receive same tax breaks as Yamal LNG’, Reuters, 12 December 2017 30 ‘Shell plans to discuss tax exemptions for Sakhalin-2 and Baltic LNG with Russian officials’, Tass, 7 March 2017

8
Sakhalin II LNG is a part of an integrated oil, condensate and natural gas project and is expected to have competitive gas supply terms to ensure oil and condensate production are not curtailed, and natural gas is not routinely flared. Russia is keen to monetise additional gas as LNG and increase market share at the same time as Qatar, Mozambique and the US. Sakhalin II T3 is premised to secure similar tax incentives as Yamal LNG and Arctic 2 LNG projects, and $0.50/mmBtu gas supply price is assumed for both high and low-income market tests.
USA. According to the Energy Information Agency, at the end of 2017 proven natural gas reserves increased by 123.2 Tcf to 464.3 Tcf, or approximately 13,140 Bcm, of which 66% is from shale. The largest increase in proven reserves came from the Marcellus and Utica shale plays (an additional 28.1 Tcf), followed by the Wolfcamp/Bone Spring shale plays in the Permian (26.9 Tcf), and the Haynesville/Bossier shale (18.4 Tcf). 31
Existing LNG projects are premised to have a gas supply cost of 1.15 X Henry Hub gas price, which for January 2025 is estimated to equal $3.52/mmBtu.
A number of LNG projects seeking an FID in 2019-20 plan to use the same gas supply pricing as existing LNG projects, but a number of new projects for example, but not limited to Next Decade’s Rio Grande and Tellurian’s Driftwood LNG projects are seeking to lock-in lower-cost gas supply by procuring gas supply in the Permian area directly from producers, and in the case of Tellurian, vertically integrate upstream assets into the LNG project.
According to statements from Next Decade, Permian gas supply could in theory tend to prices close to $0/mmBtu for 25 Bcf/d for 50 years, as State regulations prevent routine gas flaring. In order to avoid shut-in of valuable oil and liquids production, natural gas prices are driven down providing an economic signal for the development of transportation capacity. 32 At the end of November 2018, prices at the Waha hub fell to an average of $0.25/mmBtu and traders said small amounts of fuel were even sold at negative prices as producers struggled to evacuate the gas. For comparison US average gas supply cost $2.16/mmBtu for 2018, $2.71/mmBtu for 2017 and an average of $3.11/mmBtu for 2013-2017.33
In order to secure such favourable gas supply conditions for the long-term, it is estimated that LNG project developers in Port Arthur, Sabine and Lake Charles may need to invest approximately $7.2bn for a 48” 1,000 km gas pipeline connecting to their LNG export hub and contract the feedgas supply for the long term. It is only a matter of time before the current constraints on natural gas pipeline evacuation are eased with the development of additional transportation capacity connecting the Permian to higher value-added markets. Under these circumstances, a very competitive feedgas price of approximately $1.25-1.75/mmBtu could be possible, assuming $0.75/mmBtu for the transportation tariff and $0.50-1.00/mmBtu for the long-term purchase of natural gas.
Indicative gas supply for such vertically integrated LNG projects is premised at $2.25/mmBtu for both high and low-income markets.
Cost of Liquefaction Plant Projects The LNG industry is nearly 55 years old and in this time period the capacity of LNG tankers and LNG trains have expanded aiming to provide the industry with higher capacity with similar footprint at lower unit costs. From the first 0.35 Mtpa LNG trains in Algeria to the 7.8 Mtpa Qatari LNG, liquefaction capacity has grown by a factor of 21:1. From the Methane Princess LNG tanker with 27,400 m3 of capacity to the Mozah QMax LNG with 266,000 m3, the capacity of LNG ships has grown by a factor of 9.7:1. According to data from Woodmac and GIIGNL, by the end of 2018 the total volume of LNG traded
31 ‘U.S. Crude Oil and Natural Gas Proved Reserves, Year-end 2017’, 29 November 2018 32 ‘The Permian Can Help Satisfy China's LNG Appetite’, Matthew Veazey, Rigzone, 4 May 2018 33 ‘Get your natural gas in Texas for 25 cents, if you can’, Reuters, 27 November 2018

9
since 1964 is estimated to reach 4,789 MT. This is equivalent to approximately 71,055 LNG cargoes of 155,000 m3 capacity, all delivered with a remarkable record of reliability and safety.
Figure 2 demonstrates the industry’s continued pursuit of higher capacity LNG trains aiming to lower unit costs. The majority of LNG trains constructed to date have capacity of between 3 and 5 Mtpa and are considered “standard plants”. Over the next two years EPC contracts are expected to be awarded for three additional “standard plants”, with an upward trend in capacity, “large scale” trains of 7 to 8 Mtpa (Canada, Mozambique and Qatar), and a cluster of “small and mid-scale” trains (0.25 to 2.0 Mtpa).
Figure 3 illustrates how LNG projects seeking an FID over the next two years intend to develop their plant capacities. Remote location LNG plants like LNG Canada, and Mozambique prefer to build large scale trains pushing the limits of a single main cryogenic heat exchanger (MCHE), the heart of an LNG plant, where most of the cryogenic temperature reduction of methane occurs. Given the complexity of construction MCHEs are built at factories and shipped to the LNG plant site.
Figure 2: LNG Onshore Train Size Mtpa Growth – Past, Present, and Future 1975–2025
Source: KBR Figure 3 also illustrates a new wave of US LNG projects seeking to utilise small to mid-scale LNG train sizes ranging from 0.25 Mtpa to 2.0 Mtpa with total plant capacity ranging from 2.5 Mtpa to 20 Mtpa. This is a promising cluster for the LNG industry seeking to utilise new liquefaction process technologies, train and facility size, equipment suppliers, and modularisation strategies involving size and fabrication location to achieve lower unit technical costs. According to data from the International Gas Union, Air Products and Chemicals, Inc (APCI) held a 73 % share of the global liquefaction technology utilised in LNG plants up to 2017, largely through market dominance in the development and supply of MCHE for LNG plants. ConocoPhillips held a 21 % share through the licensing of the Optimized Cascade process which is now used by 25 LNG trains worldwide.
Figure 4 shows LNG plant costs in $/tpa MOD at FID (left vertical axis), the price of oil in $/barrel in MOD (right vertical axis), with a timeline from 1967 to 2017. The figure captures 490 MT of liquefaction capacity which reached FID over the 50-year period, the first 100 MT taking nearly 30 years, the next 100 MT achieved in only ten years. Since then the industry has taken FID on an average of 100 MT of additional capacity every five years.

10
Figure 3: LNG Train Size Mtpa vs. Facility Size Mtpa (Recent and Proposed Initial Phase)
Source: KBR Figure 4: Oil Price and LNG Plant Costs ($/tpa MOD) at FID 1967 – 2017
Source: World Bank, Wood Mackenzie, Federal Reserve Bank of Minneapolis and SyEnergy
0.00
5.00
10.00
15.00
20.00
25.00
30.00
35.00
40.00
45.00
50.00
55.00
60.00
65.00
70.00
75.00
80.00
85.00
90.00
95.00
100.00
105.00
110.00
115.00
120.00
125.00
130.00
135.00
140.00
145.00
0
250
500
750
1,000
1,250
1,500
1,750
2,000
2,250
2,500
2,750
Jan
-196
7
Sep-
1967
May
-196
8
Jan
-196
9
Sep-
1969
May
-197
0
Jan
-197
1
Sep-
1971
May
-197
2
Jan
-197
3
Sep-
1973
May
-197
4
Jan
-197
5
Sep-
1975
May
-197
6
Jan
-197
7
Sep-
1977
May
-197
8
Jan
-197
9
Sep-
1979
May
-198
0
Jan
-198
1
Sep-
1981
May
-198
2
Jan
-198
3
Sep-
1983
May
-198
4
Jan
-198
5
Sep-
1985
May
-198
6
Jan
-198
7
Sep-
1987
May
-198
8
Jan
-198
9
Sep-
1989
May
-199
0
Jan
-199
1
Sep-
1991
May
-199
2
Jan
-199
3
Sep-
1993
May
-199
4
Jan
-199
5
Sep-
1995
May
-199
6
Jan
-199
7
Sep-
1997
May
-199
8
Jan
-199
9
Sep-
1999
May
-200
0
Jan
-200
1
Sep-
2001
May
-200
2
Jan
-200
3
Sep-
2003
May
-200
4
Jan
-200
5
Sep-
2005
May
-200
6
Jan
-200
7
Sep-
2007
May
-200
8
Jan
-200
9
Sep-
2009
May
-201
0
Jan
-201
1
Sep-
2011
May
-201
2
Jan
-201
3
Sep-
2013
May
-201
4
Jan
-201
5
Sep-
2015
May
-201
6
Jan
-201
7
Sep-
2017
LNG Plant Liquefaction Costs at Final Investment Decision ($/tonne MOD)
$/Tonne FID MoD Oil ($/barrel)
$/Tonne MOD Oil ($/barrel)
Period MTPA FID Comment
01/67 - 12/98 137 Pioneer projects in Abu Dhabi, Alaska, Algeria, Australia, Brunei, Indonesia, Nigeria, Malaysia, Qatar and Trinidad.
01/99 - 12/09 195 Rise in remote location LNG (Snohvit, Darwin, Sakhalin, Yemen, Peru, Pluto, Angola, Gorgon, Papua New Guinea)
01/10 - 12/13 90 Most Australian coal seam gas projects, Wheatstone and Ichthys, Russia's Yamal and 2 FLNG projects
01/14 - 12/17 68 48 Mtpa of US LNG projects of which 39 Mtpa utilized existing LNG regas infrastructure, and 3 FLNG projects

11
Figure 5 exhibits the Figure 4 data with LNG plant costs recalculated from $/tpa MOD at FID to $/tpa in 2018 US dollars. The cumulative average for 50 years was $946/tpa in 2018 US dollars. Over this time period, the oil price averaged $55/bbl. 291 MT of capacity have reached FID at oil prices below $55/bbl with an average of $667/tpa in 2018 US dollars, and 199 MT of capacity have reached FID at oil prices above $55/bbl with an average of $1,372/tpa in 2018 US dollars.
Figure 5: Oil Price and Cumulative Average LNG Plant ($/tpa US$ 2018) at FID 1967–2017
Source: World Bank, Wood Mackenzie, Federal Reserve Bank of Minneapolis and SyEnergy In Figure 5 three vertical lines were inserted to highlight four relevant periods of LNG plant development. The first (left hand) period includes 137 MT of liquefaction where the “pioneer” LNG projects (Abu Dhabi, Alaska, Algeria, Australia, Brunei, Indonesia, Libya, Nigeria, Malaysia, Qatar and Trinidad) reached their FIDs. This period exhibits relative cost stability from 1972 until 1999, when the cumulative average liquefaction cost fell by 12.7% from $817/tpa to $713/tpa in 2018 US dollars.
The second period from the left includes 195 MT of LNG production capacity with a significant growth of “remote location” projects with limited or no local energy or supporting infrastructure (Angola, Australia (Darwin and Gorgon), Egypt, Equatorial Guinea, Norway, Papua New Guinea, Peru, Russia, and Yemen). This period exhibits a modest increase of 12.5% in average liquefaction cost from $713/tpa to $802/tpa which was possible due to 77 MT of lower cost LNG production capacity reaching FID in Qatar, Oman and Trinidad at an average $414/tpa, compensating the 118 MT of LNG production capacity elsewhere reaching FID with an average of $1,161/tpa..
The third period includes 90 MT of LNG reaching FID with a significant growth of “high cost” projects dominated by the Australian Gladstone LNG projects supplied by coal seam gas and Wheatstone and Ichthys, Russia’s Yamal and two FLNG projects (Prelude and Petronas PFLNG 1). 90 MT of LNG
0.005.0010.0015.0020.0025.0030.0035.0040.0045.0050.0055.0060.0065.0070.0075.0080.0085.0090.0095.00100.00105.00110.00115.00120.00125.00130.00135.00140.00145.00
100
200
300
400
500
600
700
800
900
1,000
1,100
1,200
1,300
1,400
1,500
1,600
1,700
1,800
1,900
2,000
Jan-
1967
Sep-
1967
May
-196
8
Jan-
1969
Sep-
1969
May
-197
0
Jan-
1971
Sep-
1971
May
-197
2
Jan-
1973
Sep-
1973
May
-197
4
Jan-
1975
Sep-
1975
May
-197
6
Jan-
1977
Sep-
1977
May
-197
8
Jan-
1979
Sep-
1979
May
-198
0
Jan-
1981
Sep-
1981
May
-198
2
Jan-
1983
Sep-
1983
May
-198
4
Jan-
1985
Sep-
1985
May
-198
6
Jan-
1987
Sep-
1987
May
-198
8
Jan-
1989
Sep-
1989
May
-199
0
Jan-
1991
Sep-
1991
May
-199
2
Jan-
1993
Sep-
1993
May
-199
4
Jan-
1995
Sep-
1995
May
-199
6
Jan-
1997
Sep-
1997
May
-199
8
Jan-
1999
Sep-
1999
May
-200
0
Jan-
2001
Sep-
2001
May
-200
2
Jan-
2003
Sep-
2003
May
-200
4
Jan-
2005
Sep-
2005
May
-200
6
Jan-
2007
Sep-
2007
May
-200
8
Jan-
2009
Sep-
2009
May
-201
0
Jan-
2011
Sep-
2011
May
-201
2
Jan-
2013
Sep-
2013
May
-201
4
Jan-
2015
Sep-
2015
May
-201
6
Jan-
2017
Sep-
2017
LNG Plant Liquefaction Costs at FID Cumulative Average ($/tonne US$ 2018)
Cum $/Tonne US$ 2018 Oil ($/barrel)
$/Tonne US$ 2018 Oil ($/barrel)
Period MTPA FID Comment
01/67 - 12/98 137 Pioneer projects in Abu Dhabi, Alaska, Algeria, Australia, Brunei, Indonesia, Nigeria, Malaysia, Qatar and Trinidad.
01/99 - 12/09 195 Rise in remote location LNG (Snohvit, Darwin, Sakhalin, Yemen, Peru, Pluto, Angola, Gorgon, Papua New Guinea)
01/10 - 12/13 90 Most Australian coal seam gas projects, Wheatstone and Ichthys, Russia's Yamal and 2 FLNG projects
01/14 - 12/17 68 48 Mtpa of US LNG projects of which 39 Mtpa utilized existing LNG regas infrastructure, and 3 FLNG projects

12
production capacity reached FID with an average liquefaction cost of $1,530/tpa, increasing the industry average cost for 422 Mtpa of LNG by 19.4% from $802/tpa to $958/tpa.
The fourth period includes 68 MT of LNG reaching FID with 39 MT of USA LNG projects benefitting from existing LNG regasification terminals which can represent 50% of the capex of a liquefaction plant. During this period, the average liquefaction cost was $877/tpa, a 42.6% reduction versus the $1,530/tpa in the previous period. This period included three FLNG projects (Petronas PFLNG 2, South Coral and Cameroon) where 7.3 MT reached FID with an average liquefaction cost of $1,291/tpa. The industry long term average cost (1967-2017) for 490 Mtpa of LNG production capacity was $946/tpa, a reduction of 1.2 % from $958/tpa in 2018 US dollars achieved in the previous period.
Figure 6: Five Year Moving Average of Oil and LNG Plant ($/tpa US$ 2018) at FID 1967–2017
Source: World Bank, Wood Mackenzie, Federal Reserve Bank of Minneapolis and SyEnergy Figure 6 has the same data set as Figure 5 but has been replotted with a five-year moving average of the oil price and liquefaction cost in $/tpa in 2018 US dollars. Gaps in the charted moving average line means absence of new FIDs over the moving average period. We can observe the phenomenal cost increase from $357/tpa in January 2003 to $1,874/tpa in December 2012 where 203 MT reached FID. During this period, a significant portion of remote location projects reached FID, most Australian LNG and two FLNG projects, and the five-year moving average oil price also showed a phenomenal increase from $21.64/bbl in January 2003 to $92.10/bbl in December 2012. We can also observe a 50% decrease in the following five years from $1,874/tpa in December 2012 to $941/tpa in December 2017, where 94 MT reached FID with 61 MT of US LNG projects at an average liquefaction cost of $732/tpa in 2018 US dollars.
0.00
5.00
10.00
15.00
20.00
25.00
30.00
35.00
40.00
45.00
50.00
55.00
60.00
65.00
70.00
75.00
80.00
85.00
90.00
95.00
100.00
105.00
110.00
100
200
300
400
500
600
700
800
900
1,000
1,100
1,200
1,300
1,400
1,500
1,600
1,700
1,800
1,900
2,000
Jun-
1972
Jan-
1973
Aug-
1973
Mar
-197
4O
ct-1
974
May
-197
5De
c-19
75Ju
l-197
6Fe
b-19
77Se
p-19
77Ap
r-19
78N
ov-1
978
Jun-
1979
Jan-
1980
Aug-
1980
Mar
-198
1O
ct-1
981
May
-198
2De
c-19
82Ju
l-198
3Fe
b-19
84Se
p-19
84Ap
r-19
85N
ov-1
985
Jun-
1986
Jan-
1987
Aug-
1987
Mar
-198
8O
ct-1
988
May
-198
9De
c-19
89Ju
l-199
0Fe
b-19
91Se
p-19
91Ap
r-19
92N
ov-1
992
Jun-
1993
Jan-
1994
Aug-
1994
Mar
-199
5O
ct-1
995
May
-199
6De
c-19
96Ju
l-199
7Fe
b-19
98Se
p-19
98Ap
r-19
99N
ov-1
999
Jun-
2000
Jan-
2001
Aug-
2001
Mar
-200
2O
ct-2
002
May
-200
3De
c-20
03Ju
l-200
4Fe
b-20
05Se
p-20
05Ap
r-20
06N
ov-2
006
Jun-
2007
Jan-
2008
Aug-
2008
Mar
-200
9O
ct-2
009
May
-201
0De
c-20
10Ju
l-201
1Fe
b-20
12Se
p-20
12Ap
r-20
13N
ov-2
013
Jun-
2014
Jan-
2015
Aug-
2015
Mar
-201
6O
ct-2
016
May
-201
7De
c-20
17
LNG Plant Liquefaction Costs at FID 5 Year Moving Average ($/tonne US$ 2018)
5 Year Moving Average $/Tonne US$ 2018 5 Year Moving Average Oil ($/bbl)
5 Year Moving Average $/Tonne US$ 2018
5 Year Moving AverageOil ($/barrel)
Period MTPA FID Comment
01/67 - 12/98 137 Pioneer projects in Abu Dhabi, Alaska, Algeria, Australia, Brunei, Indonesia, Nigeria, Malaysia, Qatar and Trinidad.
01/99 - 12/09 195 Rise in remote location LNG (Snohvit, Darwin, Sakhalin, Yemen, Peru, Pluto, Angola, Gorgon, Papua New Guinea)
01/10 - 12/13 90 Most Australian coal seam gas projects, Wheatstone and Ichthys, Russia's Yamal and 2 FLNG projects
01/14 - 12/17 68 48 Mtpa of US LNG projects of which 39 Mtpa utilized existing LNG regas infrastructure, and 3 FLNG projects

13
Figure 7: Regression of LNG Plant ($/tpa MoD) at FID [All and High Cost Locations] vs. Oil Price 1967–2017
Source: World Bank, Wood Mackenzie and SyEnergy The similarity between curves of the oil price ($/barrel) and liquefaction cost in $/tpa in 2018 US dollars in Figure 6 was further investigated, with regression analysis confirming a higher correlation between
y = 154.86e0.0198x
R² = 0.6255
0
200
400
600
800
1,000
1,200
1,400
1,600
1,800
2,000
2,200
2,400
2,600
2,800
3,000
0 10 20 30 40 50 60 70 80 90 100 110 120 130 140
$/Tonne FID MoD vs. Oil Price $/bbl - All Locations
y = 171.02e0.0211x
R² = 0.7597
0
200
400
600
800
1,000
1,200
1,400
1,600
1,800
2,000
2,200
2,400
2,600
2,800
3,000
0 10 20 30 40 50 60 70 80 90 100 110 120 130 140
$/Tonne FID MoD vs. Oil Price $/bbl - High Cost Locations

14
the variation of the oil price and the variation in the cost of LNG plants in remote locations with a coefficient of determination of R2 = 0.76, as shown by Figure 7.
LNG plants in remote locations normally require a complex scope involving the development of comprehensive gas treatment facilities, utilities (power generation, steam, water cooling and treatment), maximum liquid recovery (condensate and LPG), potential CO2 treatment, sequestration and storage, as well as ancillary infrastructure supporting the operation of the plant, marine facilities for LNG tankers, and residential facilities for the employees and their families.
Table 2 illustrates the approximate capital investment factor for varying degrees of complexity in LNG plant scope (base case design 4.5 Mtpa) demonstrating that a complex LNG plant scope may have a capex ~3 x larger than an LNG plant of identical production capacity with a minimum scope.
Complex LNG plants are in competition with other major energy projects such as refinery or petrochemical complexes for the same limited pool of experienced contractors and equipment suppliers. A higher energy price environment will tend to influence various elements of a complex scope explaining the higher coefficient of determination identified. LNG projects with a complex scope are developed to maximize upstream and downstream revenues in support of the multi-billion investment, and to achieve the most competitive LNG price delivered at LNG buyer’s regasification terminal.
Table 2: Plant Liquefaction Scope Complexity and Capital Investment Factor
Source: KBR Table 3: Indicative Liquefaction Plant Cost in $/tpa US$ 2018 and $/mmBtu US$ 2018
Source: World Bank, Wood Mackenzie, Federal Reserve Bank of Minneapolis and SyEnergy
1) Minimum feedgas treatment and imported utilities 1.002) Plant 1 plus all utility systems 1.253) Plant 2 plus acid gas removal, dehydration, mercury 1.644) Plant 3 plus LPG processing, storage and loading 1.995) Plant 4 plus high CO2 treatment and sequestering 2.446) Plant 5 plus max LPG recovery and sulphur recovery 2.93
Capex FactorLNG Plant Type (4.5 Mtpa & Higher Labor Costs)
MTPACapacity
All Locations 490 946 $3.31Remote / High Cost Locations 280 1,226 $4.29Qatar 78 482 $1.69USA Lower 48 61 660 $2.31West Africa 31 1,084 $3.79Russia / Arctic 33 1,292 $4.52Australia 89 1,789 $6.26Australia (excl Gorgon, Ichthys, Wheatstone, Prelude) 52 1,273 $4.46FLNG 12 1,975 $6.91FLNG (excl Prelude) 9 1,432 $5.01Note: (*) Indicative $/mmBtu based on $3.50/mmBtu per $1000/tpa. Source: LNG Canada FID presentation.
$/mmBtu*$/tpa US$ 2018Liquefaction Project Location

15
As each LNG project is quite distinct in terms of gas supply field composition, marine facilities, design capacity, scope complexity, geographic location, development, procurement strategy and time to market, comparisons between projects need to be made very carefully. Table 3 provides indicative benchmark $/tpa 2018 US dollars and $/mmBtu based on a large representative sample of projects. The benchmarks could include a different mix of brownfield and greenfield projects, and time of FIDs. Projects will also have varying degrees of condensate and LPG production, whose specific capex is included in the total plant capex composing the indicative benchmarks. This will possibly overestimate costs for LNG projects without liquids, or underestimate costs for projects with significant liquid production.
LNG Shipping Costs for 2025 By the end of 2017, the LNG shipping fleet totalled 478 vessels, including vessels actively trading, sitting idle available for work, and acting as floating storage and regasification units (FSRU). Of the total global LNG fleet, there are 27 FSRUs and three floating storage units. The market is settling on a carrier size of between 170,000 m3 and 180,000 m3, which coincides with the size limits for the new Panama Canal expansion.34 Figure 8 shows the evolution of the global fleet with number of vessels ordered every year, ship type, and the average delivered ship size. Figure 9 shows the global fleet and order book of new LNG ships by propulsion technology.
Figure 8: Global LNG Fleet
Source: IGU World Gas LNG Report 2018, IHS Markit
34 ‘IGU World Gas LNG Report – 2018 Edition, LNG Carriers’

16
Figure 9: LNG Fleet Propulsion Technology
Source: IGU World Gas LNG Report 2018, IHS Markit Close to 50% of the current orders are for LNG ships with the new M-type, Electronically Controlled, Gas Injection (ME-GI) propulsion system, as shown by Figure 10. This engine utilises high-pressure slow-speed gas-injection engines and can be operated directly off BOG or fuel oil if necessary – instead of relying on using LNG as in Q-class ships, a flexibility which allows for better economic optimisation. A 170,000 m3, ME-GI LNG tanker – operating at design speed and fully laden in gas mode – consumes ~15–20% less fuel than the same vessel with a Tri-Fuel Diesel Electric (TFDE) propulsion system. 35
Figure 10: Global LNG Fleet Orderbook by Propulsion Type
Source: Flex LNG Company Presentation October 2018 35 ‘IGU World Gas LNG Report – 2018 Edition, LNG Carriers’
17
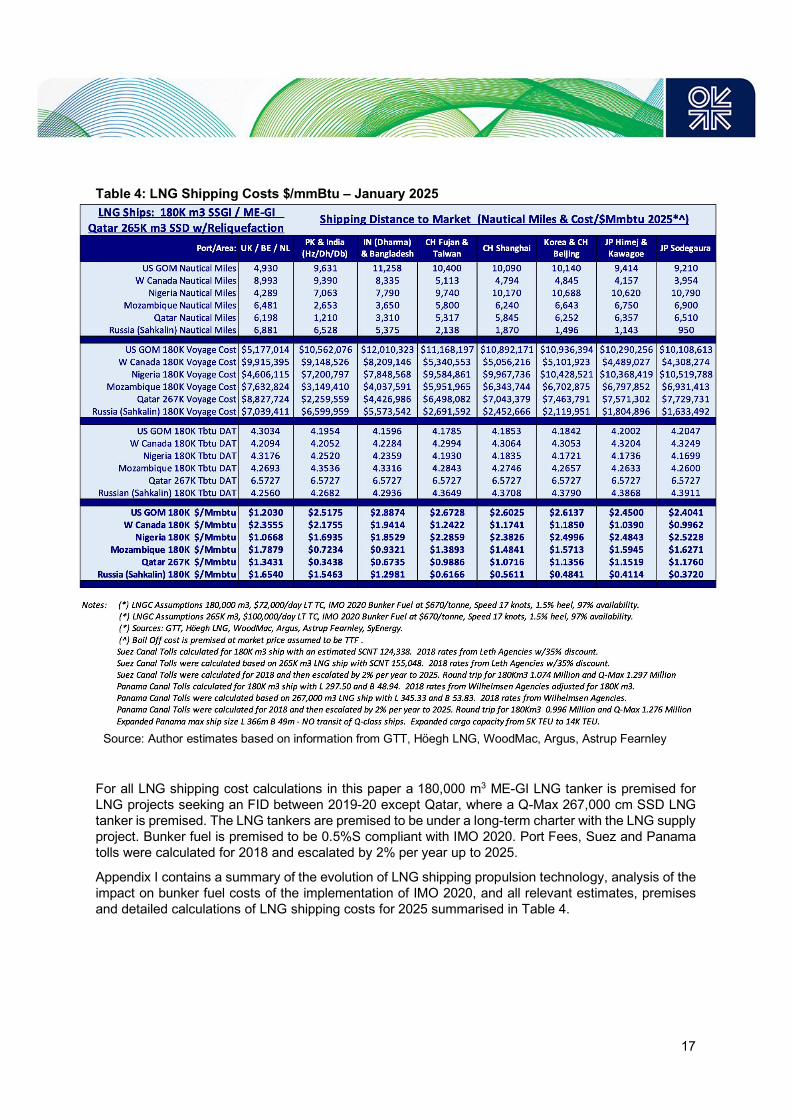
Table 4: LNG Shipping Costs $/mmBtu – January 2025
Source: Author estimates based on information from GTT, Höegh LNG, WoodMac, Argus, Astrup Fearnley For all LNG shipping cost calculations in this paper a 180,000 m3 ME-GI LNG tanker is premised for LNG projects seeking an FID between 2019-20 except Qatar, where a Q-Max 267,000 cm SSD LNG tanker is premised. The LNG tankers are premised to be under a long-term charter with the LNG supply project. Bunker fuel is premised to be 0.5%S compliant with IMO 2020. Port Fees, Suez and Panama tolls were calculated for 2018 and escalated by 2% per year up to 2025.
Appendix I contains a summary of the evolution of LNG shipping propulsion technology, analysis of the impact on bunker fuel costs of the implementation of IMO 2020, and all relevant estimates, premises and detailed calculations of LNG shipping costs for 2025 summarised in Table 4.

18
Gas and LNG Prices Outlook for 2025 Oil prices in 2018 continued their roller-coaster ride since plummeting from their 2014 peak after a decade averaging around $84/bbl. Prices increased by more than 20% in the first half of 2018 reaching a four-year high of $86.07/bbl in early October – only to lose 20% in November, the weakest month in the last 10 years, reasserting the scenario of “lower for longer” energy prices.
US sanctions targeting Iran and Venezuela coupled with the successful OPEC restraint for much of the year contributed to the perception that the market could be undersupplied in the face of strong energy demand from Southeast Asia, and declining oil inventories, and that these led to the return of higher oil prices. However, the continued growth of US shale production, US sanction exemptions to a number of countries importing Iranian crude oil, and the OPEC decision to ease restraint enabling additional oil supplies from Saudi Arabia and Russia to rebalance the market, eliminated the perception of market tightness. To a lesser extent, but nonetheless a factor in shaping expectations, the continued rise in US central bank interest rates, and the exchange of stiff trade tariffs between the USA and China suggest that the global economy, and energy demand, could be in for a cooling down period.
Figure 11: Main Energy Price Benchmarks, Short- and Long-Term Price Estimates to 2030
Source: EIA, ICIS Global LNG Markets, Forward Curves CME Group as of 14/12/18, SyEnergy estimates
0
10
20
30
40
50
60
70
80
90
100
110
120
130
140
1
2
3
4
5
6
7
8
9
10
11
12
13
14
15
16
17
18
19
20
21
22
23
Jan-
03Ju
l-03
Jan-
04Ju
l-04
Jan-
05Ju
l-05
Jan-
06Ju
l-06
Jan-
07Ju
l-07
Jan-
08Ju
l-08
Jan-
09Ju
l-09
Jan-
10Ju
l-10
Jan-
11Ju
l-11
Jan-
12Ju
l-12
Jan-
13Ju
l-13
Jan-
14Ju
l-14
Jan-
15Ju
l-15
Jan-
16Ju
l-16
Jan-
17Ju
l-17
Jan-
18Ju
l-18
Jan-
19Ju
l-19
Jan-
20Ju
l-20
Jan-
21Ju
l-21
Jan-
22Ju
l-22
Jan-
23Ju
l-23
Jan-
24Ju
l-24
Jan-
25Ju
l-25
Jan-
26Ju
l-26
Jan-
27Ju
l-27
Jan-
28Ju
l-28
Jan-
29Ju
l-29
Jan-
30Ju
l-30
Global Energy Prices 2003 - 2018 and Estimates to 2030
EU TTF ($/MMbtu)
Cont EU Gas Price ($/MMbtu)
JKTC Gas Price ($/MMbtu)
US LNG EU Price ($/MMbtu)
US LNG JKTC Price ($MMbtu)
Henry Hub Gas Price ($/MMbtu)
JKM ($/MMBtu)
Europe Brent Spot Price FOB ($/bbl)
$/MMbtu $/bbl
Estimates

19
Geopolitics and market externalities aside, the disruptive force of the US shale industry - it is now the largest global oil and gas producer - has forced the rest of the market to respond, with International Oil Companies going on an efficiency drive, and OPEC and other large producers like Russia incentivised to pump what they can, while they can, which has fundamentally changed the supply outlook. Whilst there is no peak in oil supply in view, there are sufficient concerns about a peak in oil demand due to the growth of renewables, energy efficiency measures, and climate change policies. Any short-term tightness in the market should prove to be transient, not structural, and as a consequence, until significant new energy demand appears, the oil price outlook remains structurally lower in a $50-70/bbl trading band for the foreseeable future.36
Figure 11 shows the last 15 years of energy price history for Brent in $/bbl and $/mmBtu for the key natural gas spot price benchmarks, European Title Transfer Facility (TTF), USA Henry Hub, and the Platts Japan Korea Marker (JKM) as the benchmark price assessment for spot physical cargoes delivered ex-ship into Japan, South Korea, China and Taiwan. It includes estimates of long-term LNG contracts into Europe and the Far East, as well as estimates for the price of US LNG delivered into the same markets. Long-term gas and LNG contracts into Europe were premised at 12% of Brent and into JKTC at 13.5% of Brent + $0.50/mmBtu which is equivalent to 14.33% of Brent. The US LNG liquefaction tolling fee for 2025 was estimated at $3.10/mmBtu based on public information from US FERC on Sabine Pass and Corpus Christi LNG SPAs. Figure 11 also includes author estimates of the energy benchmarks derived from CME Group forward curves and additional estimates using regression analysis and respecting forward curve seasonality to estimate energy prices up to December 2030.
Table 5 summarises the key energy benchmarks, spot and long-term contract price assessments for natural gas and LNG for January 2025 based on Figure 11.
Table 5: Energy Benchmarks - Gas/LNG Spot and Contract Prices $/mmBtu – January 2025
Source: EIA, ICIS Global LNG Markets, Forward Curves CME Group as of 14/12/18, SyEnergy estimates
36 ‘Oil’s ‘lower for longer’ reasserts itself’, Christian Malek, Financial Times, 21 November 2018
$/MMBtu$61.15$7.29$7.63$3.06$7.34$8.76$7.82$9.13
JKTC (LT contract)
Energy Benchmarks - Gas / LNG Prices - 01/25
US LNG to NWE US LNG to JKTC
Brent $/bblTTFJKMHenry HubCont EU Gas Price (LT contract)

20
Affordability and Competitiveness for High-Income and Low-Income Markets In OIES paper NG 125, Jonathan Stern examined the challenges to the future of natural gas as a ‘transition fuel’ up to 2030 and particularly beyond 2040 to meet the UN Conference of Parties COP21 targets by decarbonizing power generation, space heating and transport. The main challenge outside North America is affordability and competitiveness. The key to natural gas fulfilling its potential as a ‘transition fuel’ relies on its ability to reach high-income markets at prices below $8/mmBtu, and low-income markets below $6/mmBtu. The major challenge to the future of gas will be to ensure that it does not become unaffordable and/or uncompetitive, long before its emissions make it unburnable. 37
The estimated January 2025 prices of TTF, JKM, Continental EU gas price (LT contract), JKTC (LT contract), US LNG to NWE, and US LNG to JKTC average $7.99/mmBtu and this was considered adequate for the high-income market test, with the added benefit of preserving the price differential between regional basins.
Under the current energy price environment and outlook for 2025, a Brent price of approximately $45.10/bbl would be needed to reduce the long-term contract estimates into Europe and JKTC to an average of $6.00/mmBtu for the low-income test, as those long-term contract prices are more highly correlated with oil. Alternatively, at $50/bbl, European long-term gas and LNG contracts would tend towards $6.00/mmBtu and JKTC would be at approximately $7.25/mmBtu. The markets of NWE and South Asia (India, Pakistan, and Bangladesh) are considered for the low-income market test at $6.00/mmBtu. This implies a Brent price of $50/bbl for NWE, and for South Asia, a 60% weighting on the shipping differential between JKTC and South Asia, and 40% on the shipping differential between NWE and South Asia, assuming Mozambique, Nigeria and Qatar are the most likely LNG suppliers.
Figures 12 and 13 contain the LNG project affordability and competitiveness test for the high-income markets of Northwest Europe at $7.34/mmBtu and for Japan, Korea, Taiwan and China at $8.76/mmBtu for January 2025.
Figures 14 and 15 contain the LNG project affordability and competitiveness test for the low-income Northwest Europe market at $6.00/mmBtu and West/East India, Pakistan and Bangladesh at $6.00/mmBtu for January 2025.
The competitiveness of new LNG projects under the tests for high-income markets is very robust for JKTC markets, where only the existing US GOM projects seem unlikely to be able to supply this market profitably. For the high-income test for the NWE markets, Mozambique, Western Canada and the existing US GOM projects seem unlikely to be able to supply this market profitably.
The affordability and competitiveness of new LNG projects for low-income market tests at the $6.00/mmBtu level, implying Brent level of $45-50/bbl, is still quite good when considering over 40 Mtpa, or 13% of last year’s global traded LNG volume, could actually supply this market profitably. For NWE markets, Nigeria, Qatar and new LNG projects from US GOM seem likely to be able to supply this market profitably. Depending on the actual execution of Sakhalin II T3, it could also supply this market. When the South Asia markets of West/East India, Pakistan and Bangladesh are considered Qatar and Nigeria seem likely to be able to supply this market profitably. Depending on the actual execution of Mozambique and Sakhalin II T3, they could also supply this market.
37 ‘Challenges to the Future of Gas: unburnable or unaffordable ?’, Jonathan Stern, OIES Paper NG 125, December 2017

21
Figure 12: LNG Project Competitiveness $/mmBtu – High-Income Market Test – NWE 2025
Source: EIA, ICIS Global LNG Markets, Forward Curves CME Group as of 14/12/18, SyEnergy estimates Figure 13: LNG Project Competitiveness $/mmBtu – High-Income Market Test – JKTC 2025
Source: EIA, ICIS Global LNG Markets, Forward Curves CME Group as of 14/12/18, SyEnergy estimates
$2.00 $2.20 $2.25
$0.50
$2.13$3.52
$2.13
$1.69 $1.88 $2.25$4.52
$3.79
$3.10
$3.50$1.34 $1.07
$1.20$1.65
$1.79$1.20
$2.36
$0
$1
$2
$3
$4
$5
$6
$7
$8
$9
$10
Qatar Nigeria US GOM(New)
Russia Mozambique US GOM(Existing)
WesternCanada
Project Netback $/mmBtu - High-Income Market Test - NWE - 2025
Gas Supply Liquefaction Shipping
$2.00$0.50
$2.63 $2.25 $2.54 $2.54$3.52
$1.69 $4.52
$1.88 $2.25
$3.50 $3.79$3.10
$1.10
$0.49$2.44 $2.55
$1.13$1.53
$2.55
$0
$1
$2
$3
$4
$5
$6
$7
$8
$9
$10
Qatar Russia Nigeria US Gom (New) WesternCanada
Mozambique US GOM(Existing)
Project Netback $/mmBtu - High-Income Market Test - JKTC - 2025
Gas Supply Liquefaction Shipping

22
Figure 14: LNG Project Competitiveness $/mmBtu – Low-Income Market Test – NWE 2025
Source: EIA, ICIS Global LNG Markets, Forward Curves CME Group as of 14/12/18, SyEnergy estimates Figure 15: LNG Project Competitiveness $/mmBtu – Low-Income Market Test – IPB 2025
Source: EIA, ICIS Global LNG Markets, Forward Curves CME Group as of 14/12/18, SyEnergy estimates
$1.80 $2.00 $2.25
$0.50$1.74 $1.74
$3.52
$1.88 $1.69$2.25
$4.52$3.79 $3.50
$3.10$1.07 $1.34
$1.20$1.65
$1.79 $2.36$1.20
$0
$1
$2
$3
$4
$5
$6
$7
$8
$9
$10
Nigeria Qatar US GOM(New)
Russia Mozambique WesternCanada
US GOM(Existing)
Project Netback $/mmBtu - Low-Income Market Test - NWE - 2025
Gas Supply Liquefaction Shipping
$2.00 $1.80 $1.74$0.50
$2.25 $1.74
$3.52
$1.69 $1.88
$3.79$4.52
$2.25 $3.50
$3.10
$0.51$1.77
$0.83 $1.42 $2.70$2.06
$2.55
$0
$1
$2
$3
$4
$5
$6
$7
$8
$9
$10
Qatar Nigeria Mozambique Russia US GOM(New)
WesternCanada
US GOM(Existing)
Project Netback $/mmBtu - Low-Income Market Test - IPB - 2025
Gas Supply Liquefaction Shipping

23
Qatar. This is the undisputed most competitive source of LNG supply for all areas considered. The premised indicative benchmark liquefaction cost of $482/tpa may be unrealistically low because the inflation adjustment from MOD at FID to 2018 US dollars may have not captured the full actual cost increase over the period. Nevertheless, with the new brownfield expansions occurring at a cost ranging between $660-$760/tpa (using existing US GOM brownfield projects as a reference), the additional average liquefaction cost increase of $0.80/mmBtu does not materially change the superior affordability or competitiveness of Qatari LNG. The country still has considerable leverage to reduce the premised cost of feedgas supply, if necessary, given the high condensate yield when producing natural gas. The country is in the best competitive position to supply the most promising growth markets of the future – the low-income LNG markets.
Nigeria. Nigeria LNG T7 and Qatar are the only two LNG projects which pass all high/low-income market tests, providing ample opportunity to sell all volumes displacing less competitive alternatives, if necessary. The NLNG project involves debottlenecking T1-6 and a brownfield T7 (replica of T6 with 4.1 Mtpa). NLNG experienced rapid growth from 1999 – 2009 developing 22 Mtpa of LNG capacity in successive expansions with positive cost reduction experience. 15 years have elapsed since NLNG’s last FID and its challenge is to lower the liquefaction cost to compensate for the higher feedgas price it now pays contrasted with the first 10 years of LNG operation. NLNG now pays approximately double the feedgas price paid by Qatar and Sakhalin while having a significant volume of liquids associated with natural gas production. The ability to optimise the overall cost of this expansion, estimated at $4.3bn for an incremental 8 Mtpa, provides NLNG with a very competitive $538/tpa, indicating a liquefaction cost of $1.88/mmBtu. This provides confidence in its ability to supply the growing low-income markets of India, Pakistan and Bangladesh. There is limited competition capable of serving those markets profitably. Securing the desired $7 Billion financing at competitive terms should not be a significant problem because NLNG is debt free with strong cash flow generation.
New US GOM projects. US GOM LNG projects have a natural geographic logistic disadvantage in reaching the high-income JKTC markets when compared with LNG projects sited in Mozambique, Qatar and Sakhalin. The longer shipping distances and Panama Canal toll fees ($1 Million per round trip) increase logistic costs by approximately $1.50/mmBtu, so that cost reduction efforts need to focus on liquefaction and gas supply costs. The new wave of US GOM LNG projects seeking to implement innovations in technology, train sizes, equipment suppliers, financing and upstream integration fare well in this analysis. Subject to actual execution, the ability to cut $2.12/mmBtu from the estimated liquefaction cost of $3.10/mmBtu and feedgas cost of $3.52/mmBtu for 2025 significantly improves the competitiveness of US GOM LNG. The innovations have yet however to demonstrate technical, operational and commercial viability, and deliver the premised $643/tpa cost for greenfield facilities – not a trivial challenge. A timely and strategic investment in increasing natural gas transportation capacity from the Permian, unlocking oil production for producers, in exchange for long-term gas supply contracts locking-in a low feedgas cost could provide sufficient margin to absorb higher liquefaction costs than premised, and/or provide further cost reduction increasing competitiveness.
Venture Global, Tellurian and Next Decade are good examples, but are not the only ones, of projects seeking to develop new liquefaction capacity at $425–575/ton with an indicative unlevered liquefaction tolling fee of $1.50-2.00/mmBtu representing a reduction of $1.60–1.10/mmBtu from the weighted average estimate of $3.10/mmBtu for 2025. With such a reduction in liquefaction tolling fees, but without changes in upstream costs, under the energy price environment considered herein, US LNG projects would become competitive under high-income test for Europe and JKTC markets, but remain uncompetitive under low-income test for Europe, and India, Pakistan or Bangladesh. This highlights the importance for new US LNG projects to optimise and integrate a competitive upstream component into their projects to maximize affordability and their long-term competitiveness for the strategically important low-income markets.
Russia. Provided Sakhalin II LNG T3 can overcome the gas supply uncertainties for the 5.4 Mtpa brownfield LNG expansion before significant momentum builds for Novatek’s competing greenfield

24
Arctic LNG 2, Sakhalin II T3 should be able to reach its FID within 2019-20. There has been no previous brownfield expansion in Russia or the Arctic region but, judging from Novatek’s CWC World LNG Summit presentation in November 2018, Arctic LNG 2 has an ambitious target to reduce costs to $650 - $750/tonne, providing an indicative liquefaction cost of $2.28 - $2.63/mmBtu. Sakhalin’s challenge is to optimise the brownfield expansion and achieve the lowest possible $/tpa cost. For example, the ability to achieve a level similar to LNG Canada (about $1,000/tpa) could provide Sakhalin with an indicative $1.02/mmBtu liquefaction cost reduction from the premised $4.52/mmBtu, which would provide a high-degree of confidence in it being able to supply the challenging NWE and IPB markets under the low-income affordability and competitiveness test.
Mozambique. Mozambique LNG (Anadarko-led) and Rovuma LNG (ExxonMobil-led) have indicated onshore liquefaction costs of $600/tpa and $657/tpa respectively – very impressive considering the remote location, limited existing infrastructure and availability of local skilled labour for the delivery of such megaprojects, and possibly overlapping in the same timeframe. This reminds us of the cost inflation risk faced by multiple Gladstone LNG projects built at the same time in Australia. In the upstream Mozambique has the challenges of 50-70km of submarine gas pipelines, and deepwater and lean gas supply providing less margin to absorb cost increases. Given the lack of specific references for East Africa, this paper adopted the indicative West Africa cost benchmark of $1,084/tpa. If both LNG projects achieve a weighted average liquefaction cost of $630/tpa, a reduction of $1.59/mmBtu from the premised liquefaction costs of $3.79/mmBtu is possible, and could provide Mozambique with sufficient competitiveness to sell LNG to all low/high-income markets. The ability to provide affordable and competitive LNG supply to the low-income markets of India, Pakistan and Bangladesh is a strategic imperative given the short shipping distance and potential demand capable of underpinning successive brownfield LNG expansions. Many pioneer LNG projects in remote locations with limited inward investment are able to secure special fiscal provisions to mitigate potential higher costs, giving them sufficient competitiveness to sell the LNG, and provide confidence to lenders in the project’s ability to repay the sizable loans required. If the Mozambican government is hesitating it should look to Nigeria to witness how well the original support provided to Nigeria LNG has rewarded the country with natural gas infrastructure development, gas supply into power generation, reliable exports, tax revenue and dividend payment.
Western Canada. The analysis in this paper has confirmed the competitiveness of this project in reaching JKTC markets, but not in reaching NWE markets, under the high-income test. If the energy price environment gravitates to the low-income test with challenging oil prices of $45-50/bbl, this project may be limited to JKTC markets because it would be approximately $1.30-1.60/mmBtu short of breakeven when selling into NWE and IPB markets. As Western Canada has a potential second phase of another 14 Mtpa to be developed there is upside, in principle, that a brownfield expansion could reduce the combined upstream and liquefaction costs by 25-30% and improve the overall affordability and competitiveness under the low-income test – not a simple goal to achieve.
Existing US GOM projects. When oil prices were averaging above $80/bbl for over a decade, existing US GOM projects were very competitive. However, with oil prices trending between $60 and 65/bbl, the economic attractiveness for the high/low income markets considered herein have weakened. If upstream costs and liquefaction fees remain unchanged, existing US GOM projects would need oil prices of $65-70/bbl to improve affordability and increase competitiveness against natural gas and LNG prices correlated with oil. In order to be competitive in 2025, under the premised energy price environment, existing US GOM projects need to reduce gas supply and liquefaction cost by approximately $1.00/mmBtu, and reduce them by another $1.00/mmBtu if they are to remain competitive at oil prices of $50/bbl. New US GOM projects pricing gas supply at 115% of Henry Hub, would need to target liquefaction costs of approximately $0.98/mmBtu or $280/tpa to match the new indicative value proposition from New US GOM projects seeking to implement new technologies, train sizes, equipment suppliers and integrating upstream assets without a price reference to Henry Hub.

25
Conclusions Project developers considering how best to mitigate future uncertainties, are best served by minimising all costs under their control along the value-chain – to maximize affordability and competitiveness to a wider potential market. Each LNG project is a unique value chain from reservoir to the buyer’s burner tip whose competitiveness is dynamically assessed over the life of the SPA.
The outlook for competitive LNG supply provides confidence of a bright future for gas. Brownfield expansions, and greenfield projects implementing technology innovations, competitive procurement strategies, commercial business models, project financing, and synergies with upstream oil and gas projects enhance the affordability and dynamic competitiveness of natural gas and LNG.
The premised energy price scenarios for Europe and JKTC markets correlate well with the high-income affordability and competitiveness test at $8.00/mmBtu which is amply met by most projects reviewed. This provides some breathing room for the industry to reduce costs ahead of lower sustained oil prices of approximately $50/bbl and European gas prices close to $6.00/mmBtu, or when lower carbon energy policies significantly curtail hydrocarbon demand pushing the market to find a new lower equilibrium point.
Therefore, in accordance with the premises and analysis in this paper, the real challenge to the future of gas is more directly linked with energy policy formulation, and the speed of global decarbonization rendering natural gas unburnable before it becomes unaffordable. The future of gas and LNG are at greater risk from demand destruction than the inability of the industry to develop and implement new technologies and reduce costs making gas and LNG more competitive and affordable.
In the nearly 55 years of existence of the LNG industry, growth has been constrained in large part by the limits imposed of LNG supply by the complexity of solving technical, commercial, financial and stakeholders’ issues, whose resolution is needed to secure the FID of capital-intensive interconnected value-chain projects. With “lower for longer” energy prices, the complexity of aligning capital-intensive interconnected investments is likely to increase and third-party financing to become more challenging. Brownfield expansions provide more timely, competitive and less risky LNG supply alternatives.
Resource rich countries may need to promote energy policies supporting complex interconnected energy projects, particularly greenfield LNG. The timely actualization of such projects ensures the production of energy resources unlocking the associated social and economic benefits before it is too late - when demand has significantly decreased or production ceased to be economically viable.
For as long as the industry remains supply constrained, LNG suppliers will tend to maximize business with higher-income markets to reduce overall project complexity and increase profit. Even if it is economically feasible to supply LNG to low-income markets, buyers in such markets may find it difficult to secure affordable LNG supplies, or may have to pay a higher price than desired, resulting in the future of gas being dimmed for such low-income markets until LNG supply becomes unconstrained.
The outlook for competitive LNG supply and the future of gas is maximized by the industry’s ability to continue lowering the cost of world-scale plants, increase the technical and economic viability of small-scale LNG and FLNG projects reducing the total investment required, and simplify financing of LNG projects. This will significantly increase the range of viable LNG projects closer to end user markets lowering significant logistic costs and creating additional infrastructure supporting an accelerated adoption of natural gas and LNG as a transportation fuel on land and sea. Both developments will accelerate the commoditisation of gas and LNG enabling merchant LNG project developments ushering a new era where success of future LNG projects will be a direct function of the constant improvement of affordability and dynamic competitiveness.

26
APPENDIX: LNG Shipping Technology Evolution and Costs post IMO 2020 Steam turbines for decades were the only propulsion system available for LNG ships, bringing the simplicity of using the boil-off gas to power the steam turbines, and lower operating and maintenance costs because no gas combustion unit was needed. Dual-fuel diesel-electric (DFDE) and Tri-Fuel Diesel Electric (TFDE) systems came into use over 15 years ago and became the preferred propulsion technology with a 25-30% efficiency gain over steam turbines, and the operational flexibility to use natural gas, diesel and heavy fuel oil (HFO) in the case of TFDE. 38
Coinciding with the steep rise in energy prices of the early to mid 2000s, and the introduction of Q-Flex and Q-Max LNG ships to export Qatari LNG, slow-speed diesel (SSD) propulsion systems were introduced with a boil-off gas (BOG) re-liquefaction plant capable of completely re-liquefying the BOG and returning it to the storage tanks. This propulsion system permits LNG to be transported without any loss of cargo, and can be advantageous especially if using HFO or marine diesel oil (MDO) is cheaper than burning BOG for propulsion fuel. 39 Figure 16 shows the global LNG shipping fleet and order book of new LNG ships by propulsion technology.
All qualities of LNG can be burned with the same high efficiency, and operation on natural gas can occur in the load range from 10% to 100%. In addition, depending on the fuel availability on board, the engine can combust any ratio of natural gas and HFO/MDO. The ME-GI (M-type, Electronically Controlled, Gas Injection) engine is ignited on diesel, and changeover to gas operation can take place at 10% engine load. Both HFO and MDO can be used as pilot fuel. ME-GI vessels generate negligible methane slip during gas operation making it the most environmentally-friendly technology available. Including methane slip, this can lead to a 22% reduction of greenhouse gas emissions, compared to fuel oil. Another advantage of gas-fuelled tonnage is the ability to adjust operation according to changing fuel prices and exhaust-emission limits. Service experience shows that the ME-GI engine delivers significant reductions in CO2, NOx and SOx emissions.40
Figure 16: LNG Ships Newbuild ($M)
Source: Höegh LNG Partners LP SEC F-1 Form 3 July 2014, Astrup Fearnley LNG 38 ‘IGU World Gas LNG Report – 2018 Edition, LNG Carriers’ 39 ‘IGU World Gas LNG Report – 2018 Edition, LNG Carriers’ 40 ‘Flex LNG – Fleet – 2-Stroke Propulsion’, www.flexlng.com/2-stroke-propulsion/

27
Figure 17: Newbuild LNG Ship Price Indications
Source: Höegh LNG Partners LP SEC F-1 Form 3 July 2014, Astrup Fearnley LNG In 2017 the new LNG X-DF propulsion system was delivered. This low-pressure dual-fuel technology is a further development of Wärtsilä’s well-proven medium-speed dual-fuel engines. As an alternative to DFDE propulsion systems it is estimated to offer capital expenditure reductions of 15–20% via a simpler and lower cost LNG and gas handling system. 41 In contrast to high-pressure gas injection engines, which operate on the Diesel cycle, the X-DF engines work on the Otto cycle when operated in gas mode – i.e. ignition of a compressed lean air/gas mixture by injection of a very small amount of liquid pilot fuel. The X-DF engines meet the regulations of IMO’s Tier III NOx limits in gas mode in Emission Control Areas (ECA) by considerable margins without any additional exhaust gas abatement measures such as Exhaust Gas Recirculation (EGR) or Selective Catalytic Reduction (SCR). With liquid fuel consumption for pilot ignition below 1% of total heat release and with practically no sulphur content in LNG, X-DF technology is thought to be a reliable solution to achieve the 0.5% global cap on sulphur in marine fuels proposed to become effective January 2020. 42
LNG shipping is a very competitive and cyclical business and has managed over the long term to offer higher transportation capacity and more efficient propulsion systems for essentially the same newbuild price ranging between $190-210 million over the last 10 years as shown by Figures 16 and 17. Over this period, LNG tanker carrying capacity has increased by ~20% and the energy efficiency of propulsion systems has improved by ~40%. As shown in Figure 18, long-term charter rates over the last five years have oscillated between $70-75,000/day.
41 ‘IGU World Gas LNG Report – 2018 Edition, LNG Carriers’ 42 ‘Flex LNG – Fleet – 2-Stroke Propulsion’, www.flexlng.com/2-stroke-propulsion/

28
Figure 18: Estimated Long-term and Spot Charter Rates US$ 000/day, 2011–2019
Source: Höegh LNG Q3 2018 Company Presentation, Astrup Fearnley, IHS Markit The sudden and large increase in LNG shipping spot charter rates over the last two years is largely driven by the strength and rapid change of Chinese LNG demand triggered in turn by an air pollution-prevention-and-control programme stipulating that coal-fired boilers in key regions should be replaced with gas-fired ones. Between 2015 and 2017, China's LNG imports doubled and pipeline gas imports more than doubled. According to data from China's General Administration of Customs LNG imports grew by 33% in 2016 and 46% in 2017, and are on track to grow another 50% in 2018 reaching 58 MT – almost trebling the 19.7 MT consumed in 2015.43 According to the IEA, China will add 120 bcm of new gas demand between 2017–23 and account for nearly 40% of the growth driven by clean air policy.
In 2016, the International Marine Organization (IMO) agreed to limit the sulphur content in all marine fuels to 0.5 % beginning in 2020, with the exception of fuel burned in Sulphur Emission Control Area regions, which are already at the lower sulphur limit of 0.1% since 2015. Under the new global cap, ships will have to use marine fuels with a sulphur content of no more than 0.5%S against the current limit of 3.5%S in an effort to reduce the amount of sulphur oxide, as shown by Figure 19.
43 ‘China: Enter the smokeless dragon’, Alex Forbes, Petroleum Economist, 25 September 2018

29
Figure 19: IMO 2020 – Sulphur Content Specification – Global and Emission Control Areas
Source: Shell Supply Trading According to Shell the global transition from 3.5%S to 0.5%S will cause more changes to global marine industry than the switch to the 0.1%S fuel in the ECAs. This will affect approximately 75% of the global marine fuel demand, some 3 million barrels/day of High Sulphur Fuel Oil that will need to switch to 0.5%S fuel.
There are three main ways of complying with the sulphur limit, with trade-offs between up-front capital costs and fuel costs. The simplest method is to use a cleaner compliant liquid fuel, which would require a few small changes to widely understood ship propulsion technology, but the compliant fuels are expected to be considerably more expensive. A second compliance method is to install scrubbers to remove sulphur from the exhaust gases. Since the standard is an emissions standard, and not a fuels standard, the installation of scrubbers provides ship owners the opportunity to burn high-sulphur fuels which are expected to drop in price due to lower demand. The third option is thought to be the most capital-expensive, to power ships with a much cleaner fuel – LNG – which would require significant retooling if not the complete replacement of the ships’ engines, rendering this option unfeasible for existing ships and more suitable for newbuilds. However, LNG offers the opportunity to use a lower cost fuel, with significantly lower NOx and CO2 emissions. 44
Given the technical and commercial uncertainties about the preferred compliance method for existing vessels, the majority of players are expected to use cleaner compliant liquid fuel, which minimises downtime, and monitor fuel prices post 2020, investments in refining capacity, and the cost of scrubbers before deciding on the best course of action.
According to Argus Marine Fuels, the peak HSFO price was reached in Q3 2018 and prices are expected to decline and continue to fall by about $300/t between Q3 2018 and Q1 2020. The price spread between HSFO 380cst and 0.1pc marine gasoil (MGO) has stood around $210-280/t for 2018, but is expected to rise to around $380-440/t by Q4 2019 and reach $500-600/t by Q1 2020. Argus forecast that 0.5%S fuel oil will be priced at approximately a $420-460/t premium to HSFO from January 2020.45
In contrast to Argus forecasts, the forward market as at October 2018 did not price similar steep discounts for HSFO after 2020. In Singapore, HSFO 380cst bunkers for Q1 2020 traded at less than
44 ‘IGU World Gas LNG Report – 2018 Edition, LNG Carriers’ 45 ‘Argus Marine Fuels Outlook’, Issue 18-1, 10 October 2018, page 4

30
$100/t below the Q3 2018 price. This suggests, in the early days of this new assessment, the market does not yet expect the sulphur switch to have the impact many others think that it will.46
As the fleet of maritime vessels continues to be upgraded, and older less efficient vessels retired, the proportion of existing ships fitted with scrubbers capable of consuming HSFO 380cst will tend to diminish. As newer ships with more advanced and efficient propulsion systems, including LNG as a fuel, enter trade, demand for Marine Fuel 0.5%S would tend to increase. As this paper focuses on 2025, estimates for IMO 2020 Marine Gasoil would be adjusted along the lines of the Argus estimate.
Figure 20: 380cst RDAM HSFO Regression
Figure 21: French Gasoil NWE Regression
46 ‘Argus Marine Fuels Outlook’, Issue 18-1, 10 October 2018, page 5
y = 5.6583x - 29.523R² = 0.9626
0
100
200
300
400
500
600
700
800
900
1,000
30 40 50 60 70 80 90 100 110 120 130
Brent $/bbl and FO Bunker 380cst RDAM $/t (01/00 - 11/18)
y = 8.4558x + 14.811R² = 0.9848
0
100
200
300
400
500
600
700
800
900
1,000
1,100
1,200
1,300
30 40 50 60 70 80 90 100 110 120 130
Brent $/bbl and French Gasoil NWE $/t (01/00 - 11/18)

31
Figure 22: 380cst SING HSFO Regression
Figure 23: Marine Gasoil SING Regression
Source figures 20, 21, 22, 23: World Bank, Argus Marine Fuels, SyEnergy Figures 20 - 23 provide regression equations based on 18 years of Brent, 380cst Rotterdam HSFO, French Gasoil NWE, SING HSFO and SING Marine Gasoil to estimate IMO 2020 compliant bunker fuel prices for 2025 reflecting the estimated spread from Argus Marine Fuels.
y = 5.7294x - 10.985R² = 0.9616
0
100
200
300
400
500
600
700
800
900
1,000
30 40 50 60 70 80 90 100 110 120 130
Brent $/bbl and FO Bunker 380cst SING $/t (01/00 - 11/18)
y = 8.3901x + 24.6
R² = 0.9828
0
100
200
300
400
500
600
700
800
900
1,000
1,100
1,200
1,300
30 40 50 60 70 80 90 100 110 120 130
Brent $/bbl and Marine Gasoil SING $/t (01/00 - 11/18)

32
Argus launched in October 2018 an IMO 2020 compliant marine fuel price assessment for low-sulphur fuel oil (LSFO) for the shipping fuel market in Singapore.47 S&P Global Platts launched in January 2019 an assessment of FOB Singapore Marine Fuel 0.5% as part of its worldwide launch of pricing assessments for the low sulphur fuel ahead of IMO 2020 implementation.48
Tables 6 – 11 exhibit detailed LNG shipping cost calculations in $/mmBtu for January 2025 from Gulf of Mexico, Western Canada, Mozambique, Nigeria, Qatar and Sakhalin to a range of European, India, Pakistan and Far Eastern markets based on author’s calculations information sourced from from GTT, Höegh LNG, WoodMac, Argus, and Astrup Fearnley. The following premises were utilized in the calculations:
LNG Tanker Size (m3): 180,000 267,335
Feedgas/LNG CV (HHV Btu/scf): 1,178 1,178
LT Charter Hire $/day: $72,000 $100,000
Port Fees: $413,527 $516,909
Average Steaming Speed (knots): 17 17
LNG Heel (%): 0.015 0.015
Loading & Unloading Operations (d): 2 3
Port & Weather Delays [FE/AB] (d): 2 / 1 2 / 1
Bunkers IMO 2020 FO 0.5%S ($/mt): $670 $670
Bunker Fuel (mt/d) at Sea/Port: 110 / 25 165 / 40
Boil Off Cost ($/mmBtu): $8.00 $8.00
Boil Off (%) / Day: 0.001 0
Trading Days: 355 355
Suez Tolls $/Million (round trip): $1.074 $1.297
Panama Tolls $/Million (round trip): $0.995 $1.276
47 ‘Argus launches first new IMO 2020 compliant marine fuel assessment’, Argus Press Release, 01 October 2018 48 ‘Platts new 0.5% marine fuel assessment hits $366.18/mt in Singapore’, S&P Global Platts, 02 January 2018

33
Table 6: LNG Shipping Costs US GOM $/mmBtu – 180K m3 ME-GI Tanker – January 2025
Table 7: LNG Shipping Costs W. Canada $/mmBtu – 180K m3 ME-GI Tanker – January 2025

34
Table 8: LNG Shipping Costs Mozambique $/mmBtu – 180K m3 ME-GI Tanker – January 2025
Table 9: LNG Shipping Costs Nigeria $/mmBtu – 180K m3 ME-GI Tanker – January 2025

35
Table 10: LNG Shipping Costs Qatar $/mmBtu – 267K m3 QMax SSD Tanker – January 2025
Table 11: LNG Shipping Costs Sakhalin $/mmBtu – 180K m3 ME-GI Tanker – January 2025

36
Glossary % Percent
$ US dollars
$ bn One billion US dollars
$/mmBtu Unit cost of production expressed as $ per million Btu
$/tpa Unit cost of production expressed as $ per tonne per annum
B or bn Billion
bbl Barrel
bbl/d Barrels per day
Bcf Billion cubic feet
Bcf/d Billion cubic feet per day. Flowrate or production unit of natural gas used in North America
Bcm Billion cubic metres
Bcma Billion cubic metres per annum
BOG Boil-off Gas
Brent Major trading classification of sweet light crude oil serving as a benchmark price for crude oil purchases.
Brownfield A new facility or expansion of an existing facility constructed on an existing site
Btu British thermal unit
Capex Capital Expenditure
DAT Delivery at Terminal
Debottlenecking Increasing plant capacity by removing low cost production constraints
DFDE Ship propulsion technology. Dual-fuel diesel-electric
EPC Engineering, Procurement and Construction
FEED Front-end engineering and design contract
FERC United States Federal Energy Regulatory Commission
FID Final Investment Decision – Typically made by shareholders when all agreements (sales and construction) are executed after all government, permits and approvals are in place.
FLNG Floating liquefaction and LNG storage vessel
FOB Free on Board
FSRU Floating storage and regasification unit. A floating LNG regas terminal
GECF Gas Export Countries Forum
Greenfield A new facility constructed on a new site

37
Henry Hub Pipeline interchange near Erath, Louisiana. Standard delivery reference point for US natural gas future contracts
HFO Ship bunker fuel. Heavy Fuel Oil
HOA Heads of agreement - preliminary agreement covering key terms
HSFO Ship bunker fuel. High Sulphur Fuel Oil
JKM Platts Japan Korea Marker (JKM™) is the LNG benchmark price assessment for spot physical cargoes delivered ex-ship into JKTC
JKTC Japan, Korea, Taiwan and China
km Kilometre
Knot unit of speed of navigation equivalent to 1,852 metres per hour
Kt Thousand tonnes
LNG Liquefied natural gas. Odourless, colourless, natural gas at atmospheric pressure in liquid phase at approximately -160C / -260F
LNG tanker A tanker ship designed for transporting LNG
LPG Liquid petroleum gas. Pressurised or refrigerated propane and/or butane
M Million
m3 Cubic metres
MCHE Main cryogenic heat exchanger. Where most of the cryogenic temperature reduction in an LNG plant takes place
MDO Ship bunker fuel. Marine Diesel Oil
ME-GI Ship propulsion technology. M-type, Electronically Controlled, Gas Injection
Mm3 Million cubic metres
mmBtu Million Btu
mmscf Million standard cubic feet
mmscfd Million standard cubic feet per day
MOD Money of the day
MT Million tonnes
Mtpa Million tonnes per annum
NBP The National Balancing Point, a virtual trading point for natural gas in the United Kingdom
Netback An indication of gross profit prior to income taxes.The amount remaining after deduction of all costs associated with the production and sale of LNG delivered at a regasification facility in the market of the LNG buyer.
NWE Northwest Europe (United Kingdom, Netherlands and Belgium)

38
South Asia West and East India, Pakistan, and Bangladesh (IPB)
Southeast Asia Japan, South Korea, Taiwan, and China (JKTC)
SPA Sales and Purchase Agreement. In the LNG business, majority are for 20 years, but can be of any duration agreed by buyer and seller.
SSD Ship propulsion technology. Slow-speed diesel
SSGI Ship propulsion technology. Slow-speed gas injection
Tcf Trillion cubic feet
TFDE Ship propulsion technology. Tri-fuel diesel-electric
Tonne Metric ton equal to 1,000 kilograms
tonnes/day Tonnes per day
tpa Tonnes per annum
TTF The Title Transfer Facility, more commonly known as TTF, is a virtual trading point for natural gas in the Netherlands
US United States
US GOM United States Gulf of Mexico
USA United States of America
X-DF Ship propulsion technology. Low pressure dual-fuel