Outline: High Latitude Surface Fluxes: Requirements …sgille/highlat/hilatr_manuscript_v29s.pdf1...
25
1 High-Latitude Ocean and Sea Ice Surface Fluxes: Requirements and Challenges for Climate Research Mark Bourassa 1 , Sarah Gille 2 , Cecilia Bitz 3 , David Carlson 4 , Ivana Cerovecki 2 , Meghan Cronin 5 , Will Drennan 6 , Chris Fairall 7 , Ross Hoffman 8 , Gudrun Magnusdottir 9 , Rachel Pinker 10 , Ian Renfrew 11 , Mark Serreze 12 , Kevin Speer 1 , Lynne Talley 2 , Gary Wick 13 1 Florida State University, Tallahassee, Florida 2 University of California San Diego 3 University of Washington, Seattle 4 British Antarctic Survey, Cambridge, United Kingdom 5 National Oceanic and Atmospheric Administration (NOAA) Pacific Marine Environmental Laboratory, Seattle, Washington 6 University of Miami, Florida 7 NOAA Earth System Research Laboratory, Boulder, Colorado 8 Atmospheric and Environmental Research, 9 University of California Irvine, 10 University of Maryland, College Park 11 1University of East Anglia, Norwich, United Kingdom 12 University of Colorado, Boulder, 13 NOAA Environmental and Technology Laboratory, Boulder, Colorado Corresponding Author: Sarah Gille, Scripps Institution of Oceanography, University of California San Diego, 9500 Gilman Dr. Mail Code 0230, La Jolla, CA 92093-0230, United States. E-mail: [email protected] Abstract: Improving knowledge of air-sea exchanges of heat, momentum, fresh water, and gases is critical to understanding climate, and this is particularly true in high-latitude regions, where anthropogenic climate change is predicted to be exceptionally rapid. However, observations of these fluxes are extremely scarce in the Arctic, the Southern Ocean, and the Antarctic marginal seas. High winds, high sea state, extreme cold temperatures, seasonal sea ice, and the remoteness of the regions all conspire to make observations difficult to obtain. Annually averaged heat-flux climatologies can differ by more than their means, and in many cases there is no clear consensus about which flux products are most reliable. Although specific flux accuracy requirements for climate research vary depending on the application, in general fluxes would better represent high-latitude processes if wind stresses achieved 0.01Nm -2 accuracy at high wind speed and if heat fluxes achieved 10 W m -2 accuracy (averaged over several days) with 25 km grid spacing. Improvements in flux estimates will require a combination of efforts, including a concerted plan to make better use of ships of opportunity to collect meteorological data, targeted efforts to deploy a few flux moorings in high-wind regions, and improved satellite retrievals of flux-related variables. Short summary: Air-sea fluxes at high latitudes are critical for evaluating climate processes, but they have been sparsely measured in the past and the physics is not yet well understood.
Transcript of Outline: High Latitude Surface Fluxes: Requirements …sgille/highlat/hilatr_manuscript_v29s.pdf1...

1
High-Latitude Ocean and Sea Ice Surface Fluxes: Requirements and Challenges for Climate Research
Mark Bourassa1, Sarah Gille2, Cecilia Bitz3, David Carlson4, Ivana Cerovecki2, Meghan Cronin5, Will Drennan6, Chris Fairall7, Ross Hoffman8, Gudrun Magnusdottir9, Rachel Pinker10, Ian Renfrew11, Mark Serreze12, Kevin Speer1, Lynne Talley2, Gary Wick13 1Florida State University, Tallahassee, Florida 2University of California San Diego 3University of Washington, Seattle 4British Antarctic Survey, Cambridge, United Kingdom 5National Oceanic and Atmospheric Administration (NOAA) Pacific Marine Environmental Laboratory, Seattle, Washington 6University of Miami, Florida 7NOAA Earth System Research Laboratory, Boulder, Colorado 8Atmospheric and Environmental Research, 9University of California Irvine, 10University of Maryland, College Park 111University of East Anglia, Norwich, United Kingdom 12University of Colorado, Boulder, 13NOAA Environmental and Technology Laboratory, Boulder, Colorado Corresponding Author: Sarah Gille, Scripps Institution of Oceanography, University of California San Diego, 9500 Gilman Dr. Mail Code 0230, La Jolla, CA 92093-0230, United States. E-mail: [email protected] Abstract: Improving knowledge of air-sea exchanges of heat, momentum, fresh water, and gases is critical to understanding climate, and this is particularly true in high-latitude regions, where anthropogenic climate change is predicted to be exceptionally rapid. However, observations of these fluxes are extremely scarce in the Arctic, the Southern Ocean, and the Antarctic marginal seas. High winds, high sea state, extreme cold temperatures, seasonal sea ice, and the remoteness of the regions all conspire to make observations difficult to obtain. Annually averaged heat-flux climatologies can differ by more than their means, and in many cases there is no clear consensus about which flux products are most reliable. Although specific flux accuracy requirements for climate research vary depending on the application, in general fluxes would better represent high-latitude processes if wind stresses achieved 0.01Nm-2 accuracy at high wind speed and if heat fluxes achieved 10 W m-2 accuracy (averaged over several days) with 25 km grid spacing. Improvements in flux estimates will require a combination of efforts, including a concerted plan to make better use of ships of opportunity to collect meteorological data, targeted efforts to deploy a few flux moorings in high-wind regions, and improved satellite retrievals of flux-related variables.
Short summary: Air-sea fluxes at high latitudes are critical for evaluating climate processes, but they have been sparsely measured in the past and the physics is not yet well understood.

2
1. Introduction
Summertime sea-ice loss in the Arctic and a rapid collapse of several Antarctic ice shelves have caught scientists, as well as the general public, by surprise. These dramatic changes in ice-cover, and the related warming of high-latitude regions, will likely reverberate throughout the physical, ecological and social systems of the planet. Predicting the rate and trajectory of polar changes will require enhanced collaboration among meteorologists, oceanographers, ice physicists and climatologists; new combinations of in situ measurements and satellite remote sensing; and close interaction between observers and modelers. The surface fluxes at high latitudes - the vertical exchanges of heat, momentum and material between the ocean, atmosphere and ice - constitute the critical coupling of these earth system components and are the focus of enhanced scientific collaborations; they also present a serious challenge to improved predictions.
This paper introduces the unique challenges of determining surface fluxes at high latitudes, defined to include the Arctic, Subarctic, Antarctic, and the Southern Ocean. We evaluate the current capabilities of direct measurements, remote sensing, and gridded numerical estimations to provide accurate high-latitude fluxes, and outline from several perspectives the requirements for improved measurements and modeling. Our focus is on ocean-atmosphere fluxes, though we briefly address radiative fluxes over high-latitude sea ice.1
High-latitude fluxes differ markedly from those in temperate regions because of ice, frequent high wind speeds, low winter temperatures, a large seasonal temperature range, and small-scale spatial variability, particularly along ice margins and around leads. Physical understanding gained in temperate regions is not necessarily applicable to high latitudes. The severe high-latitude environment also poses logistical challenges. Capturing an annual cycle in fluxes, for example, requires that instruments function through long periods of cold polar darkness, often far from support services, in conditions subject to icing. Such constraints are reflected in a relative paucity of standard surface and upper air meteorological data and an almost complete absence of moored or free-drifting sensor systems in large areas of the polar oceans, particularly those covered with seasonal or multi-year ice.
More detailed information assembled through the course of our work will be available from the US CLIVAR high-latitude surface flux working group web site: http://www.usclivar.org/hlat.php.
While polar surface fluxes are poorly observed, they are critically important for the climate system. Figure 1 illustrates the complexity of surface fluxes in high-latitude regions.2
Subtle changes in surface fluxes can have profound long-term impacts on environmental conditions in the Arctic and Antarctic, which in turn can influence physical processes at lower latitudes. Even modest errors in our estimate of fluxes can impede our ability to understand current climate and to predict likely changes.
2. Surface Fluxes in High Latitudes
Wind stress plays a fundamental role in air-sea exchanges since it not only transfers momentum from the atmosphere to the ocean surface, but it also influences heat, freshwater, and gas fluxes. Therefore many of the issues relevant to momentum fluxes apply more broadly, and we hence begin by examining momentum fluxes. 1 We do not consider energy or material fluxes over land surfaces or freshwater fluxes from land to ocean. The SWIPA
assessment (Snow, Water, Ice, Permafrost of the Arctic) will soon provide an up-to-date description of surface and lateral fluxes and net mass changes of the Greenland ice sheet, and various international organizations have described the needs and challenges of measuring carbon fluxes over tundra and terrestrial permafrost regions.
2 At large scales, horizontal transports of energy, momentum and mass are considered to be small compared to inputs at the surface of the ice or ocean (e.g., Dong et al, 2007).

3
a. Momentum Flux Standard meteorological instrumentation packages deployed on ships and buoys provide direct
measurements of wind speed (in m s-1) but not wind stress (i.e., momentum flux, in N m-2). Direct measurement of wind stress requires expensive instruments, frequent maintenance, and careful quality control. Direct wind stress measurements are used to calibrate and validate indirect methods that estimate momentum fluxes from commonly measured variables such as mean wind speed, and temperature. The indirect methods, known as bulk-flux algorithms (e.g., Fairall et al. 2003), form the basis for ocean-surface boundary conditions in virtually all climate and weather models and in retrievals of turbulent fluxes from satellite data.
Most wind-based bulk-flux algorithms have been developed and calibrated for data-rich temperate latitudes with moderate winds. In contrast, winds over polar oceans are among the strongest in the world (Sampe and Xie 2007). As illustrated in Fig. 2, the Southern Ocean, the North Atlantic and Pacific storm tracks, and high-latitude regions downstream of high orography can have wind speeds exceeding 25 m s-1. Such speeds are rarely observed in temperate regions, and extrapolation of bulk-flux parameterizations to these wind ranges is highly uncertain. However, even standard wind speed measurements are rare over high-latitude oceans. Extending the existing network of flux buoys to high latitudes has proven difficult, because oceanographic instruments that might provide surface flux validation need to withstand high winds and rough seas as well as low temperatures (e.g. Moore et al. 2008).
Problems in estimating momentum fluxes at high wind speeds using the bulk formula are further compounded in that the dominant physical mechanisms that govern momentum transfer may change as winds increase. Strong winds can drive high waves, and wind-wave interactions can alter surface momentum fluxes. For example, a steady wind blowing straight into large swells will generate more surface stress than the same wind going with the swells (Bourassa 2006). There is little agreement on how this should be modeled (e.g., Bourassa et al. 1999). Also potentially important at extreme wind speeds is sea spray (particularly so for heat fluxes); progress on enhancing bulk algorithms to characterize spray contributions continues (e.g., Andreas et al. 2008), but direct measurements of these effects remain difficult.
In the sea-ice margins where ice intermixes with open water, sharp spatial gradients in wind speed, surface roughness, air temperature and sea surface temperature (SST) are common. Even the concept of the sea-ice margins may lose definition, as large areas of summer sea ice in both hemispheres develop extensive leads, polynyas, channels, ponds and holes. These gradients are challenging for flux calculations, as bulk methods assume homogeneity of the surface on 100-1000m scales. Sea-ice margins are ill-suited for moorings (which survive best in open water) or for ice camps (which require solid ice), so remote sensing instruments aboard either aircraft or satellite have served as important tools for studying them. Even so, given the small length scales of the sea ice margins relative to the typical pixel size (footprint) of remote sensing instruments, determining instantaneous local fluxes or validating average regional fluxes is challenging.
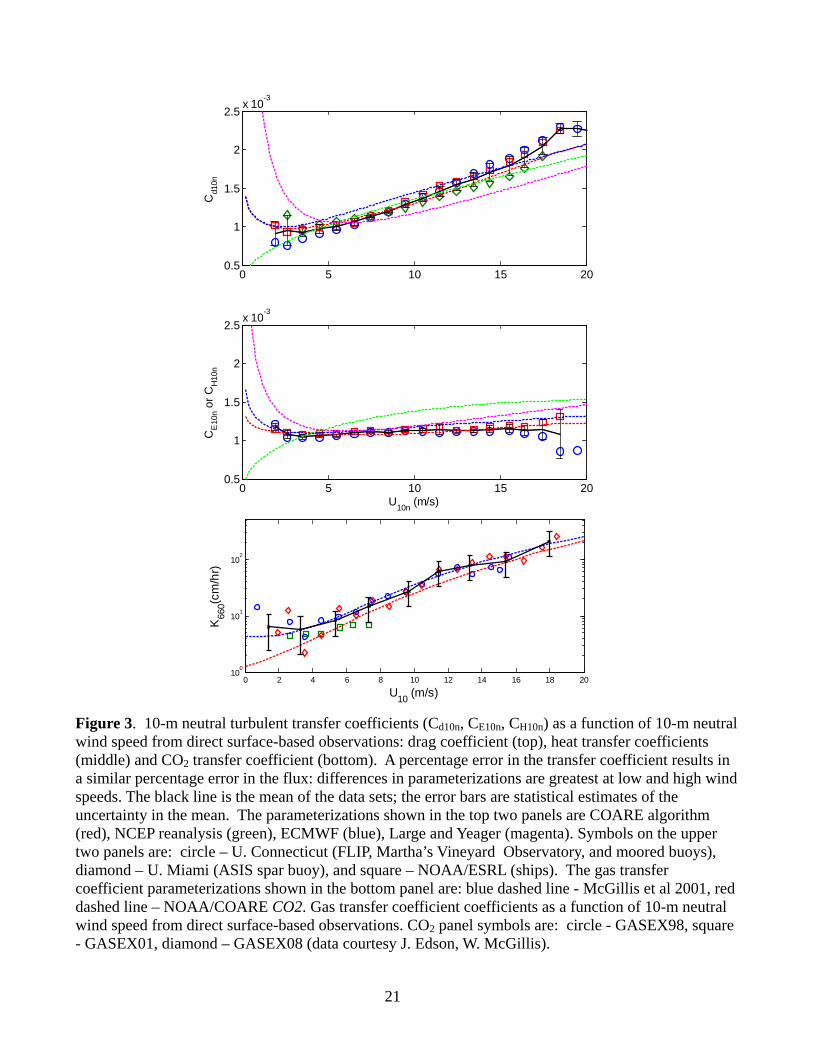
Over solid sea ice, bulk formulae can be applied to parameterize the momentum flux, using modifications to account for the frozen surface (see Brunke et al. 2009). Intercomparison of transfer coefficients from different times, locations, and surface conditions is difficult. Flux algorithms (Fig. 3) tend to agree for wind speeds between 3 and 14 m s-1 where (not coincidently) data are plentiful. However, spatio-temporal variations in fluxes over ice are masked when the only information reported consists of regionally or temporally averaged fluxes and averaged wind speeds.
Because in situ data are sparse, for many applications one must determine how to extrapolate from point measurements to obtain regional or global coverage at the desired temporal resolution. In this regard, problems in estimating high-latitude fluxes are not remarkably different from those in other regions. Climate researchers and ocean modelers often use gridded flux fields inferred by applying

4
flux parameterizations to numerical weather prediction (NWP) grids of basic physical variables, such as surface wind speed. Unfortunately, these NWP products also suffer from the lack of input data.
Satellite data are widely used to estimate open-ocean momentum fluxes. The sampling from a dual-swath or wide-swath scatterometer (e.g., QuikSCAT) is sufficient to determine monthly average stresses with a random error smaller than 0.01 N m-2 (inferred from Schlax et al. 2001); however, there could be a bias related to sampling of the diurnal cycle. Differences between monthly scatterometer observations and data collected from merchant marine ships (Bourassa et al. 2005) are small for regions with good ship traffic; however, they are quite different and biased in areas of poor coverage (Risien and Chelton 2008; Smith et al. 2009). Consequently, purely in situ products are not recommended for high-latitude fluxes or flux-related variables. The rapid evolution of high-latitude weather systems results in poor temporal sampling, even from a wide-swath polar-orbiting satellite such as QuikSCAT. Although scatterometer surface coverage is much better at high latitudes, calibration of scatterometers for very high wind speeds remains a serious problem due to the paucity of good comparison data for wind speeds greater than roughly 20 m s-1 and saturation of the radar return signal during such conditions. Such wind speeds are often associated with rain, which modifies retrievals (Draper and Long 2004; Weissman et al. 2002; Weissman and Bourassa 2008). For high-latitudes these errors are small; however, most of the calibration data are from tropical and subtropical regions.
b. Energy Fluxes The net energy flux is the sum of net radiative fluxes, sensible heat, and latent heat (e.g., Fig.1).
Radiative fluxes (measured per unit surface area) comprise the shortwave (SW) radiation from the sun impinging on the ocean (or ice) surface and the longwave (LW) radiation emitted from the surface and by the atmosphere. The latent heat flux is the rate at which energy associated with the phase change of water is transferred from the ocean to the atmosphere. Similarly, the sensible heat flux is the rate at which thermal energy (associated with heating, but without a phase change) is transferred from the ocean or ice to the atmosphere.
1) Radiative Fluxes Most in situ radiative flux data for high latitudes come from land-based radiometer measurements.
There are almost no observations of radiative fluxes (SW or LW) over high-latitude oceans. The high albedo of snow and ice together with the cold and fairly dry atmosphere result in a surface net radiation deficit for most months. Cloud cover typically reduces the radiation deficit (Pietroni et al. 2008) by absorbing longwave radiation and reemitting some of it back towards the surface; however, the characteristics of clouds and aerosols in polar regions that influence surface radiative forcing are poorly known (Lubin and Vogelmann 2006). Pietroni et al. (2008) concluded that differences in longwave radiation and net longwave flux occurrence distribution between two Antarctic sites, one near the coast and one on the continent, were strongly related to differences in cloud cover.
Gridded fields of radiative fluxes are derived from satellite data and/or numerical models. Estimates of radiative fluxes from different satellite-based products disagree strongly in polar regions (Fig. 1 in Wild et al. 2001). None of the current inference schemes adequately represent influences of the pronounced spatial heterogeneity in sea ice conditions. Several investigators have focused on verifying parameterizations of downward longwave (LW¯) radiation using year-round data (König-Langlo and Augstein 1994); polar summer data (Key et al. 1996); or polar winter/late-autumn data (Guest 1998; Makshtas et al. 1999). The parameterization of König-Langlo and Augstein (1994) reproduced the observations with root-mean-square (RMS) deviations of less than 16 W m-2. Liu et al. (2005) indicated that the surface downward shortwave radiative fluxes derived from satellites are more accurate than those from the NCEP and ECMWF reanalysis datasets, due to the better information on cloud properties. The Surface Heat Budget of the Arctic Ocean (SHEBA) project showed that satellite-

5
based analysis may provide downward shortwave radiative fluxes to within ~10-40 W m-2 and longwave fluxes to ~10-30 W m-2 of surface observations (Perovich et al. 1999).
Radiative fluxes represented in global climate models (GCMs) also show substantial discrepancies in polar regions. Sorteberg et al. (2007) compared the surface energy budget over the Arctic (70-90°N) from 20 coupled models used in the IPCC Fourth Assessment Report with five observationally based estimates and output from atmospheric reanalyses. Fluxes from the models have a large bias, maximized over marginal ice zones. Significant underestimates are documented at observation sites in cold and dry climates with low LW¯ emission, which implies an excessively strong meridional gradient of LW¯ in the GCMs. Iacono et al. (2000) found a substantial increase in the LW¯ at high latitudes in GCMs that used improved formulations of the water vapor continuum.
2) Sensible and Latent Heat Fluxes Sensible and latent heat fluxes determine the turbulent transfer of heat (energy) between the
atmosphere and ocean. They depend on wind speed, air-sea temperature difference or saturated-actual specific humidity difference, and also the atmospheric stability. Like momentum fluxes, they are rarely measured directly but are typically estimated from standard meteorological variables using bulk parameterizations developed in temperate latitudes. Thus they suffer from some of the same problems as momentum fluxes: in situ data are sparse and parameterizations questionable. Furthermore, since parameterizations of turbulent heat fluxes are proportional to the square root of the wind stress, biases and uncertainties in the stress parameterization result in errors in the turbulent heat fluxes (Kara et al. 2007). Errors in latent heat flux also affect the freshwater flux, further multiplying the error effects.
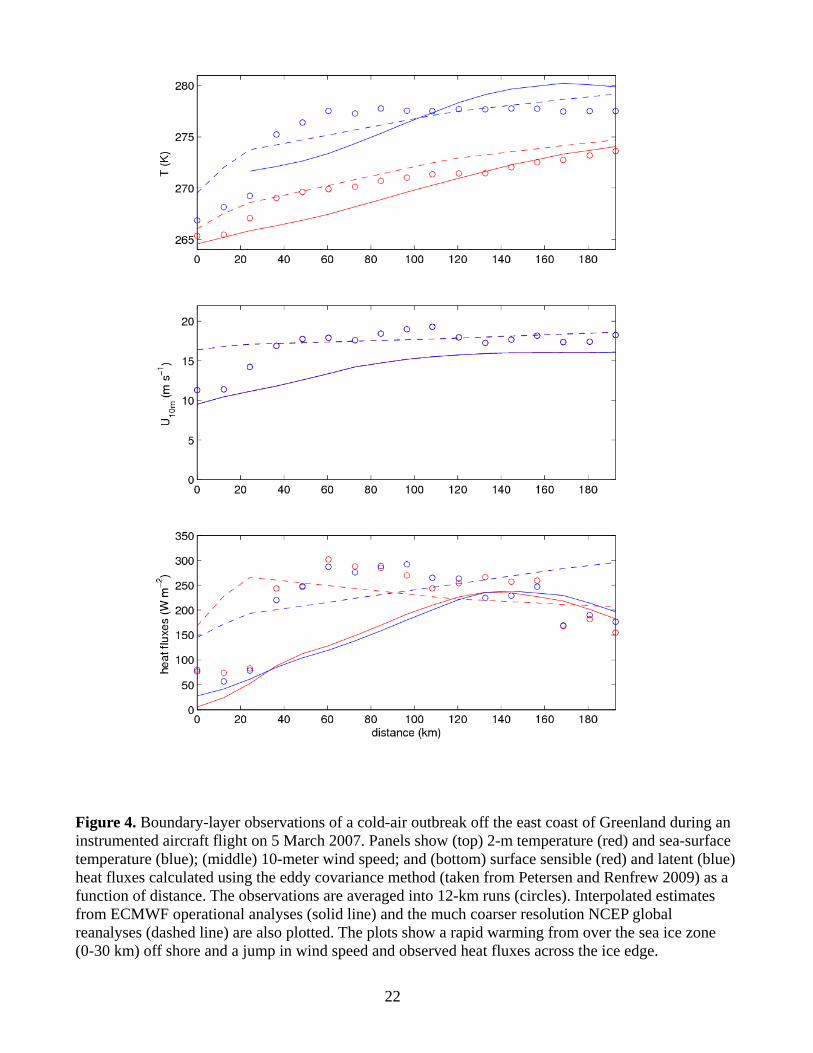
In polar regions, event-driven turbulent fluxes often dominate seasonal or even annual averages; storm-driven turbulent heat and moisture fluxes may exceed in magnitude all other terms in a regional Arctic surface energy budget. Polar events include intense mesoscale cyclones (polar lows), topographically-forced winds (e.g., Fig. 2 around Greenland and Antarctica), and cold air outbreaks from land (or ice) to ocean. This presents a compound problem since associated clouds and precipitation reduce the quality and availability of remotely sensed data. Other difficulties in polar regions include: (1) smaller Rossby numbers and so a reduction in scale of circulations leading to resolution problems in data assimilation and numerical simulations (e.g., Chelton et al. 2006); (2) in the case of cold-air outbreaks over relatively warm ocean, very high sensible heat fluxes (e.g. Shapiro et al. 1987) that are poorly sampled from satellite and poorly represented in NWP products; and (3) sharp spatial gradients in boundary-layer temperature, humidity and stability which can be problematic to capture in meteorological analyses. For example, in the NCEP reanalyses, Fig. 4 shows that over the sea-ice (0-30 km) the SST and wind speed are too high, leading to an overestimate in the heat fluxes. On the other hand, in the ECMWF operational analyses, just off the ice-edge (40-120 km) the 2-m temperature and the 10-m wind speed are both too low, leading to local underestimation of the heat fluxes.
While there exist a plethora of products with sensible and latent heat fluxes (see the summary of Smith et al. 2009), most are of very questionable quality at high latitudes (e.g. Kubota et al., 2003). Fig. 5 demonstrates that sensible and latent heat fluxes from several widely-used gridded flux products are inconsistent on monthly time scales. Even on an annual time scale, atmospheric reanalyses, which assimilate data that ought to help constrain the modeled fluxes, can differ substantially. The most commonly used product, the first NCEP reanalysis, is not mentioned in the Smith et al. study because developers of that product strongly recommend against its use. The annual net surface flux (sensible and latent plus radiative fluxes) averaged over the Arctic Ocean from ERA-40 is 11 W m-2 (Serreze et al. 2007), compared to 6 W m-2 from JRA-25: the difference would result in an effective annual change in ice thickness of 0.5 m, and it is likely that the actual biases are larger than the differences between

6
models. While this in part reflects differing representations of storms, it also manifests differences in parameterization and biases of the input data (Smith et al. 2009).
One challenge in using NWP products is that they have generally been provided at much coarser grid spacing than the O(10 km) first baroclinic Rossby radius for the high-latitude ocean, and recall that atmospheric NWP resolution is typically 8 to 12 grid spaces. New strategies are beginning to address this, either through higher resolution NWP products (Waliser and Moncrieff 2008) or nested downscaling within a domain of interest (e.g., Kanamitsu and Kanamaru 2007). An alternative is to allow the ocean transports to constrain the fluxes (e.g. Röske 2006). The Southern Ocean State Estimate (SOSE) is a 1/6o resolution assimilating ocean model that adjusts meteorological variables to provide forcing consistent with the assimilated ocean observations (Stammer et al. 2004; Mazloff et al. 2009). Cerovecki et al. (2009) showed that the adjustments made by SOSE to the control meteorological variables tend to reduce the initial biases in heat and freshwater flux estimates (e.g., Taylor 2000). The downside of this approach is that model errors may contribute to unrealistic adjustments to surface fluxes; therefore the resulting surface fluxes should be evaluated carefully before being used for atmospheric applications.
Satellite-derived turbulent sensible and latent heat flux products are based primarily on application of the bulk flux parameterizations using as input satellite observations of wind speed, SST, and near-surface air temperature and specific humidity. As is also true for momentum fluxes, the parameterizations remain questionable for high winds, since there are few in situ observations available. In addition, satellite atmospheric temperature and humidity retrievals are particularly poor for cold conditions (e.g. Jackson et al. 2006; Dong et al. 2009). Near ice edges and cold land masses, atmospheric stability and air-sea temperature differences can differ from open ocean conditions (e.g. Fig. 4), and few data exist to confirm the accuracy of satellite retrievals over these relatively small scales and under these conditions. SST retrievals are also subject to increased uncertainties in high latitudes due to difficulties in discriminating between open ocean, clouds, and ice for infrared brightness temperatures, and due to the proximity to ice for microwave retrievals.
c. Freshwater Fluxes Net freshwater fluxes into the ocean are due to precipitation, runoff (including land ice), and
evaporation (P+R−E), which we henceforth refer to as “P−E”. The salinity flux is also proportional to “P−E”, since salinity is the dilution of (conserved) salt by (non-conserved) freshwater. The evaporative moisture flux is the rate, per unit area, at which moisture is transferred from the ocean to the air and is proportional to the latent heat flux. Precipitation, which includes rain and snow, is notoriously difficult to estimate in high latitudes. Errors in daily measured precipitation at gauges may reach 100% in winter. Spatial sampling is poor. For example, Serreze et al. (2005) estimate that at a coarse grid cell resolution of 175 km, obtaining an accurate assessment of the monthly grid cell precipitation requires typically 3-5 stations within the cell, and more in topographically complex areas. However, for the Arctic terrestrial drainage, only 38% of the 175 km grid cells contain even a single station. The situation is much worse over Antarctica, the Southern Ocean, and the Arctic Ocean.
An important factor for ocean freshwater and salinity balances in regions with sea ice is the fractionation of water and salt in a process called brine rejection: sea ice is greatly depleted in salt, and most of the salt enters the underlying seawater, where it increases the seawater density. When the sea ice melts, the resulting seawater is significantly freshened and hence lighter. When sea ice, which can be thought of as seawater of very low salinity, is transported from one region to another, an advective freshwater (and salinity) flux between the regions arises. Ice and brine formation are modulated locally by the intermixed areas of open water, organic slicks, new ice, existing bare ice, snow-covered ice, and melt ponds; these interact with overlying regions of haze, low cloud, and clear sky, and are also affected by sunlight reflection and gaseous deposition (e.g., of mercury). Subtle changes in heat or

7
momentum fluxes cause, and respond to, rapid water phase change. Thus, the freshwater/salinity flux couples to the sensible heat exchange; the coupling depends on the type of ice being formed.
Transport of sea ice, particularly the flux out of the Arctic basin via Fram and Davis Straits, represents a substantial meridional freshwater flux. Concurrently, the salt flux into the seawater in ice-forming regions makes water denser and is therefore a major factor in deep water formation. Seasonal melting of sea ice (as observed in the Arctic) and net erosion of Antarctic ice shelves represent substantial freshwater inputs to polar oceans, with potentially significant impacts on deep water formation and circulation. The accurate assessments of sea ice mass balance and of salinity budgets for ice-covered seas thus represent important, if indirect, measurements of these high-latitude fluxes.
Satellite retrievals of freshwater fluxes are uncertain over cloudy, snow- and ice-covered surfaces, and it appears that better estimates can be obtained from atmospheric reanalyses (Serreze et al. 2005). Alternative sources of high-latitude precipitation include atmospheric reanalyses, and various blends of satellite, reanalysis and station data (Huffman et al. 1997; Serreze et al. 2005; Xie and Arkin 1997). However precipitation biases in reanalysis fields can be very large (Serreze and Hurst 2000).
d. Gas Fluxes Gas fluxes between the atmosphere and ocean are crucially important at high latitudes, particularly
in the Southern Ocean and subpolar North Atlantic, which have been identified as primary locations of ocean uptake of CO2 (e.g., Sabine et al 2004). Gas fluxes are often reported in terms of piston velocities, dependent on diffusivities and viscosities, and forced by bulk air-sea effective concentration differences (Wanninkhof et al. 2009). To date, only a few campaigns have measured gas fluxes at high latitudes, all part of the IPY. Other efforts, notably those of Miller et al. (1999, 2002) and Skjelvan et al. (1999), looked at the annual carbon budget in the Greenland and Norwegian Seas and Baffin Bay. While these studies assumed ice to be a barrier to air-sea transfer, subsequent work has indicated that brine channels in sea ice may act as a pathway for carbon (Semiletov et al. 2004). This is an active area of research (e.g., Delille et al. 2007).
Given the paucity of in situ observations of gas transfer (or the necessary bulk variables), remote sensing is likely to remain the primary source of information. Wind inputs for simple piston velocity estimates can be retrieved from satellite data. While piston velocities have usually been parameterized in terms of wind speed (much like turbulent heat fluxes), Frew et al. (2004) proposed a relationship between gas piston velocities and the mean square slope of cm-scale waves that allows estimations of exchange velocities using satellite altimetry (Frew et al. 2007) or scatterometry (Bogucki et al. 2009). Transfer velocity algorithms that extend beyond piston velocities require additional inputs (e.g., Soloviev et al. 2007). However, near surface partial pressures of CO2 are still only available as in situ observations. The in situ database for pCO2 for 1970-2007 and a monthly product averaged on a 4 x 5o grid are produced by Takahashi et al. (2002, 2007, 2009). Given the very limited number of pCO2 observations available at high latitudes, the resulting flux errors are likely large, but difficult to quantify. Some exploratory work has been done to estimate oceanic pCO2 from SST and satellite ocean color (Wanninkhof et al. 2007).
3. Desired Accuracies: Present and Future
In view of the fundamental importance of high-latitude surface fluxes and the challenges inherent in measuring them, it is natural to ask how accurate surface fluxes need to be for different applications.

8
a. From a climate perspective If the goal is to diagnose long-term climate change by measuring temporal shifts in surface fluxes,
then needed requirements are stringent and likely unobtainable. Observed long-term warming trends in the ocean from 1993-2003 can be explained by a mean ocean heat gain of just 0.86 ± 0.12 W m-2 (Hansen et al. 2005). For sea ice, a 1 W m-2 flux imbalance equates to 10 cm ice melt in a year, which represents a significant fraction of the ice budget. Basin-scale changes in ocean salinity associated with global change correspond to small changes in air-sea freshwater flux on the order of 0.05 psu/decade (Boyer et al. 2005) concentrated in the top 200 m. This is equivalent to a change in liquid P-E of 3 cm yr-1. Similarly North Atlantic freshwater flux anomalies sufficient to slow deep convection (Curry and Mauritzen 2005) derive from river runoff and ice melt, and are equivalent to P-E of almost 1 cm yr-1 over the area of the Arctic and North Atlantic. These climate change signals of O(1 W m-2) for heat and O(1 cm yr-1) for freshwater are far below any expected observational accuracy globally or in polar regions. Hence long-term changes in these fluxes are more effectively diagnosed by observing the ocean temperature and salinity changes as integrators of heat and freshwater fluxes (e.g., Hansen et al. 2005; Levitus et al. 2005; Boyer et al. 2005). Unachievable standards should not be a deterrent to efforts at improvement: significant scientific gains could be made if the uncertainty in heat and freshwater flux estimates (as crudely estimated by the spread in modern products) could be improved by an order of magnitude. The community should strive to achieve sufficient accuracy to validate and select products developed for climate applications.
b. From an ocean circulation perspective Air-sea heat and freshwater fluxes alter the density of water in the upper-ocean mixed layer, and
these waters then circulate throughout the global ocean transporting heat and freshwater. At high latitudes, surface cooling produces deeper mixing. Salinity becomes a major or even dominant factor where temperatures approach the freezing point. Thus analysis of high-latitude ocean processes depends on accurate surface heat and freshwater fluxes, including freshwater fluxes linked to ice formation, export and melt. For example, buoyancy gain by excess precipitation and buoyancy loss by ocean heat loss are apparently of comparable importance in estimating Subantarctic Mode Water formation, which dominates the upper ocean volumetrically just north of the Antarctic Circumpolar Current (Cerovecki et al. 2009). Calculation of water mass formation rates from air-sea fluxes requires accurate and unbiased fluxes. Using the best available data products, Dong et al. (2007) found that the zonally averaged imbalance can be 50 W m-2, and locally, the upper-ocean heat balance can have an RMS misfit of more than 200 W m-2 at any given location, and 130 W m-2 in a global RMS-averaged sense. Such large errors make it difficult to discern the details of the upper-ocean heat storage and meridional overturning circulation. If RMS errors could be reduced to 10 W m-2 for weekly to monthly time scales, the situation would clearly improve. Achieving such accuracy requires much better sampling and a reduction in biases, particularly for high-wind-speed conditions.
c. From an atmospheric circulation perspective High-latitude surface turbulent heat flux anomalies can alter pressure gradients in the atmosphere,
thus impacting the location and strength of storm tracks. These impacts are often manifested as changes in the large-scale spatial patterns or modes of atmospheric variability that control regional climate. The North Atlantic Oscillation (NAO) is one such climate mode that dominates North Atlantic and Arctic variability, and the Southern Annular Mode (SAM) is the primary climate mode in the Southern Hemisphere. Both are largely driven by high frequency atmospheric internal variability or storms, and are also sensitive to surface fluxes. A poleward trend in location of atmospheric circulation features associated with the SAM has been detected over recent decades for austral summer (Thompson and Solomon 2002). Even though such a definite shift of NAO variability has not been detected, an

9
increase in storm activity in the high Arctic both in winter and summer has been observed (e.g., Hakkinen et al 2008, Zhang et al 2008). Turbulent energy fluxes resulting from the opening up of previously ice-covered areas of the Arctic are especially large in boreal winter, averaging O(50-70 W m-2; Alam and Curry 1997). Increased turbulent surface fluxes associated with the increased storminess-driven changes in sea ice can feed back on the atmospheric flow as shown in modeling (Magnusdottir et al 2004) and observational studies (Strong et al 2009). The understanding, detection, and modeling of these feedbacks would be improved if heat fluxes were accurate to 10 W m-2, with 5-10 km spatial resolution and hourly time resolution. This would require much more frequent sampling from satellites, increased accuracy in mean values and reduced random errors.
d. From a sea ice mass balance perspective Arctic sea ice is a highly visible indicator of climate change. The range in recent and projected
future ice extent and volume from different models remains large, reflected in both initial (20th century) and evolving surface energy fluxes. Inter-model scatter in absorbed solar radiation, due in part to differences in the surface albedo simulation, is a particular concern (Holland et al. 2009). When Bitz et al. (2006) adjusted sea ice albedo by about 8%, resulting in a change in the net surface shortwave flux of about 5-10 W m-2 on the annual mean, the resultant equilibrium state (e.g., with a net flux into the sea ice of zero) sea ice was thinner by 1-2 m in the central Arctic and about 0.25 m in the Antarctic. Air-sea heat fluxes can also play a role in determining ice thickness: Perovich et al. (2008) showed that solar heating of open water warms the upper ocean sufficiently to erode Arctic sea ice mass from below. Ultimately reduced ice thicknesses feed back on ocean-atmosphere processes by changing the conductive, sensible and upward surface longwave fluxes through the ice.
The formation and presence of ice provokes a step-function change in radiative, heat, momentum and gas fluxes (e.g. Fig. 4). Ice formation and accumulation processes, which can include snow refreezing (common in the Antarctic) and vertical migration of frazil ice and dissolution, erosion, and break-up processes, remain highly complicated. These processes can occur on length scales too small to be detected remotely or modeled explicitly. As more stable multi-year ice declines, annual ice processes and extent will become increasingly important terms in air-sea interaction and high-latitude fluxes. 4. Summary: Key needs
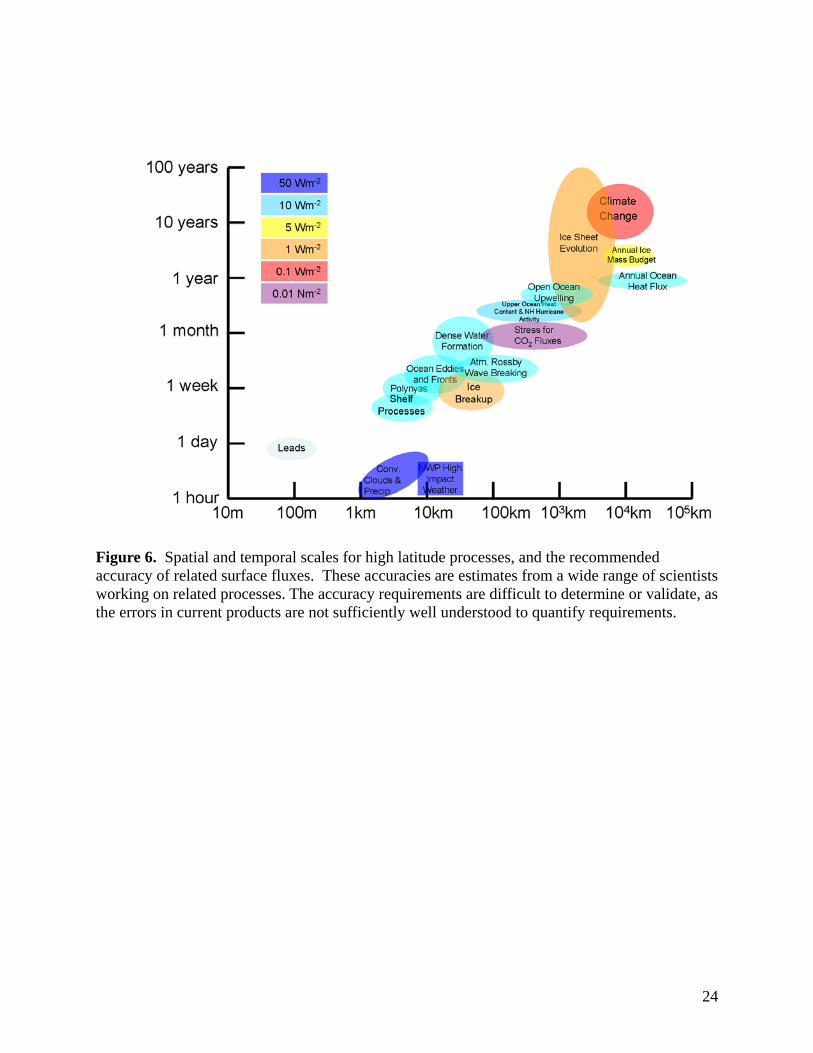
We have identified substantial deficiencies in direct measurements, remote sensing, and derived flux products at high latitudes. In essence the problem with surface fluxes at high latitudes can be reduced to a single conundrum: Current gridded flux products disagree, and with limited or no in situ observations, there is often no simple strategy for choosing a flux estimate - no specific product can be recommended as adequate for high-latitude applications. One clear result is that the combination of large natural variability and poor in situ sampling means purely in situ based products cannot be used in high-latitude regions (whether marine or ice-covered). Heat flux, mass flux, and wind stress requirements vary depending on application. Figure 6 summarizes desired flux accuracies for a range of applications as a function of time and length scale.
Concerted efforts to improve the representation of high-latitude fluxes will require a step-by-step approach. A first step is to support ongoing efforts to archive and analyze the surface-flux related data collected as part of IPY field programs. These programs include Ocean-Atmosphere-Sea Ice-Snowpack Interactions (OASIS), the Southern Ocean Gas Exchange Experiment (GasEx3), the Circumpolar Flaw Lead (CFL) experiment, Developing Arctic Modeling and Observing Capabilities for Long-term Environmental Studies (DAMOCLES), the Greenland Flow Distortion Experiment (Renfrew et al. 2008) and the Arctic Sea Ice Properties and Processes and Antarctic Sea Ice Project. Many other

10
projects will have measured useful bulk meteorological and oceanographic parameters during IPY cruises. One community priority should be a post-IPY effort to identify and compile all the relevant bulk and flux measurements that occurred during IPY.
A second step is to expand field observations. For all types of fluxes, more reference quality flux measurements are needed, particularly for high wind speeds, with temperature, wave heights, and rainfall patterns that characterize the full range of high-latitude conditions. Additional observations are desired for longwave radiation, clouds, ice extent, and aerosol optical properties. Ideally, data are desired from integrated programs that measure all components of the surface energy balance plus gas exchanges. Flux data were collected from the SHEBA ice camp in 1997 to 1998, but necessarily over perennial sea ice with only a small surface fraction (a few %) of winter leads (Persson et al. 2002). By the time of IPY 2007-2009, summer ice conditions in the Arctic had become less predictable and less reliable for human on-ice deployments, leaving the community in an awkward situation in which the summertime Arctic fluxes that were studied through SHEBA (and earlier, similar projects) represent conditions that appear less likely to be pertinent for 21st century climate projections. Antarctic sea ice, on the other hand, has not undergone the dramatic changes that the Arctic has; hence, Antarctic archival fluxes and parameterizations remain applicable. Significant new data are expected from moorings planned at the Agulhas Return Current air-sea flux site, at the flux site south of Tasmania, and through the OceanSITES effort at 55oS in the Pacific and 42oS in the Atlantic.
Although new dedicated field programs are important, funding constraints may force a decrease in the number of research or logistics ships operating at high latitudes, at least relative to the peak IPY years. This will require better use of fewer opportunities. Tourist ship traffic could continue to increase, albeit to only a small portion of the Arctic and a minute portion of the Antarctic; however, tourist ships cross some interesting straits. Reference sensors on research vessels and moorings, smart sensors on volunteer ships, and autonomous ocean sensors, all coupled to advanced communication and data assimilation systems, represent an important step forward. Progress in meeting the high latitude needs will enable better global measurements as well.
While in situ data are extremely important, the logistical challenges of high latitudes preclude blanketing the region with a dense flux observing system. Thus a third step is to continue to expand the use of satellite data. Daily average values from the Moderate Resolution Imaging Spectroradiometer (MODIS) instrument onboard the Terra and Aqua satellites (King et al. 1992) have allowed development of a new inference scheme to estimate shortwave radiative fluxes (Wang and Pinker 2009) that agree well with ground measurements (Fig. 7) over oceanic sites (and better over land). The improvement is very significant in problematic areas for most inference schemes such as the Tibet Plateau and Antarctica. Newly available bi-directional distribution functions (BRDF) models (e.g., from CERES or MISER) have the potential to further improve radiative fluxes. Similarly, the AMSU and AIRS atmospheric profilers on Aqua, along with SSMI, have the potential to improve turbulent heat fluxes (e.g., Jackson et al. 2006; Dong et al. 2009; Roberts et al. 2009). The satellite observing system could be further enhanced with the strategic launch of a few additional sensors. For example, at least two wide-swath scatterometers are desired for sampling typical extratropical weather systems.
Finally, continued efforts to improve high-latitude fluxes will require an ongoing effort to untangle the complex physical processes that govern air-sea fluxes and to determine how best to parameterize these processes from observable variables. Laboratory experiments can contribute to this effort, particularly for limited fetch conditions such as occur within leads in the ice, and results from the IPY experiments will improve our understanding, but further dedicated field programs are also likely required.
In recognition of these needs, the authors of this review paper are planning a workshop to be held in Boulder, Colorado, in March 2010 that will solicit input from the wider community, with the aim of prioritizing efforts.

11
Acknowledgements: US CLIVAR funded this working group. We also thank Ed Andreas, Carol Anne Clayson, Shenfu Dong, Paul Hughes, Ryan Maue, and E. Paul Oberlander for their contributions.

12
References
Alam, A. and J.A. Curry, 1997: Determination of surface turbulent fluxes over leads in arctic sea ice. J. Geophys. Res., 102, 3331-3344.Andreas, E. L., P. O. G. Persson, J. E. Hare, 2008: A Bulk Turbulent Air–Sea Flux Algorithm for High-Wind, Spray Conditions. J. Phys. Oceanogr., 38, 1581–1596.
Andreas, E. L., P. O. G. Persson and J. E. Hare, 2008: A bulk turbulent air–sea flux algorithm for high-wind, spray conditions. J. Phys. Oceanogr., 38, 1581–1596.
Bitz, C. M., P. R. Gent, R. A. Woodgate, M. M. Holland, and R. Lindsay, 2006: The influence of sea ice on ocean heat uptake in response to increasing CO2, J. Climate, 19, (11), pages 2437--2450.
Bogucki, D., M.-E. Carr, W. M. Drennan, P. Woiceshyn, T. Hara, and M. Schmeltz, 2009: Preliminary and novel estimates of CO2 gas transfer using satellite scatterometer during the 2001GasEx Experiment. Int. J. Remote Sens. [in press].
Bourassa, M. A., 2006: Satellite-based observations of surface turbulent stress during severe weather, Atmosphere - Ocean Interactions, Vol. 2., ed., W. Perrie, Wessex Institute of Technology Press, Southampton, UK, 35 – 52 pp.
Bourassa, M. A., D. G. Vincent, and W. L. Wood, 1999: A flux parameterization including the effects of capillary waves and sea state. J. Atmos. Sci., 56, 11231139.
Bourassa, M. A., R. Romero, S. R. Smith, and J. J. O’Brien, 2005: A new FSU winds climatology, J. Clim., 18, 3,692–3,704.
Boyer, T. P., J. I. Antonov, S. Levitus, and R. Locarnini, 2005: Linear trends of salinity for the world ocean, 1955-1998. Geophys. Res. Lett., 32(L01604), doi:1029/2004GL021791.
Brunke, M. A., M. Zhou, X. Zeng, and E.L. Andreas, 2009: An intercomparison of bulk aerodynamic algorithms used over sea ice with data from the SHEBA experiment J. Geophys. Res., to appear.
Cerovecki, I., L. Talley and M. Mazloff, 2009: Subantarctic Mode Water and Antarctic Intermediate Water Formation using a Walin framework. In preparation.
Chelton, D. B., M. H. Freilich, J. M. Sienkiewicz, and J. M. Von Ahn, 2006: On the Use of QuikSCAT Scatterometer Measurements of Surface Winds for Marine Weather Prediction. Mon. Wea. Rev., 134, 2055–2071.
Curry, R, and C. Mauritzen, 2005: Dilution of the Northern North Atlantic Ocean in Recent Decades, Science, 308, 1772 – 1774.
Delille, B., B. Jourdain, A. V. Borges, J.-L. Tison, and D. Delille, 2007: Biogas (CO2, O2, dimethylsulfide) dynamics in spring Antarctic fast ice, Limnol. Oceanogr. 52, 1367-1379.
Dong, S., S. T. Gille, and J. Sprintall, 2007: An assessment of the Southern Ocean mixed-layer heat budget, J. Climate, 20, 4425-4442.
Dong, S., S. T. Gille, J. Sprintall, and E. J. Fetzer, 2009: Assessing the potential of the Atmospheric Infrared Sounder (AIRS) surface temperature and relative humidity in turbulent heat flux estimates in the Southern Ocean, J. Geophys. Res., submitted.
Draper, D. W. and D. G. Long, 2004: Evaluating the effect of rain on SeaWinds scatterometer measurements, J. Geophys. Res., 109, doi:10.1029/2002JC001741.
Fairall, C. W., E. F. Bradley, J. E. Hare, A. A. Grachev, and J. B. Edson, 2003: Bulk parameterization of air-sea fluxes: Updates and verification for the COARE algorithm. J. Clim., 16, 571-591.
Frew, N. M., E. J. Bock, U. Schimpf, T. Hara, H. Haußecker, J. B. Edson, W. R. McGillis, R. K. Nelson, S. P. McKenna, B. M. Uz and B. Jähne, 2004: Air-sea gas transfer: Its dependence on wind stress, small-scale roughness, and surface films, J. Geophys. Res., 109, C08S17, doi: 10.1029/2003JC002131
Frew, N. M., D. M. Glover, E. J. Bock, and S. J. McCue, 2007: A new approach to estimation o global air-sea gas transfer velocity fields using dual-frequency altimeter backscatter, J. Geophys. Res., 112, C11003, doi:10.1029/2006JC003819.

13
Hakkinene, S, A, Proshutinsky and I. Ashik, 2008: Sea ice drift in the Arctic since the 1950s. Geo. Res. Lett., 35, L19704.
Guest, P. S. 1998: Surface longwave radiation conditions in the eastern Weddell Sea during winter, J. Geophys. Res., 103(C13), 30,761–30,771.
Gupta, S. K., D. P. Kratz, A. C. Wilber, and L. C. Nguyen, 2004: Validation of parameterized algorithms used to derive TRMM-CERES surface radiative fluxes. J. Atmos. Oceanic Tech., 21, 742-752.
Hansen, J., L. Nazarenko, R. Ruedy, M. Sato, J. Willis, A. Del Genio, D. Koch, A. Lacis, K. Lo, S. Menon, T. Novakov, J. Perlwitz, G. Russell, G. A. Schmidt, N. Tausnev, 2005. Earth's Energy Imbalance: Confirmation and Implications, Science, 308, doi: 10.1126/science.1110252.
Holland. M. M., M. C. Serreze and J. Stroeve, 2009: The sea ice mass budget of the Arctic and its future change as simulated by coupled climate models, Climate Dynamics (in press), doi:10.1007/s00382-008-0493-4.
Huffman, G. J. et al., 1997: The Global Precipitation Climatology Project (GPCP) combined precipitation data set, Bull. Amer. Meteor. Soc., 78, 5-20.
Iacono, M. J., E. J. Mlawer, S. A. Clough, and J.-J. Morcrette, 2000: Impact of an improved longwave radiation model, RRTM, on the energy budget and thermodynamic properties of the NCAR community climate model, CCM3, J. Geophys. Res., 105(D11), 14,873–14,890.
Jackson, D. L., G. A. Wick, and J. J. Bates, 2006: Near-surface retrieval of air temperature and specific humidity using multisensor microwave satellite observations, J. Geophys. Res., 111, D10306, doi:10.1029/2005JD006431.
Kanamitsu, M. and H. Kanamaru, 2007: Fifty-sever-year California reanalysis downscaling at 10 km (CaRD10). Part I: System detail and validation with observations, J. Clim., 20, 5553-5571.
Kara, A. B., J. Metzger, and M. A. Bourassa, 2007: Ocean Current and Wave Effects on Wind Stress Drag Coefficient and Fluxes over the Global Ocean. Geophys. Res. Letts., 34, L01604, doi:10.1029/2006GL027849.
Key, J. R., Silcox, R. A. and Stone, R. S., 1996: Evaluation of surface radiative flux parameterizations for use in sea ice models. J. Geophys. Res. 101, pp. 3839–3849
King, M. D., Y. J. Kaufman, W. P. Menzel, and D. Tanré, 1992: Remote sensing of cloud, aerosol, and water vapor properties from the Moderate Resolution Imaging Spectrometer (MODIS). IEEE Transactions on Geosciences and Remote Sensing, 30, 2-27.
Error! Hyperlink reference not valid., G. and E. Augstein, 1994: Parameterization of the downward long-wave radiation at the Earth's surface in polar regions. Meteorol. Z. 3, pp. 343–347.
Kubota, M., A. Kano, H. Muramatsu, and H. Tomita, 2003: Intercomparison of various surface latent heat flux fields. J. Climate, 16, 670–678.
Levitus, S., J. Antonov and T. Boyer, 2005: Warming of the world ocean, 1955-2003, Geophys. Res. Lett., 32, L02604, doi:10.1029/2004GL021592.
Liu, H. Q., and R. T. Pinker, 2008. Radiative fluxes from satellites: Focus on aerosols. J. Geophys. Res. 113, D08208.
Liu, J., J. A. Curry, W. B. Rossow, J. R. Key, and X. Wang, 2005: Comparison of surface radiative flux data sets over the Arctic Ocean. Journal of Geophysical Research, 110, C02015, doi: 10.1029/2004JC002381, 1-13.
Loeb, N. G.., N.-M. Smith, S. Kato, W. F. Miller, S. K.Gupta, P. Minnis, and B. A. Wielicki, 2003: Angular distribution models for top-of atmosphere radiative flux estimation from the Clouds and the Earth's Radiant Energy System (CERES) instrument on the Tropical Rainfall Measuring Mission Satellite, J. Appld Meteor., 42, 1748-1769.
Lubin, D. and A. M. Vogelmann, 2006: A climatologically significant aerosol longwave indirect effect in the Arctic, Nature, 439, 453-456.

14
Magnusdottir, G., Deser, C. and R. Saravanan, 2004: The effects of North Atlantic SST and sea ice anomalies on the winter circulation in CCM3. Part I: Main features and storm track characteristics of the response. Journal of Climate, 17, 857-876.
Makshtas, A. P., E. L Andreas, P. N. Svyashchennikov, V. F. Timachev, 1999: Accounting for clouds in sea ice models, Atmos. Res., 52, 77-113.
Mazloff, M. R., P. Heimbach, and C. Wunsch, 2009: An eddy permitting Southern Ocean state estimate. J. Phys. Oceanogr., submitted.
Miller, L.A., M. Chierici, T. Johannessen, T.T. Noji, F. Rey and I. Skjelvan, 1999: Seasonal dissolved inorganic carbon variations in the Greenland Sea and implications for atmospheric CO2 exchange. Deep-Sea Res. II, 46, 1473-1496.
Miller, L. A., P. L. Yager, K. A. Erickson, D. Amiel, J. Bâcle, J.K. Cochran, M.-É. Garneau, M. Gosselin, D.J. Hirschberg, B. Klein, B. LeBlanc and W.L. Miller, 2002: Carbon distributions and fluxes in the North Water, 1998 and 1999. Deep-Sea Res. II, 49, 5151-5170.
Moore, G. W. K., R. S. Pickart, and I. A. Renfrew 2008: Buoy observations from the windiest location in the world ocean, Cape Farewell, Greenland, Geophys. Res. Lett., 35, L18802, doi:10.1029/2008GL034845.
Perovich, D. K., E. L. Andreas, J. A. Curry, H. Eiken, C. W. Fairall, T. C. Grenfell, P. S. Guest, J. Intrieri, D. Kadko, R. W. Lindsay, M. G. McPhee, J. Morison, R. E. Moritz, C. A. Paulson, W. S. Pegau, P. O. G. Persson, R. Pinkel, J. A. Richter-Menge, T. Stanton, H. Stern, M. Sturm, W. B. Tucker III, and T. Uttal, 1999: Year on ice gives climate insights. Eos Trans. AGU, 80, 481, 485-486.
Perovich, D. K., J. A. Richter-Menge, K. F. Jones, and B. Light, 2008: Sunlight, water, and ice: Extreme Arctic sea ice melt during the summer of 2007, Geophys. Res. Lett., 35, L11501, doi:10.1029/2008GL034007.
Persson, P. O. G., C. W. Fairall, E. Andreas, P. Guest, and D. K. Perovich, 2002. Measurements near the atmospheric surface flux group tower at SHEBA: Near-surface conditions and surface energy budget. J. Geophys. Res., 107, 8045, doi: 10.1029/2000JC000705.
Petersen, G. N. and I. A. Renfrew, 2009: Aircraft-based observations of air-sea fluxes over Denmark Strait and the Irminger Sea during high wind speed conditions, Quarterly J. Royal Meteorol. Soc., doi: 10.1002/qj.355, in press.
Pietroni, I., P. Anderson, S. Argentini, and J. King, 2008. Long wave radiation behaviour at Halley and Concordia stations, Antarctica. SRef-ID: 1607-7962/gra/EGU2008-A-03254 EGU General Assembly 2008.
Renfrew, I. A., G. W. K. Moore, J. E. Kristjánsson, H. Ólafsson, S. L. Gray, G. N. Petersen, K. Bovis, P. R. A. Brown, I. Føre, T. Haine, C. Hay, E. A. Irvine, A. Lawrence, T. Ohigashi, S. Outten, R. S. Pickart, M. Shapiro, D. Sproson, R. Swinbank, A. Woolley, and S. Zhang, 2008: The Greenland Flow Distortion experiment, Bulletin of the American Meteorological Society, 89, 1307-1324.
Risien, C. M., and D. B. Chelton, 2008: A Global Climatology of Surface Wind and Wind Stress Fields from Eight Years of QuikSCAT Scatterometer Data. Journal of Physical Oceanography, 38, 2379-2413.
Roberts, J. B., C. A. Clayson, F. R. Robertson, and D. Jackson, 2009: Predicting near-surface characteristics from SSM/I using neural networks with a first guess approach. J. Geophys. Res., (submitted).
Röske, F., 2006. A global heat and freshwater forcing dataset for ocean models, Ocean Modelling, 11, 235-297.
Rossow W B and E. N. Duenas, 2004. The International Satellite Cloud Climatology Project (ISCCP) Web site - An online resource for research. Bull. Amer. Meteorolog. Soc., 85, 167-172.

15
Sabine, C. L., R. A. Feely, N. Gruber, R. M. Key, K. Lee, J. L. Bullister, R. Wanninkhof, C. S Wong, D. W. R. Wallace, B. Tilbrook, F. J. Millero, T.-H. Peng, A. Kozyr, T. Ono, and A. F. Rios, 2004: Error! Hyperlink reference not valid.. Science, 305(5682), 367–371.
Sampe, T., and S. P. Xie, 2007: Mapping high sea winds from space: A global climatology, Bull. Amer. Meteorolog. Soc., 88, 1965-1978.
Schlax, M. G., D. B. Chelton and M. H. Freilich, 2001: Sampling errors in wind fields constructed from single and tandem scatterometer datasets. J. Atmos. Oceanic Tech., 18, 1014-1036.
Semiletov, I., A. Makshtas, S. Akasofu, and E.L. Andreas, 2004: Atmospheric CO2 balance: The role of Arctic sea ice, Geophys. Res. Lett., 31, L05121, doi:10.1029/2003GL017996.
Serreze, M. C. and C. M. Hurst, 2000: Representation of mean Arctic precipitation from NCEP-NCAR and ERA Reanalyses, J. Climate, 13, 182-201.
Serreze, M. C., A. P. Barrett, and F. Lo, 2005: Northern high-latitude precipitation as depicted in atmospheric reanalyses and satellite retrievals, Mon. Wea. Rev., 133, 3407-3430.
Serreze, M. C., A. P. Barrett, A. J. Slater, M. Steele, J. Zhang, and K. E. Trenberth, 2007: The large-scale energy budget of the Arctic, J. Geophys. Res., 112, D11122, doi:10.1029/2006JD008230.
Shapiro, M. A., L. S. Fedor and T. Hampel, 1987: Research aircraft measurements of a polar low over the Norwegian Sea, Tellus, 37A, 272-306.
Skjelvan, I., T. Johannessen and L. A. Miller, 1999: Interannual variability of fCO2 in the Greenland and Norwegian Seas. Tellus, 51B, 477-489.
Smith, S., P. Hughes, and M. Bourassa, 2009: A comparison of nine monthly air-sea flux products. Internat. J. Clim., submitted.
Soloviev, A., M. Donelan, H. Graber, B. Haus, and P. Schlussel, 2007: An approach to estimation of near-surface turbulence and CO2 transfer velocity from remote sensing data. J. Marine Sys., 66, 182-194.
Sorteberg, A., V. Kattsov, J. E. Walsh, and T. Pavlova, 2007: The Arctic surface energy budget as simulated with the IPCC AR4 AOGCMs, Climate Dynamics, 29, 131-156.
Stammer, D., K. Ueyoshi, W. Large, S. Josey, and C. Wunsch, 2004: Estimating air-sea fluxes of heat, freshwater and momentum through global ocean data assimilation. J. Geophys. Res., 109, doi:10.1029/2003JC002082.
Strong, C., G. Magnusdottir and H. Stern, 2009: Observed feedback between winter sea ice and the North Atlantic Oscillation. J. Climate. In Press.
Takahashi, T., S. C. Sutherland, C. Sweeney, A. Poisson, N. Metzl, B. Tilbrook, N. Bates, R. Wanninkhof, R. A. Feely, C. Sabine, J. Olafsson, and Y. Nojiri, 2002: Global sea-air CO2 flux based on climatological surface ocean pCO2, and seasonal biological and temperature effects. Deep-Sea Research II, 49, 1601-1622.
Takahashi, T., S. C. Sutherland, R. Wanninkhof, C. Sweeney, R. A. Feely, D. W. Chipman, B. Hales, G. Friederich, F. Chavez, C. Sabine, A. Watson, D. C. E. Bakker, U. Schuster, N. Metzl, H. Y. Inoue, M. Ishii, T. Midorikawa, Y. Nojiri, A. Koertzinger, T. Steinhoff, M. Hoppema, J. Olafsson, T. S. Arnarson, B. Tilbrook, T. Johannessen, A. Olsen, R. Bellerby, C. S. Wong, B. Delille, 2007: Global Surface pCO2 (LDEO) Database. Available at http://cdiac.ornl.gov/oceans/LDEO_Underway_Database/LDEO_home.html (accessed 20 May 2009).
Takahashi, T., S. C. Sutherland, R. Wanninkhof, C. Sweeney, R. A. Feely, D. W. Chipman, B. Hales, G. Friederich, F. Chavez, C. Sabine, A. Watson, D. C. E. Bakker, U. Schuster, N. Metzl, H. Y. Inoue, M. Ishii, T. Midorikawa, Y. Nojiri, A. Koertzinger, T. Steinhoff, M. Hoppema, J. Olafsson, T. S. Arnarson, B. Tilbrook, T. Johannessen, A. Olsen, R. Bellerby, C. S. Wong, B. Delille, N. R. Bates, and H. J. W. de Baar, 2009: Climatological Mean and Decadal Change in Surface Ocean pCO2, and Net Sea-air CO2 Flux over the Global Oceans. Deep-Sea Res. II, 56, 554-577.

16
Taylor, P., (Ed.), 2000: Final report of the joint WCRP/SCOR Working Group on air-sea fluxes: intercomparison and validation of ocean-atmosphere flux fields, WCRP-112, WMO/TD-No. 1036, World Climate Research Programme, 303 pp.
Waliser, D. and M. Moncrieff, 2008: The YOTC Science Plan, World Meteorological Organization Report WMO/TP No. 1452. WCRP No. 130.
Wang, H., and R. T. Pinker, 2009: Radiative Fluxes from MODIS. J. Geophys. Res., in press. Wanninkhof, R., A. Olsen, and J. Triñanes, 2007: Air-sea CO2 fluxes in the Caribbean Sea from 2002-
2004, J. Mar. Sys., 66, 272-284. Wanninkhof, R., W.E. Asher, D.T. Ho, C. Sweeney, and W.R. McGillis, 2009: Advances in quantifying
air-sea gas exchange and environmental forcing. Annu. Rev. Mar. Sci., 1, 213–244. Weissman, D. E., and M. A. Bourassa, 2008: Measurements of the Effect of Rain-induced Sea Surface
Roughness on the Satellite Scatterometer Radar Cross Section. IEEE Trans. Geosci. Remote Sens., 46, 2882-2894
Weissman, D. E., M. A. Bourassa, and J. Tongue, 2002: Effects of rain rate and wind magnitude on SeaWinds scatterometer wind speed errors. J. Atmos. Ocean. Tech., 19, 738-746.
Wild, M., A. Ohmura, H. Gilgen, J.-J. Morcrette, and A. Sling, 2001. Evaluation of Downward Longwave Radiation in General Circulation Models. J. Climate, 14, 3227-3239.
Xie, P. and P.A. Arkin, 1997: Global precipitation: A 17-year monthly analysis based on gauge observations, satellite estimates and numerical model output, Bull. Amer. Meteor. Soc., 78, 2539-2558.
Zhang, X., A. Sorteberg, J. Zhang, R. Gerdes and J. C. Comiso, 2008: Recent radical shifts of atmospheric circulations and rapid changes in arctic climate system. Geo. Res. Lett., 35, L22701

17
Figure Captions Figure 1. Schematic of surface fluxes and related processes for high latitudes. Radiative fluxes are both shortwave (SW) and longwave (LW). Surface turbulent fluxes are stress, sensible heat (SHF) and latent heat (LHF). Ocean surface moisture fluxes are precipitation and evaporation (proportional to LHF). Figure 2. Frequency of winds exceeding 25m/s for the QuikSCAT observations from July 1999 through June 2009, based on Remote Sensing Systems’ Ku2001 algorithm. Northern hemisphere extreme winds are associated with topography and western boundary currents, and occur in boreal winter; southern hemisphere events are more wide spread, and occur year around. The Southern Hemisphere storm track is active year round with strong winds, whereas the Northern Hemisphere extreme winds are typically in boreal winter. Locations with less than approximately 51% of possible observations are plotted as white, thereby excluding some regions with seasonal ice. Figure 3. 10-m neutral turbulent transfer coefficients (Cd10n, CE10n, CH10n) as a function of 10-m neutral wind speed from direct surface-based observations: drag coefficient (top), heat transfer coefficients (middle) and CO2 transfer coefficient (bottom). A percentage error in the transfer coefficient results in a similar percentage error in the flux: differences in parameterizations are greatest at low and high wind speeds. The black line is the mean of the data sets; the error bars are statistical estimates of the uncertainty in the mean. The parameterizations shown in the top two panels are COARE algorithm (red), NCEP reanalysis (green), ECMWF (blue), Large and Yeager (magenta). Symbols on the upper two panels are: circle – U. Connecticut (FLIP, Martha’s Vineyard Observatory, and moored buoys), diamond – U. Miami (ASIS spar buoy), and square – NOAA/ESRL (ships). The gas transfer coefficient parameterizations shown in the bottom panel are: blue dashed line - McGillis et al 2001, red dashed line – NOAA/COARE CO2. Gas transfer coefficient coefficients as a function of 10-m neutral wind speed from direct surface-based observations. CO2 panel symbols are: circle - GASEX98, square - GASEX01, diamond – GASEX08 (data courtesy J. Edson, W. McGillis). Figure 4. Boundary-layer observations of a cold-air outbreak off the east coast of Greenland during an instrumented aircraft flight on 5 March 2007. Panels show (top) 2-m temperature (red) and sea-surface temperature (blue); (middle) 10-meter wind speed; and (bottom) surface sensible (red) and latent (blue) heat fluxes calculated using the eddy covariance method (taken from Petersen and Renfrew 2009) as a function of distance. The observations are averaged into 12-km runs (circles). Interpolated estimates from ECMWF operational analyses (solid line) and the much coarser resolution NCEP global reanalyses (dashed line) are also plotted. The plots show a rapid warming from over the sea ice zone (0-30 km) off shore and a jump in wind speed and observed heat fluxes across the ice edge. Figure 5. Comparison of oceanic sensible (top) and latent (bottom) heat fluxes from readily available products: NCEP2 (blue), JMA (green), ERA40 (purple), IFREMER (red), and HOAPS (cyan). Each box shows zonally averaged (0 through 360 degrees) monthly fluxes for the 5th, 25th, 50th, 75th, or 95th percentiles. The period for comparison (for which all products are available) is 03/1992 through 12/2000. Clearly there are very large differences in the distribution of fluxes. Furthermore, there is a great deal of regional surface flux variability in all high latitude seas: product differences are greater on smaller spatial and temporal scales. Figure 6. Spatial and temporal scales for high latitude processes, and the recommended accuracy of related surface fluxes. These accuracies are estimates from a wide range of scientists working on

18
related processes. The accuracy requirements are difficult to determine or validate, as the errors in current products are not sufficiently well understood to quantify requirements. Figure 7. Comparison of the zonal mean downwelling shortwave flux averaged for two July months (2003-2004) from four products: CERES (Wielicki et al., 1996); ISCCP-FD (Zhang et al., 2004); UMD/V3.3.1 (Liu and Pinker 2008); and MODIS (Wang and Pinker, 2009). Note the relatively large disagreement in the northern hemisphere and particularly the Arctic latitudes. (CERES data were obtained from the NASA Langley Research Center EOSDIS Distributed Active Archive Center.)

19
Figures
Figure 1. Schematic of surface fluxes and related processes for high latitudes. Radiative fluxes are both shortwave (SW) and longwave (LW). Surface turbulent fluxes are stress, sensible heat (SHF) and latent heat (LHF). Ocean surface moisture fluxes are precipitation and evaporation (proportional to LHF).

20
Figure 2. Frequency of winds exceeding 25m/s for the QuikSCAT observations from July 1999 through June 2009, based on Remote Sensing Systems’ Ku2001 algorithm. Northern hemisphere extreme winds are associated with topography and western boundary currents, and occur in boreal winter; southern hemisphere events are more wide spread, and occur year around. The Southern Hemisphere storm track is active year round with strong winds, whereas the Northern Hemisphere extreme winds are typically in boreal winter. Locations with less than approximately 51% of possible observations are plotted as white, thereby excluding some regions with seasonal ice.
21
0 5 10 15 200.5
1
1.5
2
2.5x 10
-3
Cd1
0n
0 5 10 15 200.5
1
1.5
2
2.5x 10
-3
CE
10n
or C
H10
n
U10n (m/s)
0 2 4 6 8 10 12 14 16 18 2010
0
101
102
U10 (m/s)
K66
0(cm
/hr)
Figure 3. 10-m neutral turbulent transfer coefficients (Cd10n, CE10n, CH10n) as a function of 10-m neutral wind speed from direct surface-based observations: drag coefficient (top), heat transfer coefficients (middle) and CO2 transfer coefficient (bottom). A percentage error in the transfer coefficient results in a similar percentage error in the flux: differences in parameterizations are greatest at low and high wind speeds. The black line is the mean of the data sets; the error bars are statistical estimates of the uncertainty in the mean. The parameterizations shown in the top two panels are COARE algorithm (red), NCEP reanalysis (green), ECMWF (blue), Large and Yeager (magenta). Symbols on the upper two panels are: circle – U. Connecticut (FLIP, Martha’s Vineyard Observatory, and moored buoys), diamond – U. Miami (ASIS spar buoy), and square – NOAA/ESRL (ships). The gas transfer coefficient parameterizations shown in the bottom panel are: blue dashed line - McGillis et al 2001, red dashed line – NOAA/COARE CO2. Gas transfer coefficient coefficients as a function of 10-m neutral wind speed from direct surface-based observations. CO2 panel symbols are: circle - GASEX98, square - GASEX01, diamond – GASEX08 (data courtesy J. Edson, W. McGillis).
22
Figure 4. Boundary-layer observations of a cold-air outbreak off the east coast of Greenland during an instrumented aircraft flight on 5 March 2007. Panels show (top) 2-m temperature (red) and sea-surface temperature (blue); (middle) 10-meter wind speed; and (bottom) surface sensible (red) and latent (blue) heat fluxes calculated using the eddy covariance method (taken from Petersen and Renfrew 2009) as a function of distance. The observations are averaged into 12-km runs (circles). Interpolated estimates from ECMWF operational analyses (solid line) and the much coarser resolution NCEP global reanalyses (dashed line) are also plotted. The plots show a rapid warming from over the sea ice zone (0-30 km) off shore and a jump in wind speed and observed heat fluxes across the ice edge.

Figure 5. Comparison of oceanic sensible (top) and latent (bottom) heat fluxes from readily available products: NCEP2 (blue), JMA (green), ERA40 (purple), IFREMER (red), and HOAPS (cyan). Each box shows zonally averaged (0 through 360 degrees) monthly fluxes for the 5th, 25th, 50th, 75th, or 95th percentiles. The period for comparison (for which all products are available) is 03/1992 through 12/2000. Clearly there are very large differences in the distribution of fluxes. Furthermore, there is a great deal of regional surface flux variability in all high latitude seas: product differences are greater on smaller spatial and temporal scales.
24
Figure 6. Spatial and temporal scales for high latitude processes, and the recommended accuracy of related surface fluxes. These accuracies are estimates from a wide range of scientists working on related processes. The accuracy requirements are difficult to determine or validate, as the errors in current products are not sufficiently well understood to quantify requirements.

25
Figure 7. Comparison of the zonal mean downwelling shortwave flux averaged for two July months (2003-2004) from four products: CERES (Wielicki et al., 1996); ISCCP-FD (Zhang et al., 2004); UMD/V3.3.1 (Liu and Pinker 2008); and MODIS (Wang and Pinker, 2009). Note the relatively large disagreement in the northern hemisphere and particularly the Arctic latitudes. (CERES data were obtained from the NASA Langley Research Center EOSDIS Distributed Active Archive Center.)