Outfall monitoring overview BACKGROUND
64
Outfall monitoring overview BACKGROUND Massachusetts Water Resources Authority Environmental Quality Department Report 2008-18
Transcript of Outfall monitoring overview BACKGROUND

Outfall monitoring overview BACKGROUND
Massachusetts Water Resources Authority
Environmental Quality Department Report 2008-18

Citation: Werme C, Hunt CD. 2008. Outfall monitoring overview BACKGROUND. Boston: Massachusetts Water Resources Authority. Report 2008-18. 54p.

Outfall Monitoring Overview BACKGROUND prepared for Massachusetts Water Resources Authority Environmental Quality Department 100 First Avenue Charlestown Navy Yard Boston, MA 02129 prepared by Christine Werme Berkeley, CA 94705 and Carlton D. Hunt Battelle 397 Washington Street Duxbury, MA 02332 November 4, 2008

This page intentionally left blank.

OUTFALL MONITORING OVERVIEW BACKGROUND I
Table of Contents Summary ............................................................................................................................ iii 1. Introduction..................................................................................................................... 1
Background..................................................................................................................... 1 Outfall Permit.................................................................................................................. 4 Monitoring Program........................................................................................................ 5 Contingency Plan ............................................................................................................ 9 Data Management ......................................................................................................... 11 Reporting....................................................................................................................... 11 Outfall Monitoring Overview ....................................................................................... 12
2. Effluent ......................................................................................................................... 14 Background................................................................................................................... 14
Pollution Prevention and Wastewater Treatment ..................................................... 14 Environmental Concerns........................................................................................... 15
Monitoring Design ........................................................................................................ 17 Contingency Plan Thresholds ....................................................................................... 20
3. Water Column............................................................................................................... 21 Background................................................................................................................... 21
Circulation and Water Properties.............................................................................. 21 Environmental Concerns........................................................................................... 23
Monitoring Design ........................................................................................................ 25 Contingency Plan Thresholds ....................................................................................... 31
4. Sea Floor ....................................................................................................................... 32 Background................................................................................................................... 32
Bottom Characteristics and Sediment Transport ...................................................... 32 Environmental Concerns........................................................................................... 32
Monitoring Design ........................................................................................................ 33 Contingency Plan Thresholds ....................................................................................... 38
5. Fish and Shellfish.......................................................................................................... 40 Background................................................................................................................... 40 Monitoring Design ........................................................................................................ 41
Winter Flounder ........................................................................................................ 41 Lobster ...................................................................................................................... 41 Blue Mussel .............................................................................................................. 43
Contingency Plan Thresholds ....................................................................................... 44 6. Special Studies .............................................................................................................. 45
Background................................................................................................................... 45 7. Stellwagen Bank National Marine Sanctuary ............................................................... 46
Background................................................................................................................... 46 Monitoring Design ........................................................................................................ 47
References......................................................................................................................... 50 List of Acronyms .............................................................................................................. 54

OUTFALL MONITORING OVERVIEW BACKGROUND II
List of Figures Figure 1-1. Massachusetts and Cape Cod bays, including the location of the MWRA outfall and other factors that were important to the siting process. .................................... 3 Figure 3-1. (a) General circulation within Massachusetts Bay. (b) General circulation within the Gulf of Maine................................................................................................... 22 Figure 3-2. MWRA Bay Water Quality Monitoring stations and regional groupings included in the program .................................................................................................... 27 Figure 3-3. MWRA plankton stations included in water-column monitoring.................. 28 Figure 3-4. MWRA Boston Harbor Water Quality Monitoring stations ......................... 29 Figure 4-1. Locations of nearfield soft-bottom stations.................................................... 34 Figure 4-2. Locations of farfield soft-bottom stations. ..................................................... 35 Figure 4-3. Locations of hard-bottom stations.................................................................. 36 Figure 5-1. Sampling areas and reference sites for fish-and-shellfish monitoring ........... 42 Figure 7-1. MWRA and supplemental water-column stations in and near the Stellwagen Bank National Marine Sanctuary...................................................................................... 48 Figure 7-2. Farfield benthic stations ................................................................................. 49
List of Tables Table 1-1. List of panel and committee organizations........................................................ 5 Table 1-2. Public concerns and environmental responses presented in the monitoring plan ............................................................................................................................................. 7 Table 1-3. Monitoring program objectives and analyses.................................................... 8 Table 1-4. Contingency Plan threshold parameters. ......................................................... 10 Table 1-5. Monitoring reports submitted to OMSAP. ...................................................... 12 Table 2-1. Monitoring questions developed by OTMF related to the effluent. ................ 15 Table 2-2. Reporting requirements of the outfall permit. ................................................. 18 Table 2-3. Monitoring plan parameters for effluent. ........................................................ 19 Table 2-4. Contingency Plan threshold values for effluent monitoring............................ 20 Table 3-1. Monitoring questions developed by OTMF related to the water column. ...... 24 Table 3-2. Components of water-column monitoring....................................................... 26 Table 3-3. Nearfield water-column monitoring parameters. ............................................ 30 Table 3-4. Farfield water-column monitoring parameters................................................ 30 Table 3-5. Contingency Plan threshold values for water-column monitoring.................. 31 Table 4-1. Monitoring questions developed by OTMF related to the sea floor. .............. 33 Table 4-2. Contingency Plan threshold values for sea-floor monitoring.......................... 39 Table 5-1. Monitoring questions developed by OTMF related to fish and shellfish........ 40 Table 5-2. Chemical analyses of fish and shellfish........................................................... 43 Table 5-3. Contingency Plan threshold values for fish-and-shellfish monitoring. ........... 44

OUTFALL MONITORING OVERVIEW BACKGROUND III
Summary Since its creation by an act of state legislature in 1984, the Massachusetts Water Resources Authority (MWRA) has worked to minimize the effects of wastewater discharge on the marine environment. The MWRA program has taken steps to reduce the amount of pollutants entering the waste stream, improve treatment before discharge, and provide for better dilution upon discharge of treated effluent into marine waters. In September 2000, MWRA ended discharge into the more confined waters of Boston Harbor and began to discharge at a deeper site in the more open waters of Massachusetts Bay. Subsequent years are referred to as being “post-diversion.” One condition of the National Pollutant Discharge Elimination System (NPDES) permit for the Massachusetts Bay discharge is that MWRA prepare an annual document summarizing the year’s monitoring results. Outfall monitoring overview documents were prepared for most years prior to the permit being in place and for each post-diversion discharge year. Overviews prepared for the years through 2006 included the background information that is the basis for this document. With the 2007 monitoring year, it had become apparent that most or all of the questions developed prior to the discharge diversion had been answered. As had been anticipated, it was possible to detect minimal effects in the immediate vicinity of the outfall, but there has been no indication of unexpected or broad-range changes. As part of a new focus on verification of continued protection and anticipation of new challenges, MWRA has decided to focus the annual overviews on new and interesting results. The background information, which does not change from year-to-year, has been placed into this separate document. This document presents background information on environmental concerns, monitoring design, and Contingency Plan thresholds for effluent, water-column, sea-floor, and fish-and-shellfish monitoring. Also described are MWRA’s special studies and its commitment to reporting data relevant to the Stellwagen Bank National Marine Sanctuary.

OUTFALL MONITORING OVERVIEW BACKGROUND IV
This page intentionally left blank.

OUTFALL MONITORING OVERVIEW BACKGROUND 1
1. Introduction
Background For more than two decades, the Massachusetts Water Resources Authority (MWRA) has worked to minimize the effects of wastewater discharge on the marine environment. MWRA was created by an act of the Massachusetts state legislature in December 1984 and in 1985 embarked upon what has become known as the Boston Harbor Project. Before then, the Boston metropolitan area discharged both sewage biosolids and inadequately treated sewage effluent into the confined waters of Boston Harbor from outfalls located at Deer Island in the northern part of the harbor and at Nut Island in Quincy Bay, in the southern part of the harbor. MWRA ended discharge of municipal biosolids into Boston Harbor in 1991, when biosolids from both treatment plants began to be barged to a processing plant in Quincy and made into fertilizer pellets. Steps to minimize effects of effluent discharge have included:
• Source reduction to prevent pollutants from entering the waste stream.
• Improved treatment before discharge. • Better dilution once the effluent enters the marine environment.
Source reduction has included projects to lessen household hazardous- waste disposal and minimize mercury discharges from hospitals and dentists. An industrial pretreatment/pollution-prevention program ensures that toxic contaminants are removed before they reach the sewer system. In addition, best management practices are employed at sewer facilities to mitigate accidental discharge of pollutants. Improved treatment has been implemented in a series of steps. In 1995, a new primary treatment plant was brought on-line at Deer Island Treatment Plant (DITP), and disinfection facilities were completed. (Primary treatment is a physical treatment process, which involves removal of solids through settling, followed by disinfection.) Batteries of secondary treatment (which includes bacterial decomposition as well as settling and disinfection) went on-line in 1997, 1998, and 2001. Also during 1998, discharge from the Nut Island Treatment Plant into Quincy Bay ceased, and all wastewater was conveyed to the Deer Island Treatment Plant (DITP) for treatment, ending effluent discharge to the southern part of the harbor.

OUTFALL MONITORING OVERVIEW BACKGROUND 2
Efforts to improve treatment continued in 2005, when MWRA initiated studies aimed at maximizing flow through the secondary treatment system. These studies built on several capital projects, including improvements to the secondary treatment facilities and upgrades to the oxygen-generation plant. In 2005, the final piece of the cross-harbor tunnel, which connected DITP to the Fore River biosolids pelletizing plant was completed. Pipes within the tunnel now transport digested biosolids from DITP to the pelletizing plant; the liquid waste from biosolids thickening at Fore River is piped back to DITP. Before the tunnel was completed, liquid (rich in nutrients) was removed from the biosolids at DITP in batches, in preparation for barging to the pelletizing plant, and was added in batches to the influent stream at the beginning of the effluent treatment process. This sporadic addition of nutrients made it more difficult to maintain a stable microbial secondary process. Now, the liquid is removed at the pelletizing plant and piped back to DITP in a relatively steady stream, facilitating a more stable process. Better dilution was achieved in 2000, by diverting the effluent discharge from Boston Harbor to a 9.5-mile-long outfall and diffuser system, located offshore in Massachusetts Bay (Figure 1-1). The Massachusetts Bay site was selected because it had a water depth and current patterns that would promote effective dilution, it was the least likely of the alternative sites to affect sensitive resources, and it was feasible to construct an outfall tunnel to the location. The outfall tunnel is bored through bedrock and has a diffuser system made up of 53 risers, each with five or six open ports, along its final 1.25 miles. Discharge from the diffuser heads is at the sea floor, at water depths of about 100 feet. Initial dilution at the outfall is about five times that of the Boston Harbor outfall that it replaced, which was located in shallower water, at a depth of 50 feet. The offshore location of the outfall ensures that effluent will not reach beaches or shellfish beds within a tidal cycle, even if currents are shoreward.

OUTFALL MONITORING OVERVIEW BACKGROUND 3
Figure 1-1. Massachusetts and Cape Cod bays, including the location of the MWRA outfall and other factors that were important to the siting process.

OUTFALL MONITORING OVERVIEW BACKGROUND 4
For many of the components of MWRA’s work, there was little or no argument that the project benefited the marine environment and the people of the region. Moving the effluent outfall from the harbor to Massachusetts Bay did raise some concerns, which were expressed as general, continuing questions:
• Is it safe to eat fish and shellfish? • Are natural/living resources protected? • Is it safe to swim? • Are aesthetics being maintained?
These concerns were recognized by MWRA and by the permit for the outfall issued jointly by the U.S. Environmental Protection Agency (EPA) and the Massachusetts Department of Environmental Protection (MADEP). An outfall monitoring program, which had already been initiated, was formally established in MWRA’s National Pollutant Discharge Elimination System (NPDES) permit.
Outfall Permit The permit issued by EPA and MADEP under NPDES became effective on August 9, 2000 and continues to be in effect, although it formally expired on August 9, 2005. The permit limits discharges of pollutants and requires reporting on the treatment plant operation and maintenance. The permit requires MWRA to continue its ongoing pollution prevention program and to employ best management practices aimed at preventing accidental discharge of pollutants to the sewer system. The permit requires MWRA to monitor the effluent and the ambient receiving waters for compliance with permit limits and in accordance with monitoring plans (MWRA 1991, 1997a, 2004) developed in response to the EPA Supplemental Environmental Impact Statement (SEIS) prepared as part of the outfall-siting process (EPA 1988). It requires that MWRA implement a Contingency Plan (MWRA 1997b, 2001), which identifies relevant environmental quality parameters and thresholds that, if exceeded, would require a response. In 1998, in anticipation of the permit, EPA and MADEP established an independent panel of scientists to review monitoring data and provide advice on key scientific issues related to the permit. This panel, the Outfall Monitoring Science Advisory Panel (OMSAP, Table 1-1), conducts peer reviews of monitoring reports, evaluates the data, and advises EPA and MADEP on scientific implications. OMSAP also provides advice concerning any proposed modifications to the monitoring or contingency plans.

OUTFALL MONITORING OVERVIEW BACKGROUND 5
OMSAP may form specialized focus groups when specific technical issues require expanded depth or breadth of expertise. One long-standing OMSAP focus is the Model Evaluation Group, which has met periodically since 1992 to evaluate the Bays Eutrophication Model. Two standing sub-committees also advise OMSAP. The Public Interest Advisory Committee (PIAC) represents local, non-governmental organizations and environmental groups and advises OMSAP on values and uses of the harbor and the bays. The Inter-agency Advisory Committee (IAAC) represents state and federal agencies and provides OMSAP with advice concerning environmental regulations. Table 1-1. List of panel and committee organizations. Outfall Monitoring Science Advisory Panel (OMSAP)
Woods Hole Oceanographic Institution University of Rhode Island Massachusetts Institute of Technology Sea Grant University of Massachusetts at Boston Harvard School of Public Health
Inter-agency Advisory Committee (IAAC)
US Geological Survey MA Coastal Zone Management US Army Corps of Engineers Stellwagen Bank National Marine Sanctuary MA Department of Environmental Protection MA Division of Marine Fisheries US Environmental Protection Agency National Marine Fisheries Service
Public Interest Advisory Committee (PIAC)
Save the Harbor/Save the Bay Center for Coastal Studies Wastewater Advisory Committee Conservation Law Foundation Massachusetts Audubon Society New England Aquarium MWRA Advisory Board Association for the Preservation of Cape Cod Safer Waters in Massachusetts The Boston Harbor Association Cape Cod Commission
Monitoring Program EPA and MADEP require monitoring to ensure compliance with the permit, to assess whether the outfall has effects beyond the area identified in the SEIS as acceptable, and to collect data useful for outfall management. In anticipation of these requirements, MWRA began some studies during 1989–1991 and implemented a broad baseline-monitoring program in 1992. Outfall ambient monitoring plans were originally developed and refined under the direction of an Outfall Monitoring Task Force (OTMF), made up of scientists, regulators, and environmental advocacy groups (MWRA 1991, 1997a). (The OMTF was disbanded upon creation of OMSAP.) Because the first years of monitoring following diversion of effluent to the bay found no unexpected changes to

OUTFALL MONITORING OVERVIEW BACKGROUND 6
the system, changes to the monitoring program were approved by EPA and MADEP, and a new plan (MWRA 2004) was implemented in the 2004 monitoring year. The outfall ambient monitoring plan expands the general questions of public concern by translating them into possible “environmental responses,” which are more specific questions directly related to the outfall (Table 1-2). To answer those questions, the monitoring program focuses on critical constituents of treatment plant effluent, such as nutrients, organic material, toxic contaminants, pathogens, and solids. Presence and potential effects of these constituents are evaluated within the context of four environmental measurement areas: effluent, water column, sea floor, and fish and shellfish (Table 1-3). The basic program is augmented by special studies, which are conducted in response to specific permit requirements, scientific questions, and environmental concerns. The monitoring program is designed to compare environmental quality of the Massachusetts Bay system, including Boston Harbor and Cape Cod Bay, before and after the outfall location moved from the harbor to the bay.
OUTFALL MONITORING OVERVIEW BACKGROUND 7
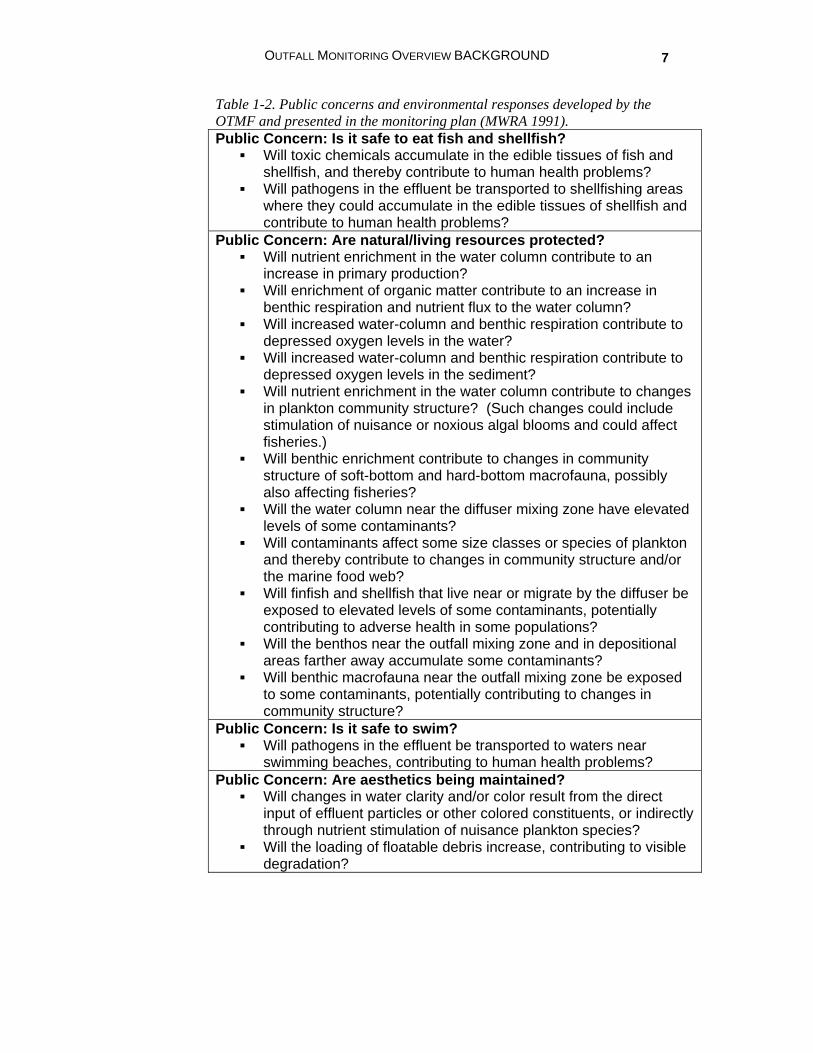
Table 1-2. Public concerns and environmental responses developed by the OTMF and presented in the monitoring plan (MWRA 1991). Public Concern: Is it safe to eat fish and shellfish?
Will toxic chemicals accumulate in the edible tissues of fish and shellfish, and thereby contribute to human health problems?
Will pathogens in the effluent be transported to shellfishing areas where they could accumulate in the edible tissues of shellfish and contribute to human health problems?
Public Concern: Are natural/living resources protected? Will nutrient enrichment in the water column contribute to an
increase in primary production? Will enrichment of organic matter contribute to an increase in
benthic respiration and nutrient flux to the water column? Will increased water-column and benthic respiration contribute to
depressed oxygen levels in the water? Will increased water-column and benthic respiration contribute to
depressed oxygen levels in the sediment? Will nutrient enrichment in the water column contribute to changes
in plankton community structure? (Such changes could include stimulation of nuisance or noxious algal blooms and could affect fisheries.)
Will benthic enrichment contribute to changes in community structure of soft-bottom and hard-bottom macrofauna, possibly also affecting fisheries?
Will the water column near the diffuser mixing zone have elevated levels of some contaminants?
Will contaminants affect some size classes or species of plankton and thereby contribute to changes in community structure and/or the marine food web?
Will finfish and shellfish that live near or migrate by the diffuser be exposed to elevated levels of some contaminants, potentially contributing to adverse health in some populations?
Will the benthos near the outfall mixing zone and in depositional areas farther away accumulate some contaminants?
Will benthic macrofauna near the outfall mixing zone be exposed to some contaminants, potentially contributing to changes in community structure?
Public Concern: Is it safe to swim? Will pathogens in the effluent be transported to waters near
swimming beaches, contributing to human health problems? Public Concern: Are aesthetics being maintained?
Will changes in water clarity and/or color result from the direct input of effluent particles or other colored constituents, or indirectly through nutrient stimulation of nuisance plankton species?
Will the loading of floatable debris increase, contributing to visible degradation?

OUTFALL MONITORING OVERVIEW BACKGROUND 8
Table 1-3. Monitoring program objectives and analyses.
Task Objective Analyses Effluent
Effluent sampling Characterize wastewater discharge from Deer Island Treatment Plant
Flow Organic material (cBOD) Solids pH Bacterial indicators Total residual chlorine Toxicity Nutrients Toxic contaminants Floatables
Water Column Nearfield surveys Collect water quality data
near outfall location
Farfield surveys Collect water quality data throughout Massachusetts and Cape Cod bays
Temperature Salinity Dissolved oxygen Nutrients Solids Chlorophyll Water clarity Photosynthesis Respiration Phytoplankton Zooplankton
Moorings (GoMOOS and USGS)
GoMOOS mooring is near Cape Ann. USGS mooring was near outfall and provided continuous oceanographic data until February 2006.
Currents Temperature Salinity Water clarity Chlorophyll
Remote sensing Provides oceanographic data on a regional scale through satellite imagery
Surface temperature Chlorophyll
Sea Floor
Soft-bottom studies
Evaluate sediment quality and benthos in Boston Harbor and Massachusetts Bay
Sediment chemistry Sediment profile imagery Community composition
Hard-bottom studies
Characterize marine benthic communities in rock and cobble areas
Topography Substrate Community composition
Fish and Shellfish
Winter flounder Determine contaminant body burden and population health
Tissue contaminant concentrations Physical abnormalities, including liver histopathology
American lobster Determine contaminant body burden
Tissue contaminant concentrations Physical abnormalities
Blue mussel
Evaluate biological condition and potential contaminant bioaccumulation
Tissue contaminant concentrations

OUTFALL MONITORING OVERVIEW BACKGROUND 9
Baseline monitoring was initially planned to last for a minimum of three years, as the outfall was originally planned for completion in 1995. Delays in construction allowed a relatively long period for baseline studies. Consequently, MWRA’s nine years of baseline monitoring were able to document greater natural variability and develop a better understanding of the system than would have been possible in a briefer baseline period. MWRA was also able to evaluate the environmental responses in Boston Harbor to other facilities improvements (e.g., Leo et al. 1995; Pawlowski et al. 1996; Rex and Connor 1997; Rex 2000; Rex et al. 2002; Taylor 2002, 2003, 2004, 2005a, 2005b, 2006). The extended period also meant that the discharge to Massachusetts Bay, when it did begin, had the benefit of nearly complete implementation of secondary treatment. The monitoring plan is a “living document.” That is, every effort is made to incorporate new scientific information and improved understanding resulting from the monitoring program into appropriate continued measurements. MWRA’s NPDES permit allows an annual list of proposed changes to the monitoring plan.
Contingency Plan The MWRA Contingency Plan (MWRA 1997b, 2001) describes how, if monitoring results indicate a possible environmental problem, MWRA and the regulatory agencies will respond to determine the cause of the problem and to specify the corrective actions that should be taken if the problem appears to be related to the discharge. The Contingency Plan identifies parameters that represent environmentally significant components of the effluent or the ecosystem and that, if specific threshold levels are exceeded, indicate a potential for environmental risk (Table 1-4). The plan provides a process for evaluating parameters that exceed thresholds and formulating appropriate responses.

OUTFALL MONITORING OVERVIEW BACKGROUND 10
Table 1-4. Contingency Plan threshold parameters. Measurement Area Parameter
pH Fecal coliform bacteria Residual chlorine Total suspended solids Biochemical oxygen demand Toxicity PCBs Plant performance Flow
Effluent
Total nitrogen load Floatables Oil and grease Dissolved oxygen concentration and saturation Dissolved oxygen depletion rate Chlorophyll Nuisance and noxious algae
Water Column
Effluent dilution
Sea Floor Sediment contaminants Redox potential discontinuity (RPD) depth Benthic community structure PCBs, mercury, chlordanes, dieldrin, and DDTs in mussels and in flounder and lobster tissue Lead in mussels
Fish and Shellfish
Liver disease in flounder
Threshold values, the measurements selected as indicators of the need for action, are based on permit limits, state water quality standards, and expert opinion. To alert MWRA to any changes, some parameters have more conservative “caution” as well as more serious “warning” thresholds. Exceeding either caution or warning thresholds could indicate a need for increased attention or study. If a caution threshold is exceeded, MWRA, with guidance from OMSAP and the regulatory agencies, may expand the monitoring to track effluent quality and environmental conditions. The data are examined to determine whether it is likely that an unacceptable effect resulting from the outfall has occurred. Exceeding warning levels could, in some circumstances, indicate a need for a response to avoid potential adverse environmental effects. If a threshold is exceeded at a warning level, the response includes early notification of EPA and MADEP and, if it appears that the outfall has contributed to adverse environmental effects, the quick development of a response plan. Response plans are to include a schedule for implementing actions, such as making adjustments in plant operations or undertaking an engineering study regarding specific potential corrective activities.

OUTFALL MONITORING OVERVIEW BACKGROUND 11
Every effort is made to incorporate new scientific information and improved understanding resulting from the monitoring program into appropriate thresholds. A process for modifying the Contingency Plan is set forth in MWRA’s NPDES permit, and Revision 1 was approved during 2001.
Data Management The monitoring program has generated extensive data sets. Data quality is maintained through program-wide quality assurance and quality control procedures. After validation, data from field surveys and laboratory analyses are loaded into a centralized project database. Data handling procedures are automated to the maximum extent possible to reduce errors, ensure comparability, and minimize reporting time. Data that are outside the expected ranges are flagged for review. Data reported by the laboratory as suspect (for example, because the sample bottle was cracked in transit) are marked as such and not used in interpretation or threshold calculations, although they are retained in the database and included in raw data reports. Any corrections are documented. Each data report notes any special data quality considerations associated with the data set. As monitoring results become available, they are compared with Contingency Plan thresholds. Computer programs calculate each threshold parameter value from the data, compare it to the threshold, and notify the project staff if caution or warning levels are exceeded.
Reporting MWRA’s NPDES permit requires regular reports on effluent quality and extensive reporting on the monitoring program. A variety of reports are submitted to OMSAP for review (Table 1-5). Changes to the monitoring program or the Contingency Plan must be reviewed by regulators and published in the Environmental Monitor. Data that exceed Contingency Plan thresholds and corrective actions must also be reported. Data that exceed thresholds must be reported within five days after the results become available, and MWRA must make all reasonable efforts to report all data on thresholds within 90 days of each sampling event. Reports are posted on MWRA’s web site (www.mwra.com/harbor/ html/npdes.htm), and copies are placed in repository libraries in Boston and on Cape Cod. OMSAP also holds public workshops at which outfall monitoring results are presented.

OUTFALL MONITORING OVERVIEW BACKGROUND 12
Table 1-5. Monitoring reports submitted to OMSAP.
Reports Description/Objectives Outfall Monitoring Plans Phase I—Baseline Studies (MWRA 1991) Phase II—Discharge Ambient Monitoring (MWRA 1997a, 2004)
Discuss goals, strategy, and design of baseline and discharge monitoring programs.
Contingency Plan (MWRA 1997b, 2001)
Describes development of threshold parameters and values and MWRA’s planned contingency measures.
Program Area Synthesis Reports
Summarize, interpret, and explain annual results for effluent, water column, benthos, and fish and shellfish monitoring areas.
Special Studies Reports
Discuss, analyze, and cross-synthesize data related to specific issues in Massachusetts and Cape Cod bays.
Outfall Monitoring Overviews
Summarize monitoring data and include information relevant to the Contingency Plan.
Outfall Monitoring Overview Among the many reports that MWRA completes, the outfall monitoring overview has been prepared for most baseline-monitoring years and for each year that the permit has been in place (Galya et al. 1996, 1997a, 1997b; Werme and Hunt 2000a, 2000b, 2001, 2002, 2003, 2004, 2005, 2006, 2007). The reports include scientific summaries for the year of monitoring. Overviews for 1994 through 1999 included only baseline information. With the Massachusetts Bay outfall discharging, subsequent reports have included information relevant to the Contingency Plan, including threshold exceedances, responses, and corrective actions. When data suggest that monitoring activities, parameters, or thresholds should be changed, the report summarizes those recommendations. Overviews prepared through the 2006 monitoring year included the background information that is the basis for this document, the Outfall Monitoring Overview Background. After nine years of baseline monitoring and six years of post-diversion monitoring, however, it became clear that most or all of the monitoring questions that had been developed by the OTMF had been answered. As had been expected, monitoring has been able to detect minimal effects in the immediate vicinity of the outfall, but there has been no indication of unexpected or broad-range changes.

OUTFALL MONITORING OVERVIEW BACKGROUND 13
As MWRA began to focus monitoring on verification of continued protection of the environment and anticipation of potential new challenges, it became clear that the annual overviews should focus on new and interesting results rather than on the background. Overviews for 2007 and subsequent years focus on those results and on comparison of results to the Contingency Plan thresholds. This background document presents information that does not change from year-to-year—the environmental concerns that have driven the monitoring program, monitoring designs, and Contingency Plan thresholds for effluent, water-column, sea-floor, and fish-and-shellfish monitoring. It also describes MWRA special studies and its commitment to reporting of data relevant to the Stellwagen Bank National Marine Sanctuary.

OUTFALL MONITORING OVERVIEW BACKGROUND 14
2. Effluent
Background
Pollution Prevention and Wastewater Treatment Ensuring that the final effluent is clean is the most important element in MWRA’s strategy to improve the environmental quality of Boston Harbor without degrading Massachusetts and Cape Cod bays. MWRA ensures clean effluent through its vigorous pretreatment program and by proper maintenance and operation of DITP. The MWRA Toxic Reduction and Control (TRAC) program sets and enforces limits on the types and amounts of pollutants that industries can discharge into the sewer system and works with industries to encourage voluntary reductions in their use of toxic chemicals. TRAC has also implemented programs to reduce mercury from dental facilities and to educate the public about proper disposal of hazardous wastes. A booklet, A Healthy Environment Starts at Home (available at www.mwra.com), identifies household products that could be hazardous and recommends alternatives. Secondary treatment further reduces the concentrations of contaminants of concern, except for nutrients. DITP removes approximately 85–90% of the suspended solids and biochemical oxygen demand (BOD), 50–90% of the toxic chemicals, and about 15% of the nitrogen from the influent. To prevent accidental discharge of pollutants and mitigate effects should an accident occur, MWRA has implemented best management practice plans at the treatment plant, headworks facilities, combined sewer overflow facilities, pumping stations, and biosolids-to-fertilizer plant. The plans include daily visual inspections and immediate corrective actions. Effectiveness of best management practices is assessed by non-facility staff.

OUTFALL MONITORING OVERVIEW BACKGROUND 15
Environmental Concerns Sewage contains a variety of contaminants that could, at too high levels, affect the marine environment, public health, and aesthetics. The MWRA permit sets limits on these contaminants so as to ensure that these attributes will be protected. Several specific questions in the MWRA ambient monitoring plan respond to public concerns and possible environmental responses by addressing whether the effluent is meeting permit limits (Table 2-1). Other questions require the use of effluent data in conjunction with plume-dilution studies, which were completed in 2001, and water-column monitoring (see Section 3, Water Column). Table 2-1. Monitoring questions developed by OTMF related to the effluent. Is it safe to eat fish and shellfish? Will pathogens in the effluent be transported to shellfishing areas where they could accumulate in the edible tissues of shellfish and contribute to human health problems?
Do effluent pathogens exceed the permit limit? Are pathogens transported to shellfish beds at levels that might affect
shellfish consumer health? Are natural/living resources protected? Will the water column near the diffuser-mixing zone have elevated levels of some contaminants?
Do effluent contaminant concentrations exceed permit limits? What are the concentrations of contaminants and characteristic tracers
of sewage in the influent and effluent and their associated variability? Will finfish and shellfish that live near or migrate by the diffuser be exposed to elevated levels of some contaminants, potentially contributing to adverse health in some populations?
Does acute or chronic toxicity of effluent exceed permit limits? Do levels of contaminants in water outside the mixing zone exceed state
water quality standards? Is it safe to swim? Will pathogens in the effluent be transported to waters near swimming beaches, contributing to human health problems?
Do effluent pathogens exceed the permit limit? Are pathogens transported to beaches at levels that might affect
swimmer health? Are aesthetics being maintained? Will changes in water clarity and/or color result from the direct input of effluent particles or other colored constituents, or indirectly through nutrient stimulation of nuisance plankton species? Will the loading of floatable debris increase, contributing to visible degradation?
Do conventional pollutants in the effluent exceed permit limits? Has the clarity and/or color of the water around the outfall changed? Has the amount of floatable debris around the outfall changed?

OUTFALL MONITORING OVERVIEW BACKGROUND 16
The effluent constituents of greatest concern include pathogens, toxic contaminants, organic material, solid material, nutrients, oil and grease, and “floatables,” such as plastic and other debris. The MWRA permit also sets limits for chlorine and pH:
• Pathogens, including bacteria, viruses, and protozoa, are found in human and animal waste and can cause disease. Human exposure to water-borne pathogens can occur through consumption of contaminated shellfish or through ingestion or physical contact while swimming.
• Toxic contaminants include heavy metals, such as copper and lead, polychlorinated biphenyls (PCBs), pesticides, polycyclic aromatic hydrocarbons (PAHs), and petroleum hydrocarbons. Toxic contaminants can lower survival and reproduction rates of marine organisms. Some toxic contaminants can accumulate in marine life, potentially affecting human health through seafood consumption.
• Organic material, a major constituent of untreated sewage, consumes oxygen as it decays. Even under natural conditions, oxygen levels decline in bottom waters during the late summer, so any effluent component that might further decrease oxygen levels is a concern. Too much organic material could also disrupt animal communities on the sea floor.
• Suspended solids, small particles in the water column, decrease water clarity and consequently affect growth and productivity of algae and other marine plants. Excess suspended solids also detract from people’s aesthetic perception of the environment.
• In marine waters, nitrogen is the limiting nutrient that controls growth of algae and other aquatic plants. Excess nitrogen can be detrimental, leading to eutrophication and low levels of dissolved oxygen, excess turbidity, and nuisance algal blooms. Nutrients, particularly dissolved forms, are the only components of sewage entering the treatment plant that are not substantially reduced by secondary treatment.
• Oil and grease slicks and floating debris known as floatables pose aesthetic concerns. Plastic debris can be harmful to marine life, as plastic bags are sometimes mistaken for food and clog the digestive systems of turtles and marine mammals. Plastic and other debris can also entangle animals and cause them to drown.
• Sewage effluent is disinfected by addition of a form of chlorine, sodium hypochlorite, which is the active ingredient in bleach. While sodium hypochlorite is effective in destroying pathogens, at high enough concentrations, it is harmful to marine life. Consequently, MWRA dechlorinates the effluent with sodium bisulfite before discharge.

OUTFALL MONITORING OVERVIEW BACKGROUND 17
• Seawater is noted for its buffering capacity, that is, its ability to neutralize acids and bases. However, state water quality standards dictate that effluent discharges not change the pH of the ambient seawater more than 0.5 standard units on a scale of 1 to 14. Consequently, the outfall permit sets both upper and lower values for pH of the effluent.
Monitoring Design Effluent monitoring measures the concentrations of constituents of the effluent and variability in those concentrations to assess compliance with NPDES permit limits, which are based on state and federal water quality standards and criteria and on ambient conditions. Effluent monitoring also provides measurements of mass loads of effluent constituents, so that fate, transport, and risk of contaminants can be assessed. The permit includes numeric limits (Table 2-2) for suspended solids, fecal coliform bacteria, pH, chlorine, PCBs, and carbonaceous biochemical oxygen demand (cBOD). In addition, state water quality standards establish limits for 158 pollutants, and the permit prohibits any discharge that would cause or contribute to exceeding any of those limits. Allowable concentrations of contaminants were based on the predicted dilution at the outfall and verified by field studies of outfall plumes in 2001. The permit also prohibits discharge of nutrients in amounts that would cause eutrophication, and it requires MWRA to test the toxicity of the effluent as a whole on sensitive organisms and establishes limits based on the tests. Most parameters are measured in 24-hour composite samples, and some must meet daily, weekly, or monthly limits. Flow is measured continuously. Nutrient measurements include total nitrogen, ammonium, nitrate, and nitrite. Organic material is monitored by measuring the cBOD. Monitoring for toxic contaminants includes analyses for heavy metals of concern, chlorinated pesticides, PCBs, volatile organic compounds, PAHs, total residual chlorine, and cyanide. Toxicity is tested using whole effluent samples. Tests for acute toxicity include 48-hour survival of mysid shrimp (Americamysis bahia, formerly known as Mysidopsis bahia) and inland silverside fish (Menidia beryllina). Chronic toxicity is assessed through inland silverside growth-and-survival and sea urchin (Arbacia punctulata) one-hour-fertilization tests. Pathogen monitoring consists of enumeration of fecal coliform bacteria. Total suspended solids (TSS) and settleable solids are also measured. The Contingency Plan also sets limits for overall plant performance, annual nitrogen load, floatables, and oil and grease. Floatables are measured as part of a special study.

OUTFALL MONITORING OVERVIEW BACKGROUND 18
Table 2-2. Reporting requirements of the outfall permit.
Parameter Sample Type Frequency Limit Permit-required monitoring Flow Flow meter Continuous Report only
Flow dry day Flow meter Continuous 436 MGD annual average
cBOD 24-hr composite 1/day 40 mg/L weekly 25 mg/L monthly
TSS 24-hr composite 1/day 45 mg/L weekly 30 mg/L monthly
pH Grab 1/day Not <6 or >9 Fecal coliform bacteria Grab 3/day 14,000 col/100ml
Total residual chlorine Grab 3/day 631 µg/L daily 456 µg/L monthly
PCB, Aroclors 24-hr composite 1/month 0.045 ng/L Toxicity LC50 24-hr composite 2/month 50% Toxicity C-NOEC 24-hr composite 2/month 1.5% Settleable solids Grab 1/day Chlorides (influent only) Grab 1/day Mercury 24-hr composite 1/month Chlordane 24-hr composite 1/month 4,4’–DDT 24-hr composite 1/month Dieldrin 24-hr composite 1/month Heptachlor 24-hr composite 1/month Ammonium-nitrogen 24-hr composite 1/month Total Kjeldahl nitrogen 24-hr composite 1/month Total nitrate 24-hr composite 1/month Total nitrite 24-hr composite 1/month Cyanide, total Grab 1/month Copper, total 24-hr composite 1/month Total arsenic 24-hr composite 1/month Hexachlorobenzene 24-hr composite 1/month Aldrin 24-hr composite 1/month Heptachlor epoxide 24-hr composite 1/month Total PCBs 24-hr composite 1/month Volatile organic compounds Grab 1/month
Report only
Contingency Plan-required monitoring
Oil and grease, as petroleum hydrocarbons Grab Weekly
Warning threshold/ 15 mg/L
Floatables Continuous Plant performance Ongoing 5 violations/year

OUTFALL MONITORING OVERVIEW BACKGROUND 19
Beyond the requirements of ordinary post-diversion monitoring, the MWRA monitoring plan requires additional nutrient measurements and non-standard, low-detection methods to measure toxic contaminants (Table 2-3). These measurements are made to better interpret field-monitoring results. The monitoring plan also calls for an evaluation of indicators of human pathogens. To date, MWRA has collected data on anthropogenic viruses, viral indicators, and Enterococcus bacteria in the influent and effluent. Table 2-3. Monitoring plan parameters for effluent. Parameter Sample Type Frequency Total Kjeldahl nitrogen Composite Weekly Ammonium Composite Weekly Nitrate Composite Weekly Nitrite Composite Weekly Total phosphorus Composite Weekly Total phosphate Composite Weekly Acid base neutrals Composite Bimonthly Volatile organic compounds Grab Bimonthly Cadmium 24-hour composite Weekly Copper 24-hour composite Weekly Chromium 24-hour composite Weekly Mercury 24-hour composite Weekly Lead 24-hour composite Weekly Molybdenum 24-hour composite Weekly Nickel 24-hour composite Weekly Silver 24-hour composite Weekly Zinc 24-hour composite Weekly 17 chlorinated pesticides 24-hour composite Weekly Extended list of PAHs 24-hour composite Weekly 20 PCB congeners 24-hour composite Weekly

OUTFALL MONITORING OVERVIEW BACKGROUND 20
Contingency Plan Thresholds Contingency Plan thresholds for effluent monitoring include warning levels for all parameters and caution levels for PCBs, plant performance, and nitrogen loads (Table 2-4). Floatable debris is present in low amounts in the effluent, and appropriate methods for assessing it before discharge have remained in development. Meanwhile, presence of debris is assessed by net tows in the vicinity of the outfall site during water-column surveys.
Table 2-4. Contingency Plan threshold values for effluent monitoring.
Parameter Caution Level Warning Level pH None <6 or >9
Fecal coliform bacteria None
14,000 fecal coliforms/100 ml (monthly 90th percentile, weekly geometric mean, maximum daily geometric mean, and minimum of 3 consecutive samples)
Chlorine, residual None 631 µg/L daily, 456 µg/L monthly
Total suspended solids None 45 mg/L weekly
30 mg/L monthly
cBOD None 40 mg/L weekly, 25 mg/L monthly
Toxicity None
Acute: effluent LC50 <50% for shrimp and fish Chronic: effluent NOEC for fish survival and growth and sea urchin fertilization <1.5% effluent
PCBs Aroclor=0.045 ng/L
Plant performance 5 violations/year Noncompliance >5% of the time
Flow None Flow >436 for annual average of dry days
Total nitrogen load 12,500 mtons/year 14,000 mtons/year Floatables Thresholds remain under development Oil and grease None 15 mg/L weekly

OUTFALL MONITORING OVERVIEW BACKGROUND 21
3. Water Column
Background
Circulation and Water Properties Circulation, water properties, and consequently, the biology of Massachusetts and Cape Cod bays are driven by the larger pattern of water flow in the Gulf of Maine (Figure 3-1) and by regional and local winds. A coastal current flows southwestward along the Maine and New Hampshire coasts; it may enter Massachusetts Bay to the north of Boston at Cape Ann. This current drives an average counterclockwise circulation in Massachusetts Bay and (sometimes) Cape Cod Bay. Water flows back out of the bays at Race Point, located at the tip of Cape Cod. Whether the coastal current enters Massachusetts Bay and whether it continues south into Cape Cod Bay depends on the strength of the current and the direction, duration, and speed of the wind. Because the coastal current is strongest during the spring period of high runoff from rivers and streams, the spring circulation pattern is more consistent than that of the summer and fall (Geyer et al. 1992, Jiang et al. 2006). During the summer and fall, freshwater inflow is lower, and so the wind and water density interact in a different, more complex way, with alternating periods of upwelling and downwelling in various locations, depending primarily on the wind direction and strength (Lermusiaux 2001). Water flow varies with week-to-week changes in weather patterns. Flow at any particular time depends on the wind speed and direction relative to the topography of the sea floor. At times, flow can “reverse,” with flow northward along the coast. Transient gyres in Massachusetts and Cape Cod bays spin in either direction. As in many coastal waters, during the winter the water is well-mixed from top to bottom and nutrient levels are high. As light levels increase in the early spring, phytoplankton populations often begin a period of rapid growth known as a spring bloom. Contrary to popular wisdom, however, strong spring blooms do not occur every year. During the years in which they occur, spring blooms begin in the shallowest waters of Cape Cod Bay. Blooms in the deeper Massachusetts Bay waters follow two to three weeks later. Spring phytoplankton blooms are typically followed by an increase in zooplankton abundance. These zooplankton populations are food for many animals, including the endangered right whale.

OUTFALL MONITORING OVERVIEW BACKGROUND 22
(b)
Figure 3-1. (a) General circulation within Massachusetts Bay. Reprinted from Journal of Marine Systems, Vol. 29, Author: PFJ Lermusiaux, "Evolving the subspace of the three-dimensional multiscale ocean variability: Massachusetts Bay," pp 385-422 © 2001 with permission from Elsevier. (b) General circulation within the Gulf of Maine (from Beardsley et al. 1997).
OUTFALL MONITORING OVERVIEW BACKGROUND 23
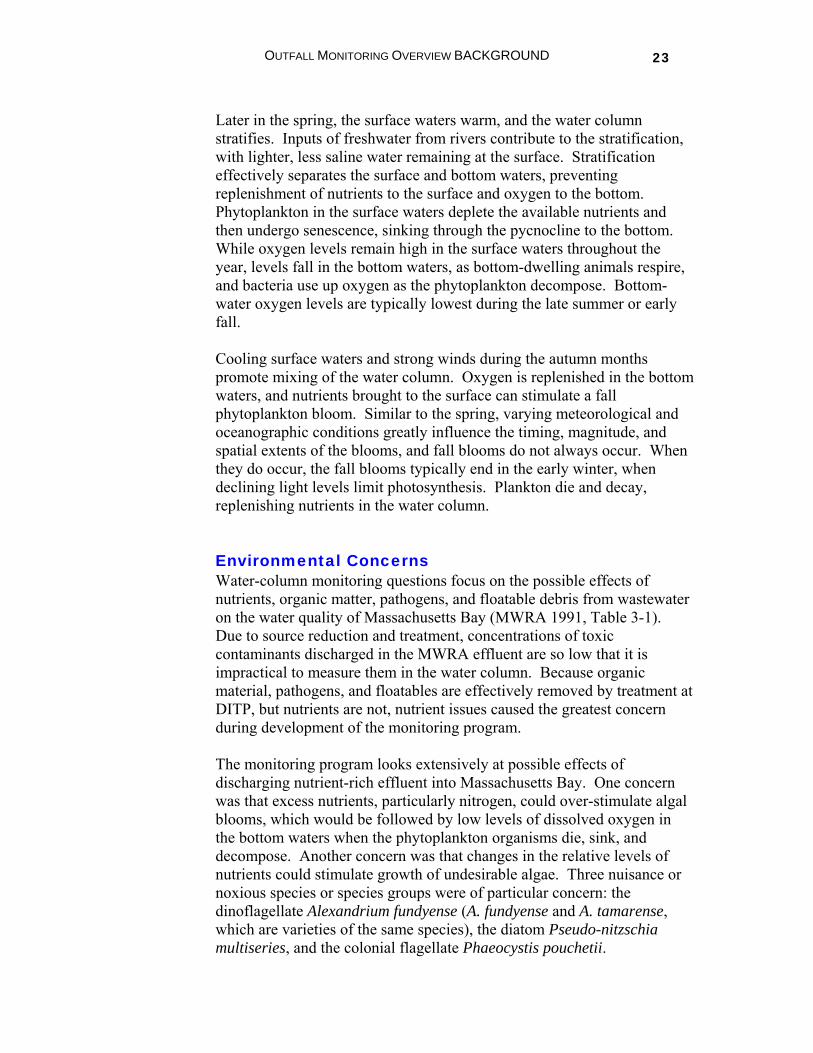
Later in the spring, the surface waters warm, and the water column stratifies. Inputs of freshwater from rivers contribute to the stratification, with lighter, less saline water remaining at the surface. Stratification effectively separates the surface and bottom waters, preventing replenishment of nutrients to the surface and oxygen to the bottom. Phytoplankton in the surface waters deplete the available nutrients and then undergo senescence, sinking through the pycnocline to the bottom. While oxygen levels remain high in the surface waters throughout the year, levels fall in the bottom waters, as bottom-dwelling animals respire, and bacteria use up oxygen as the phytoplankton decompose. Bottom-water oxygen levels are typically lowest during the late summer or early fall. Cooling surface waters and strong winds during the autumn months promote mixing of the water column. Oxygen is replenished in the bottom waters, and nutrients brought to the surface can stimulate a fall phytoplankton bloom. Similar to the spring, varying meteorological and oceanographic conditions greatly influence the timing, magnitude, and spatial extents of the blooms, and fall blooms do not always occur. When they do occur, the fall blooms typically end in the early winter, when declining light levels limit photosynthesis. Plankton die and decay, replenishing nutrients in the water column.
Environmental Concerns Water-column monitoring questions focus on the possible effects of nutrients, organic matter, pathogens, and floatable debris from wastewater on the water quality of Massachusetts Bay (MWRA 1991, Table 3-1). Due to source reduction and treatment, concentrations of toxic contaminants discharged in the MWRA effluent are so low that it is impractical to measure them in the water column. Because organic material, pathogens, and floatables are effectively removed by treatment at DITP, but nutrients are not, nutrient issues caused the greatest concern during development of the monitoring program. The monitoring program looks extensively at possible effects of discharging nutrient-rich effluent into Massachusetts Bay. One concern was that excess nutrients, particularly nitrogen, could over-stimulate algal blooms, which would be followed by low levels of dissolved oxygen in the bottom waters when the phytoplankton organisms die, sink, and decompose. Another concern was that changes in the relative levels of nutrients could stimulate growth of undesirable algae. Three nuisance or noxious species or species groups were of particular concern: the dinoflagellate Alexandrium fundyense (A. fundyense and A. tamarense, which are varieties of the same species), the diatom Pseudo-nitzschia multiseries, and the colonial flagellate Phaeocystis pouchetii.

OUTFALL MONITORING OVERVIEW BACKGROUND 24
Table 3-1. Monitoring questions developed by OTMF related to the water column. Is it safe to eat fish and shellfish? Will pathogens in the effluent be transported to shellfishing areas where they could accumulate in the edible tissues of shellfish and contribute to human health problems?
Are pathogens transported to shellfish beds at levels that might affect shellfish consumer health?
Are natural/living resources protected? Will nutrient enrichment in the water column contribute to an increase in primary production? Will nutrient enrichment in the water column contribute to changes in plankton community structure?
Have nutrient concentrations changed in the water near the outfall; have they changed at farfield stations in Massachusetts Bay or Cape Cod Bay, and, if so, are they correlated with changes in the nearfield?
Has the phytoplankton biomass changed in the vicinity of the outfall or at selected farfield stations in Massachusetts Bay or Cape Cod Bay, and, if so, can changes be correlated with effluent or ambient water nutrient concentrations, or can farfield changes be correlated with nearfield changes?
Have the phytoplankton production rates changed in the vicinity of the outfall or at selected farfield stations, and, if so, can these changes be correlated with effluent or ambient water nutrient concentrations, or can farfield changes be correlated with nearfield changes?
Has the abundance of nuisance or noxious phytoplankton species changed in the vicinity of the outfall?
Has the species composition of phytoplankton or zooplankton changed in the vicinity of the outfall or at selected farfield stations in Massachusetts Bay or Cape Cod Bay? If so, can these changes be correlated with effluent or ambient water nutrient concentrations, or can farfield changes be correlated with nearfield changes?
Will increased water-column and benthic respiration contribute to depressed oxygen levels in the water?
Do the concentrations (or percent saturation) of dissolved oxygen in the vicinity of the outfall and at selected farfield stations meet the state water quality standard?
Have the concentrations (or percent saturation) of dissolved oxygen in the vicinity of the outfall or at selected farfield stations in Massachusetts Bay or Cape Cod Bay changed relative to pre-discharge baseline or a reference area? If so, can changes correlated with effluent or ambient water nutrient concentrations, or can farfield changes be correlated with nearfield changes?
Is it safe to swim? Will pathogens in the effluent be transported to waters near swimming beaches, contributing to human health problems?
Are pathogens transported to beaches at levels that might affect swimmer health? Are aesthetics being maintained? Will changes in water clarity and/or color result from the direct input of effluent particles or other colored constituents, or indirectly through nutrient stimulation of nuisance plankton species? Will the loading of floatable debris increase, contributing to visible degradation?
Has the clarity and/or color of the water around the outfall changed? Has the amount of floatable debris around the outfall changed?
Information on transport and fate necessary to answer all the questions Are model estimates of short-term (less than 1 day) effluent dilution and transport
accurate? What are the nearfield and farfield water circulation patterns? What is the farfield fate of dissolved, conservative, or long-lived effluent constituents?

OUTFALL MONITORING OVERVIEW BACKGROUND 25
Alexandrium fundyense blooms are known in New England as red tides. They produce a toxin, which when sufficiently concentrated by shellfish that take up the algae, causes paralytic shellfish poisoning (PSP), a condition that can be fatal to marine mammals, fish, and humans. At high concentrations (more than 1 million cells per liter), some diatoms in the genus Pseudo-nitzschia may produce sufficient quantities of toxic domoic acid to cause a condition known as amnesic shellfish poisoning, which is marked by gastrointestinal and neurological symptoms, including dementia. Phaeocystis pouchetii is not toxic, but individual cells can aggregate in gelatinous colonies that may be aesthetically displeasing or provide poor food for zooplankton. Dissolved oxygen concentrations in bottom waters naturally decrease during the stratified period as part of the natural seasonal pattern. If discharged nutrients were to stimulate large phytoplankton blooms, the conditions could lead to lower levels of dissolved oxygen when the cells sink to the bottom and decay. Because of the concern that lowered levels of dissolved oxygen could affect animals in the vicinity of the outfall, it was important during the baseline-monitoring period to develop an understanding of the natural fluctuations of oxygen levels within the system. Modeling and measurements showed that the typical periods of low oxygen concentrations in bottom waters correlate with warmer and saltier bottom waters. Ongoing monitoring assesses potential departures from the natural conditions.
Monitoring Design Water-column monitoring includes assessments of water quality, phytoplankton, and zooplankton in Massachusetts and Cape Cod bays. Regular monitoring includes four components: nearfield surveys, farfield surveys, continuous recording, and remote sensing (Table 3-2). Plume-tracking studies, conducted in 2001, qualitatively verified the expected dilution at the outfall and confirmed predictions that bacteria and toxic contaminant concentrations in the discharged effluent are very low.

OUTFALL MONITORING OVERVIEW BACKGROUND 26
Table 3-2. Components of water-column monitoring.
Task Objective
Nearfield surveys Collect water quality data near the outfall
Farfield surveys Collect water quality data throughout Massachusetts and Cape Cod bays
Moorings Provide continuous oceanographic data near outfall location
Remote sensing Provides oceanographic data on a regional scale through satellite imagery
Nearfield surveys provide vertical and horizontal profiles of physical, chemical, and biological characteristics of the water column in the area around the outfall, where some effects of the effluent were expected and have been observed. Farfield surveys assess differences across the bays and seasonal changes over a large area. Several farfield stations mark the boundary of the monitoring area and are in or near the Stellwagen Bank National Marine Sanctuary. Two of those stations denote the “northern boundary,” representing water entering Massachusetts Bay from the Gulf of Maine. Other stations are in Boston Harbor, coastal and offshore regions, and in Cape Cod Bay (Figures 3-2, 3-3, and 3-4). Since 2004, typically, twelve surveys of seven nearfield stations and six surveys of 25 farfield stations are conducted each year. Parameters measured in the water column include dissolved inorganic and organic nutrients, particulate forms of nutrients, chlorophyll, total suspended solids, dissolved oxygen, productivity, respiration, phytoplankton abundance and species composition, and zooplankton abundance and species composition (Tables 3-3 and 3-4). Nutrients measured include the major forms of nitrogen, phosphorus, and silica. The measurements focus on the dissolved inorganic forms, which are most readily used by phytoplankton. The surveys also include observations and net tows in the outfall area to assess the presence of floatable debris. The continuous recording components of the program capture temporal variations in water quality between nearfield surveys. Remote sensing by satellite captures spatial variations in water quality on a larger, regional scale.

OUTFALL MONITORING OVERVIEW BACKGROUND 27
F33
F32
F19
F18
F17F16
F15F14
F12
F10
F07
F05
N20
N10N07
N01
F29
F28
F03
F23
F22
F13
F06
N18
N16
N04
F31
F30
F27
F26
F25
F24
F02
F01
70°15'W
70°15'W
70°30'W
70°30'W
70°45'W
70°45'W
71°0'W
71°0'W42
°30'
N
42°3
0'N
42°1
5'N
42°1
5'N
42°0
'N
42°0
'N
41°4
5'N
41°4
5'N
F33
F32
F19
F18
F17F16
F15F14
F12
F10
F07
F05
N20
N10N07
N01
F29
F28
F03
F23
F22
F13
F06
N18
N16
N04
F31
F30
F27
F26
F25
F24
F02
F01
70°15'W
70°15'W
70°30'W
70°30'W
70°45'W
70°45'W
71°0'W
71°0'W42
°30'
N
42°3
0'N
42°1
5'N
42°1
5'N
42°0
'N
42°0
'N
41°4
5'N
41°4
5'N
Cape Cod Bay
BostonHarbor Massachusetts Bay
0 10 20 30 40 505Kilometers
boundary region
northern boundary region
offshore region
coastal region
nearfield region
MWRA stations (BWQM)GoMOOS Buoy ANOAA Buoy 44013MWRA outfall diffuser
RegionsStellwagen Bank SanctuaryHigh : 0
Low : -125
Figure 3-2. MWRA Bay Water Quality Monitoring (BWQM) stations and regional groupings included in the program. “Farfield” stations include all stations in Boston Harbor; the coastal, offshore, and northern boundary regions; and Cape Cod Bay. Also shown are the MWRA outfall; two instrumented buoys, one operated by the Gulf of Maine Ocean Observing System (GoMOOS) and the other by the National Oceanic and Atmospheric Administration (NOAA) National Data Buoy Center (NDBC); and the Stellwagen Bank Marine Sanctuary.

OUTFALL MONITORING OVERVIEW BACKGROUND 28
F33
F32
F23
F22
F13
F06
N18
N16
N04
F31
F30
F27
F26
F25
F24
F02
F01
70°15'W
70°15'W
70°30'W
70°30'W
70°45'W
70°45'W
71°0'W
71°0'W
42°3
0'N
42°3
0'N
42°1
5'N
42°1
5'N
42°0
'N
42°0
'N
41°4
5'N
41°4
5'N
F33
F32
F23
F22
F13
F06
N18
N16
N04
F31
F30
F27
F26
F25
F24
F02
F01
70°15'W
70°15'W
70°30'W
70°30'W
70°45'W
70°45'W71°0'W
71°0'W
42°3
0'N
42°3
0'N
42°1
5'N
42°1
5'N
42°0
'N
42°0
'N
41°4
5'N
northern boundary region
41°4
5'N
Cape Cod Bay
BostonHarbor Massachusetts Baycoastal region
offshore region
nearfield region
Phytoplankton and zooplankton stationZooplankton-only stationGoMOOS Buoy ANOAA Buoy 44013MWRA outfall diffuser
RegionsHigh : 0
0 10 20 30 40 505Kilometers
Low : -125
Figure 3-3. MWRA plankton stations included in water-column monitoring. The stations are a subset of those monitored for water quality. Regional groupings, the instrumented buoys, and the MWRA outfall are also shown.

OUTFALL MONITORING OVERVIEW BACKGROUND 29
F23
F13
N18
N16
N04
F31
F30F25
F24
142
141140
139
138
124
106
77
24
70°45'W
70°45'W
71°0'W
71°0'W
42°1
5'N
42°1
5'N
F23
F13
N18
N16
N04
F31
F30F25
F24
142
141140
139
138
124
106
77
24
70°45'W
70°45'W71°0'W
71°0'W
42°1
5'N
42°1
5'N
BostonHarbor
MassachusettsBay
0 10 205Kilometers
Harbor station (BHWQM)
Plankton station
NOAA Buoy 44013
MWRA outfall diffuserHigh : 0
Low : -50
Figure 3-4. MWRA Boston Harbor Water Quality Monitoring (BHWQM) stations and nearby BWQM plankton stations. Primary productivity is measured at Stations F23, N18, and N04.

OUTFALL MONITORING OVERVIEW BACKGROUND 30
Table 3-3. Nearfield water-column monitoring parameters. Parameter Measurement Details Temperature Salinity Dissolved oxygen Chlorophyll fluorescence Transmissometry Irradiance Depth of sensors
In-situ sensor measurements Boat surveys of seven stations Every half meter depth
Ammonium Nitrate Nitrite Phosphate Silicate
Inorganic nutrients sampling Seven stations Five depths
Dissolved inorganic carbon Dissolved nitrogen Dissolved phosphorus Particulate carbon Particulate nitrogen Particulate phosphorus Particulate biogenic silica Total suspended solids
Additional nutrients sampling Seven stations Three depths
Primary productivity Respiration Phytoplankton Zooplankton
Rates and plankton sampling Two stations Variable depths
Floatables Net tows Table 3-4. Farfield water-column monitoring parameters. Parameter Measurement Details Temperature Salinity Dissolved oxygen Chlorophyll fluorescence Transmissometry Irradiance Depth of sensors
In-situ sensor measurements Boat surveys of 25 stations Every half meter depth
Ammonium Nitrate Nitrite Phosphate Silicate
Inorganic nutrients sampling 23 stations at five depths Two shallow stations at three depths
Dissolved inorganic carbon Dissolved nitrogen Dissolved phosphorus Particulate carbon Particulate nitrogen Particulate phosphorus Particulate biogenic silica Total suspended solids Phytoplankton Zooplankton
Additional nutrients and plankton sampling Ten stations Variable depths
Primary productivity
Rates sampling One station Five depths
Respiration Rates sampling Two stations Three depths

OUTFALL MONITORING OVERVIEW BACKGROUND 31
Contingency Plan Thresholds Threshold parameters for water-column monitoring include minimum dissolved oxygen concentrations and percent saturation in nearfield and Stellwagen Bank bottom waters, dissolved oxygen depletion rate in nearfield bottom waters, chlorophyll levels, abundance of nuisance algal species, geographic extent of PSP toxin, and initial dilution (Table 3-5). Oxygen concentrations and percent saturation are compared to background levels rather than to the caution and warning levels.
Table 3-5. Contingency Plan threshold values for water-column monitoring. Location/ Parameter
Specific Parameter Baseline Caution Level Warning Level
Dissolved oxygen concentration
Background 5th percentile 5.75 mg/L
Lower than 6.5 mg/L for any survey (June-October) unless background conditions are lower
Lower than 6.0 mg/L for any survey (June-October) unless background conditions are lower Bottom water
nearfield
Dissolved oxygen percent saturation
Background 5th percentile 64.3%
Lower than 80% for any survey (June-October) unless background conditions are lower
Lower than 75% for any survey (June-October) unless background conditions are lower
Dissolved oxygen concentration
Background 5th percentile 6.2 mg/L
6.5 mg/L for any survey (June-October) unless background conditions lower
Lower than 6.0 mg/L for any survey (June-October) unless background conditions are lower Bottom water
Stellwagen Basin
Dissolved oxygen percent saturation
Background 5th percentile 66.3%
Lower than 80% for any survey (June-October) unless background conditions
Lower than 75% for any survey (June-October) unless background conditions are lower
Bottom water nearfield
DO depletion rate (June-October) 0.024 mg/L/day 0.037 mg/L/day 0.049 mg/L/day
Annual 79 mg/m2 118 mg/m2 158 mg/m2 Winter/spring 62 mgml2 238 mg/m2 None Summer 51 mg/m2 93 mg/m2 None
Chlorophyll nearfield
Autumn 97 mg/m2 212 mg/m2 None Winter/spring 468,000 cells/L 2,020,000 cells/L None Summer 72 cells/L 357 cells/L None
Nuisance algae nearfield Phaeocystis pouchetii Autumn 317 cells/L 2,540 cells/L None
Winter/spring 6,200 cells/L 21,000 cells/L None Summer 14,600 cells/L 43,100 cells/L None
Nuisance algae nearfield Pseudo-nitzschia Autumn 9,940 cells/L 24,700 cells/L None Nuisance algae nearfield Alexandrium fundyense
Any nearfield sample
Baseline maximum = 163 cells/L 100 cells/L None
Farfield PSP toxin extent Not applicable New incidence None
OUTFALL MONITORING OVERVIEW BACKGROUND 32
4. Sea Floor
Background
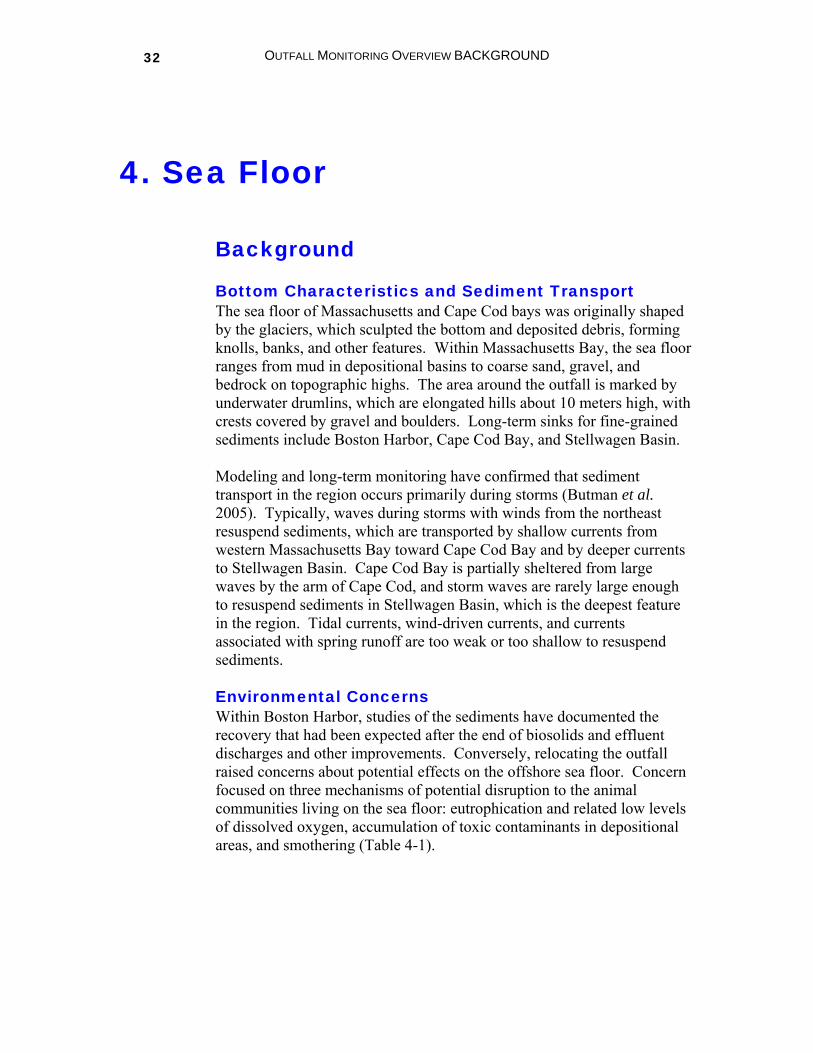
Bottom Characteristics and Sediment Transport The sea floor of Massachusetts and Cape Cod bays was originally shaped by the glaciers, which sculpted the bottom and deposited debris, forming knolls, banks, and other features. Within Massachusetts Bay, the sea floor ranges from mud in depositional basins to coarse sand, gravel, and bedrock on topographic highs. The area around the outfall is marked by underwater drumlins, which are elongated hills about 10 meters high, with crests covered by gravel and boulders. Long-term sinks for fine-grained sediments include Boston Harbor, Cape Cod Bay, and Stellwagen Basin. Modeling and long-term monitoring have confirmed that sediment transport in the region occurs primarily during storms (Butman et al. 2005). Typically, waves during storms with winds from the northeast resuspend sediments, which are transported by shallow currents from western Massachusetts Bay toward Cape Cod Bay and by deeper currents to Stellwagen Basin. Cape Cod Bay is partially sheltered from large waves by the arm of Cape Cod, and storm waves are rarely large enough to resuspend sediments in Stellwagen Basin, which is the deepest feature in the region. Tidal currents, wind-driven currents, and currents associated with spring runoff are too weak or too shallow to resuspend sediments.
Environmental Concerns Within Boston Harbor, studies of the sediments have documented the recovery that had been expected after the end of biosolids and effluent discharges and other improvements. Conversely, relocating the outfall raised concerns about potential effects on the offshore sea floor. Concern focused on three mechanisms of potential disruption to the animal communities living on the sea floor: eutrophication and related low levels of dissolved oxygen, accumulation of toxic contaminants in depositional areas, and smothering (Table 4-1).

OUTFALL MONITORING OVERVIEW BACKGROUND 33
Table 4-1. Monitoring questions developed by OTMF related to the sea floor. Are natural/living resources protected? Will benthic enrichment contribute to changes in community structure of soft-bottom and hard-bottom macrofauna, possibly affecting fisheries? Will benthic macrofauna near the outfall mixing zone be exposed to some contaminants, potentially contributing to changes in the community? Will the benthos near the outfall mixing zone and in depositional areas farther away accumulate some contaminants?
What is the level of sewage contamination and its spatial distribution in Massachusetts and Cape Cod bays sediments before discharge through the new outfall?
Has the level of sewage contamination or its spatial distribution in Massachusetts or Cape Cod bays sediments changed after discharge through the new outfall?
Have the concentrations of contaminants in sediments changed? Has the soft-bottom community changed? Are any benthic community changes correlated with changes in
levels of toxic contaminants (or sewage tracers) in sediments? Has the hard-bottomed community changed?
Will increased water-column and benthic respiration contribute to depressed oxygen levels in the sediment?
Have the sediments become more anoxic; that is, has the thickness of the sediment oxic layer decreased?
If diversion of the nutrient loads to offshore were to cause eutrophication, the depressed levels of dissolved oxygen that were also a concern in water-column monitoring could adversely affect bottom-dwelling animals. An increase in the amounts of particles and organic matter to the bottom could disrupt normal benthic community structure in the vicinity of the discharge. Although source control and treatment plant performance are designed to keep effluent contaminant concentrations too low to affect the sediments, the location of the outfall in an area of sediment transport caused concern about increased accumulation of toxic contaminants in Cape Cod Bay and Stellwagen Basin. Similarly, concentrations of particulate matter were expected to be low, but there remained some concern that bottom communities near the outfall could be affected by deposition.
Monitoring Design Sea-floor monitoring includes several components: measurements of sediment characteristics, sewage effluent tracers, and contaminant concentrations in sediments; sediment-profile imaging to provide a rapid assessment of benthic communities and sediment quality; studies of nearfield and farfield soft-bottom communities (sampling sites in Figures 4-1 and 4-2); and study of hard-bottom communities (sampling sites in Figure 4-3).

OUTFALL MONITORING OVERVIEW BACKGROUND 34
Figure 4-1. Locations of nearfield soft-bottom stations.

OUTFALL MONITORING OVERVIEW BACKGROUND 35
Figure 4-2. Locations of farfield soft-bottom stations.

OUTFALL MONITORING OVERVIEW BACKGROUND 36
Figure 4-3. Locations of hard-bottom stations.

OUTFALL MONITORING OVERVIEW BACKGROUND 37
Measurements of sediment characteristics, tracers, and contaminants include analyses of grain size, total organic carbon (TOC), Clostridium perfringens spores, PAHs, PCBs, chlorinated pesticides, and metals. Sediment-contaminant monitoring has been complemented by special studies, primarily in association with USGS (for example, Bothner and Butman 2007). Sediment-profile-image monitoring is conducted each August and results in area-wide assessments of sediment quality and benthic community status. A sharp-edged prism is used to cut into sediment surfaces at each station; a camera mounted to the prism records images of the sediment-water interface and the surface-sediment profiles. At each station, the camera is lowered to the sea floor three or four times, and a series of two to four replicate images is taken, generally within the first 12 seconds after bottom contact. A video feed allows real-time monitoring and ensures that adequate still photographs are obtained. The sediment-profile images provide more rapid assessments of benthic habitat conditions than is possible from traditional faunal analyses. The images are used to measure a number of parameters, including the apparent reduction-oxidation (redox) potential discontinuity (RPD) depth, apparent successional stage of the community, and an organism sediment index which is derived from the RPD depth and the succession stage. Monitoring the soft-bottom benthic infauna also includes annual sampling surveys conducted in August. Samples are collected with a 0.04-m2
Young-Van Veen benthic grab, sieved on 300-μm mesh, and fixed in formalin in the field, then transferred to alcohol and stained with Rose Bengal in the laboratory. Animals are sorted, identified, and counted. Most pollutant-effect monitoring studies of benthic communities, including the MWRA monitoring program, focus on the soft-bottom areas with finer-grained sediments, but such depositional areas are few in the vicinity of the outfall. Therefore, MWRA also conducts video and photographic surveys of the hard-bottom habitats found on the tops and flanks of drumlins in western Massachusetts Bay. Video and still photographs are taken at a series of stations or waypoints, including diffuser head #44 of the outfall (which was not opened) and diffuser head #2 (which is active). These annual surveys are conducted in June. Photographs are examined for substrate type (top or flank of the drumlin, with relief defined by presence of boulders and cobbles), amount of sediment drape (the degree to which a layer of fine material covers the hard surface), and biota (taxa identified to species or species groups and counted).

OUTFALL MONITORING OVERVIEW BACKGROUND 38
Beginning in 2003 and 2004, the existing 23 nearfield and 8 farfield soft-bottom stations were split into two subgroups. This division was made randomly after accounting for regional representation and level of replication, with two stations (NF12 and NF17, which are also sampled by USGS) being included in both groups. The program includes the following:
• Sediment characteristics and tracers, such as TOC, sediment grain size, and Clostridium perfringens spore counts, are measured in samples from one subset in alternate years, such that each station is sampled at least once every two years.
• Chemical constituents, including PAHs, PCBs, pesticides, and metals, are measured annually in samples from the two stations included in both groups and once every three years in samples from stations being sampled for other parameters, with those measurements most recently occurring in 2005.
• Sediment-profile images continue to be taken at all 23 nearfield soft-bottom stations each year.
• Benthic infauna is studied at the same stations as are sampled for sediment characteristics. Species composition and abundance are assessed for all stations sampled.
• Hard-bottom monitoring continues to be conducted annually, except that two stations were discontinued and two stations were added in 2003.
Contingency Plan Thresholds The Contingency Plan sets caution levels for RPD depth and benthic community parameters and warning levels for toxic contaminants in sediments (Figure 4-2). Because different stations are sampled in even and odd years, benthic-diversity parameters have separate Contingency Plan caution levels for those subsets of stations. Caution and warning levels exist for benthic opportunists, which are species that could be indicative of pollution.

OUTFALL MONITORING OVERVIEW BACKGROUND 39
Table 4-2. Contingency Plan threshold values for sea-floor monitoring.
Location Parameter Caution Level Warning Level Sediments, nearfield RPD depth 1.18 cm None
Acenaphthene None 500 ppb dry Acenaphylene None 640 ppb dry Anthracene None 1100 ppb dry Benzo(a)anthracene None 1600 ppb dry Benzo(a)pyrene None 1600 ppb dry Cadmium None 9.6 ppm dry Chromium None 370 ppm dry Chrysene None 2800 ppb dry Copper None 270 ppm dry Dibenzo(a,h)anthracene None 260 ppb dry Fluoranthene None 5100 ppb dry Fluorene None 540 ppb dry Lead None 218 ppm dry Mercury None 0.71 ppm dry Naphthalene None 2100 ppb dry Nickel None 51.6 ppb dry p,p’-DDE None 27 ppm dry Phenanthrene None 1500 ppb dry Pyrene None 2600 ppb dry Silver None 3.7 ppm dry Total DDTs None 46.1 ppb dry Total HMW PAH None 9600 ppb dry Total LMW PAH None 3160 ppb dry Total PAHs None 44792 ppb dry Total PCBs None 180 ppb dry
Sediment toxic contaminants, nearfield
Zinc None 410 ppm dry Species per sample <48.41 or >82.00 None Fisher’s log-series alpha <9.99 or >16.47 None Shannon diversity <3.37 or >4.14 None
Even years: benthic diversity, nearfield Pielou’s evenness <0.58 or >0.68 None
Species per sample <46.52 or >79.95 None Fisher’s log-series alpha <9.95 or >15.17 None Shannon diversity <3.30 or >3.91 None
Odd years: benthic diversity, nearfield Pielou’s evenness <0.56 or >0.66 None Benthic opportunists Percent opportunists >10% >25%

OUTFALL MONITORING OVERVIEW BACKGROUND 40
5. Fish and Shellfish
Background MWRA monitors fish and shellfish because of concerns for public health and because some fish and shellfish species are good indicators of effects of pollutants on overall marine health (Table 5-1). The fish and shellfish industry is an important part of the regional identity and economy of Massachusetts. Table 5-1. Monitoring questions developed by OTMF related to fish and shellfish. Is it safe to eat fish and shellfish? Will toxic chemicals accumulate in the edible tissues of fish and shellfish, and thereby contribute to human health problems?
Has the level of contaminants in the tissues of fish and shellfish around the outfall changed since discharge began?
Do the levels of contaminants in the edible tissue of fish and shellfish around the outfall represent a risk to human health?
Are the contaminant levels in fish and shellfish different between outfall, Boston Harbor, and a reference site?
Are natural/living resources protected? Will fish and shellfish that live near or migrate by the diffuser be exposed to elevated levels of some contaminants, potentially contributing to adverse health in some populations?
Has the level of contaminants in the tissues of fish and shellfish around the outfall changed since discharge began?
Are the contaminant levels in fish and shellfish different between the outfall, Boston Harbor, and a reference site?
Are the contaminant levels in fish and shellfish different between outfall, Boston Harbor, and a reference site?
Has the incidence of disease and/or abnormalities in fish or shellfish changed?
The two main concerns for fish and shellfish were that the discharge of sewage effluent into the relatively clean waters of Massachusetts Bay could result in chemical contamination of the fisheries and that contaminants in the effluent could cause direct damage to health of the fishery stocks. Because many toxic contaminants adhere to particles, which settle, animals that live on the bottom, in contact with sediments and those that eat bottom-dwelling organisms were considered to be the most likely species to be affected. Exposure to contaminated sediments could result in fin erosion, disease, or other, subtler, abnormalities in flounder, lobster, or other bottom-dwelling animals. Shellfish that feed by filtering suspended matter from large volumes of water are also potential bioaccumulators of toxic contaminants. Consumption of filter-feeding

OUTFALL MONITORING OVERVIEW BACKGROUND 41
animals by predators could result in transferring contaminants up the food chain and ultimately to humans.
Monitoring Design The monitoring program focuses on three indicator species: winter flounder (Pseudopleuronectes americanus), lobster (Homarus americanus), and blue mussel (Mytilus edulis). Winter flounder and lobster are important resource species in the region. Like all flatfish, winter flounder live and feed on the bottom, often lying partially buried in the sediments. Lobsters live on a variety of surfaces within the region, including mud, sand, gravel, and rock outcrops. Blue mussels are also resource species. Like other filter feeders, mussels process large volumes of water and can concentrate toxic metals and organic compounds in their tissues. They can be readily maintained in fixed cages, so they are convenient monitoring tools. Flounder and lobster are sampled from Deer Island Flats, near the outfall site, and Cape Cod Bay (Figure 5-1). Flounder are also taken near Nantasket Beach and until 2005, at Broad Sound, just off the coast to the north of Deer Island. Mussels are deployed at the edge of the mixing zone, one kilometer south of the diffuser line, in Cape Cod Bay, at Deer Island Light, and in the Inner Harbor.
Winter Flounder Flounder are collected annually. Whole fish are examined for external lesions or other abnormalities, and flounder livers are examined to quantify disease, including three types of vacuolation (centrotubular (CHV), tubular, and focal, representing increasing severity), microphage aggregation, biliary-duct proliferation, and neoplasia or tumors. Vacuolation and neoplasia have been associated with chronic exposure to contaminants. Since 2004, chemical analyses for flounder are completed every third year, including 2006, to determine tissue burdens and to evaluate whether contaminant burdens approach human health consumption limits. Chemical analyses (Table 5-2) of composite samples of fillets and livers include PCBs, pesticides, mercury, and lipids. Liver samples are also analyzed for PAHs, lead, silver, cadmium, chromium, copper, nickel, and zinc.
Lobster Commercial lobstermen collect lobsters for the monitoring program. Since 2004, lobsters have been studied every third year, including 2006. All lobsters are examined for external conditions, and chemical analyses are performed on composite samples. Meat (from the tail and claw) and hepatopancreas are analyzed for lipids, PCBs, pesticides, and mercury.

OUTFALL MONITORING OVERVIEW BACKGROUND 42
Hepatopancreas samples are also analyzed for PAHs, lead, silver, cadmium, chromium, copper, nickel, and zinc.
Figure 5-1. Sampling areas and reference sites for fish-and-shellfish monitoring.

OUTFALL MONITORING OVERVIEW BACKGROUND 43
Blue Mussel Mussels are collected from clean reference sites (which have included Rockport, Gloucester, and Sandwich, Massachusetts, and Stover’s Point, Maine; see Figure 5-1). They are placed in cages and deployed in replicate arrays. Since 2004, mussel deployments and analyses have been carried out every third year, including 2006. After a minimum deployment of 40 days or a preferred deployment of 60 days, chemical analyses are performed on composite samples of mussel tissue. Tissues are analyzed for PCBs, pesticides, PAHs, lipids, mercury, and lead. Table 5-2. Chemical analyses of fish and shellfish. Parameter Measurement Details Flounder fillet Mercury PCBs Chlorinated pesticides Lipids
Three composites of fillets from five flounder
Flounder liver Trace metals PAHs PCBs Chlorinated pesticides Lipids
Three composites of livers from five flounder
Lobster meat Mercury PCBs Chlorinated pesticides Lipids
Three composites of meat from five lobsters
Lobster hepatopancreas Trace metals PAHs PCBs Chlorinated pesticides Lipids
Three composites of hepatopancreas from five lobsters
Mussel Mercury Lead PAHs PCBs Chlorinated pesticides Lipids
Six composites of soft tissue from ten mussels

OUTFALL MONITORING OVERVIEW BACKGROUND 44
Contingency Plan Thresholds Threshold parameters for fish and shellfish include levels of toxic contaminants in flounder, lobster, and mussels and liver disease (measured as CHV) in flounder (Table 5-3). Some thresholds are based on U.S. Food and Drug Administration limits for maximum concentrations of specific contaminants in edible portions of food. Others are based on the baseline monitoring.
Table 5-3. Contingency Plan threshold values for fish-and-shellfish monitoring.
Parameter Type/ Location
Parameter Baseline Caution Level
Warning Level
PCB 0.033 ppm 1 ppm wet weight
1.6 ppm wet weight Flounder
tissue nearfield Mercury 0.074 ppm 0.5 ppm wet
weight 0.8 ppm wet weight
Chlordane 242 ppb 484 ppb None Dieldrin 63.7 ppb 127 ppb None
Flounder tissue, lipid normalized, nearfield DDT 775.9 ppb 1552 ppb None
Flounder nearfield
Liver disease (CHV) 24.4% 44.9% None
PCB 0.015 ppm 1 ppm wet weight
1.6 ppm wet weight Lobster
tissue nearfield Mercury 0.148 ppm 0.5 ppm wet
weight 0.8 ppm wet weight
Chlordane 75 ppb 150 ppb None Dieldrin 161 ppb 322 ppb None
Lobster tissue, lipid normalized, nearfield DDT 341.3 ppb 683 ppb None
PCB 0.011 ppm 1 ppm wet weight
1.6 ppm wet weight
Lead 0.415 ppm 2 ppm wet weight
3 ppm wet weight
Mussel tissue nearfield
Mercury 0.019 ppm 0.5 ppm wet weight
0.8 ppm wet weight
Chlordane 102.3 ppb 205 ppb None Dieldrin 25 ppb 50 ppb None DDT 241.7 ppb 483 ppb None
Mussel tissue, lipid normalized, nearfield PAH 1080 ppb 2160 ppb None

OUTFALL MONITORING OVERVIEW BACKGROUND 45
6. Special Studies
Background Besides monitoring the effluent and the water column, sea floor, and fish and shellfish in Massachusetts Bay and the surrounding area, MWRA conducts special studies in response to specific permit requirements, scientific questions, and public concerns. Some studies have been reported during each year of the monitoring program. For example, studies of nutrient flux at the sediment-water interface have been conducted each year in response to a concern that increased loads of organic matter might enhance benthic respiration and nutrient fluxes between the sediments and the water column in the nearfield. The resulting higher rates of benthic respiration or sediment oxygen demand might lead to lower levels of oxygen in both the sediments and the water column. Since 1995, MWRA has included endangered species observers on monitoring surveys. Besides providing observational data, the presence of trained marine mammal observers addresses a request by the National Marine Fisheries Service that MWRA take active steps to minimize the chances of a collision of one of its survey vessels with a right whale. A major special study carried out by the US Geological Survey began in 1989 and was completed in 2007. This cooperative research project investigated processes influencing the transport and fate of contaminated sediments in Boston Harbor and Massachusetts Bay (Bothner and Butman 2007). Other special studies have included reviews of nutrient and toxic-contaminant issues, additional analyses of the effluent, evaluations of the Bays Eutrophication Model, floatables monitoring, and red-tide monitoring and analyses.

OUTFALL MONITORING OVERVIEW BACKGROUND 46
7. Stellwagen Bank National Marine Sanctuary
Background The Gerry E. Studds Stellwagen Bank National Marine Sanctuary comprises 842 square miles located at the boundary between Massachusetts Bay and the rest of the Gulf of Maine. Its landward boundaries lie approximately 25 miles east of Boston, three miles north of Provincetown, and three miles south of Gloucester. Stellwagen Basin, which is partially within the sanctuary, is the deepest part of Massachusetts Bay and a long-term sink for fine-grained sediments. Stellwagen Bank, a sand-and-gravel plateau, lies to the east of Stellwagen Basin and has water depths of about 65 feet. Tidal mixing of nutrients throughout the relatively shallow water column creates a rich habitat for marine life on Stellwagen Bank. The most prominent pressures on the sanctuary according to a condition report released in 2007 (available at http://sanctuaries.noaa.gov), are shipping; discharges from the MWRA outfall and dumping at the dredged material disposal site located adjacent to the sanctuary boundary; a fiber-optic cable laid across the sanctuary; the likelihood of development of a deepwater port approximately two miles west of the sanctuary for off-loading of liquefied natural gas; noise pollution that adversely affects marine mammals; commercial fishing; commercial whale watching; recreational fishing and boating; and climate change. The National Centers for Coastal Ocean Science (NCCOS) has published an ecological characterization report for the sanctuary (NCCOS 2006; available at http://ccma.nos.noaa.gov/products/biogeography/stellwagen). The report describes the physical and oceanographic setting, chemical contaminants, fishes, seabirds, and mammals in the sanctuary and the Gulf of Maine. The report finds that there has been no indication that the relocation of the MWRA outfall to Massachusetts Bay has exerted any effect on the magnitude of contaminants reaching the sanctuary. Although these positive findings were anticipated, MWRA’s discharge permit requires an annual assessment of possible outfall effects.

OUTFALL MONITORING OVERVIEW BACKGROUND 47
Monitoring Design MWRA’s regular water-column and sea-floor monitoring efforts include stations within and near the sanctuary. Five water-column stations, including four within the sanctuary and one just outside its northern border, are considered “northern boundary” or “boundary” stations, because they mark the boundary between Massachusetts Bay and the rest of the Gulf of Maine. These stations are important to MWRA, not just because of their location within a marine sanctuary, but also because water-column processes within Massachusetts Bay are largely driven by the regional processes in the Gulf of Maine. Eight water-column stations located between the sanctuary and the coast are considered “offshore” stations by the MWRA program. The revisions to the water-column portion of the monitoring program implemented in 2004 did not change the stations sampled within and in the vicinity of the sanctuary. During 2001–2006, the sanctuary managers, in conjunction with MWRA’s contractor Battelle, conducted a supplemental water-quality monitoring program which added four stations to the August and October MWRA surveys (Figure 7-1). These sites were selected to provide a more comprehensive evaluation of water quality across the sanctuary. Two MWRA sea-floor stations are within the sanctuary, one at the southern boundary and one within Stellwagen Basin (FF04 and FF05, Figure 7-2). A third sea-floor station (FF11) is just north of the sanctuary boundary and a fourth station (FF14) is located outside the sanctuary, but within Stellwagen Basin. These four stations are the deepest of those included in the MWRA monitoring program and have similar properties, with muddy sediments and moderate concentrations of total organic carbon. The stations are east or northeast of the outfall, outside the general circulation pattern that transports diluted effluent south and southeastward in Massachusetts Bay. During 1992–2003, these stations were sampled annually in August. Changes to the benthic monitoring program implemented in 2004 call for sampling approximately half the stations each year.

OUTFALL MONITORING OVERVIEW BACKGROUND 48
Figure 7-1. MWRA and supplemental water-column stations in and near the Stellwagen Bank National Marine Sanctuary. MWRA stations within the sanctuary are F27, F28, F12. Supplemental stations are indicated by ∗.

OUTFALL MONITORING OVERVIEW BACKGROUND 49
Figure 7-2. Farfield benthic stations.

OUTFALL MONITORING OVERVIEW BACKGROUND 50
References Beardsley RC, Butman B, Geyer WR, Smith P. 1997. Physical oceanography of the Gulf of Maine: an update. In: Wallace G, Braasch E, editors. Proceedings of the Gulf of Maine ecosystem dynamics: a scientific symposium and workshop. RARGOM. 352p. Bothner MH, Butman B. (editors) 2007. Processes influencing the transport and fate of contaminated sediments in the coastal ocean—Boston Harbor and Massachusetts Bay. Woods Hole: U.S. Geological Survey Open-File Report 2007-1302. Butman B, Warner JC, Bothner MH, Alexander PS. 2005. Section 6: predicting the transport and fate of sediments caused by northeast storms. In Bothner MH, Butman B. (editors) 2005. Processes influencing the transport and fate of contaminated sediments in the coastal ocean—Boston Harbor and Massachusetts Bay. Woods Hole: U.S. Geological Survey Open-File Report 2005-1250. EPA. 1988. Boston Harbor Wastewater Conveyance System. Supplemental Environmental Impact Statement (SEIS). Boston: Environmental Protection Agency Region 1. Galya DP, Bleiler J, Hickey K. 1996. Outfall monitoring overview report: 1994. Boston: Massachusetts Water Resources Authority. Report ENQUAD 1996-04. 50p. Galya DP, Zavistoski R, Williams I, Connor MS, Mickelson M, Keay K, Hall M, Cibik S, Sung W, Mitchell D, Blake J, Lieberman J, Wolf S, Hilbig B, Bleiler J, Hickey K, 1997a. Outfall monitoring overview report: 1995. Boston: Massachusetts Water Resources Authority. Report ENQUAD 1997-02. 61p. Galya DP, Zavistoski R, Maciolek N, Sung W, Cibik S, Mitchell D, Connor MS, Mickelson M, Keay K, Hall M, Blake J, Sullivan K, Hickey K. 1997b. Outfall monitoring overview report: 1996. Boston: Massachusetts Water Resources Authority. Report ENQUAD 1997-08. 57p. Geyer W, Gardner GB, Brown W, Irish J, Butman B, Loder T, Signell RP. 1992. Physical oceanographic investigation of Massachusetts and Cape Cod bays. Technical report MBP-92-03. Massachusetts Bays Program. U.S. EPA Region I/Massachusetts Coastal Zone Management Office, Boston Massachusetts. 497p.

OUTFALL MONITORING OVERVIEW BACKGROUND 51
Jiang M, Zhou M. 2006. The Massachusetts and Cape Cod bays hydrodynamic model: 2002-2004 simulation. Boston: Massachusetts Water Resources Authority. Report ENQUAD 2006-12. 128p. Leo WS, Rex AC, Carroll SR, Connor MS. 1995. The state of Boston Harbor 1994: connecting the harbor to its watersheds. Boston: Massachusetts Water Resources Authority. Report ENQUAD 1995-12. 37p. Lermusiaux PFJ. 2001. Evolving the subspace of the three-dimensional multiscale ocean variability: Massachusetts Bay. J. Marine Systems, special issue on “Three-dimensional ocean circulation: Langrangian measurements and diagnostic analyses.” 29/1-4: 385-422. MWRA. 1991. Massachusetts Water Resources Authority effluent outfall monitoring plan: Phase I baseline studies. Boston: Massachusetts Water Resources Authority. Report ENQUAD ms-02. 95p. MWRA. 1997a. Massachusetts Water Resources Authority effluent outfall monitoring plan: Phase II post discharge monitoring. Boston: Massachusetts Water Resources Authority. Report ENQUAD ms-44. 61p. MWRA. 1997b. Massachusetts Water Resources Authority Contingency Plan. Boston: Massachusetts Water Resources Authority. Report ENQUAD ms-069. 41p. MWRA. 2001. Massachusetts Water Resources Authority Contingency Plan revision 1. Boston: Massachusetts Water Resources Authority. Report ENQUAD ms-071. 47 p. MWRA. 2004. Massachusetts Water Resources Authority effluent outfall ambient monitoring plan Revision 1, March 2004. Boston: Massachusetts Water Resources Authority. Report ENQUAD ms-092. 65p. NCCOS. 2006. An ecological characterization of the Stellwagen Bank National Marine Sanctuary Region: oceanographic, biogeographic, and contaminants assessment. Prepared by NCCOS’s Biogeography Team in cooperation with the National Marine Sanctuary Program. Silver Spring, MD. NOAA Technical Memorandum NOS NCCOS 45. 356p. Pawlowski C, Keay KE, Graham E, Taylor DI, Rex AC, Connor MS. 1996 The state of Boston Harbor 1995: the new treatment plant makes its mark. Boston: Massachusetts Water Resources Authority. Report ENQUAD 1996-06. 22p.

OUTFALL MONITORING OVERVIEW BACKGROUND 52
Rex AC, Connor MS. 1997. The state of Boston Harbor 1996: questions and answers about the new outfall. Boston: Massachusetts Water Resources Authority. Report ENQUAD 1997-05. 32p. Rex AC. 2000. The state of Boston Harbor 1997-1998: beyond the Boston Harbor project. Boston: Massachusetts Water Resources Authority. Report ENQUAD 2000-05. 24p. Rex AC, Wu D, Coughlin K, Hall M, Keay KE, Taylor DI. 2002. The state of Boston Harbor: mapping the harbor’s recovery. Boston: Massachusetts Water Resources Authority. Report ENQUAD 2002-09. 42p. Taylor DI. 2002. Water quality improvements in Boston Harbor during the first year after offshore transfer of Deer Island flows. Boston: Massachusetts Water Resources Authority. Report ENQUAD 2002-04. 61p. Taylor DI. 2003. 24 months after “offshore transfer”: an update of water quality improvements in Boston Harbor. Boston: Massachusetts Water Resources Authority. Report ENQUAD 2003-04. 94p. Taylor DI. 2004. Harbor-bay eutrophication-related water chemistry changes after ‘offshore transfer.’ Boston: Massachusetts Water Resources Authority. Report ENQUAD 2004-06. 44p. Taylor DI. 2005a. Relationships between eutrophication-related water-quality, and changes to wastewater loadings to Boston Harbor. Boston: Massachusetts Water Resources Authority. Report ENQUAD 2005-21. 56p. Taylor DI. 2005b. Patterns of wastewater, river, and non-point source loadings to Boston Harbor, 1994 through 2003. Boston: Massachusetts Water Resources Authority. Report ENQUAD 2005-08. 52p. Taylor DI. 2006. 5 years after transfer of Deer Island flows offshore: an update of water-quality improvements in Boston Harbor. Boston: Massachusetts Water Resources Authority. Report ENQUAD 2006-16. 77p. Werme C, Hunt CD. 2000a. 1998 Outfall monitoring overview. Boston: Massachusetts Water Resources Authority. Report ENQUAD 2000-04. 66p.

OUTFALL MONITORING OVERVIEW BACKGROUND 53
Werme C, Hunt CD. 2000b. 1999 Outfall monitoring overview. Boston: Massachusetts Water Resources Authority. Report ENQUAD 2000-14. 72p. Werme C, Hunt CD. 2001. 2000 Outfall monitoring overview. Boston: Massachusetts Water Resources Authority. Report ENQUAD 2001-10. 92p. Werme C, Hunt CD. 2002. 2001 Outfall monitoring overview. Boston: Massachusetts Water Resources Authority. Report ENQUAD 2002-18. 84p. Werme C, Hunt CD. 2003. 2002 Outfall monitoring overview. Boston: Massachusetts Water Resources Authority. Report ENQUAD 2003-12. 80p. Werme C, Hunt CD. 2004. 2003 Outfall monitoring overview. Boston: Massachusetts Water Resources Authority. Report ENQUAD 2004-13. 97p. Werme C, Hunt CD. 2005. 2004 Outfall monitoring overview. Boston: Massachusetts Water Resources Authority. Report ENQUAD 2005-16. 88p. Werme C, Hunt CD. 2006. 2005 Outfall monitoring overview. Boston: Massachusetts Water Resources Authority. Report ENQUAD 2006-18. 105p. Werme C, Hunt CD. 2007. 2006 Outfall monitoring overview. Boston: Massachusetts Water Resources Authority. Report ENQUAD 2007-12. 95p.

OUTFALL MONITORING OVERVIEW BACKGROUND 54
List of Acronyms BHWQM Boston Harbor Water Quality Monitoring BOD Biochemical oxygen demand BWQM Bay Water Quality Monitoring cBOD Carbonaceous biochemical oxygen demand CHV Centrotubular hydropic vacuolation C-NOEC Chronic test, no observable effect concentration DDT Dichlorodiphenyltrichloroethane DITP Deer Island Treatment Plant DO Dissolved oxygen EPA U.S. Environmental Protection Agency FA Foul Area GoMOOS Gulf of Maine Ocean Observation System HMW High molecular weight IAAC Inter-agency Advisory Committee IWS Industrial Waste Site LC50 50% mortality concentration LMW Low molecular weight MADEP Massachusetts Department of Environmental Protection MBDS Massachusetts Bay Disposal Site MGD Million gallons per day MWRA Massachusetts Water Resources Authority NCCOS National Centers for Coastal Ocean Science NDBC National Data Buoy Center NOAA National Oceanic and Atmospheric Administration NOEC No observable effect concentration NPDES National Pollutant Discharge Elimination System OMSAP Outfall Monitoring Science Advisory Panel OMTF Outfall Monitoring Task Force PAH Polycyclic aromatic hydrocarbon PCB Polychlorinated biphenyl PIAC Public Interest Advisory Committee RPD Redox potential discontinuity PSP Paralytic shellfish poisoning SEIS Supplemental Environmental Impact Statement TOC Total organic carbon TRAC Toxic Reduction and Control Program TSS Total suspended solids USGS U.S. Geological Survey


Massachusetts Water Resources Authority Charlestown Navy Yard
100 First Avenue Boston, MA 02129
(617) 242-6000 http://www.mwra.com