
OUTDOOR RECREATION USE SURVEY OF SOUTH CAROLINA’S
195
OUTDOOR RECREATION USE SURVEY OF SOUTH CAROLINA’S JOCASSEE GORGES ____________________________________ A Thesis Presented to the Graduate School of Clemson University ____________________________________ In Partial Fulfillment of the Requirements for the Degree Master of Science Parks, Recreation, and Tourism Management _____________________________________ by Thomas Crum Warren May 2007 ______________________________________ Accepted by: Dr. William Hammitt, Committee Chair Dr. Brett Wright Dr. Lawrence Gering
Transcript of OUTDOOR RECREATION USE SURVEY OF SOUTH CAROLINA’S

i
OUTDOOR RECREATION USE SURVEY OF SOUTH CAROLINA’S JOCASSEE GORGES
____________________________________
A Thesis Presented to
the Graduate School of Clemson University
____________________________________
In Partial Fulfillment of the Requirements for the Degree
Master of Science Parks, Recreation, and Tourism Management
_____________________________________
by Thomas Crum Warren
May 2007
______________________________________
Accepted by: Dr. William Hammitt, Committee Chair
Dr. Brett Wright Dr. Lawrence Gering

ii
ABSTRACT
The Jocassee Gorges Natural Area is approximately 43,500 acres in size and is
primarily managed as a Wildlife Management Area by the South Carolina Department of
Natural Resources (SCDNR). The purpose of the Jocassee Gorges Outdoor Recreation
Use Survey was to conduct an empirical study of outdoor recreation activities,
participation rates, and resource uses of the Jocassee Gorges. Secondary objectives
which helped accomplish the purpose of the study included documenting and describing
the current use of on-site visitors, participation rates, and temporal and spatial distribution
patterns of use. The current and past use by local residents of the Jocassee Gorges’
boundaries were documented. Traffic use on roads managed by the SCDNR within the
Gorges was estimated using traffic counters.
On-site visitors were contacted while in the Jocassee Gorges and asked to
complete a survey concerning their use of the area. A total of 263 visitors were
contacted, of which 247 agreed to complete the survey, resulting in a participation rate of
94 percent. The on-site convenience sample was conducted during the spring, summer,
fall, and winter of 2005, involving approximately 575 hours of fieldwork.
The average on-site visitor of the Jocassee Gorges was 42 years old and was at
least a high school graduate. The average user had a professional type occupation and
lived with a family of four. The typical visitor was a resident of the state of South
Carolina, from a town or small city, and most often came from the town of Pickens or the
city of Greenville. South Carolina residents accounted for 78.5 percent of users, and 21.5
percent of visitors were non-residents.

iii
The average Jocassee Gorges user had been using the area for 10.5 years, and
usually came to the Gorges 17 times each year. The typical day user of the Gorges spent
four hours at the Gorges, and overnight visitors spent approximately two days within the
Gorges. The usual primary and secondary activities of Jocassee Gorges visitors were
either day hiking or fishing. Day hikers hiked eleven days each year; many times to find
waterfalls, and anglers spent over twenty-five days fishing each year in the Gorges.
Anglers fished the Eastatoee Creek most often and typically for 1-4 days each year.
Jocassee Gorges users entered the property most frequently through the Bad Creek access
(Musterground Road) and Horsepasture Road respectively.
During the telephone survey of local residents of the Jocassee Gorges,
respondents were randomly selected by random digit dialing from the six surrounding
counties of the study area. A total of 7,068 residents were contacted, of which 2,644
declined to participate, 3,676 were incomplete, and 748 residents were successfully
interviewed, resulting in a participation rate of approximately 22 percent. The telephone
survey of local residents was conducted during the spring of 2006.
The average local resident was 42 years old, and lived in a family of two. Over
one quarter of local residents had a bachelor’s degree from a college or university, and
most worked in a professional occupation and made $21,000-$40,000 total household
income during the previous year. Local residents usually lived in a city with a population
between 10,000 and 100,000. Residents were familiar with the area but not very
knowledgeable of its boundaries, and lived more than twenty miles from the nearest
boundary of the property.

iv
Among local residents successfully interviewed, 23.7 percent had used the
Jocassee Gorges in the past year for recreation. The average local resident user of the
Jocassee Gorges was a day hiker who hiked 1-4 days in the past year. They had usually
been using the area for 13-16 years, and used the Gorges 9-12 times each year. Local
resident users planned on using the Gorges 9-12 times during the next year.
The average local resident user of the Jocassee Gorges used Lake Jocassee
and the Whitewater River/Falls areas the most frequently. Local resident users visited the
Gorges most often during the summer months, and usually came to the area with family
or friends in groups of two. For about one-third of Jocassee Gorges’ users, recreation
participation in the Gorges had increased, however their recreation had remained about
the same since the SCDNR began managing the property.
Much of the literature demonstrated the importance of resource managers
having an in-depth understanding of who visits their park or wildland area, the visitors’
experience use history, and use patterns occurring within the resource (Manning, 1999;
Cole 2001; Douglass, 2000; and Hammitt, Backlund, & Bixler, 2004). Visitor use studies
conducted in wilderness and other areas in the southeastern United States (Burger, 2000;
Hammitt & Rutlin, 1995; and Cole, Watson, & Roggenbuck, 1995) reflected similar user
characteristics and use patterns as those documented at the Jocassee Gorges.

v
DEDICATION
I dedicate this thesis to my parents, Dr. and Mrs. Angus H. Warren. I would not have been able to complete this work without their love, patience, and support.

vi
ACKNOWLEDGMENTS
I would like to thank my advisor, Dr. Bill Hammitt, for all of his assistance and
guidance throughout this project. His continuous support and patience are greatly
appreciated. I would also like to thank my other committee members, Dr. Brett Wright
and Dr. Lawrence Gering. They were both actively supportive in helping in the
completion of this project. I would also like to extend my thanks to Dr. Robert Bixler for
recommending me for this study. Other PRTM staff I would like to thank are Tequilla
Stokes, Cindy Seaborn, and Karin Emmons for their unlimited help and assistance in all
matters.
I am grateful to Clemson University and the South Carolina Department of
Natural Resources (SCDNR) for funding this study, and I would like to thank Greg Lucas
of the SCDNR for his constant assistance and encouragement throughout the entire
course of this project. Last, I would like to thank Elizabeth Hill for her endless support
and encouragement. This work belongs to her as much as anyone else.

vii
TABLE OF CONTENTS Page
TITLE PAGE ......................................................................................................... i ABSTRACT ......................................................................................................... ii DEDICATION ........................................................................................................ v ACKNOWLEDGMENTS ...................................................................................... vi LIST OF TABLES .................................................................................................. x LIST OF FIGURES ................................................................................................ xv CHAPTER 1. INTRODUCTION ................................................................................ 1 Objectives ....................................................................................... 1 History of the Jocassee Gorges ....................................................... 2 2. LITERATURE REVIEW ..................................................................... 7 Importance of Visitor Characteristics ............................................. 7 Wilderness Concepts ....................................................................... 11 Visitor Management Preferences .................................................... 16 Wilderness Visitor Trends .............................................................. 19 Day and Overnight Use ................................................................... 23 3. METHODS ........................................................................................... 27 Part One : On-Site Users ...................................................................... 27 Physical Description of Study Area ................................................ 27 Sample Size ..................................................................................... 27 On-Site Survey ................................................................................ 28 Recreational Seasons ...................................................................... 34 Limitations of Study Methods ........................................................ 40 Part 2: Local Residents of the Jocassee Gorges ................................... 42 Sample Size ..................................................................................... 42 Telephone Survey ........................................................................... 43 Limitations of Study Methods ........................................................ 47

viii
Table of Contents (Continued)
Page
4. DESCRIPTIVE CHARACTERISTICS OF JOCASSEE GORGES USERS ....................................................... 49 Introduction ..................................................................................... 49 Jocassee Gorges Visitor Profile ...................................................... 50 User Profile Summary..................................................................... 54 Visitor Activities ............................................................................. 54 User Locations ................................................................................ 63 Use Area Summary ......................................................................... 65 5. DESCRIPTIVE CHARACTERISTICS OF LOCAL RESIDENTS OF THE JOCASSEE GORGES .................................................................... 67 Introduction ..................................................................................... 67 Profile of Local Residents of the Jocassee Gorges ........................................................................ 67 Resident Profile Summary .............................................................. 74 Visitor Activities ............................................................................. 74 User Locations ................................................................................ 80 Use Area Summary ......................................................................... 84 6. OPEN-ENDED QUESTION ANALYSIS ........................................... 86 Results ............................................................................................. 87 Summary ......................................................................................... 94 7. COMPARATIVE DATA ANALYSIS OF JOCASSEE GORGES USERS ....................................................... 96 Resident and Non-Resident Visitors ............................................... 96 Day and Overnight Users ................................................................ 99 Experience Use History of On-Site Visitors ................................... 103 Primary Use Areas of On-Site Visitors ........................................... 104 8. COMPARATIVE DATA ANALYSIS OF LOCAL RESIDENTS OF THE JOCASSEE GORGES ............................... 107 Experience Use History .................................................................. 107 Recreational Group Characteristics ................................................ 108 9. DISCUSSION ....................................................................................... 112 On-Site Visitors of the Jocassee Gorges ......................................... 112 Local Residents of the Jocassee Gorges ......................................... 118 Wilderness Visitor Characteristics .................................................. 121 Wilderness Visitor Trends .............................................................. 124 Management Implications ............................................................... 127
ix
Table of Contents (Continued) Page
10. CONCLUSION ..................................................................................... 132 Future Studies ................................................................................. 133 APPENDICES ........................................................................................................ 135 A. On-Site Visitor Survey .................................................................... 136 B. Visitor Contact Card ....................................................................... 140 C. Field Researchers’ Script ................................................................ 142 D. List of On-Site Survey Refusals ..................................................... 144 E. Mail-In Survey Script ..................................................................... 147 F. Mail-In Survey Roster..................................................................... 149 G. Road Counter Analysis ................................................................... 151 H. Telephone Survey ........................................................................... 162 I. Occupations of On-Site Users ......................................................... 168 J. SCDNR Map of the Jocassee Gorges ............................................. 171 K. SCDNR Map of Access Points to the Jocassee Gorges ........................................................................ 173 L. Zip Codes Used During Telephone Survey .................................... 175 LITERATURE CITED ........................................................................................... 177

x
LIST OF TABLES
Table Page 1. Figures of On-Site Intercept Survey by Access Area ........................... 38 2. Figures of On-Site Intercept Survey by Date ........................................ 38 3. Characteristics of Telephone Survey Sample by County ........................................................................................ 46 4. Characteristics of Incomplete Calls Made During Telephone Survey ........................................................................... 47 5. Age Distribution of Jocassee Gorges Visitors ...................................... 50 6. Education Levels of Jocassee Gorges Visitors ..................................... 51 7. Occupations of Jocassee Gorges Visitors ............................................. 52 8. Composition of Families Visiting the Jocassee Gorges ........................ 53 9. Size of Places of Residence and Distribution of Jocassee Gorges Visitors ............................................................................... 53 10. States of Residence and Most Common Places of Residence of Jocassee Gorges Visitors ........................................... 54 11. Length of Stay of Jocassee Gorges Day Visitors Measured in Hours .......................................................................... 55 12. Length of Stay of Jocassee Gorges Overnight Visitors Measured in Days ........................................................................... 55 13. Historical Use of Jocassee Gorges Visitors Measured in Years .......................................................................... 56 14. Number of Visits per Year to the Jocassee Gorges by Visitors .......................................................................... 57 15. Primary Activities of Jocassee Gorges Visitors .................................... 57 16. Secondary Activities of Jocassee Gorges Visitors ................................ 58
xi
List of Tables (Continued) Table Page 17. Number of Days of Activity Participation within Last Twelve Months of Jocassee Gorges Visitors .................................. 60 18. Days of Hunting and/or Fishing Participation during Past Year by Jocassee Gorges Visitors ........................................... 62 19. Rivers and Streams Fished by Jocassee Gorges Visitors ............................................................................................ 63 20. Primary Use Locations Reported by Jocassee Gorges Visitors ............................................................................... 64 21. Secondary Use Areas of Jocassee Gorges Visitors ............................... 64 22. Distribution of Access Area Use by Jocassee Gorges Visitors ............................................................................... 65 23. Methods of Discovery of the Jocassee Gorges by On-Site Users ............................................................................. 65 24. Counties and Number of Zip Codes Used in Telephone Survey ........................................................................... 67 25. Age Distribution of Local Residents of the Jocassee Gorges .............................................................................. 68 26. Education Level of Local Residents of the Jocassee Gorges .............................................................................. 68 27. Composition of Families of Local Residents of the Jocassee Gorges .............................................................................. 69 28. Number of Family Members in Household Under 18 Years Old ................................................................................... 69 29. Total Household Income Level of Local Residents .............................. 70 30. Occupations of Local Residents of the Jocassee Gorges .............................................................................. 71

xii
List of Tables (Continued)
Table Page 31. Distribution of Local Residents of the Jocassee Gorges According to Places of Residence Size .................................................................................................. 71 32. Places of Residence of Local Residents of the Jocassee Gorges .............................................................................. 72 33. Familiarity of Local Residents with the Location of the Jocassee Gorges Area ................................................................ 72 34. Level of Familiarity of Local Residents of the Jocassee Gorges Boundaries ........................................................... 73 35. Number of Miles Local Residents Live from Nearest Boundary of the Jocassee Gorges ................................................... 73 36. Distribution of Local Residents Who Have Used the Jocassee Gorges during the Past Year ............................................ 74 37. Number of Days of Participation of Local Residents of the Jocassee Gorges During the Past Twelve Months. ................... 76 38. Number of Days Local Residents Thought They Would Use the Gorges during the Next Year ................................. 87 39. Number of Years Local Residents Have Been Using the Gorges .......................................................... 77 40. Number of Times per Year Local Residents Used the Gorges .............................................................................. 78 41. Primary Activities of Local Residents Who Used the Gorges ....................................................................................... 79 42. Types of Hunting and Fishing Engaged in by Local Residents Classified by Species ...................................................... 79 43. Secondary Activities of Local Residents .............................................. 80 44. Major Areas of Use of Local Residents ................................................ 81

xiii
List of Tables (Continued)
Table Page 45. Months of Use of the Jocassee Gorges by Local Residents ......................................................................................... 82 46. Distribution of Local Residents in Outdoor Organizations .................................................................................. 82 47. Type of Group or Companion Local Residents Normally Recreated with in the Gorges.......................................... 83 48. Number of People Local Residents Recreate with at Jocassee Gorges .................................................................. 83 49. Manner in Which Local Residents’ Recreation Had Changed Over Time at the Gorges .................................................. 84 50. Changes in Levels of Use of Local Residents Since SCDNR Began Managing the Jocassee Gorges.............................. 84 51. Distribution of South Carolina Residents and Non-Residents According to Primary Activity Type .................................................................................. 97 52. Access Points Used by Non-Resident and Resident Visitors of the Jocassee Gorges ...................................................... 98 53. Frequency of Use of the Jocassee Gorges by Residents and Non-Residents of South Carolina ............................................. 98 54. Historical Use of the Jocassee Gorges by Residents and Non-Residents of South Carolina ............................................. 99 55. Day and Overnight Jocassee Gorges Users Classified by Primary Activity........................................................ 100 56. Frequency of Use by Day and Overnight Users of Jocassee Gorges .............................................................................. 101 57. Historical Use by Day and Overnight Users of Jocassee Gorges .............................................................................. 102
xiv
List of Tables (Continued)
Table Page 58. Distribution of Day and Overnight Users by Use Areas of the Jocassee Gorges .......................................................... 102
59. Frequency of Use of Jocassee Gorges Visitors Compared to Historical Use ............................................................ 103 60. Historical Use of Visitors of the Jocassee Gorges Classified by Access Location ........................................................ 104 61. Primary Activity of Jocassee Gorges Visitors Classified by Access Location ........................................................ 105 62. Primary Activity of Jocassee Gorges Visitors Classified by Primary Use Area ...................................................... 106 63. Level of Familiarity with Jocassee Gorges Boundaries and Number of Miles Local Residents Live from Nearest Boundary of Gorges ........................................................... 107 64. Frequency of Use of the Jocassee Gorges and Historical Use.................................................................................. 108 65. Group Size and Primary Activity of Local Residents ........................... 109
66. Group Type and Primary Activity of Local Residents ......................... 110
67. Most Frequent Primary Activities and Corresponding Use Areas of Local Residents ......................................................... 111

ii
LIST OF FIGURES
Figure Page 1. Duke Energy’s Map of the Lake Jocassee Area ................................... 29 2. South Carolina Department of Natural Resources’ Map of the Jocassee Gorges ............................................................ 172 3. South Carolina Department of Natural Resources’ Map of Access Points to the Jocassee Gorges ................................ 174
1
CHAPTER 1
INTRODUCTION
The understanding of who uses the Jocassee Gorges, for what purposes, when
they visit, the frequency of their usage, and what they do during their trip to the area have
been identified as important topics for research and resource management. Different
recreational activities at the Jocassee Gorges have different impacts; therefore, they must
all be closely monitored and managed according to use. The Jocassee Gorges Outdoor
Recreation Use Survey study is the first step towards more effective management of the
area’s use.
The purpose of this project was to conduct an empirically based study of outdoor
recreation activities, participation rates, and resource uses of the Jocassee Gorges. The
survey research would document and describe the current use of on-site visitors,
participation rates, and temporal and spatial distribution rates/patterns of use. The current
and past use by local residents of the Jocassee Gorges would be documented. Traffic use
on roads managed by the South Carolina Department of Natural Resources (SCDNR)
within the Gorges would be recorded using traffic counters in order to provide a rough
estimate of road use.
Objectives
In order to address the purpose outlined for this study, it was necessary to
determine six elements of use of the Jocassee Gorges. These six elements were the six
primary objectives of the research project and were the following:

2
• Objective 1: to determine the types of outdoor recreation users of the Jocassee
Gorges area. This would be accomplished specifically by determining primary
activity and secondary or sub-activity types;
• Objective 2: to determine the distribution of use within the Gorges. The
distribution of use would include the times and areas (settings) of use, in a
temporal and spatial framework;
• Objective 3: to determine the location of the most frequently used areas within
the Jocassee Gorges. More specifically, the particular settings of special uses
within the Gorges would be targeted;
• Objective 4: to determine and describe a profile of users of the Jocassee Gorges.
The profile would be established using characteristics such as individual
residence, age, gender, group composition, occupation, education, and past
experience history in the Jocassee Gorges;
• Objective 5: to determine the use patterns of visitors. Use patterns would
include day versus overnight use, length of stay in the Gorges, and out-of-state
users versus in-state users; and
• Objective 6: to determine an estimate of traffic use on SCDNR-managed roads
within the Jocassee Gorges. This objective would be accomplished through the
use of traffic counters.
History of the Jocassee Gorges
A Cherokee Indian legend concerning a Cherokee maiden named Jocassee,
daughter of Chief Attakulla, involved the story of losing her lover Nagoochee in a battle
with Cheochee, Jocassee’s brother. Jocassee was part of Attakulla’s Oconee tribe and
3
lived on the western side of the Whitewater River, while Nagoochee was part of the
Eastatoees and lived on the eastern side of the Whitewater River. Nagoochee was not
afraid to enter the Oconee tribe’s territory and it would end up costing him his life and
scalp to the hands of Cheochee. The legend tells that upon seeing Nagoochee’s scalp
hanging from her brother’s belt, Jocassee got into a canoe and stepped into the waters of
the Eastatoee River, to meet the ghost of Nagoochee. The Cherokee name, Jocassee,
means “Place of the Lost One.”
During November 1785, General Andrew Pickens managed to get a small
representation of various Indian tribes to sign a treaty, which gave the U.S. land rights to
all Indian property east of the Mississippi River. It would not be until fifty years later in
1835 that the Oconee Mountains of the Jocassee Gorges were actually ceded to the U.S.
Historical Development
The lands within Jocassee Gorges went unnoticed until the 20th century, when
northeastern logging companies began buying up stands of virgin mountain forest
throughout the southeast for logging purposes. The earliest steps of the state of South
Carolina acquiring the Gorges came from these transactions. Although various
companies owned the Gorges at one time or another, in 1963 Duke Power Company
formed the Carolina Land and Timber Company and purchased an 83,400 acre tract of
land in the Horsepasture Valley area from Singer Corporation and other private sellers.
Duke Power began construction in 1967 on what would be the Keowee-Toxaway
project, i.e. Lakes Keowee and Jocassee. The Carolina Land and Timber Company
became Crescent Resources in 1969, and has managed much of the property they own
since that time. Shortly after Duke acquired the land, the South Carolina Fish and

4
Wildlife Resources Commission negotiated a deal with Duke Power and Crescent
Resources to include their lands within the SCDNR’s Game Management Program,
allowing for formal public access. The Jocassee Gorges tract was primarily acquired in
1998 and 1999 through a cooperative effort between the SCDNR, Duke Energy, and the
Richard King Mellon Foundation, assisted by The Conservation Fund. (Figure 2 in the
Appendix is a map of the Jocassee Gorges showing the lands acquired by the SCDNR
and the dates different parcels of land were attained.)
Gateways
Many gateways offer an entrance to the Jocassee Gorges although visitors may
not be able to drive or access them all. This is one great aspect of the Gorges—if you
want to visit the area, you will probably have to walk. The gateways will be briefly
mentioned here without a detailed description, and include:
• Keowee-Toxaway State Park off of Highway 11;
• Devils Fork State Park off of Highway 11;
• Table Rock State Park, off of Highway 11;
• Oconee State Park off Highway 28;
• Caesar’s Head State Park off Highway 276;
• Jones Gap State Park off Highway 11;
• Walhalla State Fish Hatchery off Highway 107;
• Bad Creek Pumped Storage Station off Highway 11; and
• Sumter National Forest off Highway 28.
The four roads leading into the Gorges which the SCDNR and Duke Energy
maintain include:
5
• Horsepasture/Laurel Valley Road off Highway 178;
• Bad Creek access at Highway 130;
• Camp Adger Road off Highway 178; and
• Shooting Tree Ridge Road off Highway 11.
Outdoor Recreation
Many different types of recreationists visit the Gorges every year for each season
or specific season they may prefer. The following activities are managed for in the
Jocassee Gorges and regulated by the SCDNR:
• Hunting – All types of hunting must conform to Wildlife Management Area
(WMAs) regulations and hunters must purchase a WMA permit to hunt.
• Fishing – Fishing activities also must conform to statewide regulations and the
corresponding region whether fishing streams or Lake Jocassee.
• Hiking – Hiking is available throughout the Gorges and includes access to the
Foothills Trail and the highly anticipated Palmetto Trail. There are currently no
specific regulations concerning hiking other than regular state laws, as well as the
recommendation that bright orange be worn anytime during hunting season.
• Camping – Primitive type camping is available throughout the Jocassee Gorges,
whereas RV-style camping is not offered whatsoever, due to numerous
surrounding state parks and the impacts of recreational vehicles or campers.
Primitive facilities offered are at a bare minimum and erecting any permanent
structure within the Gorges is prohibited by the state.
• Horseback Riding – Horseback riding is permitted within the Gorges on a year-
round basis and includes all designated roads whether open or closed. Horseback

6
riding has been a major source of conflict, in terms of dealing with ATV (all-
terrain-vehicle) and OHV (off-highway-vehicle) riders. For this reason, the
SCDNR strongly suggests that horseback riding be done when gates are closed or
on Saturdays or Sundays, when no ATV/OHV riding is allowed, in order to
minimize conflict.
• Mountain Biking – Mountain biking is also allowed on a year-round basis, yet
only on designated gravel roads. All hiking trails are prohibited for mountain
biking, pursuant to DNR regulations.
• OHV/ATV Riding – OHV and ATV vehicles are permitted on designated roads
only when the roads are open for vehicles. ATVs and OHVs are not allowed in
the Gorges on Saturday or Sunday.
• Rock Climbing/Rappelling – Rock climbing is a prohibited activity within the
Gorges due to the fact that much of the climbing areas are great habitat for the
endangered peregrine falcon and possibly the bald eagle.

7
CHAPTER 2
LITERATURE REVIEW
Importance of Visitor Characteristics
The different types of recreation use and users are important sources of
information for park or protected area managers for a variety of reasons. Manning (1999)
explained that the applications of visitor use studies can “range from monitoring the
popularity of recreation activities so as to more efficiently plan budgetary, personnel, and
other resource needs to determining the residence and education of users in order to more
effectively conduct public information and education programs” (p. 16). Manning
clarified when he stated that it should be a management strategy to collect visitor use
information on a regular basis in order to detect any recreational trends which may be
occurring within the resource. Daigle, Watson, and Haas, (1993) reported that the
“majority of outdoor recreationists participate in a variety of activities during a visit” (p.
1). The authors found that “visitor characteristics, such as participation in multiple
activities, may suggest a particular emphasis on the area’s management… [and] knowing
the full range of experiences sought by visitors may help in determining appropriate
management strategies.” Cole (2001) indicated managers must “1) decide which type of
recreation experience to provide, 2) define this experience with specificity, using
parameters such as appropriate numbers of encounters, and 3) decide who should make
these decisions (who the relevant groups are)” (p. 17).

8
Characteristics of Visitor Use
Douglass (2000) pointed out that “the recreation area manager needs to know how
many people are using the developed facilities” (p. 362). The author stated that “the
primary interest is in obtaining figures on hours of use, visitor numbers, and peakload use
to aid in making administrative and management decisions,” also known as experience
use history. Hammitt, Backlund, and Bixler (2004) found experience use history “refers
to the amount of past experience, usually measured in terms of total visits, total years of
use, and frequency per year of participation with an activity and/or resource at a specific
site and/or other sites” (p. 358). Watson, Williams, Roggenbuck, and Daigle (1992) also
reported that “managers must maintain natural conditions while providing opportunities
for wilderness recreation [although] visitors’ numbers and their style of use can threaten
both objectives” (p. 2).
Loomis (2000) showed that government land agencies have been slow to
recognize the importance of visitor use data, especially long-term data. The
consequences of not having accurate visitor use data can be considerable and have lasting
effects on the effectiveness of management strategies. Without accurate use data,
“recreation fares poorly in budget allocations for management, replacement of facilities,
expansion of facilities, acquisition of lands for recreation, and allocation of natural
resources…” (p. 93). Loomis indicated that “other competing uses of agencies’ available
budget often prevail when they have better data on what they produce.” The Countryside
Commission for Scotland (1983) produced a manual for conducting recreation site
surveys. The Commission advised in their report that the “information on the use of

9
recreation sites has a valuable role to play in recreation policy making, recreation
planning, and site management” (p. 1). The Commission also suggested that even if all
use information for a site cannot be obtained, the gradual accumulation of user
information for a range of sites has the ability to aid the planning and management
process greatly. Watson et al. (1992) indicated that the “knowledge of visitors and their
use of wilderness is considered essential to light-hand management,” and that those types
of “approaches are usually preferred for influencing the behavior of wilderness visitors”
(p. 1). A light-handed approach emphasizes “subtle, unobtrusive management to help
maintain the freedom, spontaneity, and sense of escape that visitors expect from
wilderness.” Light-handed management strategies of the Jocassee Gorges could include
the seasonal openings of gates, conservation education, or attempts to foster a special
concern for the area using visitors’ natural place attachment and care for the property.
Watson et al. explained further that if information could be collected on site-specific user
characteristics, a sense of the users who would be willing to comply with light-handed
strategies might be better understood. That type of “knowledge could be helpful when
selecting direct management strategies” (p. 1), such as the patrolling that conservation
officers of the South Carolina Department of Natural Resources (SCDNR) routinely
conduct throughout the year in the Jocassee Gorges.
Recreational Group Characteristics
Manning (1999) also mentioned the importance of information concerning
recreational user groups and their social structure. Andereck, Vogt, Larkin, and Freye
(2001) found that “understanding differences between various types of recreation user
groups is key to planning for and managing resources to meet needs and achieve social,

10
environmental, and economic benefits” (p. 62). Burch (1964) found early empirical
evidence that recreation activities are usually defined by the different structures of the
groups of participants. Andereck et al. and Burch’s conclusions indicate that different
groups will have different goals and requirements pertaining to the resource they are
using. Burch also stated that “administrators tend to define their problems in terms of
efficient operation and organizational goals, [while] their clients often define their
problems in personal terms” (p. 710). Hendee and Dawson (2002) explained further that,
“Today, public involvement is recognized as perhaps the most important tool for the
successful development and implementation of wilderness management plans and
actions—and all other management of public lands” (p. 203). They also stated,
“Wilderness management is basically concerned with management of human use and
influences to preserved naturalness and solitude” (p. 196). Even though management of
most wilderness-type resources has typically placed emphasis on the management of
users, “ecological problems are also becoming more important; wilderness managers are
increasingly challenged to monitor the naturalness of wilderness ecosystems and provide
counterinfluences to human impacts” (p. 196).
Carrying Capacity
Leung and Marion (1999) recognized that “resource and social impacts caused by
recreationists and tourists have become a management concern in national parks and
equivalent protected areas” (p. 20). Manning (2001) defined carrying capacity as the
“amount and type of use that can be accommodated in parks and related areas without
unacceptable impacts to park resources and/or the quality of the visitor experience” (p.
93). Having an area or resource carrying capacity in mind, many protected area

11
managers have implemented a range of strategies and actions which are largely spatial in
nature (Leung & Marion). In regards to protected areas containing trails, Marion and
Leung (2001) stated, “Trail managers require objective information on trails and their
conditions to monitor trends, direct trail maintenance efforts, and evaluate the need for
visitor management and resource protection actions” (p. 17). Plumley, Peet, and Leonard
(1978) conducted a study based on data which had been recorded by the caretakers of
backcountry shelters along the Long Trail in Vermont. Plumley et al. found that the
proportion of in-state hikers was relatively small compared to total numbers of out-of-
state hikers using the Long Trail. As a result of their findings, Plumley et al. indicated
that, “Visitors’ residence data can indicate where to direct educational information and
regulations on trail use, and where funds to support backcountry facilities might be
sought” (p. 17).
Wilderness Concepts
Cole (1993) found that “currently, most wilderness areas are managed without
access to baseline or monitoring data on recreational use and its effects” (p. 24). Cole
cited a recent survey which found that merely 16 percent of wilderness areas had
systematic visitation counts. The remainder determined basic visitor counts using
random observations or ‘best guesses.’ Instead of this approach, Cole advised
“incorporating monitoring into management programs [that] would enable managers to
learn from previous mistakes and successes and to evaluate the effectiveness of previous
actions.” This would allow management programs to be directed more towards the long-
term future, rather than ‘symptomatic treatments.’ Hollenhorst and Jones (2001)
concluded that if park or protected area managers are “truly interested in providing

12
solitude benefits, we should turn our management and research gaze away from crowding
and encounter norms towards our own management tendencies to impose constraints on
visitor freedoms and independence” (p. 60). Since wilderness users have always been
classified as separate from ordinary outdoor recreationists, “It is critical that we recognize
and accommodate their need for independence in their personal and social lives.”
Hollenhorst and Jones stated, “The great challenge we face is to find the means of
respecting visitors’ need for freedom and independence while protecting the ecological
values of the wilderness resource.”
Cole, Watson, and Roggenbuck (1995) warned that “For the purpose of
developing the information needed to manage an individual wilderness, it will then be
necessary for many different wildernesses to study trends in their visitors” (p. 37). Cole
et al. further stressed that day-users of wilderness-type areas have not been studied in
depth, are not frequently monitored, and their use is typically uncontrolled.” The authors
continued in cautioning that “managers of wilderness with substantial amounts of day-use
[(like the Jocassee Gorges)] would be wise to pay more attention to these users and their
impacts.” Cole, Watson, Hall, and Spildie (1997) stated, “Decisions about management
of high-use destinations should be based on a thorough understanding of levels of human
impact in the area and the effects on visitors of conditions and of management responses
to those conditions” (p. 1). Cole et al. also reported that “many are reluctant to regulate
use; they feel they cannot afford to administer and enforce regulations…such areas
continue to provide recreational opportunities for large numbers of people, but they many
not meet visitor’s definitions of high quality wilderness.” Cole and colleagues’ last point
was especially true for the SCDNR, because budget constraints exist virtually every year

13
for the agency. The authors indicated that unfortunately, “…in almost all cases, actions
are taken without much pre-existing data on the nature and extent of the problems being
attacked.”
Jocassee Gorges Management Plan
The mission statement for the Jocassee Gorges states, “The primary management
objective for the Jocassee Gorges property is to maintain the natural character of the area
while protecting, maintaining, restoring, and/or enhancing significant plant, fish and
wildlife communities and their habitats,” (Rankin, 1998, p. 1). In addition, “The
secondary objective is to provide for recreation that is compatible with the area’s natural
character.” Different recreational activities have different impacts; therefore, they must
all be closely monitored and managed according to use. The Jocassee Gorges Outdoor
Recreation Use Survey Study can be one step towards more effective management of the
area.
Many different types of recreationists visit the Gorges every year during all
seasons or for certain seasons they may prefer. The SCDNR explained further that,
“Visitor carrying capacity of the site and the social carrying capacity are major elements
in planning for the recreation component of the overall management plan,” (Rankin,
1998, p. 1). However, for different reasons, “Data on human carrying capacity are not
currently available for use in planning the recreation component. Because of the lack of
this information, great care and a conservative approach must be taken in making the area
available for recreation.” L.L. Gaddy (1998), a Ph. D. consulting biologist for A
Preliminary Investigation of the Significance of the Jocassee Tract, gave many reasons
for the unique importance and nature of the Jocassee Gorges when he wrote,
14
“…the Jocassee tract is significantly richer in rare, threatened, and endangered plants and animals and noteworthy natural communities than was previously thought. At the beginning of this investigation, 129 geographic records of rare, threatened, and endangered species and natural communities were listed in the files of the South Carolina Department of Natural Resources; 52 new records were added during the course of the study. The discovery of this many new records in winter in such a short period of time strongly suggests that further field work is needed before the biotic diversity and richness of the Jocassee Tract is fully known…The tract sits on the Blue Ridge Front, displaying the typical topography of the southern Blue Ridge Escarpment – high mountain peaks deeply dissected by fast-flowing water…East of U.S. Highway 178, there are a total of five mountain crests in excess of 3,000 feet in elevation [highest in S.C.] found within the tract…the Jocassee Gorges are most famous for their disjunct populations of ferns and bryophytes (mosses and liverworts). Some tropical ferns found in the gorges and along Cane Creek on the Jocassee Tract do not occur elsewhere in temperate North America; furthermore, a species of filmy fern found in the Eastatoe Gorge has its only North American locality there. But an even more interesting and noteworthy element of the Jocassee Gorges area is the moss flora, which is unparalleled in North America in richness and diversity” (Gaddy, p. iii-4).
With these types of unique resources at stake, it is absolutely crucial that the types of
outdoor recreation which occur around the resources be in harmony with their
management plan. Christine Lewis (2001), a master’s student of Clemson University,
illustrated the SCDNR’s difficult position perfectly when she stated, “The SCDNR is
now faced with the difficult task of balancing the demands of environmentalists and
recreational users alike in managing these extensive public lands for which little
biological information is known” (p. ii), and for which little recreational use information
is known.
Road Access and Maintenance
Access to the Jocassee Gorges on paved roads is very limited, and the road system
is gravel roads. Rankin (1998) stated that “approximately 138 miles of dirt roads exist on
the property.” Existing roads in the Gorges fall in two major categories: “1) roads open
seasonally for public access, forest management, fire control, etc., and 2) roads closed to

15
public vehicle access but used for official access, forest access, fire control, and public
access for mountain biking and hiking” (p. 1).
Road maintenance and/or improvements have been prioritized in the Gorges in
order to affect the areas which need the most attention as well as to utilize funding in the
most appropriate manner. Rankin (1998) indicated that the “installation of sediment
traps, broad based dips, water bars, berms, weeps, etc. will be needed to minimize erosion
from many main access roads” (p. 3). He also stated that, “Road surfacing used should
be carefully considered to minimize siltation (e.g. avoid crusher run around spring and
stream areas). Maintenance of watershed integrity and high water quality is a
management priority (p. 3).” It is even more important for the SCDNR to be able to
close roads down under extreme weather conditions or when road conditions become
impassable or even dangerous for visitors.
Ecological Impacts
Resource impacts are virtually inevitable when recreation is allowed in wildland
environments, even if under low to medium levels of use. Hammitt and Cole (1998)
explained that “because wildland recreation is increasing in popularity and because
resource impacts naturally accompany use of wildland areas, both recreational and impact
management areas are necessities in wildland ecosystems” (p. 349). Hammitt and Cole
indicated that since “public policy has made these areas [(wildland areas)] available for
recreational use…resource managers must aim to satisfy public use benefits as well as
protect the resource base that provides these benefits.” Land management agencies have
no alternative than to provide recreation opportunities for the public and typically would
not want to eliminate recreation opportunities even if possible. Cole (1994) found that,

16
“Managers must be concerned about the impacts that potential threats have on attributes
of wilderness character” (p. 1). Cole further defined threats as “human activities or the
consequences of human activities that have the potential to change wilderness conditions
[which] can cause impacts to wilderness attributes.” Researchers have historically
studied the social characteristics of outdoor recreationists for many reasons. Manning
(1999) explained that “special emphasis has been placed on basic demographic and
socioeconomic characteristics such as age, education, income and occupation” (p. 25).
Manning noted that, “This information is fundamental to an eventual understanding of
more sophisticated issues such as why people participate in outdoor recreation, and is
also important in predicting future recreation patterns and evaluating issues of social
equity.”
Visitor Management Preferences
Knopf and Lime (1984) described procedures for assessing the characteristics and
management preferences of river recreationists using a variety of rivers throughout the
United States. They found that repeat visitors were more sensitive to problems with the
resource than visitors who were coming to the area for the first time, particularly when
the problem was related to social conditions. Recreationists were provided with two
blank pages after they had finished the questionnaire, where they were allowed to express
any additional comments or suggestions concerning the management of the particular
river they were using. The authors indicated that “managers have found such input to be
invaluable for gaining insight into issues that are both particularly volatile and specific to
their own resource” (p. 22).
17
Use Restrictions
Watson and Niccolucci (1995) focused on users’ underlying beliefs and attitudes
for use restrictions for wilderness areas in Oregon. The authors indicated that day and
overnight users thought use limits should be applied at different times. Despite this, “A
large majority of wilderness visitors indicated they supported limiting use to maintain the
qualities of the wilderness” (p. 14). Watson and Niccolucci also found that, “The
majority of all visitors believed that overuse had not occurred at these sites, indicating
they supported use-levels when capacity was reached.” Visitors’ experience with
wilderness areas did not prove to be a significant predictor of support for use limits.
Stewart and Cole (2003) found that as the “number of encounters increased, most Grand
Canyon backpackers felt more crowded, were less likely to achieve a sense of
solitude/privacy, and reported that this adversely affected the overall quality of their
experience” (p. 120). Stewart and Cole cautioned resource managers when they stated
that, “The standard for assessing quality in outdoor recreation is the extent to which
management objectives for appropriate experience opportunities are met” (p. 124). Cole
(2001) wrote a review of the research that had studied the relationship between use
density and wilderness visitor experiences dating back to the 1960’s. Throughout the
research, Cole found that the majority of recreationists preferred low-density wilderness
settings without many encounters with other users. Cole also indicated that when visitors
encountered high numbers of other users in wilderness their experience was usually
negatively affected. Cole concluded that “even in crowded experiences, most wilderness
visitors still have high quality experiences...[therefore] use density has little effect on the

18
quality of recreation experiences” (p. 17). Cole did state that density most certainly
affects the nature of the recreation experience, but not always negatively.
Recreation Fees
Winter, Palucki, and Burkhardt (1999) examined anticipated responses to the
proposal of the initiation of a recreation fee program. Sometimes managing agencies are
forced to implement fee programs in order to provide a more satisfactory or higher level
of service or opportunities Winter et al. found that “overall the vast majority of
statements gathered at the focus groups were negative. Disapproval was based on
concerns over changing the recreational experience, image of the managing agency,
ideological concerns, and distrust,” (p. 218). The issue of trust was a large factor in
respondents’ acceptance of the proposed recreation fee program. The authors stated,
“The measure of social trust appears to have great utility in the study of reactions to and
acceptance of land management agencies’ actions” (p. 224). Land management agencies
which have to handle the issue of trust must be concerned about effective
communication, whereby the public is informed in-depth of the rationale behind a fee
program. Communicating well with the public also means agencies would have to adopt
a policy of complete openness concerning the program, to include the effectiveness and
results since the fee program was administered. Although a fee program for the Jocassee
Gorges would most likely limit use to a small degree, raise funds for more effective
management of the property, and be overall successful; the SCDNR may not be able to
implement a fee program on only one of its Wildlife Management Areas in the state.

19
Wilderness Visitor Trends
Roggenbuck and Watson (1988) provided a summary of the current and past use
of the National Wilderness Preservation System, which discussed the total amount of use
and characteristics of that use, as well as characteristics of the users. Data on wilderness
users came from over thirty wilderness areas across the country, primarily from the
1960’s and 1970’s. Roggenbuck and Watson indicated that the average age of the
wilderness user was primarily between 16 to 25 years old, followed closely by users
between 26 to 35 years of age. The authors found that between 70 and 85 percent of the
visitors who came to the wilderness area surveyed were male. They also found that more
than two-thirds of users came from the state in which the wilderness area was located;
however, Eastern wilderness areas tended to have more out-of-state visitors. The
majority of wilderness users lived in urban areas, but it was also noted that many visitors
grew up in rural areas or small communities. Wilderness users were found to have higher
educational levels than the general population, the large majority having completed
college. The most frequent type of occupation for wilderness visitors was a professional
or technical worker, while the most underrepresented were homemakers and clerical
workers. Income levels were found to be above-average for wilderness users; however,
Roggenbuck and Watson stated that most outdoor recreationists have moderately high
incomes. Only about one-quarter of wilderness users were found to be in some type of
conservation organization, with many of those users reporting being members in an
outdoor club or group. Roggenbuck and Watson stated that “the previous use history of
most wilderness visitors can be characterized by a few words: high experience, frequent
visits, and short stays” (p. 350). Last, the family was the most frequent group type
20
coming to use wilderness areas, comprising over one-third of users. The average group
size was usually small, from four to five people. Groups of two to four people comprised
over half of users included in their summary of studies. The majority of wilderness visits
were only for one day or less, even when concerning large western wilderness areas.
Trips lasting more than one week “were almost nonexistent…and the average length of
stay for most areas across all regions of the country is 2 to 3 days” (p. 351).
Almost two-thirds of wilderness use occurred most frequently during the summer
months, with many exceptions being areas which are used for hunting and experiencing
periods of one to two weeks of intense use when hunting seasons are opened. Wilderness
use was also found to be concentrated on weekends, i.e. Friday, Saturday, and Sunday.
Roggenbuck and Watson found that “fishing (where possible), photography, nature study,
and swimming (particularly in the Southeast and California) follow hiking as the most
common activities in wilderness” (p. 353).
Cole, Watson, and Roggenbuck (1995) focused on trends of wilderness visitors
and their visits at three wilderness areas in the U.S., one being the Shining Rock
Wilderness in North Carolina. Visitor use data from 1990 was compared to previous data
taken in 1978 and differences noted. Cole et al. found that visitors were older in 1990
than in 1978, and day users were found to be significantly older than overnight visitors in
1990. Day users were also more likely to be female, come from a small community, and
less likely to be students or members of a conservation organization. Educational levels
were not found to be significantly different between the 1978 and 1990 samples however,
education levels from both samples were found to be much higher than the general
population of the United States. Almost two-thirds of the visitors surveyed in 1990 came

21
from North Carolina, and in comparison with the population of North Carolina, students,
males, and conservation organization members were overrepresented in both 1978 and
1990. Wilderness visitors from the 1978 sample were found to be much younger than the
general population, but that age was comparable to the general population in 1990’s
sample. Previous use of the Shining Rock Wilderness was not found to be significantly
different between 1978 and 1990, yet the researchers indicated that 1990 visitors to the
area were much more experienced with other wilderness areas than visitors in 1978. Cole
et al. also found that the frequency of wilderness visits increased on average from two
times per year in 1978, to about four times each year in 1990. The average group size
traveling to Shining Rock decreased from 4.4 in 1978 to 3.5 in 1990, although the most
frequent group size was two. Groups surveyed for both samples were almost entirely
hiking while visiting Shining Rock. Weekend use of Shining Rock saw an increase from
29 percent in 1978 to 48 percent in 1990, but weekday use declined from 40 percent to 30
percent in 1990. Cole et al. stated that, “Very few visitors to Shining Rock considered
people problems, resource impacts, or management programs to be more than small
problems…litter was the problem given the highest severity…” (p. 13-14). Visitors in
1990 were also found to be more tolerant of intergroup encounters compared to 1978.
The average satisfaction rating for the overall experience while using Shining Rock did
not change significantly between 1978 and 1990.
Wilderness Privacy
Hammitt and Rutlin (1995) conducted a study on wilderness visitors in the
Ellicott Rock Wilderness in South Carolina that focused on use patterns and factors
affecting and/or influencing wilderness privacy. The researchers found that Ellicott Rock

22
users were more likely to be male than female, very similar to Jocassee Gorges users.
The average age of the Ellicott Rock Wilderness visitor was 35 years, and visitors
typically had some college education. Hammitt and Rutlin found that almost three-
fourths of Ellicott Rock users were classified into three occupation categories:
professional, managerial, and student. More than one-third of users lived in urban areas
with populations between 10,000 and 100,000. Ellicott Rock visitors who did not stay
overnight accounted for almost two-thirds of users. Hammitt and Rutlin indicated that
hiking was the most frequent primary activity of visitors to the Ellicott Rock Wilderness.
Sightseeing and watching wildlife were the second and third most frequently reported
activities of Ellicott users. Visitors listed hiking, camping, and fishing as the top three
reasons for visiting the wilderness while activities like sightseeing, watching wildlife, and
photographing nature were listed as incidental or secondary activities. Many Ellicott
Rock visitors recreated in the area with a group of 2-4 people and typically traveled to the
area with friends or family. The average group size for Ellicott Rock visitors was 4.51.
Hammitt and Rutlin indicated that visitors to the Ellicott Rock Wilderness were largely
similar to those reported in other studies (Boteler, 1986), but the one defining
characteristic of Ellicott users was their relatively short length of stay in the wilderness
area.
Manning, Lime, Freimund, and Pitt (1996) studied Arches National Park, Utah
and attempted to measure crowding norms through a visual approach. Photographs were
constructed showing a range of crowded conditions (number and placement of other
visitors) at Delicate Arch, one of the park’s largest attractions. Manning and colleagues
found it clear “that respondents generally judge increasing numbers of visitors in the

23
photographs as progressively less acceptable” (p. 46). The location of other visitors in
the photographs also contributed to adverse affects on the recreationists’ experience;
however, it is more feasible for managers to pay more attention to controlling the total
number of visitors using the location. “Conceptually, norms for both social and
ecological impacts can be categorized into one of three types: no tolerance, single
tolerance, and multiple tolerance,” (Shelby, Vaske, & Donnelly, 1996, p. 110). Shelby et
al. also indicated that among the research conducted on encounter norms in backcountry
and frontcountry settings, “norms for encounters during a backcountry experience tend to
be quite low…compared to frontcountry settings where the tolerance limits can exceed
100 encounters.”
Day and Overnight Use
Cole (2001a) published a report consisting of secondary analysis of wilderness
user data collected during the 1980’s and 1990’s in order to compare day users and
overnight users. Cole found day and overnight users had higher than average education
levels as well as substantial incomes. Day users were older on average than overnight
users, and males were found to be more common than females for both groups.
Occupations of both groups of users differed at certain other wilderness areas, i.e. more
retired people and homemakers versus students. Cole stated that, “Day users have
slightly more localized, place-specific wilderness experience than overnight
visitors…[and] day users are more place attached and more likely to visit places they
have visited before,” (p. 11-12). No significant differences were found between day and
overnight users in relation to the frequency of use of wilderness areas. Cole (2001a)
cautioned that none of the differences found were substantial enough to suggest that both
24
groups had been drawn from the same population, or that wilderness users tend to take
both day and overnight trips. Cole also found that day and overnight users had similar
levels of place attachment for wilderness, and both supported wilderness management
policies already in place. Despite these similarities and diminutive differences, Cole did
find several significant differences between day and overnight users. Groups of day users
were usually smaller and more likely to consist of just one person, more likely to contain
women, more likely to contain family members, and less likely to have an organized
structure. The length of stay for day users was much shorter than overnight users and
typically involved fewer different activities. Day users were also found to be “less likely
to feel that they saw too many people or feel that the number of encounters they had with
other people was a problem,” (p. 11-12). Cole’s main finding was that the majority of
wilderness day users were not very different from most overnight users. Cole stated that,
“There are numerous statistically significant differences between day and overnight
users, but the magnitude of differences is generally small, and few seem of great
managerial significance.” Five conclusions were stated in his report which can have
management implications for land agencies. First, day and overnight users were not
found to be significantly different, perhaps due to the fact that they were often the same
people. Second, the majority of day users was tolerant of relatively crowded conditions
and usually did not recognize the immediate need for limiting use to the area. Third, day
users were on average as experienced with wilderness settings as overnight users, and
possessed a high level of support for wilderness management as well as high place
attachment for the resource as overnight users. Fourth, day users could be as interested in
the overall wilderness experience as overnight users, even though most day users
25
reported a primary activity as their motivation for traveling to the area, whereas overnight
users typically stated ‘a trip in the wilderness’ as their motivation. Fifth, day use was
found to usually be less dependent on wilderness than overnight use.
On-Site and Local Resident Use
Burger (2000) studied hunters and other visitors at the Savannah River Site in
South Carolina, focusing on the different relationships and perceptions visitors had for
the Savannah River. People were interviewed over the telephone and in person about the
Savannah River Site at three events in South Carolina: the Palmetto Sportsmen’s Show in
Columbia, SC, the Aiken (SC) Trials horseshow, and Mayfest in Columbia. Hunters who
actually hunted on the Savannah River Site property were randomly selected from a list
of hunters who signed in with state game officials at a big game check station. The age
range for all four samples averaged between 34 and 40 years, and almost one-half of each
sample had graduated high school and had some college experience. Except for the on-
site sample, one-half of respondents for each of the off-site samples had graduated
college. On-site hunters were entirely men, and off-site users interviewed were at least
over 50 percent male. As Burger expected, people interviewed at the Palmetto
Sportsmen’s Show had the highest rates of hunting and fishing, followed by Aiken Trials
and Mayfest, respectively. Burger also found that “hiking and camping rates were
similar for the others, while photography and bird-watching were relatively high for the
general populations,” (p. 225). The preferences for future use of the Savannah River Site
differed significantly for all four samples. On-site hunters wanted to see the property
opened longer for hunting, have research areas opened for hunting, and have more
preservation efforts for the site, while other groups rated maintaining the area as a

26
National Environmental Research Park the highest. Hiking and camping were generally
the second highest preferred land use, and building homes was rated the lowest for future
land use. Burger summarized, “Overall, the people interviewed engaged in an average of
20+ days of hunting, 25+ days of fishing, and 15+ days of hiking and camping,” (p. 228).
People were not asked to estimate the total number of days they used the area, but Burger
found it unlikely that 25+ days of fishing would include the same days of hunting, hiking,
and camping. This suggests that people use the Savannah River Site much more than 25
days per year. Burger concluded,
“Although no one person would be likely to engage in all of their recreational activities in Savannah River Site if it were unrestricted, the relatively high rates of recreation engaged in by the people interviewed suggests that attractive Savannah River sites for hunting, fishing, and other recreational activities would be used.” It was also likely that some people interviewed participated in even higher rates of recreation, especially the retired or unemployed. “Taken altogether, the data from these
interviews indicate that some recreationists would exceed the 14 day a year maximum
recreational assumption on Savannah River Site,” (p. 229). Burger found that people
living locally and surrounding the Savannah River Site used the area in relatively high
rates of recreation. People interviewed also felt that the site should remain a National
Environmental Research Park, “but that parts of the site should be open for recreation,
including camping, hiking, hunting, fishing, and bird watching. They uniformly do not
believe it should be used for housing” (p. 230).

27
CHAPTER 3
METHODS
Part 1: On-Site Users
Physical Description of Study Area
The Jocassee Gorges tract contains nearly 43,500 acres of land, and negotiations
for additional tracts are currently underway. The Gorges are best described as having a
western boundary which is roughly the drainage of the Toxaway River in northern
Oconee County to a common eastern boundary which adjoins the Greenville Watershed
and Table Rock State Park in Pickens County. The northern boundary is the North
Carolina-South Carolina state line, of which North Carolina’s side is Gorges State Park.
In the south, the Gorges are situated slightly north of Highway 11 (Figure 1).
The Jocassee Gorges include many rivers of notable fishing quality including: the
Whitewater River, the Horsepasture River, the Thompson River, the Eastatoee River,
Bearcamp Creek, Cane Creek, and Laurel Fork Creek. The other major body of water
within the Gorges is Lake Jocassee, a 7,500 acre reservoir which offers the only fishing
resource in South Carolina for trophy trout and bass angling.
Sample Size
The sample size for data analysis was 247 users interviewed from 263 total users
contacted, resulting in a participation rate of approximately 94%. After surveys were
collected in the field, the paper copies of the interviews were turned over to the chief
project investigator. The hard copies of the interviews were then entered into a computer
database, in SPSS (Statistical Package for the Social Sciences) form.

28
Sampling Frame
The sampling took place during the Spring, Summer, Fall, and Winter of 2005.
For the purposes of this study, Spring included the months of March, April, and mid-
May. Summer consisted of the months of late-May, June, July, August, and mid-
September. Fall included the months of late-September, October, and November. Winter
consisted of the months of December and January. The weekend was defined as Friday,
Saturday, and Sunday.
On-Site Survey
The first part of the surveying process was to develop an intercept questionnaire
to be used for on-site recreationists contacted within the Jocassee Gorges. The data the
SCDNR requested afforded a rough outline for the questionnaire. Global Positioning
System (GPS) data were originally requested to accompany each survey, which would be
taken at the actual intercept position within the boundaries of the Jocassee Gorges. Due
to safety issues involving researchers entering the property during hunting season, the
goal of obtaining GPS data for actual intercept positions was abandoned.
The first section of the questionnaire dealt with obtaining current visitor use
patterns within the Jocassee Gorges area. Spatial and temporal patterns of visitor use
were specific items the SCDNR wanted to know for the Jocassee Gorges. The specific
primary activity being conducted on the property, any possible secondary activities
engaged in during the trip, and the length of the visitors’ trip (measured in hours or days)
were also obtained. Information was also requested on exactly where the activities were
being participated in at the Jocassee Gorges, which were marked on a map included
within the questionnaire. The map used was the map provided by Duke Energy for the

29
Lake Jocassee area, which was small, yet detailed enough to carry into the field and
accurately record where use was taking place (Figure 1).
Figure 1. Duke Energy’s Map of the Lake Jocassee Area.
The second section of the intercept questionnaire was devoted to information on
past visitor use of the Jocassee Gorges. A list of primary recreation activities was
developed in consultation with field officials of the SCDNR. Information was requested
on approximately how many days each activity had been participated in within the past
twelve months, and locations on the map where the activities had been engaged in. Two
additional questions gathered information on the approximate number of times the
Jocassee Gorges property was used by the visitor, and the length of past use, measured in
number of years. If the visitor surveyed was using the Jocassee Gorges area for the first

30
time, the past use section of the survey was not used and the visitor simply proceeded to
the final section of the survey. The last question in section two of the questionnaire was
developed by the SCDNR to address their need to obtain specific information on hunting
and fishing taking place within the Jocassee Gorges. Hunting was broken down into
three different categories/options for visitors: bear, deer, or small game (squirrels, rabbits,
etc.). Fishing was broken down into several possibilities: Lake Jocassee or in rivers and
streams. If fishing was taking place in rivers and/or streams, the visitor was asked to
identify the specific stream, and the information was recorded. If the Eastatoee River
was identified as the river the visitor was using, they were asked to identify if they could,
if they were fishing the Upper or Lower Eastatoee.
The third section of the intercept questionnaire dealt with information on the
visitor’s background characteristics in order for the SCDNR to determine what type of
users come to the Jocassee Gorges property. Information on age, gender, education,
occupation, place of residence, and total number of family members was recorded within
this section. Any further comments by the visitors were recorded at the end of the
questionnaire. Appendix A has a complete copy of the on-site survey.
Procedures
The study area included the Jocassee Gorges Natural Area property under
SCDNR management, as well as other property managed by Duke Energy also
considered part of the Jocassee Gorges system. The study population consisted of on-site
users intercepted within the boundaries of the Jocassee Gorges.
A convenience sample was conducted during the Spring, Summer, Fall, and
Winter of 2005 of on-site users that could be contacted by Clemson University field
31
researchers during reconnaissance of SCDNR-managed roads, trail heads, trail routes,
and activity sites. Prior sample size for the convenience sample was not determined, as it
was impossible to know exactly how many users would be intercepted in the Jocassee
Gorges. Rather than attempt to find a representative number for the convenience sample,
50 days of surveying were pre-selected to coincide with holidays, weekends, and the
openings of hunting and fishing seasons.
Data collection consisted of an on-site intercept survey of Jocassee Gorges users.
During the intercept survey, users were asked to volunteer participation information
relating to activity, use patterns, and locations of use. A map was provided to users and
they were asked to identify frequently used areas and their corresponding types of use.
Past use history, as well as anticipated future use, were also collected from respondents.
Background and profile characteristics were obtained from users at the end of the survey
process.
Estimates of road traffic were originally planned to have come from the use of
five traffic counters placed on all access roads into the Jocassee Gorges, including one at
the Bad Creek access. Location of the traffic counters was determined in consultation
with SCDNR personnel. Due to the cost of the traffic counter units, only two road
counters were obtained and subsequently used to estimate road traffic at only two access
roads: Shooting Tree Ridge Road and Musterground Road at the Bad Creek access.
Field data collection was conducted by graduate students of the Department of
Parks, Recreation, and Tourism Management with the majority majoring in Recreation
Resources Management. One Master of Science student was assigned to the project,
along with four hourly-paid assistants to help in conducting the on-site field
32
reconnaissance survey. The monitoring of traffic counters was conducted by SCDNR
field personnel and Clemson University researchers.
Clemson University delivered periodic progress reports to the SCDNR as well as
a final project report. The Master of Science thesis from this study, a data file of the raw
data, all survey instruments, and a map of distribution use were provided to the SCDNR.
On-Site User Contact
One concern of the researchers dealt with the possibility of visitors who had
additional comments or concerns involving the Jocassee Gorges which could not be
effectively dealt with in the field during surveying. In order to respond to this situation in
the field if it occurred, a contact card was created with phone numbers to both Clemson
University and the SCDNR for researchers to hand out to visitors who had additional
comments, concerns, or complaints which they felt they needed to express. The contact
card also served the purpose of further explaining the study to visitors who did not
understand the purpose of the project, or did not fully trust the confidentiality of their
responses. Appendix B has a copy of the contact card.
A sampling procedure was developed for each Jocassee Gorges visitor
intercepted. The user was intercepted by a researcher wearing clothing which identified
him or her as a Clemson University worker, working in cooperation with the SCDNR.
Each researcher wore a collared shirt which bore the emblem: “Jocassee Gorges Research
Team, Clemson University—S.C. Department of Natural Resources.” A standard script
was developed for the researchers to use in order to explain the study and the agencies
involved, and to ask if they would volunteer to participate. The script was placed at the
beginning of the questionnaire to reduce the number of forms the researcher needed to
33
keep track of (Appendix C.) After making contact with the visitor and explaining the
project, if the user agreed to volunteer, the researcher simply continued with the survey
and proceeded to section one of the survey. If the visitor refused to participate, the time,
date, location, number in party, approximate age, and any other characteristics of the user
including possible primary recreation activity, state of license plate, vehicle make, were
recorded (Appendix D).
Access Points
The Jocassee Gorges property has many different access points which were
considered for surveying sites. The access points used for surveying included the
following: 1) Bad Creek (Musterground Road), 2) Horsepasture Road, 3) Shooting Tree
Ridge Road, and 4) Dug Mountain Angler Access. The only access point not included in
the survey was the Camp Adger Road access.
Camp Adger Road was not used for several reasons, which were decided upon
during the initial field testing of the survey in March of 2005. The terrain leading into the
Camp Adger Road access was very steep and difficult for vehicles which are not
designed for all-terrain travel. Even when not entering the Jocassee Gorges property
because of hunting season, risking an entire day of surveying on an access point that was
not known to have users was too high a risk for the allotted days to sample, as well as the
budgeted funds for field researchers. Camp Adger Road’s close proximity to
Horsepasture Road access and its much higher level of possibility of intercepting users
was another reason for its exclusion. Camp Adger was surveyed on several “spot”
occasions in attempts to intercept users; however, no user surveys were collected and the
access point was not included in the results of the project.

34
The four access points included in the study for surveying were initially given
equal weight in sampling times. Due to preliminary survey figures during the Spring of
2005, it became quickly evident that sampling times would need to be disproportionately
distributed to each access point in order to ensure equal representation from each access
area of the Jocassee Gorges. Bad Creek access and Horsepasture Road access proved to
be the higher level use areas than other access points, so equal consideration and
weighting was given to Shooting Tree Ridge Road and the Dug Mountain Angler Access
Area. (Figure 3 in the Appendix is SCDNR’s map of access points to the Jocassee
Gorges.)
Recreational Seasons
The big game hunting seasons for the Spring and Fall of 2005 were equivalent to
the sampling framework for this study. No Sunday hunting is allowed on Wildlife
Management Area lands, such as the Jocassee Gorges (Game Zone 1). Turkey season
opened on April 1 and closed on May 1. Deer season opened for primitive weapons
(black powder-muzzleloader rifles and bow-hunting) on October 1 and ended on October
10. Gun (shotguns, center-fire rifles and revolvers) hunts for deer opened on October 11
and closed October 16; gun season opened again October 31 and did not close until
December 22. No gun hunting for deer was allowed on Wildlife Management Area lands
in Game Zone 1 during December 23 through January 1. Either-sex hunts for deer were
allowed on the weekends of November 4 and 5, as well as the 11 and 12. Either sex
hunts pertains to the freedom of choice (deer only) of harvesting either sex of deer during
the specified dates within the deer season. Still hunting (no dogs) bear season began
35
October 17 and lasted through October 22, and bear season with the use of dogs began on
October 24 and lasted until October 29.
Spring Sample
The initial Spring sample was pilot tested the week before turkey season opened
(April 1), during March 20-27. After a successful field testing of the on-site survey, a
survey time framework was set up for the Spring sample. Spring sampling times were
from 9:00/10:00 a.m. to 1:00/2:00 p.m. and 2:00/3:00 p.m. to 6:00/7:00 p.m. The
timeframes for the Spring sampling selected were chosen for several different reasons.
Turkey season opened on April 1 and ended on May 1 for both 2005 and 2006.
Attempting to intercept turkey hunters on their way to entering the Jocassee Gorges
resulted in many initial refusals to the survey. As a result, intercepting hunters on their
way out of the Gorges area in the morning or on their return trip back to the property after
lunch quickly became the most opportune times for successful surveying. Another
reason for the timeframes selected for the Spring sample was that user groups (day
hikers, fishermen, etc.) other than hunters had a very small chance of not being
intercepted by researchers during one of the two timeframes due to the nature of their
respective activities.
During March 20-27, surveying was done at the Bad Creek and Horsepasture
Road accesses. The three days of surveying resulted in a total of fourteen surveys
collected. Throughout opening weekend of turkey season surveying was conducted at the
Shooting Tree Ridge Road access and resulted in a total of two surveys collected.
Despite this initial lack of success, during the next weekend of April 8-10, thirty-eight
surveys were collected at the Horsepasture Road and Bad Creek access points. The
36
fluctuation of use levels was also present during the next weekend of April 15-17, when a
total of eighteen surveys were again collected at the Horsepasture Road and Bad Creek
access points. The following weekend of April 22-24, surveying was conducted at
Horsepasture Road and Bad Creek and a total of sixteen surveys were collected. During
the final weekend of turkey hunting season, April 29-May 1, surveying was done at Doug
Mountain Angler Access Area, Horsepasture Road, and Musterground Road (Bad Creek),
which resulted in a total of fifteen surveys completed. The following weekend, May 6-7,
eleven total surveys were collected at the Dug Mountain Angler Access Area. During the
last weekend of the Spring sample, May 13-15, eleven more surveys were obtained at the
Bad Creek access and Dug Mountain Angler Access Area.
Summer Sample
The survey time framework for the 2005 Summer sample of the Jocassee Gorges
did not change to a large extent from the Spring sampling framework. Timeframes for
surveying during the Summer sampling frame included 9:00/10:00 a.m. to 1:00/2:00 p.m.
and 3:00/4:00 p.m. to 7:00/8:00 p.m. The first weekend in the Summer sample was
Memorial Day weekend (May 27-30) and resulted in a total of thirty-two surveys
collected from the Musterground Road access, Horsepasture Road access, and the Dug
Mountain Angler Access Area. A mid-summer sample was taken during the weekend of
June 18-19 at the Dug Mountain Angler Access area and Musterground Road, and
resulted in a total of eight surveys collected. During Independence Day weekend (July 2-
4), Dug Mountain Angler Access Area, Horsepasture Road, and Musterground Road
were surveyed for a total of sixteen surveys completed. During Labor Day weekend,
37
September 2-4, six surveys were collected from the Horsepasture and Musterground
Road accesses.
Fall Sample
During the Fall sample of 2005, the time framework had to change primarily
because of daylight savings time, but also to accommodate the different recreation types,
i.e., deer hunting, bear hunting, etc. The timeframes for Fall sampling of the Jocassee
Gorges included 8:00/9:00 a.m. to 12:00/1:00 p.m. and 1:00/2:00 p.m. to 5:00/6:00 p.m.
The first dates for the Fall sample were September 16-17, and resulted in a total of seven
surveys collected from the Horsepasture Road access. During the second week of
muzzleloader hunting season for deer, October 8-9, three surveys were collected from the
Horsepasture Road access. During October 21-23, seven surveys were obtained from the
Musterground Road access. During the last weekend of October 28-30, six surveys were
collected from Shooting Tree Ridge Road and Musterground Road. Throughout the first
weekend of November 4-6, twenty-one total surveys were obtained from the Bad Creek
access and Shooting Tree Ridge Road. The following weekend, November 12-13, ten
surveys were completed from the Horsepasture Road access. Surveying took place at
Shooting Tree Ridge Road the next weekend (19-21) and resulted in seven total surveys.
The last day of sampling was November 26 and resulted in five surveys from
Horsepasture Road.
Winter Sample
The Winter and Spring 2006 samples for the study included only the road counter
data. Table 1 shows the on-site intercept user survey figures broken down by the four
access points used during the study. Table 2 shows the different dates on which the

38
survey was administered in the Jocassee Gorges, the access points where the survey was
administered, and the number of surveys gathered for those dates.
Table 1: Figures of On-Site Intercept Survey by Access Area.
Access Point No. of Days Surveyed No. of Surveys Collected Bad Creek 17 89
Horsepasture/Laurel Valley 18 68 Doug Mountain/Eastatoee 7 50
Shooting Tree 11 28 Total 52 247
Table 2. Figures of On-Site Intercept Survey by Date.
Date Access Point(s) No. of Surveys Collected March 20, 26, 27 Horsepasture & Bad Creek 14 April 1, 2 Shooting Tree 2 April 8, 9, 10 Horsepasture & Bad Creek 38 April 15, 16, 17 Bad Creek & Horsepasture 12 April 22, 23, 24 Bad Creek & Horsepasture 16 April 29, 30 Horsepasture & Doug
Mountain 7
May 1 Bad Creek 8 May 6, 7 Doug Mountain 11 May 13, 14, 15 Bad Creek & Doug
Mountain 11
May 27, 28, 29, 30 Horsepasture, Doug Mountain & Bad Creek
32
June 18, 19 Doug Mountain & Bad Creek
8
July 2, 3, 4 Doug Mountain, Horsepasture, & Bad Creek
16
September 2, 3, 4 Horsepasture & Bad Creek 6 September 16, 17 Horsepasture 7 October 8, 9 Horsepasture 3 October 21, 23 Bad Creek 7 October 28, 29, 30 Shooting Tree & Bad Creek 6 November 4, 5, 6 Shooting Tree & Bad Creek 21 November 12, 13 Horsepasture 10 November 19, 21 Shooting Tree 7 November 26 Horsepasture 5
Total 247 Mail-In Survey
39
The scope of work for the project had initially planned on administering a mail-in
survey to follow the on-site survey of Jocassee Gorges users. The mail-in survey would
have been sent to those visitors who had initially agreed to volunteer for the on-site
survey and who also provided their address for the follow-up mail-in survey. After
completing the on-site questionnaire, visitors were asked whether they would agree to
give their address for a future mail-in survey (Appendix E). If the visitor agreed, their
name and address were recorded on a mail-in survey roster (Appendix F). The mail-in
survey was abandoned due to a lack of need for further information from on-site users.
Despite this, 79 of the total 247 respondents had agreed to receive a mail-in survey and
their contact information was recorded for future use. The mail-in survey addresses of
those visitors who agreed to participate in the mail-in survey were turned over to the
SCDNR and were not included in this thesis to protect their anonymity.
Traffic Counters
Two traffic counters were employed in the Jocassee Gorges during the
Spring/Summer and Fall/Winter seasons in which the roads were opened in order to get
an estimate of vehicles using the roads the SCDNR maintains. The two traffic counters
were placed at the Horsepasture Road access and the Shooting Tree Ridge Road access
for both seasons in which the roads were opened. The pair of traffic counters were
employed two days before the roads opened on September 15 and removed after the
roads closed on January 2. The traffic counters were again employed in the Spring of
2006, prior to the roads opening on March 20, and then again removed after the roads
closed May 10. Appendix G has a complete analysis of the road counter data.

40
Limitations of Study Methods
A number of weaknesses in the sampling methodology were identified. The
largest deficiency in the sampling was that researchers were limited in effectively
covering the Jocassee Gorges area. Due to the large size of the property (~43,000 acres),
one or two researchers effectively patrolling the Gorges area was logistically difficult.
This problem could be countered by placing more researchers in the field in order to
possibly intercept more visitors. A second limitation to the sampling methods for the
project was that researchers were advised not to enter the Jocassee Gorges property
during the turkey and deer hunting seasons. Turkey and deer seasons comprised well
over three-fourths of the time frame the Jocassee Gorges were opened to vehicle traffic.
Researchers were posted at the entrances of access points leading into the Gorges, and
intercepted people as they entered or left the property, rather than at the actual location of
their usage.
Another weakness in the sampling methodology was that visitors accessing the
Jocassee Gorges before 8:00 a.m. or after 7:00 p.m. were not intercepted by researchers.
Placing fixed surveying stations at entry points for visitors to survey themselves could
have been one solution to this weakness, as well as aid in maintaining the overall budget
for the study. With no researcher to help users understand and complete the survey, the
response rate of the survey would no doubt have suffered.
One last limitation in the sampling methodology was that despite researchers’
attempts to adequately sample users from each access point, the nature of each access
location prevented a truly proportionate sample of use. Several of the access points
received much higher levels of usage than others, and sacrificing researchers’ time and
41
project funds versus the total number of intercepts was a difficult balance. For example,
the first weekend of April resulted in only two surveys collected at the Shooting Tree
Ridge Road access, while the following weekend at Horsepasture Road and Bad Creek
accesses resulted in thirty-eight surveys.
Despite these shortcomings in the sampling methodology, the on-site survey
provided an attempt of obtaining a representative sample of Jocassee Gorges users.
Researchers rarely entered the Jocassee Gorges without making visitor contact at some
time during the day. Although undoubtedly some intercepts were lost to the sheer size of
the Gorges and the time restraints involved for researchers, it is felt that the vast majority
of visitors were captured in the study.
42
Part 2: Local Residents of the Jocassee Gorges
Sample Size
The sample size for the telephone survey was 748 total residents interviewed.
The total number of phone numbers collected by the Clemson University Telephone
Survey Laboratory was 7,068. During the survey, 2,644 refusals were taken (3,676 were
incomplete) by the interviewing laboratory, resulting in a participation rate of
approximately 22%. The participation rate was calculated through the following
operation: 7,068 (total phone numbers generated) - 3,676 (incomplete) = 3392; 748
(completed interviews) ÷ 3,392 (total number of residents contacted) = 22.05. Table 3
shows the characteristics of the sample taken during the telephone survey, broken down
by individual county.
Sampling Frame
The six counties surrounding the Jocassee Gorges property were identified and
included Rabun County in Georgia, Jackson and Transylvania Counties in North
Carolina, and Oconee, Pickens, and Greenville Counties in South Carolina. The six
counties were proportionately sampled according to population size and telephone
numbers were selected through random digit dialing. Zip codes for each of the six
counties were obtained for use by the Clemson University Telephone Survey Laboratory.
(Appendix L shows the six counties included in the telephone survey and each county’s
corresponding zip codes used for obtaining telephone numbers.
The telephone survey was finalized at the end of January 2006 and turned over to
the Sociology Department of Clemson University at the beginning of February. The

43
telephone surveying process began mid-February and took approximately three weeks to
complete. The final results of the telephone survey were returned to the Parks,
Recreation, and Tourism Management Department during March of 2006. The results
were returned in six separate SPSS (Statistical Package for the Social Sciences) files each
to its corresponding county, as well as the codebook for the questions included in the
survey in a Microsoft Excel spreadsheet.
Development of Telephone Survey
A structured interview schedule of questions was developed based on the study
objectives previously stated. In addition, information requested from the South Carolina
Department of Natural Resources (SCDNR) provided even further structure to the outline
of the telephone survey. The telephone survey was designed to provide more in-depth
information than the on-site survey. The questions included in the survey as well as the
overall script of the survey were evaluated and redrafted over the process of three weeks
through consultation with the SCDNR and personnel at the Clemson University
Telephone Survey Laboratory. The SCDNR wanted to ensure the residents surveyed
understood the nature of the study and that their answers were to be kept in the strictest of
anonymity and confidence. Clemson’s Telephone Survey Laboratory helped to make the
survey more efficient in terms of the process of analyzing the final results. The
Laboratory also helped to ensure the overall language of the telephone survey would be
understood by the vast majority of respondents.
Telephone Survey
Section one of the telephone survey established whether the respondents
understood exactly where the Jocassee Gorges area was located and whether or not they
44
used the property. The script used by the researchers included other local names used to
identify the Jocassee Gorges, such as Horsepasture, Laurel Valley, and Musterground
Mountain. If the respondent was knowledgeable about the Gorges location and had used
the area in the past twelve months, the researcher proceeded to section two of the survey.
If the respondent had not used the area in the past twelve months, the researcher
proceeded to the final section of the survey which collected information on background
characteristics of respondents.
Section two of the telephone survey contained questions on past use of the
Jocassee Gorges area by local residents. The same list of activities which was used in the
on-site survey was used in the telephone survey with only one exception. Instead of
‘Boated on Lake Jocassee,’ the phrase ‘Motor-boated on Lake Jocassee’ was used in
order to distinguish use between canoeing and kayaking and motor-boating. Rather than
asking respondents to identify the approximate number of days they had used the Gorges
area in the past twelve months, respondents were asked to identify a range of the
approximate number of days they had used the Gorges property during the past year. The
last question in section two asked respondents to identify approximately how many days
they thought they would use the Jocassee Gorges in the upcoming next twelve months.
Section three of the telephone survey dealt with local residents’ historical use of
the Jocassee Gorges. The first set of questions asked approximately how many years
residents had been using the Gorges, followed by an approximation of the number of
times the property was used each year. Respondents chose an approximate range
corresponding to their use. Residents were asked if they could identify the first year they
began using the Jocassee Gorges, and if possible, the year was recorded. The final two

45
questions asked residents to identify, if they could, their primary and any secondary
activities for using the Gorges property in the past. When hunting and/or fishing were
identified by residents as their activity, the resident was asked to further identify what
type of hunting or fishing they participated in at the Gorges.
Section four of the telephone survey asked about residents’ use patterns within the
Jocassee Gorges. Residents were first asked to identify major areas or locations they
used within the Gorges property, followed by what months of the year they used those
areas the most frequently. The next two questions asked how many people were in a
normal group visiting the Gorges area, and whether the resident used the Gorges by
themselves, or accompanied by friends, family, an organized group, or with a dog. Local
residents were asked whether they used the Jocassee Gorges area more, less, or about the
same since it became managed by the SCDNR, or whether the resident had never used
the area before the SCDNR took over management of the property.
The use level question was followed by residents being asked whether their
recreation had changed in any way over time in the Jocassee Gorges. If respondents
answered ‘no,’ the researcher skipped to the background characteristics section of the
survey. If respondents said their recreation had changed over time, they were then asked
whether their recreation had changed according to frequency, location, type of activity, or
the number of members in the party visiting the Jocassee Gorges. The next question
asked the resident to identify exactly what had caused that change in their recreation.
The last question asked residents as to whether they valued their recreational experience
at the Jocassee Gorges more, less, or about the same as other state-managed areas.
‘State-managed areas’ included areas such as South Carolina State Parks, and other

46
Wildlife Management Areas managed by the SCDNR. Residents could also choose the
option of ‘does not apply’ to their use for this question if they could not answer the
question.
Age, gender, education level, occupation, total household income, and the total
number of members in their household were recorded in section five. Residents were
asked how many of the members in their household were under the age of eighteen, and
what the closest village or community was to their residence. Local residents were then
asked whether they were a member of any conservational, environmental, hunting, or
fishing organization, and if so, that organization was recorded. Residents were asked to
identify any hunting, fishing, conservational, or environmental magazines they
commonly read. Residents were asked if they had anything in mind which they would
like to see changed in the management of the Jocassee Gorges. The last question of the
survey asked respondents for any additional comments they may have had for the
SCDNR.
Table 3. Characteristics of Telephone Survey Sample by County.
County Total # of Telephone Numbers
# Incomplete # Surveys Refused
# Completed Surveys
Rabun County (GA)
375 246 117 23
Jackson County (NC)
366 213 129 30
Transylvania County (NC)
363 185 147 36
Greenville County (SC)
3964 2259 1360 323
Oconee County (SC)
1000 391 411 198
Pickens County (SC)
1000 382 480 138
Totals 7068 3676 2644 748
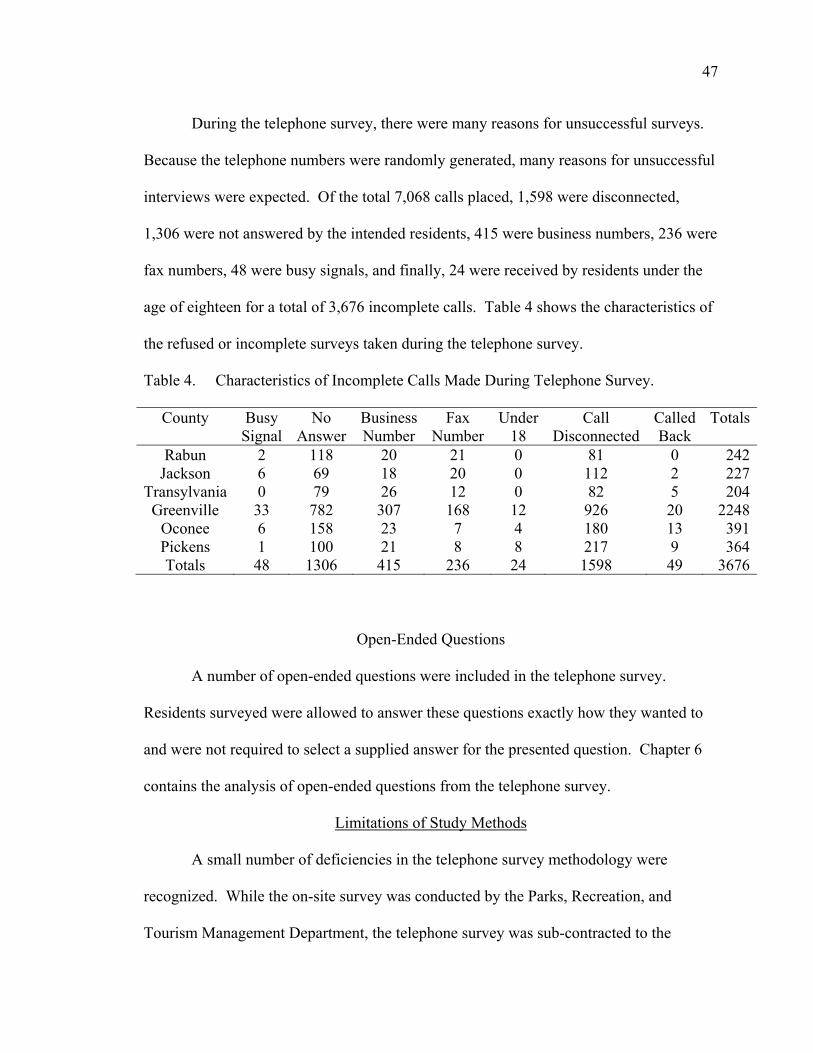
47
During the telephone survey, there were many reasons for unsuccessful surveys.
Because the telephone numbers were randomly generated, many reasons for unsuccessful
interviews were expected. Of the total 7,068 calls placed, 1,598 were disconnected,
1,306 were not answered by the intended residents, 415 were business numbers, 236 were
fax numbers, 48 were busy signals, and finally, 24 were received by residents under the
age of eighteen for a total of 3,676 incomplete calls. Table 4 shows the characteristics of
the refused or incomplete surveys taken during the telephone survey.
Table 4. Characteristics of Incomplete Calls Made During Telephone Survey.
County Busy Signal
No Answer
Business Number
Fax Number
Under 18
Call Disconnected
Called Back
Totals
Rabun 2 118 20 21 0 81 0 242Jackson 6 69 18 20 0 112 2 227
Transylvania 0 79 26 12 0 82 5 204Greenville 33 782 307 168 12 926 20 2248
Oconee 6 158 23 7 4 180 13 391Pickens 1 100 21 8 8 217 9 364Totals 48 1306 415 236 24 1598 49 3676
Open-Ended Questions
A number of open-ended questions were included in the telephone survey.
Residents surveyed were allowed to answer these questions exactly how they wanted to
and were not required to select a supplied answer for the presented question. Chapter 6
contains the analysis of open-ended questions from the telephone survey.
Limitations of Study Methods
A small number of deficiencies in the telephone survey methodology were
recognized. While the on-site survey was conducted by the Parks, Recreation, and
Tourism Management Department, the telephone survey was sub-contracted to the

48
Sociology Department. Due to this, researchers from the Sociology Department were
asking local residents of the Gorges questions concerning their use of the area instead of
Parks and Recreation students. The telephone survey laboratory researchers’ outside
knowledge of the Jocassee Gorges was minimal, yet their experience with telephone
surveying was extensive. Due to their lack of outside knowledge of the Gorges area,
interviewers could not probe or answer related questions of interviewees. The other
weakness in the methodology of the telephone survey was that part of the dataset for the
survey accidentally had the gender variable omitted from approximately 41% of the
entire sample population due to operators’ error. Despite these shortcomings, the
Sociology Department performed professionally and conducted good quality data for the
study.

49
CHAPTER 4
DESCRIPTIVE CHARACTERISTICS OF JOCASSEE
GORGES VISITORS
Introduction
In order to effectively manage the Jocassee Gorges, the SCDNR must know what
types of users are visiting the area along with the types of recreation they are pursuing
within the property. One of the six objectives for this study was to determine a profile of
users of the Jocassee Gorges. The user profile was established using characteristics such
as individual residence, age, gender, group composition, occupation, education, and
experience use history at the Jocassee Gorges. This data would allow the South Carolina
Department of Natural Resources (SCDNR) to have a deeper understanding of what type
of people visit the Jocassee Gorges and enable them to use this information in
implementing management strategies.
Another of the six objectives was to determine what types of outdoor recreation
activities occur in the Jocassee Gorges. This objective was determined by identifying all
primary activities as well as any possible secondary activities users were participating in
at the Gorges. The SCDNR should be able to use the visitor profile established through
this project as a management tool for future managerial decisions concerning both the
providing for recreation opportunities and the maintaining of the natural character of the
Jocassee Gorges.
Visitors identified the locations they were traveling to within the Jocassee Gorges
by using their own knowledge or a map the field researcher provided. Roughly one-half

50
of Gorges visitors either did not know exactly where they were going because it was their
first trip to the area, or they did not have an exact destination and were planning to
explore the property. The access point used by on-site visitors was recorded in addition
to any possible primary and/or secondary use areas visitors identified during surveying,
addressing the second (spatial distribution of use) and third (most frequently used areas)
objectives of the study. The additional part of the second objective (temporal
distribution) was addressed in recording the date of each intercept survey. The remaining
two objectives (5 and 6) are addressed later in this paper.
Jocassee Gorges Visitor Profile
The average age of the Jocassee Gorges visitor was 42 years old, with a range of
ages from 15 to 75 years. The most common age range was 45-49 years, followed
closely by the 40-44 year range. Over 62% of users fell within the age range of 29-55
years (Table 5). Males accounted for approximately 83% of Jocassee Gorges visitors,
while females accounted for nearly 17%.
Table 5. Age Distribution of Jocassee Gorges Visitors.
Age Range % of Jocassee Gorges Visitors (n=246) 15-19 4.1 20-24 6.9 25-29 9.7 30-34 11.0 35-39 9.3 40-44 13.3 45-49 14.1 50-54 12.5 55-59 7.3 60-64 4.9 65-75 6.9
Mean=42 100%

51
Education level was divided into six categories: 1) less than high school, 2) high
school, 3) associate’s degree, 4) bachelor’s degree, 5) graduate degree, and 6) doctoral
degree. The ‘less than high school’ category contained users who had not graduated high
school or obtained a GED equivalency degree. The ‘high school’ category was
comprised of users who had graduated from high school. The ‘associate’s degree’
category was made up of users who had obtained an associate’s degree after graduating
high school. The ‘bachelor’s degree’ category contained users who had obtained a
bachelor’s degree from a college or university. The ‘graduate degree’ category was
comprised of users who had obtained a post graduate degree after completing college.
The ‘doctoral degree’ category contained users who had obtained a Ph.D. degree.
The most common level of education of users was the high school category,
comprising 27.9% of the sample. The second most common education level was a
bachelor’s degree, containing 23.9% of users. Visitors with an associate’s degree
represented 17.8% of the sample, and exactly 15.0% of the population had a graduate
degree. Interesting to note is that the percentage for less than high school-educated users
was equal to that of doctoral degree-educated users, at exactly 7.7% (Table 6).
Table 6. Education Levels of Jocassee Gorges Visitors.
Education % of Jocassee Gorges Visitors (n=245) Less Than High School 7.7
High School 27.9 Associate’s Degree 17.8 Bachelor’s Degree 23.9 Graduate Degree 15.0 Doctoral Degree 7.7
100%
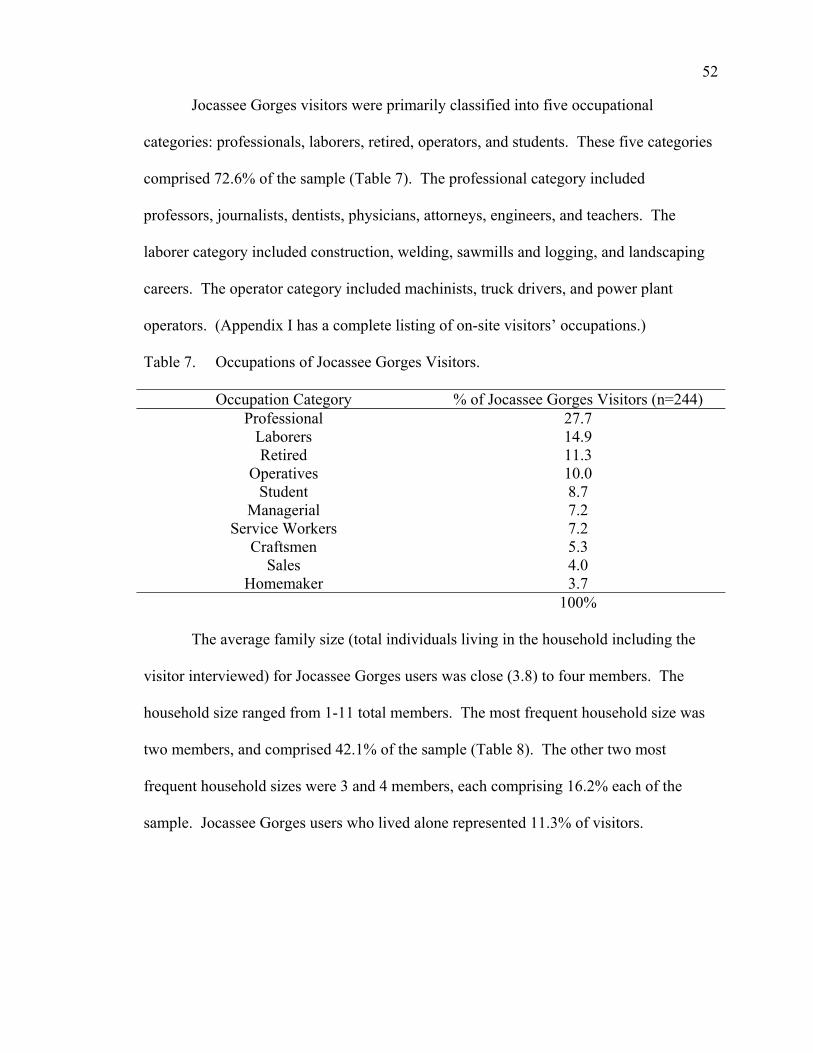
52
Jocassee Gorges visitors were primarily classified into five occupational
categories: professionals, laborers, retired, operators, and students. These five categories
comprised 72.6% of the sample (Table 7). The professional category included
professors, journalists, dentists, physicians, attorneys, engineers, and teachers. The
laborer category included construction, welding, sawmills and logging, and landscaping
careers. The operator category included machinists, truck drivers, and power plant
operators. (Appendix I has a complete listing of on-site visitors’ occupations.)
Table 7. Occupations of Jocassee Gorges Visitors.
Occupation Category % of Jocassee Gorges Visitors (n=244) Professional 27.7
Laborers 14.9 Retired 11.3
Operatives 10.0 Student 8.7
Managerial 7.2 Service Workers 7.2
Craftsmen 5.3 Sales 4.0
Homemaker 3.7 100%
The average family size (total individuals living in the household including the
visitor interviewed) for Jocassee Gorges users was close (3.8) to four members. The
household size ranged from 1-11 total members. The most frequent household size was
two members, and comprised 42.1% of the sample (Table 8). The other two most
frequent household sizes were 3 and 4 members, each comprising 16.2% each of the
sample. Jocassee Gorges users who lived alone represented 11.3% of visitors.

53
Table 8. Composition of Families Visiting the Jocassee Gorges.
Total Family Size % of Jocassee Gorges Visitors (n=244) 1 11.3 2 42.1 3 16.2 4 16.2 5 7.7 6 3.8 ≥7 2.7
Mean=3.8 100% Most Jocassee Gorges users resided in either urban areas having populations
between 10,000 and 100,000 people (e.g., city) or small towns with populations less than
10,000 people. Users living in cities accounted for 37.8% of the entire sample, while
those visitors living in small towns represented 33.6% of visitors (Table 9).
Table 9. Size of Places of Residence and Distribution of Jocassee Gorges Visitors.
Place of Residence % of Jocassee Gorges Visitors (n=245) Metropolitan Area (100,000-1,000,000) 11.2 City (10,000-99,999) 37.8 Small Town (1,000-9,999) 33.6 Rural Community (<1,000) 17.4
100% The largest percentage of Jocassee Gorges users comprised residents of South
Carolina, being 78.5% of the sample (Table 10). North Carolina residents accounted for
9.4%, and Georgia residents accounted for almost 8% of visitors. Other states of
residence reported by visitors included Florida, Tennessee, Pennsylvania, Michigan, and
Missouri. The town of Pickens was the most reported place of residence, accounting for
13.1% of users, followed closely by the city of Greenville, which represented 11.7% of
visitors. Other cities and towns having notable representation within the sample included
Easley, Seneca, Anderson, and Clemson, South Carolina (Table 10).

54
Table 10. States of Residence and Most Common Places of Residence of Jocassee Gorges Visitors.
State of Residence % of Jocassee Gorges Visitors (n=245) South Carolina 78.5
Pickens (13.1) Greenville (11.7)
Easley (8.1) Seneca (5.3)
Anderson (4.5) Six Mile (3.2) Clemson (2.8)
North Carolina 9.4 Rosman (3.2) Georgia 7.7 Atlanta (2.4) Florida 2.0
Tennessee 1.2 Other States 1.2
100%
User Profile Summary
In summary, based on our on-site intercept survey of 263 users of the Jocassee
Gorges, the average visitor was 42 years old and was at least a high school graduate. On-
site users had a professional type occupation and lived with a family of four. On-site
visitors were residents of the state of South Carolina (from a town or small city), and
most frequently resided in the town of Pickens or city of Greenville.
Visitor Activities
Jocassee Gorges users coming to the area for less than one day and not staying
overnight represented 63.5% of the sample (Table 11). The average length of a day trip
to the Gorges lasted approximately four hours. The most frequent day trip length was
between the range of 3-4 hours, accounting for over half (51.6%) of visitors.

55
Table 11. Length of Stay of Jocassee Gorges Day Visitors Measured in Hours.
Length of Day Visit (Hours) % of Jocassee Gorges Visitors (n=157) 1 9.6 2 14.0 3 24.2 4 27.4 5 7.6 6 7.0 7 4.5 8 3.8
>8 1.9 Mean=3.8 100%
Jocassee Gorges visitors who stayed overnight represented 36.5% of the sample.
A one-night trip was the most common overnight outing for Jocassee Gorges users,
accounting for 55.1% of visitors (Table 12). Overnight trips ranged from 1-7 nights
however, only 16.8% of the remaining users stayed for four or more nights during their
trips to the Gorges.
Table 12. Length of Stay of Jocassee Gorges Overnight Visitors Measured in Days.
Length of Overnight Visit (Days) % of Jocassee Gorges Visitors (n=89) 1 55.1 2 19.1 3 9.0 4 9.0 5 1.1 6 4.5 7 2.2
Mean=2.05 100% Nearly one-quarter (23.7%) of visitors had only been using the Jocassee Gorges
for one year. The average number of years Jocassee Gorges visitors had been using the
property was approximately 10.5 years. Historical use included a large range, from 1-60
years; however, most users had not been using the property for longer than 10 years.
People who had been coming to the Gorges for more than 10 years accounted for about

56
one-third (33.5%) of the sample. Visitors who had been using the Jocassee Gorges area
for 1-10 years represented 66.5%. Jocassee Gorges visitors who had been using the area
for 1-4 years represented over forty percent (40.4%) of the sample, followed by those
who had used the property for 5-8 years accounting for 17.5% of visitors. Table 13
shows the historical use of the Jocassee Gorges area by visitors measured in years.
Table 13. Historical Use of Jocassee Gorges Visitors Measured in Years.
Historical Use (Years) % of Jocassee Gorges Visitors (n=245) 1 23.7 2 6.1 3 6.9 4 3.7 5 7.3 6 3.7
7-8 6.5 9-10 8.6 11-12 2.6 13-16 8.4 17-20 7.7 21-30 8.8 31-40 4.0 41-50 2.0
Mean=10.5 100% A large percentage of visitors (21.4%) reported only having used the area once
per year because it was their first visit to the Gorges. The average number of times (e.g.,
frequency) Jocassee Gorges visitors used the area was approximately 17.5 times per year.
Users who reported using the area 2-4 times each year represented 26.6% of visitors
(Table 14), and Jocassee Gorges visitors reporting 5-9 visits each year accounted for
15.8%. Users who reported using the Gorges 10-20 times each year represented 15.8%
of the sample, while over one-fifth (20.4%) of visitors reported more than 20 visits each
year.

57
Table 14. Number of Visits per Year to the Jocassee Gorges by Visitors.
Times per Year Visited Jocassee Gorges % of Jocassee Gorges Visitors (n=244) 1 21.4
2-4 26.6 5-9 15.8
10-20 15.8 >20 20.4
Mean=17.5 100% The primary activity for a large percentage of users (37.7%) during their outing to
the Jocassee Gorges was day hiking. Fishing was the second most frequent activity
reported by users, accounting for about one-quarter (24.7%) of the sample (Table 15).
The third most frequent activity was backpacking overnight (12.5%), followed by
hunting (8.1%). Driving the property to sightsee and driving ATVs or OHVs combined,
accounted for 10.2% of visitors. Other activities primarily referred to camping but not
backpacking and represented 3.2% of visitors. Visitors who photographed nature at the
Gorges represented 1.6%, and users visiting waterfalls accounted for 1.2%. Visitors
looking for wildflowers and those who canoed or kayaked in the area each accounted for
just 0.4% of visitors.
Table 15. Primary Activities of Jocassee Gorges Visitors.
Primary Activity Percentage of Jocassee Gorges Visitors (n=247) Day Hiked on Trails 37.7 Went Fishing 24.7 Backpacked Overnight 12.5 Went Hunting 8.1 Drove Area to Sightsee 5.3 Drove ATV 4.9 Other 3.2 Photographed Nature 1.6 Visited Waterfalls 1.2 Looked for Wildflowers .4 Canoed or Kayaked .4
100%

58
Jocassee Gorges visitors who reported a secondary activity during their trip to the
area represented 24.7% (n=61) of all users. Day hiking on trails was the most frequent
secondary activity, accounting for over a third (34.6%) of use. Anglers accounted for
21.3% of visitors, followed by visitors who photographed nature, which represented
almost ten percent (9.8%) of users. Table 16 shows the secondary activities chosen by
Jocassee Gorges visitors and the corresponding percentages of the sample.
Table 16. Secondary Activities of Jocassee Gorges Visitors.
Secondary Activity % of Jocassee Gorges Visitors (n=61) Day Hiked on Trails 34.6 Went Fishing 21.3 Photographed Nature 9.8 Other 6.6 Visited Waterfalls 4.9 Drove ATV 4.9 Boated on Lake Jocassee 4.9 Went Hunting 3.3 Drove Area to Sightsee 3.3 Backpacked Overnight 1.6 Canoed or Kayaked 1.6 Looked for Wildflowers 1.6 Mountain Biked 1.6
100% The number of days visitors had participated in each of the activities within the
last twelve months was measured. Day hiking on trails was the most popular activity
(60.3%). Of those, 28.8% had day hiked 1-3 days, 11.9% had day hiked 4-6 days, and
7.2% had gone hiking more than 25 days (Table 17). Visitors who mountain biked at the
Gorges represented 7.7% of the sample. Within that fraction of visitors, 4.4% had
mountain biked 1-3 days, and 1.6% had gone biking 4-6 days.
Jocassee Gorges visitors who had driven ATVs represented just over one-tenth
(10.9%) of the sample. Of those users, 4.4% had ridden ATVs 1-3 days in the previous
59
year, yet 2.4% had been over 25 days. Driving the area to sightsee comprised over one-
third (43.3%) of the sample, of which 20.6% had been sightseeing for 1-3 days. Visitors
who had driven the area 4-6 days represented 8.4% of the sample, and about five percent
(4.8%) of sightseers had been participating more than 25 days (Table 17).
Almost twenty percent (17.4%) of users were overnight backpackers. Within that
group, 11.2% had been backpacking for 1-3 days and 2.8% had backpacked for 4-6 days.
Jocassee Gorges hunters represented 16.2%, of which 4.0% had hunted for 1-3 days,
2.4% had been for 4-6 days and 10-12 days. Almost five percent (4.8%) of hunters
participated for more than 25 days at the Jocassee Gorges (Table 17).
Well over one-third (40.1%) of Jocassee Gorges visitors were anglers, of which
13.3% had been fishing for 1-3 days, 6.0% had fished for 10-12 days, and about ten
percent (10.6%) had fished over 25 days during the past year. Canoeists and kayakers
accounted for 8.9% of visitors, of which 4.0% had gone for 1-3 days. Comparatively,
17.8% of users had been boating on Lake Jocassee, of which 8.0% had boated for 1-3
days, 3.2% of boaters had gone for 4-6 days, and 2.4% had boated for 10-12 days.
Visitors who had watched wildlife comprised almost one-third (29.1%) of visitors
to the Jocassee Gorges, of which 11.7% had gone for 1-3 days and 5.2% watched for 4-6
days. Users who came to the area to look for wildflowers accounted for over twenty
percent (20.6%) of visitors, of which 8.9% had participated for 1-3 days, and 3.6% had
been for more than 25 days. Visitors who traveled to the Gorges to photograph nature
represented about one-third (30.6%) of the sample. Among photographers, 18.7% had
photographed nature for 1-3 days, and 3.2% had been for more than 25 days.

60
A large portion of Jocassee Gorges visitors (45.7%) had come to the area to visit
waterfalls during the last year. Among users traveling to waterfalls, over twenty percent
(22.7%) had been for 1-3 days, and 8% had been for 4-6 days in the last year. Over one-
tenth (12.6%) of users visited historic sites in the Jocassee Gorges, of which 7.2% had
been for 1-3 days. Other activities consisted largely of visitors who had been camping or
swimming and accounted for 2.0% of the sample.
Table 17. Number of Days of Activity Participation within Last Twelve Months of Jocassee Gorges Visitors.
Activity % of Jocassee Gorges Visitors (Days) (n=247) Total
% 1-3 4-6 7-
9 10-12
13-15
16-21
22-24
≥25 Avg. #
Day Hiked on Trails
60.3 28.8 11.9 2.4 5.6 3.2 1.6 0.4 7.2 11.3
Visited Waterfalls 45.7 22.7 8.8 1.2 5.2 1.2 3.6 0.4 2.4 10.8 Drove Area to Sightsee
43.3 20.6 8.4 1.2 4.4 1.6 1.6 0.4 4.8 11.2
Went Fishing 40.1 13.3 5.2 1.2 6.0 1.6 1.2 0.4 10.6 25.5 Photographed Nature
30.6 18.7 5.2 1.2 4.0 1.2 - - 3.2 10.6
Watched Wildlife 29.1 11.7 5.2 0.4 3.6 0.4 0.8 - 5.6 36.5 Looked for Wildflowers
20.6 8.9 4.4 0.4 1.6 1.2 0.4 - 3.6 13.5
Boated on Lake Jocassee
17.8 8.0 3.2 0.4 2.4 0.4 1.2 0.4 1.6 9.0
Backpacked Overnight
17.4 11.2 2.8 0.8 1.2 - 0.4 0.4 0.4 5.3
Went Hunting 16.2 4.0 2.4 0.8 2.4 0.4 1.2 - 4.8 19.5 Visited Historic Sites
12.6 7.2 2.0 - 0.8 0.4 0.4 - 1.2 7.6
Drove ATV 10.9 4.4 1.6 0.8 0.4 0.4 0.8 - 2.4 14.5 Canoed or Kayaked 8.9 4.0 2.0 0.4 - 0.8 0.8 - 0.8 11.1 Mountain Biked 7.7 4.4 1.6 - 0.8 0.4 - - 0.4 9.0 Other 2.0 1.6 - 0.4 - - - - - 3.0 The Jocassee Gorges visitors who reported hunting or fishing as their primary
activities were asked several other questions to collect further information. Hunters were
asked to specify the species, whether bear, deer, or other small game (squirrel, rabbit,
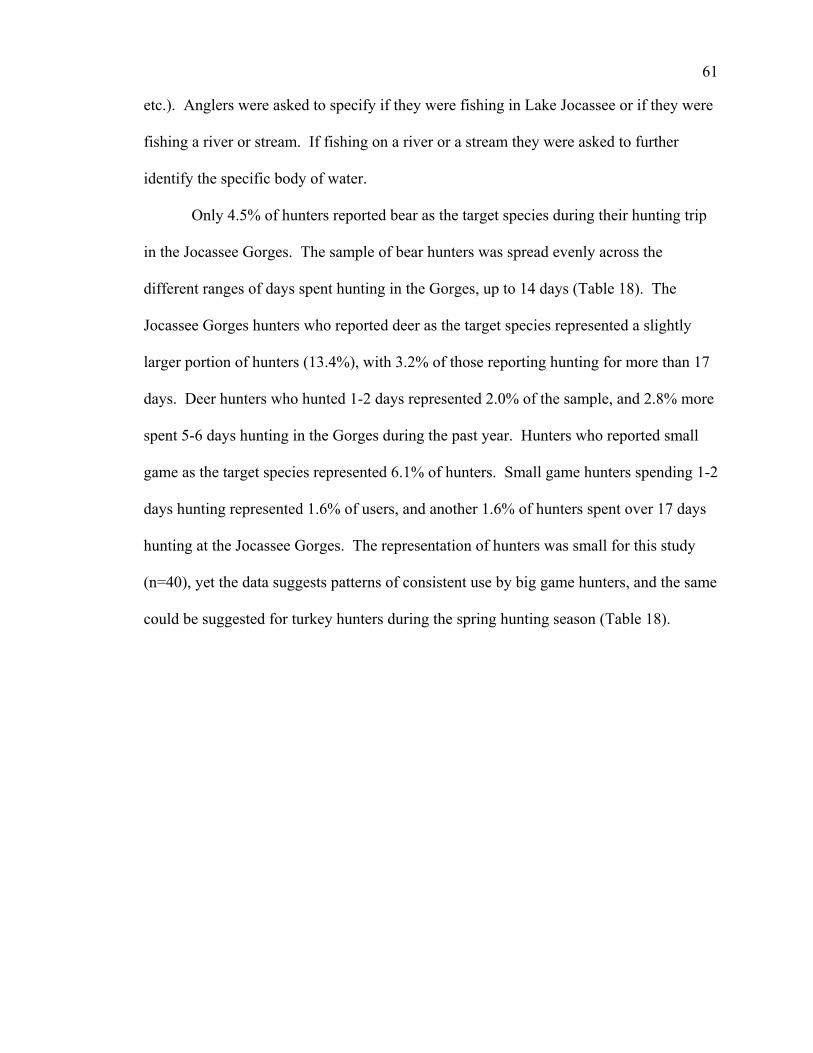
61
etc.). Anglers were asked to specify if they were fishing in Lake Jocassee or if they were
fishing a river or stream. If fishing on a river or a stream they were asked to further
identify the specific body of water.
Only 4.5% of hunters reported bear as the target species during their hunting trip
in the Jocassee Gorges. The sample of bear hunters was spread evenly across the
different ranges of days spent hunting in the Gorges, up to 14 days (Table 18). The
Jocassee Gorges hunters who reported deer as the target species represented a slightly
larger portion of hunters (13.4%), with 3.2% of those reporting hunting for more than 17
days. Deer hunters who hunted 1-2 days represented 2.0% of the sample, and 2.8% more
spent 5-6 days hunting in the Gorges during the past year. Hunters who reported small
game as the target species represented 6.1% of hunters. Small game hunters spending 1-2
days hunting represented 1.6% of users, and another 1.6% of hunters spent over 17 days
hunting at the Jocassee Gorges. The representation of hunters was small for this study
(n=40), yet the data suggests patterns of consistent use by big game hunters, and the same
could be suggested for turkey hunters during the spring hunting season (Table 18).
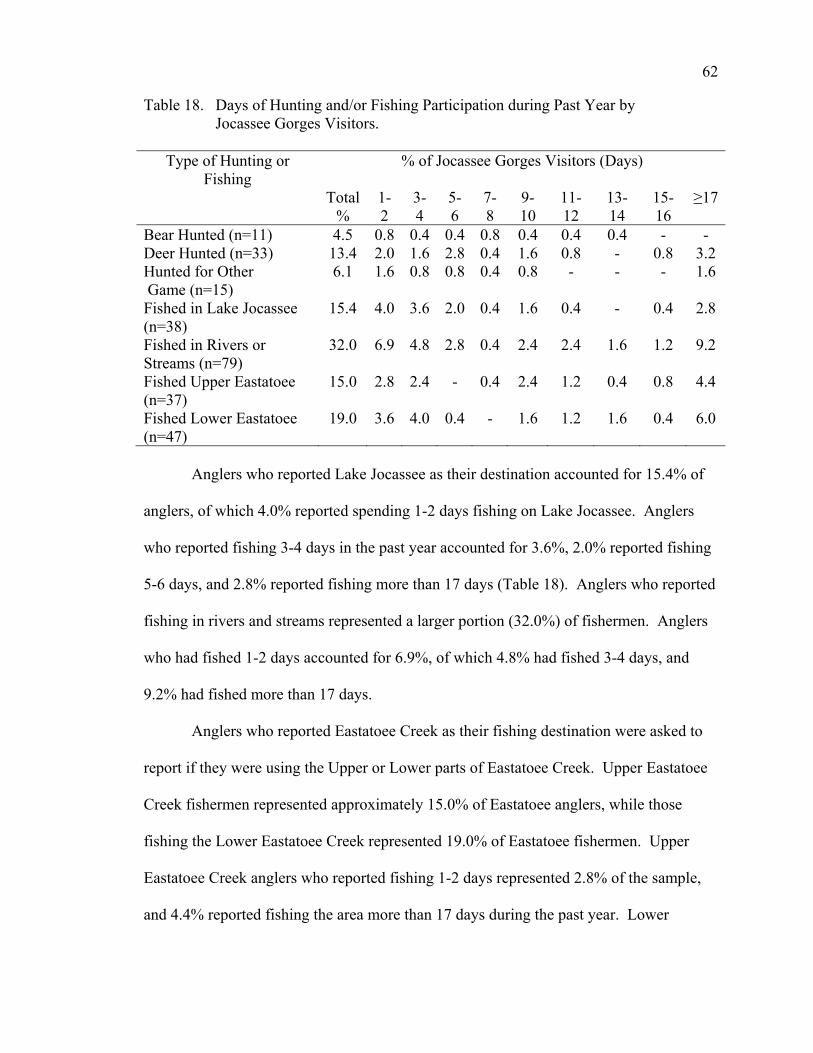
62
Table 18. Days of Hunting and/or Fishing Participation during Past Year by Jocassee Gorges Visitors.
Type of Hunting or Fishing
% of Jocassee Gorges Visitors (Days)
Total%
1-2
3-4
5-6
7-8
9-10
11-12
13-14
15-16
≥17
Bear Hunted (n=11) 4.5 0.8 0.4 0.4 0.8 0.4 0.4 0.4 - - Deer Hunted (n=33) 13.4 2.0 1.6 2.8 0.4 1.6 0.8 - 0.8 3.2 Hunted for Other Game (n=15)
6.1 1.6 0.8 0.8 0.4 0.8 - - - 1.6
Fished in Lake Jocassee (n=38)
15.4 4.0 3.6 2.0 0.4 1.6 0.4 - 0.4 2.8
Fished in Rivers or Streams (n=79)
32.0 6.9 4.8 2.8 0.4 2.4 2.4 1.6 1.2 9.2
Fished Upper Eastatoee (n=37)
15.0 2.8 2.4 - 0.4 2.4 1.2 0.4 0.8 4.4
Fished Lower Eastatoee (n=47)
19.0 3.6 4.0 0.4 - 1.6 1.2 1.6 0.4 6.0
Anglers who reported Lake Jocassee as their destination accounted for 15.4% of
anglers, of which 4.0% reported spending 1-2 days fishing on Lake Jocassee. Anglers
who reported fishing 3-4 days in the past year accounted for 3.6%, 2.0% reported fishing
5-6 days, and 2.8% reported fishing more than 17 days (Table 18). Anglers who reported
fishing in rivers and streams represented a larger portion (32.0%) of fishermen. Anglers
who had fished 1-2 days accounted for 6.9%, of which 4.8% had fished 3-4 days, and
9.2% had fished more than 17 days.
Anglers who reported Eastatoee Creek as their fishing destination were asked to
report if they were using the Upper or Lower parts of Eastatoee Creek. Upper Eastatoee
Creek fishermen represented approximately 15.0% of Eastatoee anglers, while those
fishing the Lower Eastatoee Creek represented 19.0% of Eastatoee fishermen. Upper
Eastatoee Creek anglers who reported fishing 1-2 days represented 2.8% of the sample,
and 4.4% reported fishing the area more than 17 days during the past year. Lower

63
Eastatoee Creek anglers who reported fishing 1-2 days accounted for 3.6%, and 6.0%
reported fishing the Lower section more than 17 days (Table 18). The large
representation of Eastatoee Creek anglers was probably due to the Dug Mountain Angler
Access Area (located on Eastatoee Creek) being a targeted location for field surveying.
The anglers who reported Eastatoee Creek as their destination accounted for
76.0% of anglers who reported their specific fishing destination, followed by anglers
going to Whitewater River and Horsepasture River, which both represented 7.4%. Laurel
Fork Creek and the Thompson River both accounted for 3.4% of anglers (Table 19). The
Toxaway River and Cane Creek had small representations of Jocassee Gorges anglers.
Table 19. Rivers and Streams Fished by Jocassee Gorges Visitors.
River or Stream Fished % of Jocassee Gorges Visitors (n=81) Eastatoee Creek 76.0
Whitewater River 7.4 Horsepasture River 7.4 Laurel Fork Creek 3.4 Thompson River 3.4 Toxaway River 1.2
Cane Creek 1.2 100%
User Locations
Almost half of visitors (49.4%, n=122) were able to give an approximate
destination for their journey within the Jocassee Gorges (Table 20). The most frequently-
traveled to destination was Whitewater Falls (35.2%), followed closely by the Eastatoee
River (27.0%). The Foothills Trail was the third most reported destination, but the
Eastatoee Valley Trail was reported by 10.7% of users.

64
Table 20. Primary Use Locations Reported by Jocassee Gorges Visitors.
Primary Use Area % of Jocassee Gorges Visitors (n=122) Whitewater Falls 35.2 Eastatoee River 27.0 Foothills Trail 14.8
Eastatoee Valley Trail 10.7 Shooting Tree Ridge Road 9.0
Thompson River 3.3 100%
Users identified secondary locations or areas within the Jocassee Gorges which
they might be traveling to or used during their outing. Although only a small portion of
visitors answered this question (17.4%, n=43), the data does provide some insight into
where users may be traveling to after their primary destination has been reached (Table
21). The most reported secondary use area was the Horsepasture Road (41.8%), followed
by the Bad Creek access (18.6%). Users who reported Lake Jocassee and the Foothills
Trail accounted for 27.9% of secondary destination visitors.
Table 21. Secondary Use Areas of Jocassee Gorges Visitors.
Secondary Use Area % of Jocassee Gorges Visitors (n=43) Horsepasture Road 41.8
Bad Creek 18.6 Lake Jocassee 16.3 Foothills Trail 11.6
Whitewater River 4.7 Toxaway River 4.7
Shooting Tree Ridge Road 2.3 100%
Although many Jocassee Gorges visitors were not able to accurately report where
their primary and secondary areas of use were located within the Jocassee Gorges, the
location of the researchers’ user-intercept samples provided some insight into the spatial
distribution of use in the Jocassee Gorges (Table 22). The access area with the most
intercepts of visitors was the Bad Creek access, accounting for 44.1% of the sample. The

65
Horsepasture Road access comprised the second highest number of intercepts,
representing (27.5%) of visitors. Dug Mountain Angler Access Area accounted for
21.9% of users, followed last by the Shooting Tree Ridge Road access (6.9%).
Table 22. Distribution of Access Area Use by Jocassee Gorges Visitors.
Access Area % of Jocassee Gorges Visitors (n=247) Bad Creek (Musterground Road) 44.1
Horsepasture Road 27.5 Dug Mountain Angler Access 21.9
Shooting Tree Ridge Road 6.5 100%
Visitors were asked how they discovered the Jocassee Gorges however, the
question was added to the intercept survey during the final sampling dates, and therefore
the resulting sample was small (n=58). Friends or family were the largest information
source by which Gorges visitors had learned about the area (43.1%), followed by users
who had been born in the area (25.9%). Written publications represented 15.5% of the
sample, and the internet accounted for 12.1% of users (Table 23).
Table 23. Methods of Discovery of the Jocassee Gorges by On-Site Users.
Discovery of Jocassee Gorges % of Jocassee Gorges Visitors (n=58) Friends or Family 43.1
Born in Area 25.9 Written Publication 15.5
Internet 12.1 Driving Through Area 3.4
100%
Use Area Summary
In summary, based on our on-site intercept survey of 263 visitors, the average
Jocassee Gorges user has been using the area for 10.5 years, and usually comes to the
Gorges about 17 times each year. Also, the typical user coming to the Gorges for a day

66
trip stays four hours, and overnight visitors spent about two days within Gorges. The
usual primary, as well as secondary, activity of Jocassee Gorges visitors is either day
hiking or fishing. Day hikers usually hike approximately eleven days each year; most of
the time to find waterfalls, and anglers spend over 25 days fishing each year in the
Gorges. Anglers fished the Eastatoee Creek most often and usually for 1-4 days each
year. The typical Jocassee Gorges user enters the area at either the Horsepasture Road
access or the Bad Creek access (Musterground Road).

67
CHAPTER 5
DESCRIPTIVE CHARACTERISTICS OF LOCAL RESIDENTS
OF THE JOCASSEE GORGES
Introduction
The strategy of the telephone survey of the surrounding population of the Jocassee
Gorges was different from the on-site intercept survey of users, but the same objectives
of the study were used in designing the structure of the survey. Information about local
residents of the Jocassee Gorges could allow the South Carolina Department of Natural
Resources (SCDNR) to implement management strategies more effectively.
Table 24. Counties and Number of Zip Codes Used in Telephone Survey.
County Number of Zip Codes Rabun County 21
Jackson County 29 Transylvania County 27 Greenville County 60
Oconee County 40 Pickens County 33
Profile of Local Residents of the Jocassee Gorges
The average age of the Jocassee Gorges resident was approximately 42 years old.
The most common age range was from 45-54 years old (20.6%), followed closely by the
55-64 year old range (Table 25). Females accounted for approximately 56% of the
sample, and males represented 44%.
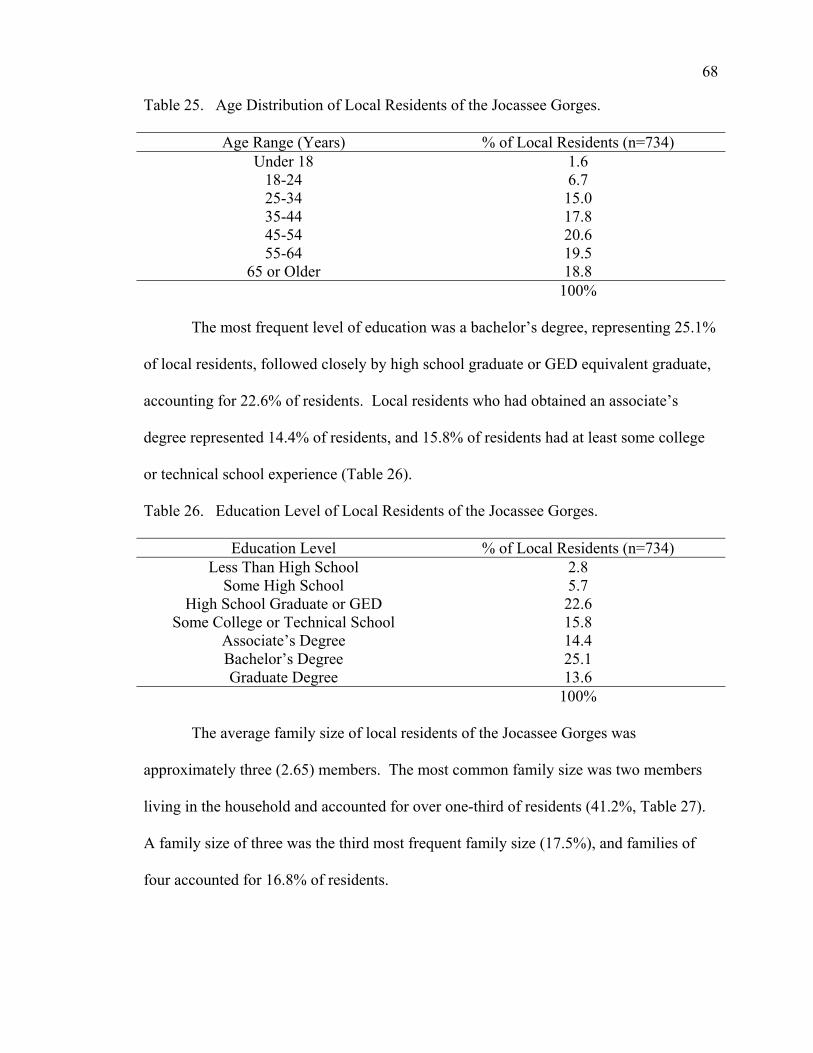
68
Table 25. Age Distribution of Local Residents of the Jocassee Gorges.
Age Range (Years) % of Local Residents (n=734) Under 18 1.6
18-24 6.7 25-34 15.0 35-44 17.8 45-54 20.6 55-64 19.5
65 or Older 18.8 100%
The most frequent level of education was a bachelor’s degree, representing 25.1%
of local residents, followed closely by high school graduate or GED equivalent graduate,
accounting for 22.6% of residents. Local residents who had obtained an associate’s
degree represented 14.4% of residents, and 15.8% of residents had at least some college
or technical school experience (Table 26).
Table 26. Education Level of Local Residents of the Jocassee Gorges.
Education Level % of Local Residents (n=734) Less Than High School 2.8
Some High School 5.7 High School Graduate or GED 22.6
Some College or Technical School 15.8 Associate’s Degree 14.4 Bachelor’s Degree 25.1 Graduate Degree 13.6
100% The average family size of local residents of the Jocassee Gorges was
approximately three (2.65) members. The most common family size was two members
living in the household and accounted for over one-third of residents (41.2%, Table 27).
A family size of three was the third most frequent family size (17.5%), and families of
four accounted for 16.8% of residents.

69
Table 27. Composition of Families of Local Residents of the Jocassee Gorges.
Total Family Size % of Local Residents (n=719) 1 16.0 2 41.2 3 17.5 4 16.8 5 6.0 6 1.7 ≥ 7 .8
Mean=2.65 100% The average number of family members living in the household of local residents
who were under the age of eighteen was almost one (0.63). The most frequent number of
teenagers in local resident households was none, accounting for 65.5% of local residents.
The second most frequent number of teenagers in the household was one (15.3%, Table
28), followed by a little over ten percent (12.9%) having two teenagers.
Table 28. Number of Family Members in Household Under 18 Years Old.
# of Family Members Under Age 18 % of Local Residents (n=730) 0 65.5 1 15.3 2 12.9 3 4.5 4 1.1 ≥5 .7
Mean=0.63 100% The average total household income level of the local resident of the Jocassee
Gorges, before taxes for the year 2004, was $21,000-$40,000 per year. Local residents
who refused the income question represented 21.8% of residents. The most frequent
income range of local residents who did respond was $41,000 - $60,000 (16.6%),
followed closely by the $21,000 - $40,000 range, accounting for 14.3% of residents
(Table 29).

70
Table 29. Total Household Income Level of Local Residents.
Total Household Income % of Local Residents (n=729) Refuse to Answer 21.8
Do Not Know 10.7 Less than $20,000 9.5 $21,000 - $40,000 14.3 $41,000 - $60,000 16.6 $61,000 - $80,000 10.7 $81,000 - $100,000 6.9
≥ $100,000 9.5 100%
The majority of local residents were classified into six main occupation
categories: professionals, retired, sales, service workers, homemakers, and laborers.
These six categories combined to represent 68.6% of residents. The professional
category accounted for 23.4% of local residents (Table 30), and retired residents
represented 22.3%. The professional category included teachers, physicians, attorneys,
dentists, and accountants. The retired category consisted of disabled residents, semi-
retired residents, and completely retired residents. The sales category (8.3%) consisted of
residents involved in retail operations. The service worker (7.3%) category consisted of
mechanics, technicians, bankers, and computer programmers. Laborers (6.6%) consisted
of textile workers, construction, landscape workers, and factory workers.
71
Table 30. Occupations of Local Residents of the Jocassee Gorges.
Occupation Category % of Local Residents (n=748) Professional 23.4 Retired 22.3 Sales 8.3 Service Workers 7.3 Homemaker 6.7 Laborers 6.6 Managerial 5.8 Self-Employed 4.6 Unemployed 2.9 Student 3.3 Operatives 2.6 Craftsmen 1.9 Refused to Answer 4.3
100% Many local residents (47.3%) lived in cities with populations between 10,000 and
100,000. These residents were followed closely by those living in towns with
populations between 1,000 and 10,000, representing approximately 37.6% of local
residents. Rural communities accounted for 5.2% of local residents living around the
Jocassee Gorges (Table 31).
Table 31. Distribution of Local Residents of the Jocassee Gorges According to Places of Residence Size.
Place of Residence Size % of Local Residents (n=748) Metropolitan Area (100,000-1,000,000) 6.6 City (10,000-99,999) 47.3 Small Town (1,000-9,999) 37.6 Rural Community (<1,000) 5.2 Don’t Know 2.9 Refused to Answer .4
100% Seneca was the most frequently (19.6%) reported city of residence by neighbors
of the Jocassee Gorges. Greenville was the second most reported city of residence
(18.7%, Table 32). Easley and Clemson combined to account for approximately 15.6%

72
of users. Other locations with notable representations included Simpsonville, Pickens,
and Traveler’s Rest in South Carolina, and Brevard, North Carolina.
Table 32. Places of Residence of Local Residents of the Jocassee Gorges.
Place of Residence % of Local Residents (n=748) Seneca 19.6
Greenville 18.7 Easley 8.6
Clemson 7.0 Simpsonville 3.6
Brevard 3.0 Pickens 2.1
Traveler’s Rest 1.9 Respondents who were familiar with the entire Jocassee Gorges area represented
74.9% of local residents. Residents who reported they were not familiar with the
property’s location accounted for 23.5% of residents (Table 33).
Table 33. Familiarity of Local Residents with the Location of the Jocassee Gorges Area.
Familiarity with Gorges Area % of Local Residents (n=741) Yes 74.9 No 23.5
Do Not Know 1.6 100%
The majority of residents were familiar with the Jocassee Gorges area, but not
knowledgeable of its boundaries (56.8%, Table 34). Just over one-third (30.3%) of local
residents knew the Gorges’ boundaries ‘somewhat.’ Residents who knew the boundaries
‘fairly well’ accounted for 10.2% of users, and only 2.7% of local residents knew the
boundaries ‘well.’

73
Table 34. Level of Familiarity of Local Residents of the Jocassee Gorges Boundaries.
Level of Familiarity with Boundaries of Jocassee Gorges Property
% of Local Residents (n=551)
Not at All 56.8 Somewhat 30.3 Fairly Well 10.2
Well 2.7 100%
Many local residents (52.9%) reported living over twenty miles away from the
nearest boundary of the Jocassee Gorges. The second largest percentage of residents
(13.6%) lived 17-20 miles from the nearest boundary of the Gorges property (Table 35).
Residents who lived 13-16 miles from the nearest boundary of the Gorges were the third
most frequent group (11.3%).
Table 35. Number of Miles Local Residents Live from Nearest Boundary of the Jocassee Gorges.
# of Miles from Nearest Boundary of the Jocassee Gorges
% of Local Residents (n=257)
1 – 4 2.4 5 – 8 7.8 9 – 12 8.9 13 – 16 11.3 17 – 20 13.6 Over 20 52.9
Do Not Know 3.1 100%
Most local residents (82.4%) had not used the Jocassee Gorges in the last year and
were therefore excluded from the remainder of the use history/patterns portion of the
interview process (Table 36). Local residents who had used the Gorges in the past year
accounted for 17.6% (n=131) of local residents and continued with the participation
portion of the phone interview.

74
Table 36. Distribution of Local Residents Who Have Used the Jocassee Gorges during the Past Year. Have You Used the Jocassee Gorges within
the Last Twelve Months? % of Local Residents (n=748)
Yes 17.6 No 82.4
100%
Resident Profile Summary
In summary, based on our telephone survey sample of 748 local residents of the
Jocassee Gorges, the average local resident is about 42 years of age, and lives in a family
of two. The average resident has a bachelor’s degree from a college or university, works
in a professional occupation and makes $21,000-$40,000 each year. The average resident
lives in a city with a population between 10,000 and 100,000. The typical resident of the
Gorges is familiar with the area, but not very familiar with its boundaries, and lives more
than twenty miles from the nearest boundary of the property.
Visitor Activities
Activity use figures and participation data are reported for only that portion of
local residents that used Jocassee Gorges within the last year. This data is based on 131
resident users (Table 36, 17.6% of 748 residents). Visiting waterfalls was the most
frequent activity (15.5%, Table 37) of local residents who use the Gorges, with the
majority (9.0%) having gone 1-4 days; however, day hiking was probably the primary
activity. Driving through the Gorges to sightsee was the second most frequent activity
(14.7%). About half (7.2%) of sightseers had been to the Gorges 1-4 days in the past
year. The third most frequent activity of local residents visiting the Jocassee Gorges was
day hiking (12.9%). Day hikers who had hiked 1-4 days in the Gorges in the past year
accounted for 7.2% of users, and 2.7% had hiked 5-8 days (Table 37). Local residents

75
who watched wildlife in the Gorges accounted for 11.6% of users, of which 5.5% had
gone for 1-4 days, and 2.4% had watched wildlife for more than twenty days in the
Gorges. Watching wildlife may have been a secondary activity to day hiking, fishing,
etc. Local residents who had photographed nature in the Gorges represented a little over
ten percent (10.7%) of residents, with about five percent (5.7%) of those going for 1-4
days. Few residents went canoeing or kayaking in the past year (4.0%), but a larger
percentage had been motor-boating on Lake Jocassee (9.2%). Nearly ten percent of
residents were anglers who (7.9%) had been fishing in the area during the past year,
and 3.1% of those had fished for 1-4 days. Close to one-tenth (7.6%) of local residents
had come to the Jocassee Gorges to visit historic sites in the property. Local residents
who had backpacked overnight in the Gorges accounted for 3.9% of the sample, and
2.4% of those had gone for 1-4 days. Only 1.9% of residents had ridden ATVs in the
Gorges, and just 1.1% of residents had gone horseback riding in the area during the past
twelve months. Merely 1.6% of residents had been hunting in the Gorges during the past
twelve months. A small percentage of residents had gone mountain biking in the Gorges
in the last year (0.9%).

76
Table 37. Number of Days of Participation of Local Residents of the Jocassee Gorges During the Past Twelve Months.
Activity % of Local Resident Users (Days) Total
% None 1-
4 5-8
9-12
13-16
17-20
20+ Total %
Visited Waterfalls (n=131) 17.6 2.1 9.0 3.2 .8 .7 .1 1.7 15.5Drove Area to Sightsee (n=131)
17.6 2.9 7.2 2.4 2.4 .5 .7 1.5 14.7
Day Hiked on Trails (n=131)
17.6 5.3 7.2 2.7 1.3 .1 .1 .9 12.3
Watched Wildlife (n=131) 17.6 6.0 5.5 1.6 .8 .5 .8 2.4 11.6Photographed Nature (n=131)
17.6 6.9 5.7 1.9 .5 .5 .5 1.6 10.7
Motor-Boated on Lake Jocassee (n=131)
17.6 8.4 4.7 1.5 1.2 .3 .3 1.2 9.2
Went Fishing (n=131) 17.6 9.7 3.1 2.5 .7 .4 .3 .9 7.9Visited Historic Sites (n=131)
17.6 10.0 5.5 1.2 .1 .3 - .5 7.6
Looked for Wildflowers (n=131)
17.6 10.4 4.1 .8 .8 .3 .3 .9 7.2
Canoed or Kayaked (n=131) 17.6 13.6 2.9 .3 .3 .1 - .4 4Backpacked Overnight (n=131)
17.6 13.7 2.4 .7 .3 .3 .1 .1 3.9
Drove ATV (n=131) 17.6 15.7 1.3 .4 - - .1 .1 1.9Went Hunting (n=131) 17.6 16.0 .8 - .3 .1 - .4 1.6Went Horseback Riding (n=131)
17.6 16.5 .8 .3 - - - - 1.1
Mountain Biked (n=131) 17.6 16.7 .8 - .1 - - - 0.9 Nearly a quarter (24.4% of n=131) of resident users thought they would use the
Jocassee Gorges 5-8 days during the next twelve months. Almost an equal number
thought they would use the property for 1-4 days in the same period (Table 38). Many
resident users (22.9%) thought they would visit the Gorges more than twenty days during
the next year.

77
Table 38. Number of Days Local Residents of the Jocassee Gorges Thought They Would Use the Gorges During the Next Year.
Number of Days Local Resident Users Would Visit the Gorges in the Next Year
% of Local Resident Users (n=131)
None 1.5 1 – 4 23.7 5 – 8 24.4 9 – 12 15.3 13 – 16 6.1 17 – 20 6.1 Over 20 22.9
100% Local residents have been using the Jocassee Gorges for many years. Over thirty
percent (31.1% of n=130) of resident users had been visiting the area for over twenty
years. Residents who had been using the Gorges for 1-4 years accounted for 15.9% of
visitors, and over ten percent (15.0%) of residents had used the area for 5-8 years (Table
39). Residents who had been using the Gorges for 9-20 years comprised 38.0% of users.
Table 39. Number of Years Local Residents Have Been Using the Gorges.
Number of Years Local Resident Users Had Been Using the Jocassee Gorges
% of Local Resident Users (n=130)
1 – 4 15.9 5 – 8 15.0 9 – 12 14.4 13 – 16 13.1 17 – 20 10.5 Over 20 31.1
100% Residents estimated how many times per year they had historically used the
Jocassee Gorges for recreation. Over one-third of local residents (37.1% of n=129) had
used the area 1-4 times each year (Table 40). Residents who used the area 5-8 times per
year accounted for 19.7% of resident users, and nearly twenty percent (18.9%) of
residents visited the Gorges more than twenty times per year.

78
Table 40. Number of Times Per Year Local Residents Used the Gorges. Number of Times per Year Local Resident
Users Visited the Jocassee Gorges % of Local Resident Users (n=129)
None 2.6 1 – 4 37.1 5 – 8 19.7 9 – 12 12.1 13 – 16 4.8 17 – 20 4.8 Over 20 18.9
100% The most frequent primary activity of local residents when using the Gorges
during the last twelve months was day hiking on trails (37.7% of n=131). The second
most frequent primary activity of local residents was motor-boating on Lake Jocassee
(20.6%). Fishing was the third most frequent (15.3%) primary activity of local residents
(Table 41). Driving the area to sightsee and other activities both contained 14.5%. Over
ten percent (11.5%) of residents chose visiting waterfalls as their primary activity. Some
local residents stated more than one primary activity for the Gorges, therefore the
percentages in Table 41 do not sum to 100%.
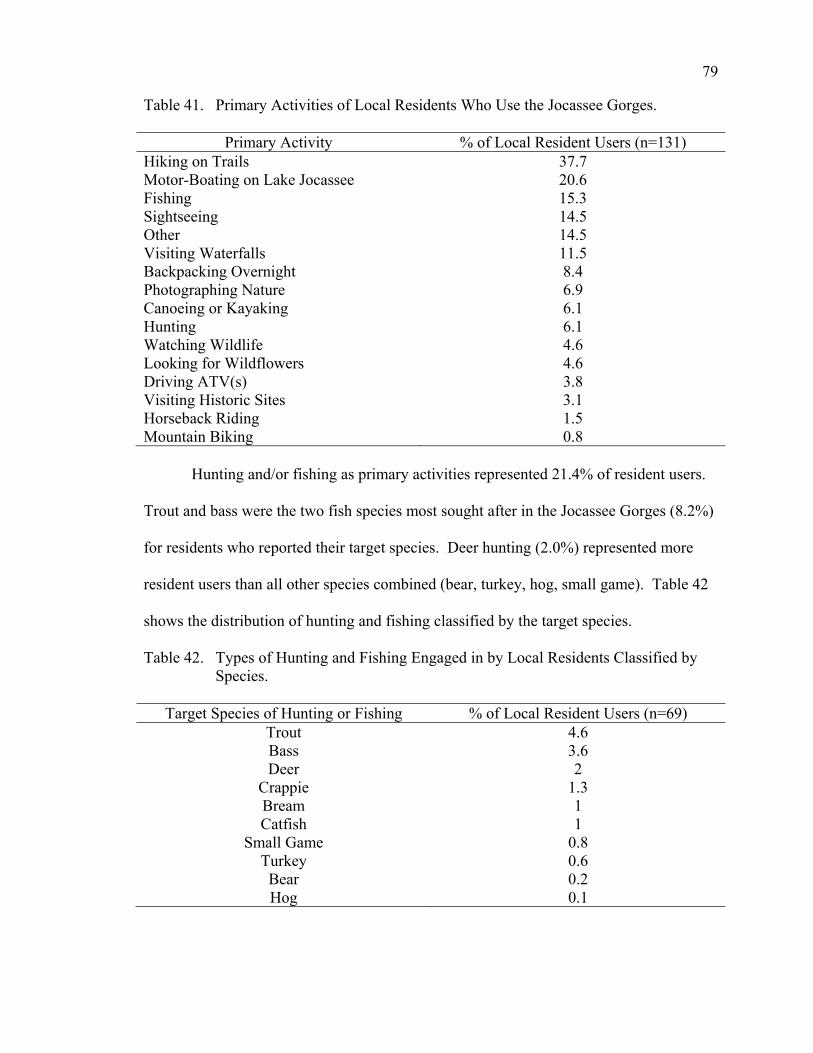
79
Table 41. Primary Activities of Local Residents Who Use the Jocassee Gorges.
Primary Activity % of Local Resident Users (n=131) Hiking on Trails 37.7 Motor-Boating on Lake Jocassee 20.6 Fishing 15.3 Sightseeing 14.5 Other 14.5 Visiting Waterfalls 11.5 Backpacking Overnight 8.4 Photographing Nature 6.9 Canoeing or Kayaking 6.1 Hunting 6.1 Watching Wildlife 4.6 Looking for Wildflowers 4.6 Driving ATV(s) 3.8 Visiting Historic Sites 3.1 Horseback Riding 1.5 Mountain Biking 0.8 Hunting and/or fishing as primary activities represented 21.4% of resident users.
Trout and bass were the two fish species most sought after in the Jocassee Gorges (8.2%)
for residents who reported their target species. Deer hunting (2.0%) represented more
resident users than all other species combined (bear, turkey, hog, small game). Table 42
shows the distribution of hunting and fishing classified by the target species.
Table 42. Types of Hunting and Fishing Engaged in by Local Residents Classified by Species.
Target Species of Hunting or Fishing % of Local Resident Users (n=69) Trout 4.6 Bass 3.6 Deer 2
Crappie 1.3 Bream 1 Catfish 1
Small Game 0.8 Turkey 0.6 Bear 0.2 Hog 0.1
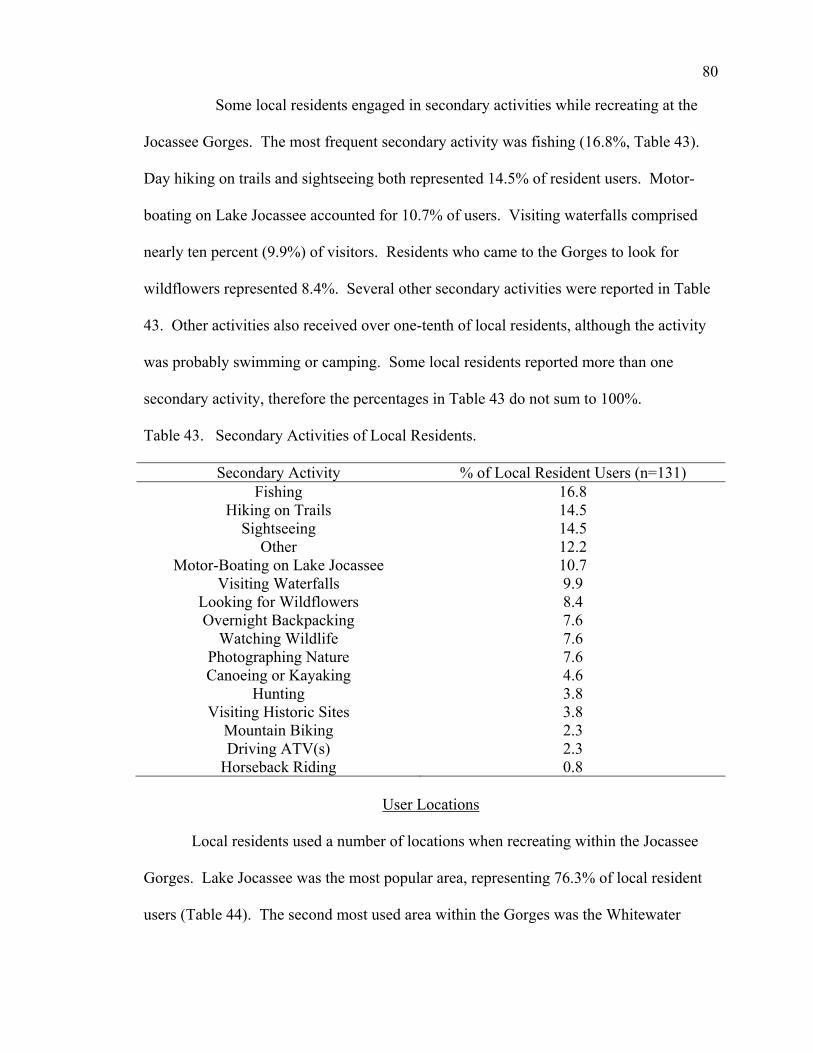
80
Some local residents engaged in secondary activities while recreating at the
Jocassee Gorges. The most frequent secondary activity was fishing (16.8%, Table 43).
Day hiking on trails and sightseeing both represented 14.5% of resident users. Motor-
boating on Lake Jocassee accounted for 10.7% of users. Visiting waterfalls comprised
nearly ten percent (9.9%) of visitors. Residents who came to the Gorges to look for
wildflowers represented 8.4%. Several other secondary activities were reported in Table
43. Other activities also received over one-tenth of local residents, although the activity
was probably swimming or camping. Some local residents reported more than one
secondary activity, therefore the percentages in Table 43 do not sum to 100%.
Table 43. Secondary Activities of Local Residents.
Secondary Activity % of Local Resident Users (n=131) Fishing 16.8
Hiking on Trails 14.5 Sightseeing 14.5
Other 12.2 Motor-Boating on Lake Jocassee 10.7
Visiting Waterfalls 9.9 Looking for Wildflowers 8.4 Overnight Backpacking 7.6
Watching Wildlife 7.6 Photographing Nature 7.6 Canoeing or Kayaking 4.6
Hunting 3.8 Visiting Historic Sites 3.8
Mountain Biking 2.3 Driving ATV(s) 2.3
Horseback Riding 0.8
User Locations
Local residents used a number of locations when recreating within the Jocassee
Gorges. Lake Jocassee was the most popular area, representing 76.3% of local resident
users (Table 44). The second most used area within the Gorges was the Whitewater

81
River and Whitewater Falls, accounting for 51.1% of local residents. The next most used
area in the Gorges property was the Foothills Trail (37.4%), followed by the Bad Creek
access (28.2%). Local resident users were allowed to indicate more than one primary use
area, therefore the percentages in Table 44 do not sum to 100%.
Table 44. Major Areas of Use of Local Residents.
Primary Area Used in the Jocassee Gorges % of Local Resident Users (n=131) Lake Jocassee 76.3 Whitewater River/Falls 51.1 Foothills Trail 37.4 Bad Creek (Musterground Road) 28.2 Horsepasture River 25.2 Eastatoee Valley Trail 21.4 Eastatoee Creek 20.6 Horsepasture Road 20.4 Other 16.8 Thompson River 11.5 Camp Adger Road 8.4 Shooting Tree Ridge Road 7.6 Dug Mountain Angler Access 6.9 Local residents use the Jocassee Gorges all months of the year. The Summer
months (May, June, July, and August) combined to account for the most frequent use
during the year (46.3%). The most frequently used month of the year by local residents
was July, representing 13.6% of users (Table 45). August followed July closely and
accounted for over one-tenth (11.4%) of use. June represented 10.9% of residents, and
May accounted for one-tenth (10.4%) of the sample. The Winter months (December,
January, and February) received the lowest use by local residents (12.5%). The Spring
and Fall months were similar in levels of reported use.

82
Table 45. Months of Use of the Jocassee Gorges by Local Residents.
Months of Highest Use by Local Resident Users of the Jocassee Gorges
% of Local Resident Users (n=131)
January 3.4 February 3.4 March 6.1 April 9.6 May 10.4 June 10.9 July 13.6
August 11.4 September 9.8
October 8.8 November 6.9 December 5.7
100% Recreationists and other types of users often belong to a hunting, fishing,
conservational, or other environmental organization. The large majority of local
residents were not members of any type of outdoor organization. All four categories of
organizations combined to only account for approximately 7% of the sample (Table 46).
Table 46. Distribution of Local Residents in Outdoor Organizations.
Type of Organization % of Local Resident Users (n=194) Conservation Organization 2.3
Hunting Organization 1.9 Fishing Organization 1.5
Environmental Organization 1.3 The majority of local residents who used the Jocassee Gorges typically
recreated with their families (54.2%). Nearly one in three respondents recreated at the
Gorges with friends (30.5%), and less than ten percent recreated alone (Table 47).

83
Table 47. Type of Group or Companion Local Residents Normally Recreated With in the Gorges. Type of Group Recreating with at the Gorges % of Local Resident Users (n=131)
Family 54.2 Friends 30.5 Other 7.6 Alone 6.1
Organized Group 1.6 100%
The average group size for the Jocassee Gorges was approximately four people
(4.12). The most frequently reported group size was three, accounting for 21.4% of
resident users. Two or four members in the recreational group were reported by 19.1% of
local users (Table 48).
Table 48. Number of People Local Residents Recreate With at Jocassee Gorges.
# of People Residents Recreate with % of Local Resident Users (n=131) 0 0.8 1 8.4 2 19.1 3 21.4 4 19.1 5 6.9 6 8.4 7 0.8 8 2.3 9 12.8
Mean=4.12 100% Outdoor recreation use within any given area can change for people over time.
Nearly a third of resident users (36.0% of n=131) indicated their recreation use in the
Jocassee Gorges had changed. More than one-third (36.2%) of residents said their
recreation had changed in frequency. A change in the type of activity accounted for
27.7% of resident users (Table 49). Other changes in recreation are described in the
analysis of open-ended questions in Chapter 8.

84
Table 49. Manner in Which Local Residents’ Recreation Had Changed Over Time at the Gorges.
Manner of Change in Recreation % of Local Resident Users (n=131) Frequency 36.2 Type of Activity 27.7 Other 21.3 Location 8.5 Number of People or Members in Party 6.4
100% Local residents indicated how their level of recreation may have changed since
the SCDNR took control of the Jocassee Gorges property. Just over two-thirds (69.5% of
n=131) of local resident users reported that their recreation levels had remained about the
same since the SCDNR took control of the Gorges property (Table 50), while 16.8% said
they now use the area more than before.
Table 50. Changes in Levels of Use of Local Residents Since SCDNR Began Managing the Jocassee Gorges.
Level of Use Since SCDNR Took Control of the Jocassee Gorges
% of Local Resident Users (n=131)
About the Same 69.5 More 16.8 Do Not Know 8.4 Less 3.8 Had Not Used Area Before SCDNR-Managed 1.5
100%
Use Area Summary In summary, based on our telephone survey sample of 748 local residents, 17.6%
(n=131) of residents used the Jocassee Gorges for recreation. The average local resident
user of the Jocassee Gorges was a day hiker and hiked 1-4 days in the past year. The
average user has been using the area for 13-16 years, and used the Gorges 9-12 times
each year. The typical user planned on using the Gorges 9-12 times during the next year.

85
The average local resident user of the Jocassee Gorges uses Lake Jocassee and the
Whitewater River/Falls areas the most heavily. The typical user frequents the Gorges
most heavily during the summer months, and usually visits the area with family or friends
in groups of two. For approximately one-third of Jocassee Gorges resident users,
recreation participation in the Gorges has increased, and their recreation has remained
about the same since the SCDNR began managing the property.

86
CHAPTER 6
OPEN-ENDED QUESTION ANALYSIS1
The phone survey was comprised of 33 questions. Due to the nature of the phone
survey and the questions involved, the open-ended response questions could not be
telephone-survey processed by a statistical software package since responses were
recorded verbatim in whatever choice of language and grammar the respondent chose to
use. Five questions were identified and are as follows with their response category
(Appendix H shows the format and sequence of questions):
Question 2: If yes, how did you find out about the Gorges?
This question refers to the Jocassee Gorges area and refers to the previous question
asking, “Are you familiar with this area?”
Question 19: If so, in what way?
This question refers to Question 18 asking, “Has your recreation within the Jocassee
Gorges changed over time?”
Question 20: What caused that change?
This question refers to Question 18 asking, “Has your recreation within the Jocassee
Gorges changed over time?”
Question 32: What, if any, major things would you like to see changed about how the
Jocassee Gorges is managed?
Question 33: Any other comments you may have?
1 Thomas Turner is acknowledged for analyzing and interpreting the open-end responses to the five open-ended questions in the survey.

87
Results
The answers to each of these questions were sorted into content domains and the
number of responses in each domain was tabulated. This section contains a summary of
the answers given to each of the five questions and their various responses. Answers
were categorized and labeled. A definition of the label is followed by an example.
Question 2: If yes, how did you find out about the Gorges? This question was geared towards how respondents discovered the area, and could allow
management to better target markets and conduct more efficient advertising.
‘Close Proximity:’ (n=174): This domain included all responses that were
references to respondents knowing about the Jocassee Gorges due to being nearby. It
included conditions such as lived in the area, worked in the area, and grew up nearby.
Findings indicated that many individuals had discovered the Gorges through living in
close proximity to the property. Specific examples:
“Lived in Greenville for 13 years” “Grew up in the area” “Born in Oconee County near Keowee River” “Worked with the SCDNR” ‘Family/Relations/Word of Mouth:’ (n=55): This domain identified all responses
that described how the respondent discovered the area and included social influences
such as friends, family, neighbors, locals, and word-of-mouth. Specific examples:
“Through the Cliffs Community, then through friends” “From Locals” “Neighbors visiting the area” “People talking about it” ‘Access to Outdoor Recreation:’ (n=35): This domain identified all responses that
involved people discovering the area during their search for a recreational location and

88
included conditions such as hiking, camping, fishing, hunting, and sightseeing. Findings
indicated that this was a good way to discover the area. Specific examples:
“Camping there” “Went to see the falls, many years ago, etc.” “Hunting there my whole life” ‘Media:’ (n=30): This domain described media as the source that allowed
respondents to discover the area. The media would typically have been a fairly good way
to have discovered the area, but because of its low level of publicity, this domain
included fewer responses. Some respondents indicated they would like to see more
publications and publicity about the area in order to increase accessibility to knowledge
concerning the property. This domain included references to newspapers, internet, and
television. Specific examples:
“Through the newspaper, ‘Seneca Journal’” “Reading the news, graduated from Clemson, SCDNR’s website” “Newspaper and television” “Online” ‘Travel:’ (n=28): This domain included all respondents who had discovered the
area because of their travel patterns. It included conditions such as commuting, business,
and pleasure. Findings indicated that this was the least frequent response for how
individuals discovered the area. Specific examples:
“Use to live on Highway 11 Use to own business…Burrell’s Grocery” “use Hwy 11 a lot” “Traveled there” “Riding through the area” Question 19: If so, in what way? This question had four possible responses and included frequency (n=17), location (n=3), type of activity (n=13), and number or members in party (n=3).

89
Question 20: What caused that change? This question helped identify the factors that influenced a change in local resident users’
recreation at the Jocassee Gorges.
‘Other:’ (n=20): Random responses were not encountered frequently enough to
establish domains therefore, categories were placed here. Specific examples:
“More security” “Because I got older” “Like to fish” “Taking up different sports” “Camping b/c I wanted to” “Doesn’t backpack anymore due to back problems” “Loss of time” ‘Retirement:’ (n=3): This particular domain described that retirement had something to do with causing the change. Specific examples:
“Retired” “More time, retired” ‘Children:’ (n=2): This domain indicated that the respondents’ children had something to do with the causing the change. Specific examples: “Take Grandchildren there” “Children” Question # 32: What, if any, major things would you like to see changed about how the Jocassee Gorges is managed? This question asked respondents for their suggestions for improving the condition and/or management of the Jocassee Gorges. ‘Preservation/Protection:’ (n=50): This domain described all responses that
addressed preservation/protection and what management implication steps should be
taken. It included conditions such as no development, protection of the area, no

90
commercialization, and assurance its natural state continues to exist. These comments
suggest a passion for the preservation of the area and assuring that the area remains
unchanged and natural. Specific examples:
“Protect the area, and have it clean. Free from pollution and chemicals” “Environment remains unspoiled and protected, less development” “Nothing… just preserve it and no development” “Don’t want to see it exploited and ruined” “More preserving from development” ‘Status quo:’ (n=30): This domain described responses that dealt with leaving the
park and surrounding area as it is and that no action or changes should be taken to change
management practices. This domain described the feeling that visitors are happy with the
current management strategies, recommend they remain consistent, and that management
has done an excellent job and the effort needs to be maintained. A very positive sense of
management efforts existed overall. Specific examples:
“Keep it like it is, no development” “Keep it the same” “Nothing is wrong” “Think they have done a good job of it lately” “Well managed” ‘Watershed conservation/preservation:’ (n=20): This domain described
responses that addressed protecting and preserving the watershed and what management
implication steps should be taken. Conditions such as protecting the lake and its
watershed, preventing runoff, and limiting lake use (no. of boats) were identified as key
issues. Specific examples:
“No motor boats, no Sea-Doos” “Motor boats off lake, no jet skis, nothing to pollute the water” “Protect watershed. No hiking or horseback riding around it” “No more houses, less boaters, no docks, keep it the way it is”

91
‘Trail issues and management:’ (n=15): This domain described trails in the area
and what management steps should be taken according to the respondent. Key issues
included improving trail markings, trail improvements, access, and increased availability
of trails. Specific examples:
“Better marks on trails” “More signage” “Improve access” “Open other end of Horsepasture” “Better trail map” “No horses or ATVs” ‘Problems:’ (n=15): This domain described all miscellaneous problems provided
by respondents. This was a vary broad domain including conditions like more bike trails,
violence, alcohol, parking limitations, and ATV limitations. Specific examples:
“More bike trails” “Violence” “Alcohol” “Limitation on motorized vehicles (ATV)” ‘Operational hours:’ (n=10): This domain described all responses about the need
to extend hours and seasons of operation. Particular issues identified were keeping the
area open longer and extending seasonal operation periods. Specific examples:
“Open in the summer time” “More open” “Better access” “Open them up more to the public (roads)” “Like to see Whitewater/Jocassee Falls Road to be open yearly.” “All gates open year round” ‘Lodging:’ (n=6): Lodging issues were described and suggestions were made for
improvement. Issues identified were campsites, primitive and modern, cabins, and the
desire to have waterfront campsites (increase number). The overall feeling for this
92
domain was that users would like to see more facilities made available as well as have
more lakefront sites opened. Specific examples:
“More availability for cottages” “Camping area” “More camping sites (especially on the lake)” “More remote camping areas opened on the lake” “More electricity and water to camp ground” “More cabins on the lake” ‘Advertising:’ (n=4): This domain addressed the issue of the need for more
advertising to be done and an easy way to access information about the area being
provided to the public. People reported it was difficult to find out about the area if they
did not happen upon it by some other means. Specific examples:
“Advertise more because he would like to know more about the area” “More publication” “More advertising” “Publicize it more” ‘Fishing:’ (n=3): This domain was very small but identified respondents who had
an interest in fishing. They felt that changes should be made which would address
making the facilities better and stocking the lake. Specific examples:
“Improve fishing” “Stock the fish better” “Better fishing facilities” Question #33: Any other comments you may have? This question gave respondents the freedom to mention any issue they may have had that was not addressed in any of the previous questions. ‘Preserve and Protect:’ (n=65): This domain identified respondents’ desires to
protect the Jocassee Gorges areas and what measures would be the most effective or
important. It included conditions such as no development, protection of the area, no

93
commercialization, and assurance that its natural state exists. A tremendous passion for
the preservation of the area existed, assuring that the area remains unchanged and natural.
More funding going to protection was another recommendation. Specific examples:
“More funding to go to National Forest areas” “Need to preserve and take care of” “Keep them as natural as possible” “Very unhappy with development” “Don’t sell anymore property” ‘Aesthetic Beauty:’ (n=45): Respondents felt a strong urge to protect the beauty
of the area and stated that it is an incredible place to visit. Residents stated how beautiful
the area is and how much visitors enjoyed its aesthetic qualities. Specific examples:
“It’s beautiful” “Thinks it’s a beautiful place and hopes that it can continue to be managed properly” “It’s a beautiful place, she goes to there to drive and look at the area” “It’s a beautiful place and Duke Power has done wonders fixing it up” ‘Recreation:’ (n=11): This domain focused on improvements of recreation
opportunities within the area. These recreation opportunities involved the natural setting
of the activities mentioned. Examples included increasing recreation opportunities such
as hiking, camping, fishing, and boating. Specific examples:
“Improve hunting and fishing” “More boat landings” “He goes for the solitude” ‘Information:’ (n=10): This domain focused on the reoccurring theme that more
advertising needs to be done about the Jocassee Gorges. The current feeling was that it is
too difficult to easily learn about the property. These respondents perceived that there
was not a good source of information on the area. Issues identified included more
94
accessibility, better signage, articles, and ways to find out about the area. People wanted
the area to be easier to learn about and more accessible. Specific examples:
“Need to advertise more” “More signs indicating points of interest” “How to find out about it”
Summary Question 2: If Yes, how did you find out about the Gorges? The most common response was that it was discovered because the respondent
was already familiar with the area’s location and proximity. Responses included living in
the area, working in the area, and having grown up nearby. Findings indicated that there
was many local residents had discovered the area from living in close proximity to it.
Question 19: If so, in what way did your use of the Jocassee Gorges change? This question had four possible choices for responses and included frequency,
location, type of activity, and number or members in party. Use of the Gorges had
changed the most frequently in terms of frequency and type of activity.
Question 20: What caused that change in your recreational use of the Jocassee Gorges?
This question received so few responses with such a broad spectrum that no
formal conclusion should be drawn other than the need for a focused research project. If
more responses had been taken or if more interest had been given to this question, the
data gathered would be more beneficial.
Question 32: What, if any, major things would you like to see changed about how the Jocassee Gorges is managed? Respondents showed a great deal of interest in preserving and protecting the area.
They also commented that the status-quo management efforts were effective and that

95
management has done an excellent job with the property. More effort should be taken to
assure future generations can enjoy the same experience.
Question 33: Any other comments you may have? This question identified much of the same information as the previous question
(32). The respondents that commented valued the area tremendously and did not want to
see anything happen to it or jeopardize its existence. Because of the similarity and strong
number of responses, the conclusion of this analysis is that a tremendous effort should be
taken to identify and work to assure that these issues are addressed.
96
CHAPTER 7
COMPARATIVE DATA ANALYSIS OF JOCASSEE GORGES USERS
Resident and Non-Resident Visitors
Residents of South Carolina were compared to non-residents for differences in the
following variables: primary activity, length of stay, access point for activity, frequency
of use (number of times per year visitors used the Jocassee Gorges), and historical use
(number of years visitors had been using the Gorges).
The primary activities of residents of South Carolina were found to be
significantly different from non-residents’ primary activities. The observed significance
level for the Pearson chi-square value of 25.65 with ten degrees of freedom was 0.04
(Table 51). Over one-quarter (27.3%) of users were South Carolina residents who had
been day hiking in the Jocassee Gorges (Table 51), and 10.6% were non-resident users
coming to the Gorges to hike for the day. Over twenty percent (22.9%) of anglers were
from South Carolina, and only 2% of users were non-resident anglers. Resident
overnight backpackers accounted for 8.5% of visitors, and 3.6% were non-resident
backpackers. Less than ten percent (6.5%) of hunters were from South Carolina, while
non-residents accounted for 1.6% of hunters.
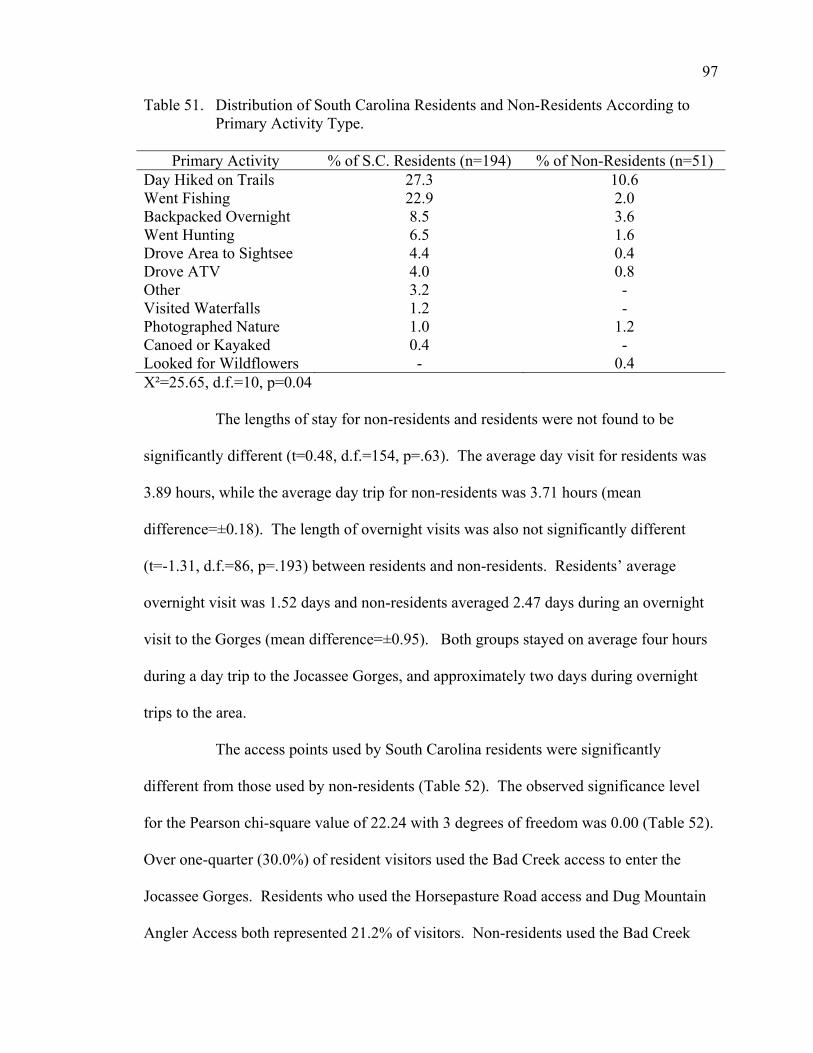
97
Table 51. Distribution of South Carolina Residents and Non-Residents According to Primary Activity Type.
Primary Activity % of S.C. Residents (n=194) % of Non-Residents (n=51) Day Hiked on Trails 27.3 10.6 Went Fishing 22.9 2.0 Backpacked Overnight 8.5 3.6 Went Hunting 6.5 1.6 Drove Area to Sightsee 4.4 0.4 Drove ATV 4.0 0.8 Other 3.2 - Visited Waterfalls 1.2 - Photographed Nature 1.0 1.2 Canoed or Kayaked 0.4 - Looked for Wildflowers - 0.4 X²=25.65, d.f.=10, p=0.04
The lengths of stay for non-residents and residents were not found to be
significantly different (t=0.48, d.f.=154, p=.63). The average day visit for residents was
3.89 hours, while the average day trip for non-residents was 3.71 hours (mean
difference=±0.18). The length of overnight visits was also not significantly different
(t=-1.31, d.f.=86, p=.193) between residents and non-residents. Residents’ average
overnight visit was 1.52 days and non-residents averaged 2.47 days during an overnight
visit to the Gorges (mean difference=±0.95). Both groups stayed on average four hours
during a day trip to the Jocassee Gorges, and approximately two days during overnight
trips to the area.
The access points used by South Carolina residents were significantly
different from those used by non-residents (Table 52). The observed significance level
for the Pearson chi-square value of 22.24 with 3 degrees of freedom was 0.00 (Table 52).
Over one-quarter (30.0%) of resident visitors used the Bad Creek access to enter the
Jocassee Gorges. Residents who used the Horsepasture Road access and Dug Mountain
Angler Access both represented 21.2% of visitors. Non-residents used the Bad Creek
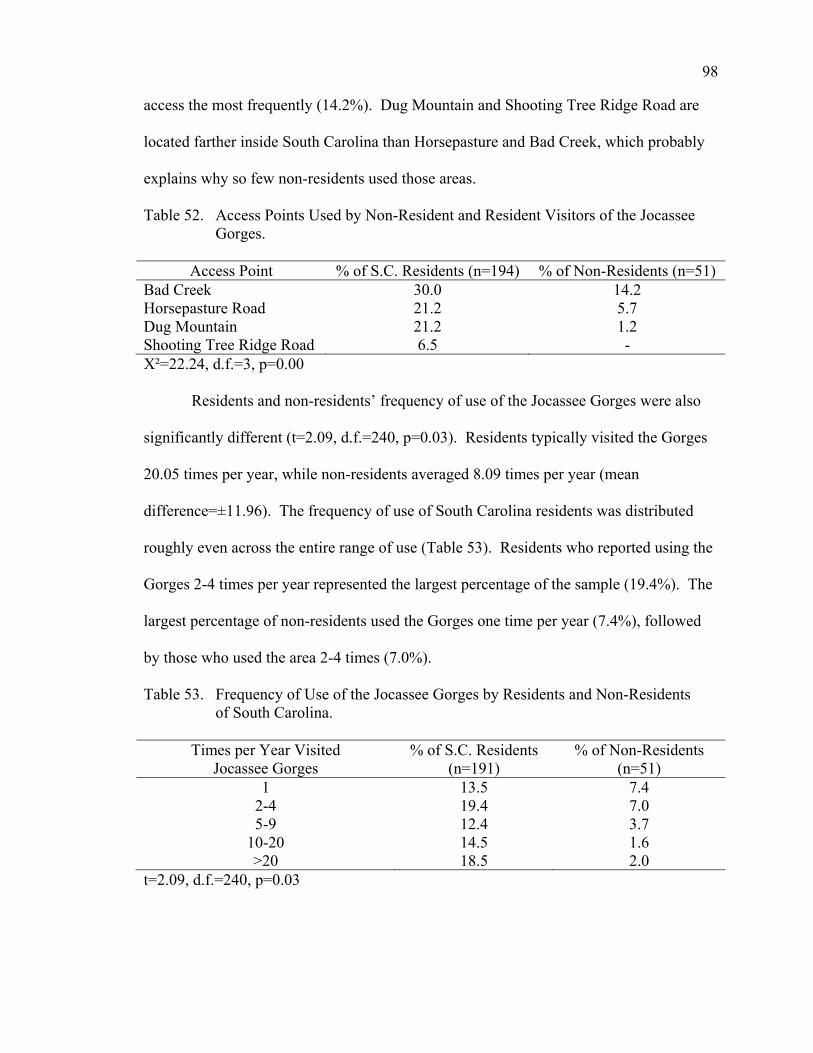
98
access the most frequently (14.2%). Dug Mountain and Shooting Tree Ridge Road are
located farther inside South Carolina than Horsepasture and Bad Creek, which probably
explains why so few non-residents used those areas.
Table 52. Access Points Used by Non-Resident and Resident Visitors of the Jocassee Gorges.
Access Point % of S.C. Residents (n=194) % of Non-Residents (n=51) Bad Creek 30.0 14.2 Horsepasture Road 21.2 5.7 Dug Mountain 21.2 1.2 Shooting Tree Ridge Road 6.5 - X²=22.24, d.f.=3, p=0.00 Residents and non-residents’ frequency of use of the Jocassee Gorges were also
significantly different (t=2.09, d.f.=240, p=0.03). Residents typically visited the Gorges
20.05 times per year, while non-residents averaged 8.09 times per year (mean
difference=±11.96). The frequency of use of South Carolina residents was distributed
roughly even across the entire range of use (Table 53). Residents who reported using the
Gorges 2-4 times per year represented the largest percentage of the sample (19.4%). The
largest percentage of non-residents used the Gorges one time per year (7.4%), followed
by those who used the area 2-4 times (7.0%).
Table 53. Frequency of Use of the Jocassee Gorges by Residents and Non-Residents of South Carolina.
Times per Year Visited Jocassee Gorges
% of S.C. Residents (n=191)
% of Non-Residents (n=51)
1 13.5 7.4 2-4 19.4 7.0 5-9 12.4 3.7
10-20 14.5 1.6 >20 18.5 2.0
t=2.09, d.f.=240, p=0.03
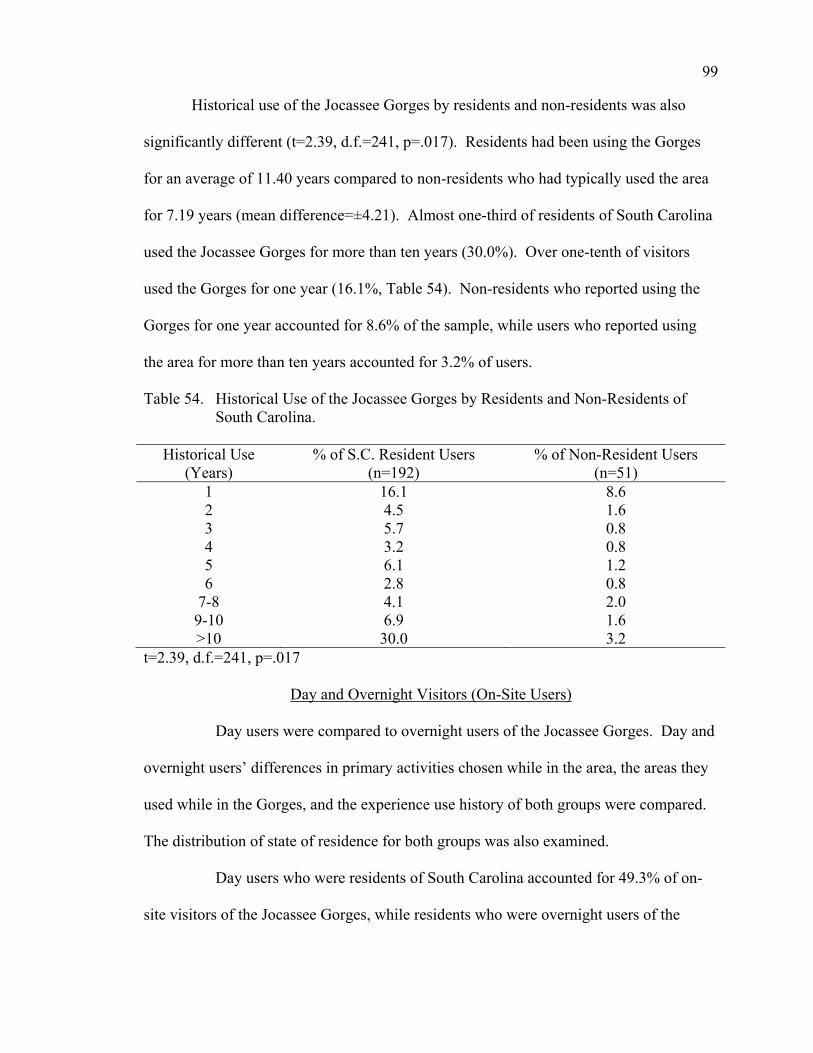
99
Historical use of the Jocassee Gorges by residents and non-residents was also
significantly different (t=2.39, d.f.=241, p=.017). Residents had been using the Gorges
for an average of 11.40 years compared to non-residents who had typically used the area
for 7.19 years (mean difference=±4.21). Almost one-third of residents of South Carolina
used the Jocassee Gorges for more than ten years (30.0%). Over one-tenth of visitors
used the Gorges for one year (16.1%, Table 54). Non-residents who reported using the
Gorges for one year accounted for 8.6% of the sample, while users who reported using
the area for more than ten years accounted for 3.2% of users.
Table 54. Historical Use of the Jocassee Gorges by Residents and Non-Residents of South Carolina.
Historical Use (Years)
% of S.C. Resident Users (n=192)
% of Non-Resident Users (n=51)
1 16.1 8.6 2 4.5 1.6 3 5.7 0.8 4 3.2 0.8 5 6.1 1.2 6 2.8 0.8
7-8 4.1 2.0 9-10 6.9 1.6 >10 30.0 3.2
t=2.39, d.f.=241, p=.017
Day and Overnight Visitors (On-Site Users)
Day users were compared to overnight users of the Jocassee Gorges. Day and
overnight users’ differences in primary activities chosen while in the area, the areas they
used while in the Gorges, and the experience use history of both groups were compared.
The distribution of state of residence for both groups was also examined.
Day users who were residents of South Carolina accounted for 49.3% of on-
site visitors of the Jocassee Gorges, while residents who were overnight users of the

100
property comprised 30.2% of visitors. Non-resident day users of the Gorges represented
13.7% of all on-site visitors, and non-resident overnight users accounted for 6.8% of the
on-site sample.
The primary activities of day and overnight users of the Jocassee Gorges were
significantly different. The observed significance level for the Pearson chi square value
of 80.98 with 10 degrees of freedom was 0.00 (Table 55). Over one-quarter (28.3%) of
day users of the Jocassee Gorges were hikers, followed closely by anglers (21.1%, Table
55). Hunters and visitors driving the area to sightsee comprised less than ten percent of
users (7.2%). Almost one-quarter (21.8%) of visitors were backpacking in the Gorges,
the largest representation of overnight users. Hunters and anglers comprised almost one-
tenth (8.0%) of overnight visitors.
Table 55. Day and Overnight Jocassee Gorges Users Classified by Primary Activity.
Primary Activity % of Day Users (n=157) % of Overnight Users (n=89) Day Hiked on Trails 28.3 - Went Fishing 21.1 3.6 Went Hunting 3.6 4.4 Drove Area to Sightsee 3.6 1.2 Drove ATV 2.4 2.4 Other 3.2 0.8 Photographed Nature 1.2 0.4 Visited Waterfalls 0.4 0.8 Looked for Wildflowers 0.4 - Backpacked Overnight - 21.8 Canoed or Kayaked - 0.4 X²=80.98, d.f.=10, p=0.00 The frequency of use of the Jocassee Gorges by day and overnight users were
not significantly different (t=0.43, d.f.=241, p=0.67). Day users averaged 16.72 times per
year while overnight visitors averaged 18.79 times each year (mean difference=±2.07).
Over ten percent of day users were classified into each range of use, with day users who

101
used the Gorges 2-4 times during the last twelve months accounting for almost fifteen
percent (14.8%, Table 56). Overnight visitors who stayed in the Gorges for 2-4 days
comprised over ten percent (10.5%) of users. Both types of users who came to the
Gorges more than twenty times per year accounted for over twenty percent (20.6%) of
visitors.
Table 56. Frequency of Use by Day and Overnight Users of Jocassee Gorges.
Times per Year Visited the Jocassee Gorges
% of Day Users (n=157)
% of Overnight Users (n=89)
1 11.3 9.3 2-4 14.8 10.5 5-9 10.1 5.6
10-20 12.1 5.7 > 20 13.8 6.8
t=0.43, d.f.=241, p=0.67 Day and overnight users’ historical use of the Gorges were not significantly
different (t=0.13, d.f.=242, p=0.89). The mean past use level of day users was 10.56
years while the average of overnight visitors’ use level was 10.36 years (mean
difference=±0.19). More day users had been using the Gorges for over ten years (19.0%,
Table 57) than any other historical use category. Almost fifteen percent (14.5%) of day
users had only been using the area for one year, the second largest group of day users.
More overnight users (11.9%) had been using the Gorges for more than ten years than the
other use categories. The second largest group of overnight users had been using the area
for one year (9.9%), as was the case for day users.
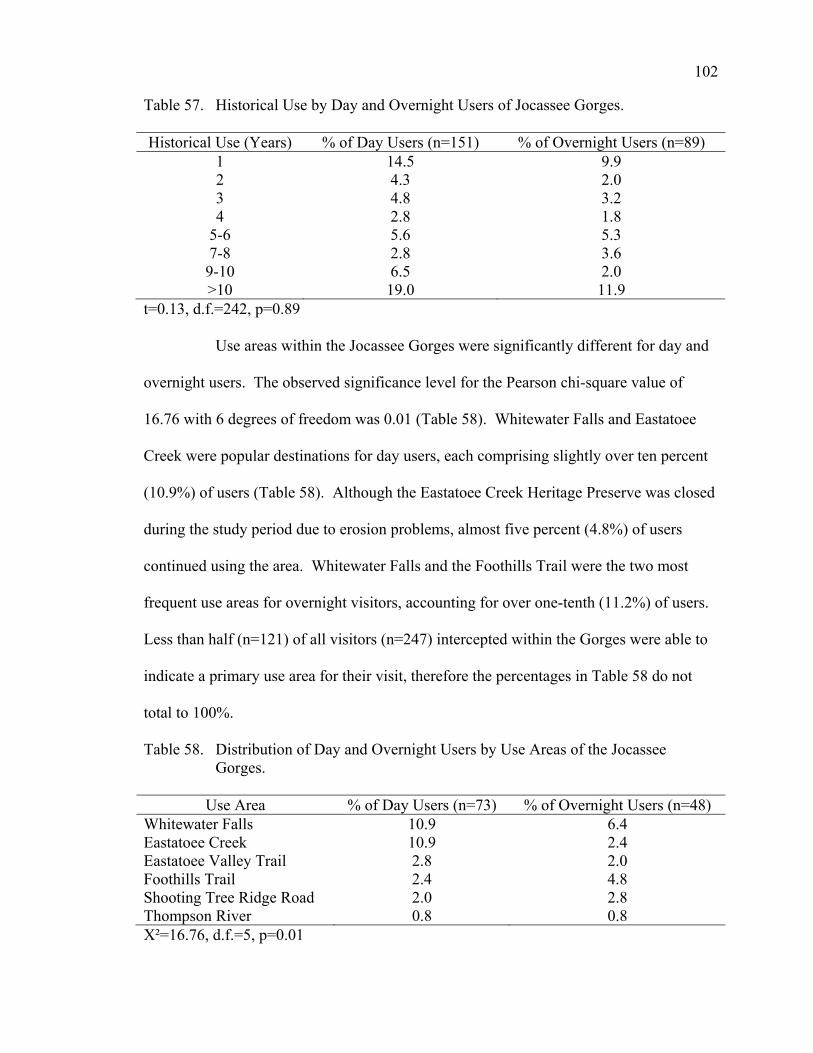
102
Table 57. Historical Use by Day and Overnight Users of Jocassee Gorges. Historical Use (Years) % of Day Users (n=151) % of Overnight Users (n=89)
1 14.5 9.9 2 4.3 2.0 3 4.8 3.2 4 2.8 1.8
5-6 5.6 5.3 7-8 2.8 3.6 9-10 6.5 2.0 >10 19.0 11.9
t=0.13, d.f.=242, p=0.89 Use areas within the Jocassee Gorges were significantly different for day and
overnight users. The observed significance level for the Pearson chi-square value of
16.76 with 6 degrees of freedom was 0.01 (Table 58). Whitewater Falls and Eastatoee
Creek were popular destinations for day users, each comprising slightly over ten percent
(10.9%) of users (Table 58). Although the Eastatoee Creek Heritage Preserve was closed
during the study period due to erosion problems, almost five percent (4.8%) of users
continued using the area. Whitewater Falls and the Foothills Trail were the two most
frequent use areas for overnight visitors, accounting for over one-tenth (11.2%) of users.
Less than half (n=121) of all visitors (n=247) intercepted within the Gorges were able to
indicate a primary use area for their visit, therefore the percentages in Table 58 do not
total to 100%.
Table 58. Distribution of Day and Overnight Users by Use Areas of the Jocassee Gorges.
Use Area % of Day Users (n=73) % of Overnight Users (n=48) Whitewater Falls 10.9 6.4 Eastatoee Creek 10.9 2.4 Eastatoee Valley Trail 2.8 2.0 Foothills Trail 2.4 4.8 Shooting Tree Ridge Road 2.0 2.8 Thompson River 0.8 0.8 X²=16.76, d.f.=5, p=0.01
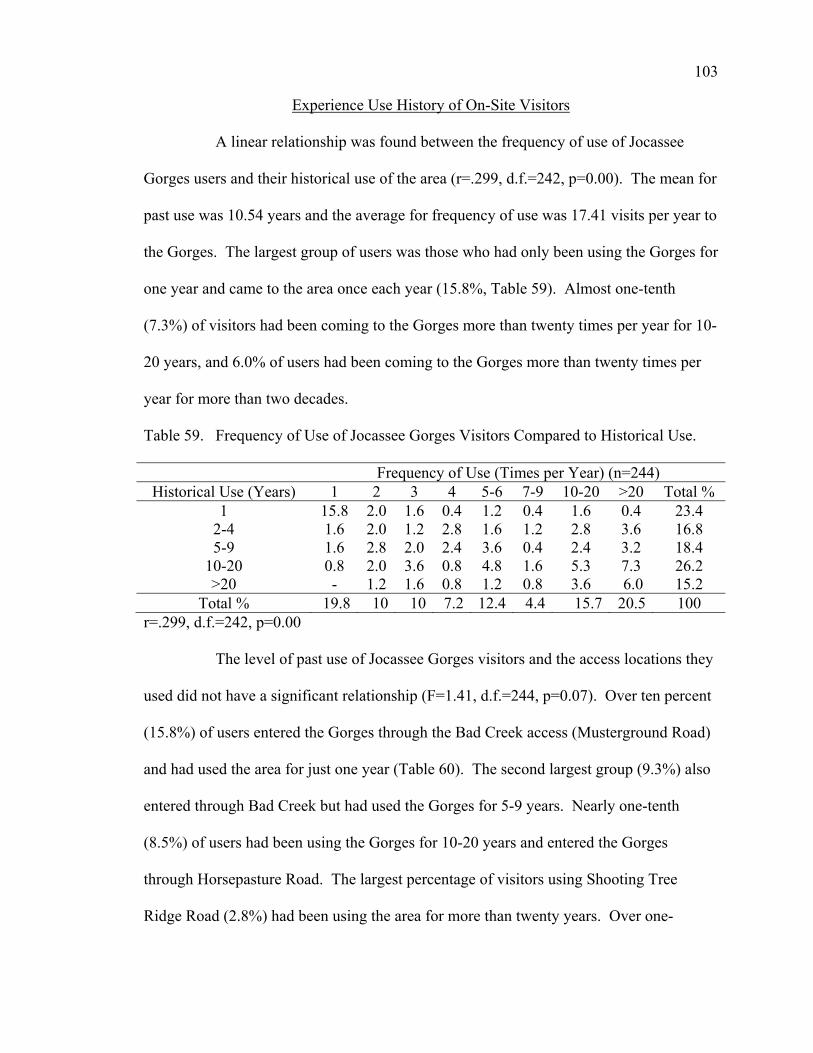
103
Experience Use History of On-Site Visitors A linear relationship was found between the frequency of use of Jocassee
Gorges users and their historical use of the area (r=.299, d.f.=242, p=0.00). The mean for
past use was 10.54 years and the average for frequency of use was 17.41 visits per year to
the Gorges. The largest group of users was those who had only been using the Gorges for
one year and came to the area once each year (15.8%, Table 59). Almost one-tenth
(7.3%) of visitors had been coming to the Gorges more than twenty times per year for 10-
20 years, and 6.0% of users had been coming to the Gorges more than twenty times per
year for more than two decades.
Table 59. Frequency of Use of Jocassee Gorges Visitors Compared to Historical Use.
Frequency of Use (Times per Year) (n=244) Historical Use (Years) 1 2 3 4 5-6 7-9 10-20 >20 Total %
1 15.8 2.0 1.6 0.4 1.2 0.4 1.6 0.4 23.4 2-4 1.6 2.0 1.2 2.8 1.6 1.2 2.8 3.6 16.8 5-9 1.6 2.8 2.0 2.4 3.6 0.4 2.4 3.2 18.4
10-20 0.8 2.0 3.6 0.8 4.8 1.6 5.3 7.3 26.2 >20 - 1.2 1.6 0.8 1.2 0.8 3.6 6.0 15.2
Total % 19.8 10 10 7.2 12.4 4.4 15.7 20.5 100 r=.299, d.f.=242, p=0.00 The level of past use of Jocassee Gorges visitors and the access locations they
used did not have a significant relationship (F=1.41, d.f.=244, p=0.07). Over ten percent
(15.8%) of users entered the Gorges through the Bad Creek access (Musterground Road)
and had used the area for just one year (Table 60). The second largest group (9.3%) also
entered through Bad Creek but had used the Gorges for 5-9 years. Nearly one-tenth
(8.5%) of users had been using the Gorges for 10-20 years and entered the Gorges
through Horsepasture Road. The largest percentage of visitors using Shooting Tree
Ridge Road (2.8%) had been using the area for more than twenty years. Over one-

104
quarter of visitors (26.6%) had been using the Gorges for 10-20 years, and were evenly
spread across all four access locations, with the exception of Shooting Tree Ridge Road.
Table 60. Historical Use of Visitors of the Jocassee Gorges Classified by Access Location.
Historical Use (Years, n=245) Access Location 1 2-4 5-9 10-20 >20 Total %
Bad Creek 15.8 7.6 9.3 8.9 2.4 44.0 Horsepasture Road 4.8 4.8 3.2 8.5 5.3 26.6 Dug Mountain Angler Access 2.8 3.2 3.2 8.0 4.4 21.6 Shooting Tree Ridge Road 1.4 0.8 1.6 1.2 2.8 7.8
Total % 24.8 16.4 17.3 26.6 14.9 100% F=1.41, d.f.=244, p=0.07
Primary Use Areas of On-Site Visitors
Over one-quarter of users (26.7%) were day hikers who entered the Gorges
through the Bad Creek access location, the largest group of users (Table 61). Over ten
percent (10.1%) of hikers entered the property through Horsepasture Road. Nearly
twenty percent (18.8%) of anglers entered the Gorges through the Dug Mountain Angler
Access. Overnight backpackers seemed to prefer using the Bad Creek and Horsepasture
Road access. More sightseers used Horsepasture Road (2.8%) than any other access area.
Hunters preferred using Shooting Tree Ridge Road (5.0%) more than all other access
locations combined (3.2%). ATV riders preferred using Horsepasture Road over other
locations, suggesting the group is largely recreational and not using ATVs for hunting
purposes.
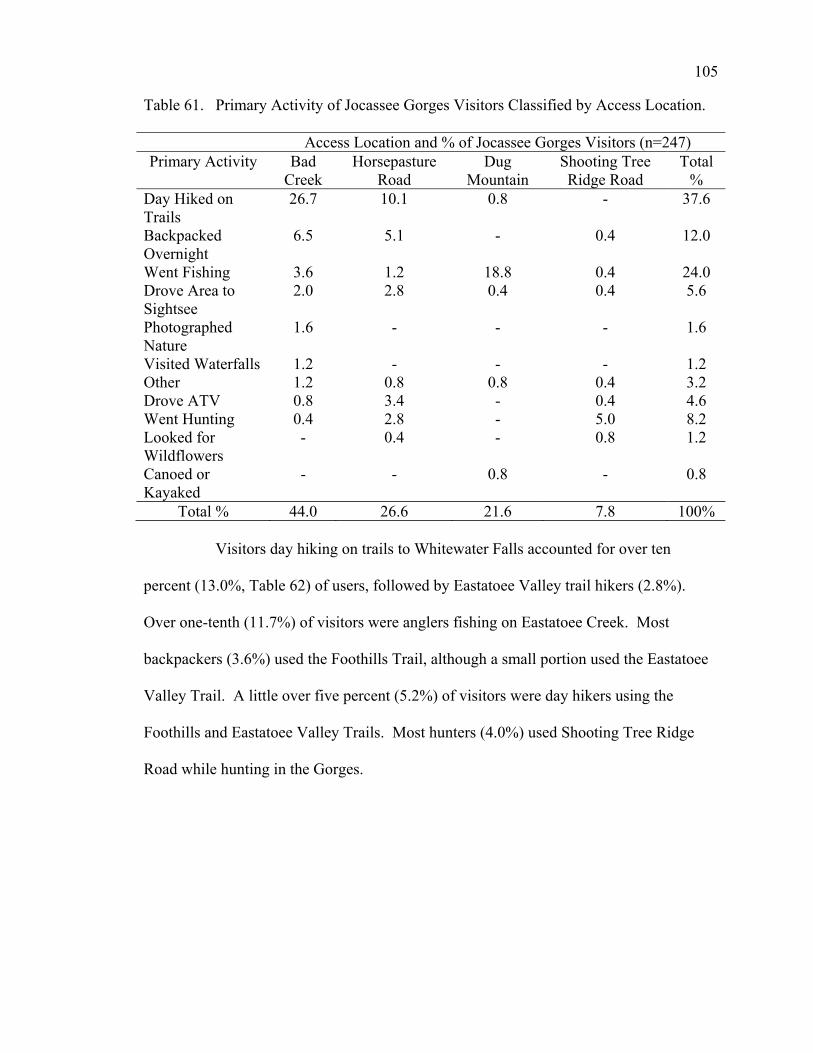
105
Table 61. Primary Activity of Jocassee Gorges Visitors Classified by Access Location.
Access Location and % of Jocassee Gorges Visitors (n=247) Primary Activity Bad
Creek Horsepasture
Road Dug
Mountain Shooting Tree Ridge Road
Total %
Day Hiked on Trails
26.7 10.1 0.8 - 37.6
Backpacked Overnight
6.5 5.1 - 0.4 12.0
Went Fishing 3.6 1.2 18.8 0.4 24.0 Drove Area to Sightsee
2.0 2.8 0.4 0.4 5.6
Photographed Nature
1.6 - - - 1.6
Visited Waterfalls 1.2 - - - 1.2 Other 1.2 0.8 0.8 0.4 3.2 Drove ATV 0.8 3.4 - 0.4 4.6 Went Hunting 0.4 2.8 - 5.0 8.2 Looked for Wildflowers
- 0.4 - 0.8 1.2
Canoed or Kayaked
- - 0.8 - 0.8
Total % 44.0 26.6 21.6 7.8 100% Visitors day hiking on trails to Whitewater Falls accounted for over ten
percent (13.0%, Table 62) of users, followed by Eastatoee Valley trail hikers (2.8%).
Over one-tenth (11.7%) of visitors were anglers fishing on Eastatoee Creek. Most
backpackers (3.6%) used the Foothills Trail, although a small portion used the Eastatoee
Valley Trail. A little over five percent (5.2%) of visitors were day hikers using the
Foothills and Eastatoee Valley Trails. Most hunters (4.0%) used Shooting Tree Ridge
Road while hunting in the Gorges.
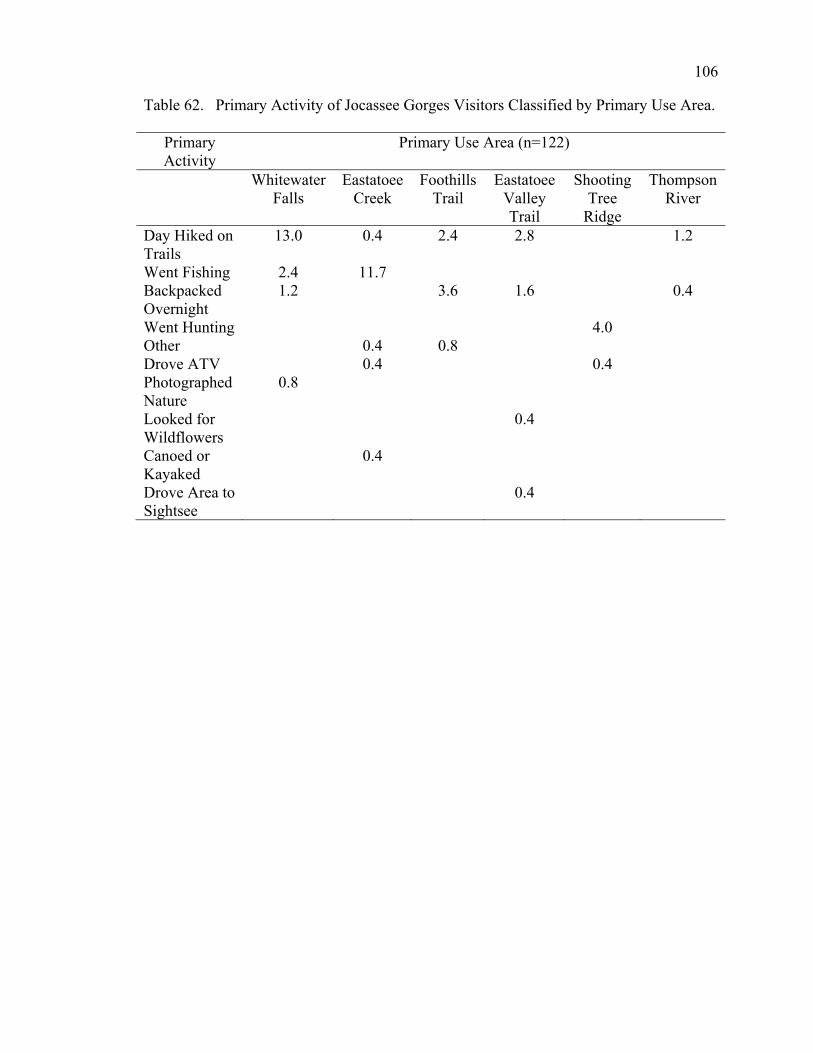
106
Table 62. Primary Activity of Jocassee Gorges Visitors Classified by Primary Use Area.
Primary Activity
Primary Use Area (n=122)
Whitewater Falls
Eastatoee Creek
Foothills Trail
Eastatoee Valley Trail
Shooting Tree
Ridge
Thompson River
Day Hiked on Trails
13.0 0.4 2.4 2.8 1.2
Went Fishing 2.4 11.7 Backpacked Overnight
1.2 3.6 1.6 0.4
Went Hunting 4.0 Other 0.4 0.8 Drove ATV 0.4 0.4 Photographed Nature
0.8
Looked for Wildflowers
0.4
Canoed or Kayaked
0.4
Drove Area to Sightsee
0.4
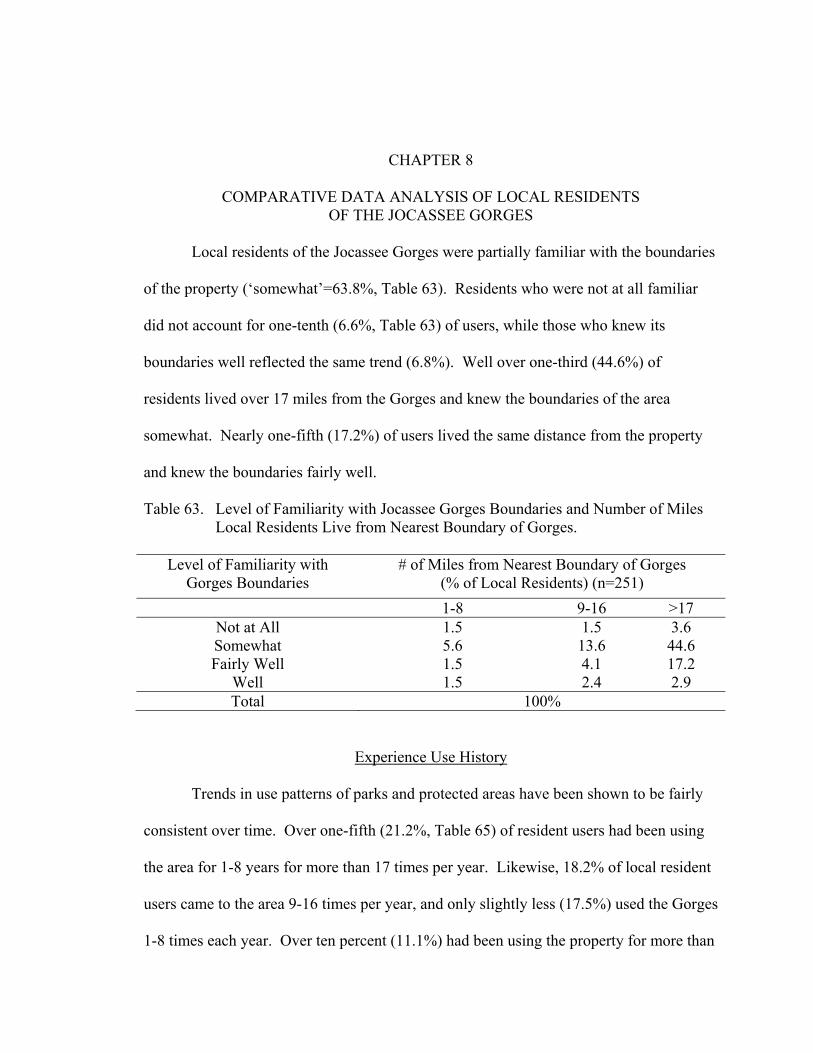
107
CHAPTER 8
COMPARATIVE DATA ANALYSIS OF LOCAL RESIDENTS
OF THE JOCASSEE GORGES
Local residents of the Jocassee Gorges were partially familiar with the boundaries
of the property (‘somewhat’=63.8%, Table 63). Residents who were not at all familiar
did not account for one-tenth (6.6%, Table 63) of users, while those who knew its
boundaries well reflected the same trend (6.8%). Well over one-third (44.6%) of
residents lived over 17 miles from the Gorges and knew the boundaries of the area
somewhat. Nearly one-fifth (17.2%) of users lived the same distance from the property
and knew the boundaries fairly well.
Table 63. Level of Familiarity with Jocassee Gorges Boundaries and Number of Miles Local Residents Live from Nearest Boundary of Gorges.
Level of Familiarity with Gorges Boundaries
# of Miles from Nearest Boundary of Gorges (% of Local Residents) (n=251)
1-8 9-16 >17 Not at All 1.5 1.5 3.6 Somewhat 5.6 13.6 44.6 Fairly Well 1.5 4.1 17.2
Well 1.5 2.4 2.9 Total 100%
Experience Use History
Trends in use patterns of parks and protected areas have been shown to be fairly
consistent over time. Over one-fifth (21.2%, Table 65) of resident users had been using
the area for 1-8 years for more than 17 times per year. Likewise, 18.2% of local resident
users came to the area 9-16 times per year, and only slightly less (17.5%) used the Gorges
1-8 times each year. Over ten percent (11.1%) had been using the property for more than

108
17 years and more than 17 times each year, suggesting a high level of recreational use. A
linear relationship (r=0.11, d.f.=130, p=0.21) was not found between local resident users’
past use of the Gorges and the number of times they visited the property (Table 64).
Table 64. Frequency of Use of the Jocassee Gorges and Historical Use.
Historical Use (Years) Frequency of Use (Times per Year, n=131) (% of Local Residents)
1-8 9-16 >17 1-8 17.5 18.2 21.2 9-16 7.1 3.8 8.4 >17 6.6 6.1 11.1
Total 100% r=0.11, d.f.=130, p=0.21
Recreational Group Characteristics
The structure of social groups engaging in recreation has been shown to affect
the activity type and setting. The size of groups and their primary activities were
distributed across the entire range of activities, probably because resident users were
allowed to select more than one activity. The most frequent activities were day hiking,
motor-boating, fishing, and sightseeing. Over ten percent (11.5%, Table 65) of resident
day hikers hiked in groups with two other people, and almost one-tenth (7.7%) hiked in
groups larger than five people. Similarly, motor-boaters on Jocassee visited the lake in
groups of five or more, suggesting family or friend-oriented groups. Anglers and visitors
driving the area to sightsee typically came in groups of at least three people.
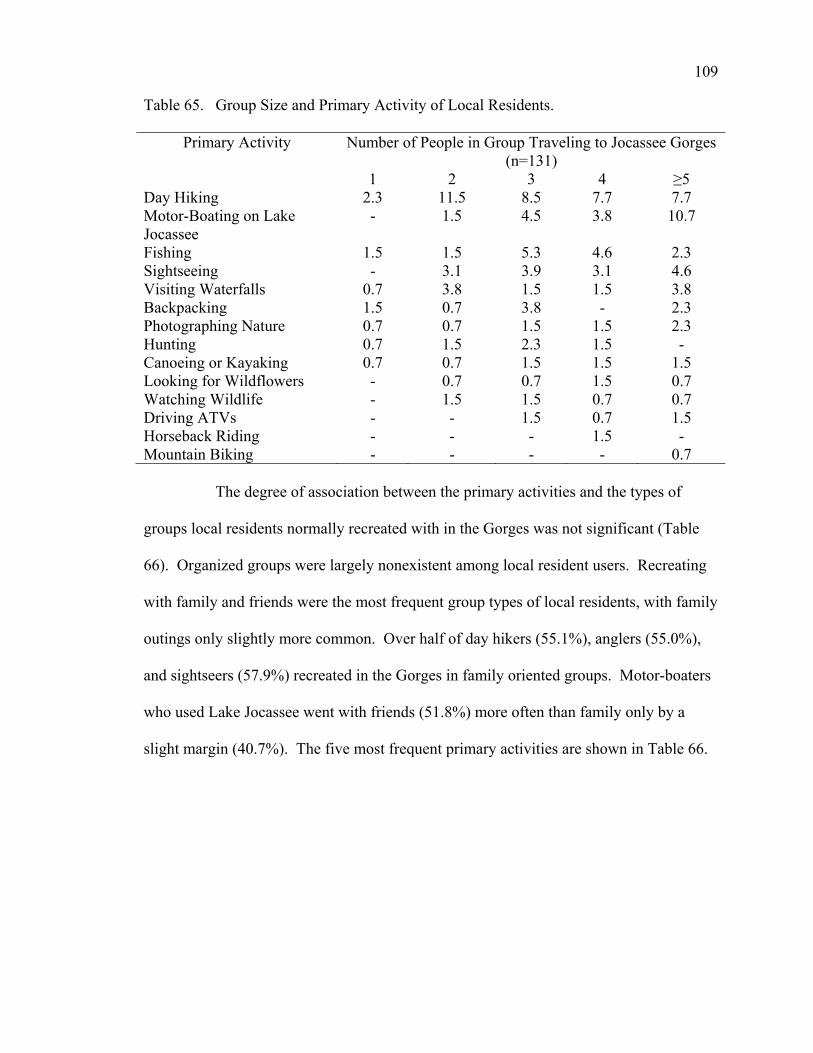
109
Table 65. Group Size and Primary Activity of Local Residents.
Primary Activity Number of People in Group Traveling to Jocassee Gorges (n=131)
1 2 3 4 ≥5 Day Hiking 2.3 11.5 8.5 7.7 7.7 Motor-Boating on Lake Jocassee
- 1.5 4.5 3.8 10.7
Fishing 1.5 1.5 5.3 4.6 2.3 Sightseeing - 3.1 3.9 3.1 4.6 Visiting Waterfalls 0.7 3.8 1.5 1.5 3.8 Backpacking 1.5 0.7 3.8 - 2.3 Photographing Nature 0.7 0.7 1.5 1.5 2.3 Hunting 0.7 1.5 2.3 1.5 - Canoeing or Kayaking 0.7 0.7 1.5 1.5 1.5 Looking for Wildflowers - 0.7 0.7 1.5 0.7 Watching Wildlife - 1.5 1.5 0.7 0.7 Driving ATVs - - 1.5 0.7 1.5 Horseback Riding - - - 1.5 - Mountain Biking - - - - 0.7 The degree of association between the primary activities and the types of
groups local residents normally recreated with in the Gorges was not significant (Table
66). Organized groups were largely nonexistent among local resident users. Recreating
with family and friends were the most frequent group types of local residents, with family
outings only slightly more common. Over half of day hikers (55.1%), anglers (55.0%),
and sightseers (57.9%) recreated in the Gorges in family oriented groups. Motor-boaters
who used Lake Jocassee went with friends (51.8%) more often than family only by a
slight margin (40.7%). The five most frequent primary activities are shown in Table 66.

110
Table 66. Group Type and Primary Activity of Local Residents.
Primary Activity
Group Type Local Residents Recreate with (% of Local Resident Users) (n=131)
Friends Family Organized Group Alone Day Hiking 33.8 55.1 2.0 9.1 Motor Boating on Lake Jocassee 51.8 40.7 - 7.5 Fishing 30.0 55.0 - 15.0 Driving the Area to Sightsee 31.6 57.9 8.3 2.2 Overnight Backpacking 27.3 45.4 9.1 18.2 (X²=1.25, d.f.=12, p=0.87) The three most common primary activities of local resident users were day
hiking, fishing, and sightseeing. Motor-boating on Jocassee was the second most
frequent activity; however, since all use occurred at Lake Jocassee, it is not shown in
Table 67. The distributions of each activity varied largely across the numerous use areas.
Lake Jocassee received the most use according to the data, with almost three-fourths of
local resident hikers (73.4%, Table 68) and sightseers (73.6%) indicating the lake as their
recreation area. Exactly 85.0% of resident anglers used Jocassee for fishing in the past
year. Anglers’ second most frequent fishing destination was the Whitewater River
accounting for 70.0% of anglers. Over two-thirds (67.3%) of local resident day hikers
traveled to Whitewater River/Falls during trips to the Gorges.
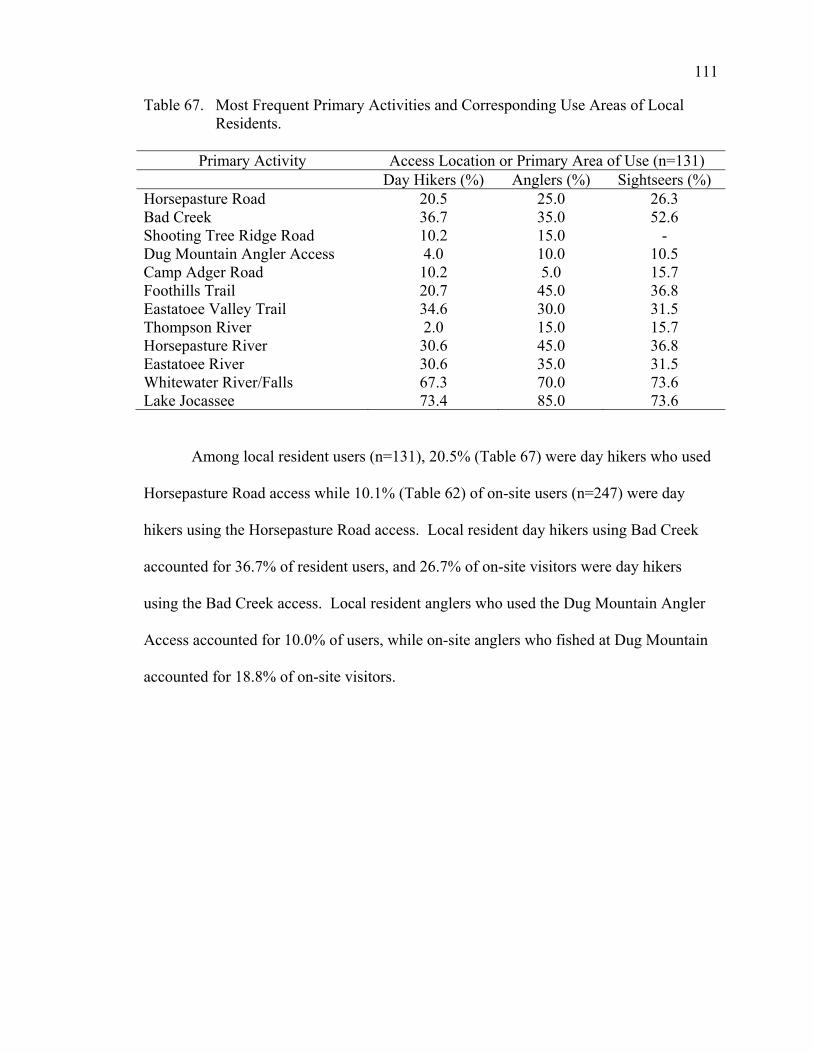
111
Table 67. Most Frequent Primary Activities and Corresponding Use Areas of Local Residents.
Primary Activity Access Location or Primary Area of Use (n=131) Day Hikers (%) Anglers (%) Sightseers (%)
Horsepasture Road 20.5 25.0 26.3 Bad Creek 36.7 35.0 52.6 Shooting Tree Ridge Road 10.2 15.0 - Dug Mountain Angler Access 4.0 10.0 10.5 Camp Adger Road 10.2 5.0 15.7 Foothills Trail 20.7 45.0 36.8 Eastatoee Valley Trail 34.6 30.0 31.5 Thompson River 2.0 15.0 15.7 Horsepasture River 30.6 45.0 36.8 Eastatoee River 30.6 35.0 31.5 Whitewater River/Falls 67.3 70.0 73.6 Lake Jocassee 73.4 85.0 73.6
Among local resident users (n=131), 20.5% (Table 67) were day hikers who used
Horsepasture Road access while 10.1% (Table 62) of on-site users (n=247) were day
hikers using the Horsepasture Road access. Local resident day hikers using Bad Creek
accounted for 36.7% of resident users, and 26.7% of on-site visitors were day hikers
using the Bad Creek access. Local resident anglers who used the Dug Mountain Angler
Access accounted for 10.0% of users, while on-site anglers who fished at Dug Mountain
accounted for 18.8% of on-site visitors.
112
CHAPTER 9
DISCUSSION
On-Site Visitors of the Jocassee Gorges
Over three-fourths of on-site users were residents of South Carolina, and over
twenty percent came from the town of Pickens and the city of Greenville. Day users of
the Jocassee Gorges comprised over two-thirds of the sample, with approximately one-
third staying overnight in the area. This could suggest that many visitors coming to the
Gorges live in fairly close proximity to the area, i.e. within an hour. More hunters had
hunted deer in the Gorges than any other species; bear hunters comprised only about five
percent of visitors. The largest percentage of deer hunters had hunted 17 or more days in
the Gorges in the past year. This could suggest that deer hunters are some of the most
frequent and consistent users of the Gorges, and may remain so for the future. Bear and
small game hunters’ frequency of use was distributed fairly evenly across the range of
days of past use. Even though the sample of hunters was small for this study, the data
suggested patterns of frequent use by bear, deer, and small game hunters, and most likely
the same could be said for turkey hunters during the spring hunting season. The road
counter analysis suggested that bear hunters are frequent and constant users of the Gorges
area (Appendix G, Table 1 and 2), because the opening week of bear season was the
highest recorded use level for both access sites.
The largest segment of on-site anglers fished on rivers and streams;
approximately half the number of stream anglers fished on Lake Jocassee. Over three-
fourths of stream anglers indicated Eastatoee Creek was their typical destination,

113
followed by the Whitewater and Horsepasture River. More on-site anglers had used the
Lower Eastatoee Creek compared to anglers who fished on the Upper Eastatoee Creek.
One reason for this may be that more anglers believe that stocked trout will naturally
travel downstream rather than against current, and anglers are simply following the trout.
The largest portion of stream anglers, Upper and Lower Eastatoee Creek anglers had
fished 17 or more days during the past year. Eastatoee Creek could be a high use area,
which may need more direct and indirect management by the South Carolina Department
of Natural Resources (SCDNR) to ensure regulations are being followed by users.
Because Lake Jocassee is consistently a high use area throughout the summer, it could
suggest that anglers using Lake Jocassee also use streams, even if they consider streams
to be secondary use areas to the lake, e.g. if the lake is too crowded then streams are
available for fishing.
The four access locations of the Jocassee Gorges during the on-site intercept
survey were ranked according to frequency of use by visitors. The access area with the
most intercepts was Bad Creek, followed by Horsepasture Road, Dug Mountain Angler
Access, and Shooting Tree Ridge Road. Among those who responded, over one-third
were heading to Whitewater Falls/River, and a little over one-quarter were going to
Eastatoee Creek. The Foothills Trail and the Eastatoee Valley Trail both received over
ten percent of visitors. The four most frequent secondary areas of use were Horsepasture
Road, Bad Creek or Musterground Road, Lake Jocassee, and the Foothills Trail,
respectively. Only about half of on-site visitors were able to identify the area or areas
within the Gorges they were traveling to. This suggests that many people either did not
know exactly where they were going because it was their first time to the area, did not

114
know the exact name of the area, or did not want to reveal where they were traveling to,
particularly if hunters or anglers. It could also suggest that some visitors were simply
exploring the area. More visitors of the Gorges had discovered the area through friends
and family more than any other means. Barely one-quarter of visitors had discovered the
area through literature or the internet, suggesting a need for an increased awareness of the
property. Given the high education level of on-site users, this could suggest that most
users have not looked for information on the Gorges or were not able to find information
about the area.
South Carolina residents’ primary activities were significantly different from non-
residents’ primary activities. This may suggest that non-residents only use the Gorges for
specific activities, such as bear hunters coming from North Carolina or further away
states. The higher number of resident anglers and day hikers suggests that non-residents
do not prefer to use the Gorges solely for hiking and fishing. It could suggest that non-
residents have other options for recreation, such as North Carolina’s Gorges State Park,
the National Wild and Scenic Chattooga River and other national forests in the area
(Pisgah National Forest, Sumter National Forest, etc.).
The lengths of stay for non-residents and residents were not significantly
different. Both groups stayed on average approximately four hours during a day trip to
the Jocassee Gorges, and two days during overnight trips to the area. This suggests that
once in the area, neither residents or non-residents participated in activities much longer
or shorter than the other. The access points used by South Carolina residents were
significantly different from those used by non-residents. South Carolina residents used
the Bad Creek access more than two-to-one compared to non-residents; this may suggest

115
that non-residents preferred other entrances to the property. It may also suggest that
potential users coming from North Carolina visit Gorges State Park before they can reach
the entrance at Bad Creek. The largest number of non-residents entered the Gorges
through the Bad Creek access however, suggesting they may actually prefer the access
area over others. It could also mean that tourists visiting the Cashiers/Highlands area are
exploring their way to the Gorges and stumble upon the property.
The frequency of use of the Jocassee Gorges by residents and non-residents was
significantly different. Non-residents averaged about half the number of total visits to the
Gorges per year as residents. This may suggest that residents of South Carolina find the
area more accessible than non-residents, perhaps because they live closer or are already
familiar with the area. The findings suggest that perhaps with an increase in public
information efforts to the proper states, it could result in an increase in awareness and use
of the area.
Residents and non-residents’ historical use of the Jocassee Gorges was also
significantly different. Given the age of the property (state-managed in 1998), this
suggests that many residents were using the Gorges before the SCDNR took control of
management. Almost thirty percent of residents of South Carolina used the Jocassee
Gorges for more than ten years. This suggests that this group of users may continue to
use the Gorges while they reside in the area, and may even increase their level of use.
The average non-resident had been using the area for a little over seven years, suggesting
some non-residents did not start using the area until it was under the management of the
SCDNR.
116
Day and overnight users’ primary activities while at the Jocassee Gorges were
significantly different. Day hikers and anglers were the largest groups of day users, while
hunters and backpackers were the largest groups of overnight users. These activities
were understandable because backpacking entails remaining in the area overnight and
many hunters stayed within the property for several nights to hunt. Anglers staying
overnight were most likely fishing as a secondary activity to camping, backpacking or
another activity.
The frequency of use by day and overnight users were not significantly different.
This may suggest that some users come to the Gorges for several nights and do not return
for a long period of time, while day users visit more often and for shorter periods. The
past use of the Gorges by day and overnight users were also not significantly different.
This may suggest that day and overnight users are similar in terms of experience use
history. None of the on-site visitors were surveyed twice during this study, but some day
users could be overnight users and some overnight users are most likely also day users.
Cole (2001a) found that overall, most day users of wilderness were not very different
from overnight users, and that among differences, most were small and of little
importance to managerial decisions. Several similarities were recorded; for example, the
largest percentages of day and overnight users had used the Gorges for more than ten
years, while the second largest percentage of both groups had only used the Gorges for
one year. This may suggest that many visitors have been using the area between 1 to 10
years, and that some variation exists among each group’s visitor characteristics. Cole
(2001a) indicated that day and overnight users typically differed the most in the groups
they normally traveled with for recreation.

117
Use areas within the Jocassee Gorges differed significantly for day and
overnight users. This is reasonably understandable since some of the areas of the Gorges
are more suitable for certain recreation activities better than others. For example,
Whitewater Falls and Eastatoee Creek were popular destinations for day users, and both
have short hiking trails, but the Foothills Trail was one of the most frequent use areas for
overnight visitors. Less than half of the visitors intercepted at the Gorges were able to
indicate a primary area of use, which may suggest they were not familiar with the area or
were exploring the property.
The access points used by Gorges visitors and their past use levels did not
have a significant relationship. This suggests that levels of use experience did not
influence users’ choices of ways to enter the Gorges property. This could also suggest
that many users enter the property from different locations and are still able to reach their
primary use area. Since most of the Jocassee Gorges roads are interconnected, it could be
understandable that even slightly experienced users enter the property in different ways.
Visitors who had been using the area for only one year typically used the Bad Creek
access, while more experienced users who had been using the Gorges ten to twenty years
entered through Horsepasture Road. This may also suggest that along with experience,
Gorges visitors sometimes prefer to use areas which are not as heavily used or easy to
reach. The largest percentage of visitors used Shooting Tree Ridge Road, an area of the
Gorges primarily suited for hunting due to a lack of facilities, trails, streams, etc., and had
been using the area for more than twenty years, which suggests they were primarily
hunters.

118
The linear relationship found between the frequency of use of Jocassee
Gorges users and their historical use of the area may suggest that higher past use levels of
visitors (# of years) may be an indicator of higher frequencies of use (times per year).
There was no linear relationship found between local resident users’ past use of the
Gorges and the number of times they visited the property, which may suggest that visitors
intercepted at the Gorges had higher past use levels than local resident users.
Local Residents of the Jocassee Gorges
The average age of local residents was approximately 42 years, the same as the
on-site users. The most common education level of local residents was a bachelor’s
degree (college graduate), followed by a high school degree or GED-equivalent. The
most frequent family size of local residents was two, but the average was close to four.
The majority of families did not have teenagers still living at home, and nearly one-
quarter of residents had either professional occupations or were retired. This could
suggest that many local residents have no children and are not working, i.e. they have
more time to visit the Gorges on a regular basis. The average income of local residents
was $21,000-$40,000 per year, suggesting that local residents have the ability to travel
some distance for their recreation. Similar to on-site users, local residents also lived in
either small towns or cities, but the cities of Seneca and Greenville were the most
common places of residence, respectively.
Most local residents, about three-quarters, were familiar with the location of the
Jocassee Gorges. Despite this, a significant difference was not found between the
distances local resident users lived from the nearest boundary of the Gorges and their
level of familiarity with its boundaries. This could suggest that closer proximity to the
119
Gorges property does not necessarily result in a higher level of awareness of the area’s
boundaries. Over half of residents were not familiar at all with the boundaries of the
property, but over half were also living more than twenty miles from the nearest
boundary of the property. This also suggests a lack of awareness for the property and its
boundaries among the surrounding population of the Gorges. Recent maps of the area,
i.e. produced within the past two years, are not readily available to the public and are
harder to find compared to other parks and similar wildland areas. It could suggest that
some local residents simply are not interested enough in the area to actively seek out
information concerning it, but a need for more publications or literature is evident. A
mere two percent lived within 1 to 4 miles of the Gorges, which is not surprising since it
is a rural area with a small population.
A large segment of local residents visited the Gorges with their families or
friends, which seems reasonable because the average number of people in groups going
to the Gorges was four. The most frequent primary activities of local residents were day
hiking, fishing, driving the property to sightsee, and motor-boating on Lake Jocassee.
Two of these activities, visiting waterfalls and watching wildlife, were probably
secondary activities to another primary such as hiking or fishing, but the interpretation is
not definite. Local residents used the Gorges most frequently during the summer months,
with July having the highest level of use. The high levels of use when the gates are
closed to the property suggest that many local residents are willing to access the area
without the aid of a vehicle. The winter months received the lowest amounts of use, even
though the gates are opened, suggesting many visitors do not use motorized vehicles to
enter the property or participate in motorized recreation.

120
More than one-third of local residents said their recreation had changed in
frequency over time, and just over a quarter said the type of activity had changed. Over
two-thirds of local residents indicated their level of use had remained largely the same
since the SCDNR took over management of the property, suggesting that many local
residents are satisfied with the management strategies already in place. Over fifteen
percent of residents said their level of use had actually increased since the Jocassee
Gorges came under state management. This could suggest that local residents may favor
the management practices of the SCDNR or find the Gorges more preferable for other
reasons.
Local resident users’ past use of the Gorges and the number of times they visited
the property did not have a linear relationship, unlike on-site users. This may indicate
that on-site users had typically used the area longer in the past and more frequently each
year. The normal group of people local resident users participated with during recreation
at the Gorges was not significantly different between the primary activities of users.
Since family and friends were the two most common groups of resident users visiting the
Gorges, this may suggest that resident users come to the area in both types of groups at
different times or for different types of recreation. Organized groups were largely
nonexistent among local residents, which may suggest visitors consider friends and
family to be casual recreational groups. Among local residents, over half of day hikers,
anglers, and sightseers recreated in the Gorges with family, but motor-boaters typically
went to the lake with friends more often than family.
Nearly three-fourths of hikers and sightseers indicated they used Lake Jocassee as
their primary use area. Local residents who stated they were sightseeing at Lake Jocassee

121
probably meant through the Bad Creek access (Musterground Road allows views of Lake
Jocassee) or they were visiting South Carolina’s Devil’s Fork State Park. Local resident
users were allowed to state more than one primary use area, and as a result over seventy-
five percent of anglers stated they used Lake Jocassee for fishing in the past year and
over one-half of all local resident users stated Whitewater River/Falls was their primary
use area in the Gorges.
Wilderness Visitor Characteristics
Hammitt and Rutlin (1995) found that the average visitor to the Ellicott Rock
Wilderness was most likely a college-educated male about 35 years old, lived in an urban
area in South Carolina, had either a professional or managerial occupation, or was a
student. The average Jocassee Gorges visitor was 42 years old and was at least a high
school graduate. Gorges users most often came from urban areas in South Carolina and
most frequently from the town of Pickens and the city of Greenville. The typical Ellicott
Rock visitor was a day user coming to hike in the wilderness, and usually recreated in a
group of four (4.5) people who were usually friends or family. The average Jocassee
Gorges visitors were also day hikers and came to the area with friends or family with a
group of four (4.1). The average number of years Ellicott Rock users had been recreating
in the area (7.25) was close to that of Jocassee Gorges visitors (10.5). Ellicott Rock
visitors who did not stay overnight accounted for almost two-thirds of users, almost
identical to the percentage visiting for just the day at the Jocassee Gorges (63.5%).
Wilderness Privacy
Hammitt and Rutlin (1995) found that privacy was reasonably important to
Ellicott Rock visitors, and even more so for overnight users of the wilderness area. Since
122
remaining in a wilderness overnight is a larger commitment for the recreationist than a
day visit, that larger commitment could be related to an individual’s need for more
privacy and seclusion from other users while in the wilderness area. Hammitt and Rutlin
also indicated that the small size of the Ellicott Rock Wilderness may have contributed to
the lower than expected value for privacy. Ellicott Rock Wilderness is about 9,000 acres
in size, only a fraction of the Jocassee Gorges (~43,000 acres total). This could suggest
that privacy values for Jocassee Gorges users could possibly be higher depending on the
activity type. Factors which Hammitt and Rutlin indicated that affected the level of
privacy achieved, and in effect the perception of crowding, included the number of other
people encountered in the wilderness, the visitors’ motivations, preferences or tolerances
of the number of encounters of other users or groups, the actual location of encounter(s),
evidence of other visitors e.g. litter, human waste, fire rings, vegetation damage, and
disturbing behavior of other visitors like unnecessary noise. The significant factor which
reduced the level of privacy for Ellicott Rock visitors was the preferred number of
encounters with other users. Hammitt and Rutlin indicated that visitors appeared to have
certain levels of the acceptable number of contacts with other users, and if those levels
were surpassed then the visitor’s sense of privacy was lost. Although similarities in the
characteristics of Jocassee Gorges visitors and those using the Ellicott Rock Wilderness
exist, any parallels in users’ attitudes towards wilderness cannot be firmly established
without further research focusing specifically on the wilderness attitudes of Gorges users.
Hammitt and Rutlin’s findings may be able to provide the SCDNR with probable
information regarding the visitors to the Gorges area.

123
On-Site and Local Resident Use
Conclusions drawn from the results of this study may be related to Burger’s
(2000) findings from visitors of the Savannah River Site in South Carolina, particularly
hunters and anglers. Burger indicated that many Savannah River Site visitors reported
fishing and hunting for more than a combined 45+ days each year at the area. Burger
also pointed out that the data suggested even more use since other activities such as
camping, hiking, and watching wildlife would interfere with days allotted for hunting or
fishing. Burger noted that many of Savannah River Site users indicated they used the
area virtually every day of the year because they were either retired or unemployed and
lived fairly close to the area. Parallels to visitors to the Jocassee Gorges can be found
within Burger’s data results. For example, over one-tenth of Gorges users intercepted on-
site were retired or unemployed, and over one-quarter of local residents interviewed were
also retired or unemployed. Over two-thirds of each sample (on-site users and local
residents) were residents of South Carolina and lived within one hour’s driving distance
from the nearest boundary of the Gorges, allowing easy access to the property. On-site
users who reported using the area more than 50 times per year accounted for 10.0% of
visitors, and many users from both samples indicated they used the Gorges for more than
one or two recreational activities. This could suggest that on-site users and local
residents alike use the Jocassee Gorges at higher levels than were reported in the data.
The Savannah River Site had a maximum recreational assumption use level of fourteen
days per year. Even though a maximum assumption does not exist for the Jocassee
Gorges, use levels may be higher than indicated. The seasonal closing of the area
provides an excellent safeguard against overuse of the resource. Provided that the

124
heaviest use for both on-site users and local residents occurred during the summer
months while the gates were not opened suggests that the Jocassee Gorges are not
underused during the times of the year access gates are closed.
Recreational Group Characteristics
Early empirical evidence (Burch, 1964) showed that different recreation activities
are usually defined by the different structures of the groups of participants. More recent
studies, e.g. Manning (1999) and Andereck, Vogt, Larkin, and Freye (2001), have found
similar results concerning recreational user groups and their social structures. Cole,
Watson, and Roggenbuck’s (1995) visitor characteristics of users to the Shining Rock
Wilderness in North Carolina compared well with Jocassee Gorges users. Gender, age,
education level, place of residence, group size and type, and primary activity variables
were all found to be basically similar to Burch’s findings.
Wilderness Visitor Trends
Roggenbuck and Watson’s (1988) findings of the characteristics of visitors to
wilderness areas in the National Wilderness Preservation System appear similar to
Jocassee Gorges users, with several exceptions. The age range of Gorges visitors was
found to be slightly higher (perhaps due to an older surrounding population), and the
gender of users was not as overrepresented by males as Roggenbuck and Watson
indicated in their findings. Wilderness visitors’ place of residence (in terms of population
size), educational level, occupation type, and income level were very similar to those of
Jocassee Gorges users. Most Gorges users were not members of any type of conservation
or outdoor organization. Jocassee Gorges visitors typically came to the area with their
family or in a small group, and on average, stayed for a short length of time (one day or

125
less). The common activities for wilderness users were the same for Jocassee Gorges
visitors, i.e., hiking and fishing also being the two most frequent activities.
Perceptions of Hunters
Daigle, Hrubes, and Ajzen (2002) examined beliefs, attitudes, and values among
hunters, wildlife viewers, and other outdoor recreationists. The authors found that
hunters usually believed that more positive outcomes came as result of hunting when
compared to other types of recreation. Their findings supported the idea that some
groups of recreationists are more able to produce benefits from their recreation which
they desire. This could be an important suggestion for the SCDNR because, “The choice
of a particular leisure activity may not only be closely related to the specific benefits
people derive, or believe they derive, but also tied to the perceived likelihood that the
benefits will be produced,” (p. 15). If this were true for Jocassee Gorges hunters, it may
set them apart from other groups of recreationists in terms of caring for the area and
behavior types while participating in recreation. Heberlein and Kuentzel (2002)
examined how the human dimensions of wildlife management were related to the
biological dimensions of deer management during a series of hunter density experiments
at Sandhill Wildlife Demonstration Area, Wisconsin. The authors found that, despite the
research on perceived crowding and reduced satisfaction with the overall experience,
some Wisconsin doe hunters were not as negatively affected as others by encounters with
other hunters. They found that during the doe hunting season framework, buck and doe
hunters were both negatively affected by crowding in terms of satisfaction; however,
seeing, shooting, and ultimately harvesting deer increased levels of satisfaction more than
crowding could lower satisfaction. This could be applicable for the SCDNR, since only

126
two weekends during the deer hunting season are opened for either-sex hunting in the
Gorges. These two weekends in November may host larger numbers of deer hunters than
any other weekend based solely on the freedom to harvest either sex of deer. Heberlein
and Kuentzel’s findings may be found to be overall similar to those of Gorges hunters
and suggest that hunters have lower levels of perceived crowding during those weekends
because other hunters are actually helping move the deer throughout the property as a
result of their own movements. The authors’ conclusions show the problems agencies
have with managing recreational use relying on collective standards of norms.
Wildlife Values Among Hunters and Anglers
Zinn, Manfredo, and Barro (2002) examined patterns of wildlife value
orientations within hunters’ families through a mail survey of Pennsylvania and
Colorado-licensed hunters. The authors found that although the initiation of adolescent
males into hunting by older male family members was common, the initiation of
adolescent females by older family members of either gender was much rarer. Zinn et al.
stated that, “Gender differences in hunting initiation and participation may be part of a
complex of behaviors and beliefs that have served cultural stability by reinforcing
traditional gender roles in U.S. society,” (p. 157). The authors also found that males
thought their own beliefs concerning wildlife were more similar to those of other males
than females. The authors thought that males’ beliefs were more utilitarian while
females’ beliefs seemed to be more protectionist in nature. Since the large majority of
hunters contacted on-site were male, the SCDNR may find a representative number of
utilitarian and protectionists to be the optimal types of groups using the Gorges, given the
property’s valuable resources and delicate nature. Hunt, Haider, and Armstrong (2002)

127
focused on attempting to understand decisions anglers made to harvest fish. The authors
found that the harvesting behaviors of tourist anglers were affected by their catch rates of
desirable substitute fish species. This finding could be essential to the SCDNR since the
restoration of the Eastern brook trout to parts of the Jocassee Gorges is currently one of
the largest conservation projects underway in the area. With fishing ranking as one of the
most frequent primary activities of on-site users and resident users alike, making a
substitute fish available to anglers, such as rainbow trout, may reduce angler tendencies
to harvest brook trout in the Gorges, whether legally or illegally. Managers could take
the perception that as harvest rates of less wanted fish species increase, the catch rates of
more desirable fish species may actually decrease. If the Eastern brook trout restoration
project currently underway in the Jocassee Gorges becomes a success and anglers are
able to harvest their population and their abundance begins to decline, “Fisheries
management strategies must include considerations for the expected increased
exploitation of underutilized species in addition to considerations for decline of the
desirable fish stock.”
Management Implications
Direct and Indirect Approaches
The SCDNR could follow direct and/or indirect management approaches for the
Jocassee Gorges. Direct management basically involves a limited freedom of choice on
the user’s part due to managers enforcing high levels of regulation on visitor behavior.
Indirect management attempts to influence visitor behavior rather than enforcing
regulations to change behavior. The SCDNR has utilized direct and indirect management
strategies for the Jocassee Gorges. Direct management could include conservation

128
officers enforcing South Carolina regulations for the Gorges area and the seasonal
closings of the property’s gated roads. Indirect management could include conservation
education efforts employed through the use of signage within the Jocassee Gorges
(controlled burn areas, trail restoration sites, etc.), literature publications (newspapers,
South Carolina Wildlife, Jocassee Gorges Newsletter), and public outreach groups and
workshops that focus on educating the public about the sensitive nature of the Gorges
ecosystem. Hendee, Catton, Marlow, and Brockman (1968) found that visitors with the
highest educational levels and who were also members of conservation or wilderness
groups demonstrated more wilderness-oriented values. Watson, Hendee, and Zaglauer
(1996) found that among visitors to Eagle Cap Wilderness, education levels and outdoor
organization group membership had both increased. Hendee et al. also indicated that
stronger wilderness values and codes of behavior while in wilderness accompanied an
increase in educational levels of visitors.
Cole, Watson, and Roggenbuck (1995) indicated that over time, exposure to
constant educational messages combined with sound management usually led to better
behavior on the users’ part. Conservation education efforts are currently being
implemented by the SCDNR in the Jocassee Gorges. Educational messages concerning
controlled burns which have been conducted on the property and select cuts or thinning
efforts in the forest are posted in order to inform the public about current and future
management efforts. Informing visitors what managers are doing for the resource is
important because existing visitors might be more likely to question or be critical of
management actions and/or programs which they do not think are consistent with their
previous experience or because they feel they are unnecessary. The higher levels of

129
education found among on-site users and local residents could suggest the public is more
than able to comprehend complex educational messages. Another implication Cole et al.
found was the lack of support from some visitors for actions which are attempting to
restore natural conditions of wilderness but also interfere with users’ preferred activities
for the area. This is especially true for the Jocassee Gorges because the primary
management objective for the property is to keep it in its most natural state and prevent
activities which threaten its character. Cole et al. indicated that managing agencies have
to perform better when convincing the public a certain management policy’s importance
or they will need to reevaluate their policies already in place. Major conservation and
land preservation efforts (Eastatoee Creek and Laurel Fork Heritage Preserves) have
taken place in the Gorges as well as important wildlife and fisheries restoration projects
including white-tailed deer, peregrine falcons, Eastern brook trout, and Eastern wild
turkey. The SCDNR has done a good job informing the public when these programs are
taking place, and why they are important endeavors.
Wilderness Visitor Characteristics
Many wilderness areas are surprisingly being managed without access to baseline
visitor use data on recreational use patterns and their effects (Cole, 1993). This study can
help the SCDNR implement management strategies which are already set in place, and to
design new strategies for implementation. The profile of on-site users and local residents
alike could be used as a management tool for future managerial decisions which concern
maintaining the ecosystem of the Jocassee Gorges and providing recreational
opportunities that do not alter the natural character of the area. The visitor and social
carrying capacity of the Jocassee Gorges are major components in planning for the

130
recreation element of the area’s overall management plan. The levels of use indicated by
on-site visitors and local residents of the Gorges could be indicators for predicted and
actual use. This study can serve as reliable baseline data of visitor use and use patterns
for the SCDNR. Cole, Watson, and Roggenbuck (1995) found that overall, visitors to
Shining Rock Wilderness in 1990 generally had the same preferences for conditions of
the wilderness and they supported the same management procedures as their predecessors
who were surveyed in 1972. Cole et al. also indicated that their findings could suggest
that characteristics of wilderness visitors, their attitudes and management preferences,
and their use patterns could remain constant regardless of the degree of shifts in the types
of people who use wilderness or wildland areas. Managers may not have to worry about
sociodemographic shifts in visitors in the future if this finding is true, but more research
is needed. If the SCDNR remains consistent with their management strategies, visitors
should be more likely to positively respond to future programs.
Day and Overnight Users
Since almost two-thirds of on-site users interviewed in the Gorges were day users,
future management may need to focus on protecting the area from impacts associated
with the day use of wilderness. Most research does not suggest that the needs and desires
of day users are much different than overnight users. Cole (2001) indicated that the real
challenge for managers is managing day use in such a manner that wilderness resources,
both biophysical and experiential, remain protected. Cole’s statement leads managers to
the question of whether day use should be limited or not, to what level, and on what
basis. This question relates most strongly with the management of heavily used parts of
wilderness areas, as with the Jocassee Gorges. Biophysical impacts have been found to

131
be substantial but confined to a smaller part of the overall landscape. Cole found that
resource impacts could be limited through successful site management strategies, such as
using containment procedures combined with restoration efforts. Cole noted that most
research on use limits has dealt with concerns about solitude and the number of groups
encountered and are not very helpful in establishing a basis for setting use limits where
use is heavy. More heavily used areas in the Gorges such as the Lower Whitewater Falls
trail, parts of the Foothills Trail, Eastatoee Creek, and others may need to be examined
for possible negative impacts from day use.

132
CHAPTER 10
CONCLUSION
The types of outdoor recreation users of the Jocassee Gorges (Objective 1) were
identified by determining the primary and secondary activities of on-site users and local
resident users of the Gorges. The distribution of use within Jocassee Gorges (Objective
2) was determined by recording the most frequently used times of the year (temporal
distribution) and the areas used and access points used (spatial distribution) in the
Gorges. The most frequently used areas within the Gorges (Objective 3) were identified
by determining the locations of the most commonly used areas of on-site users and local
resident users. The locations of particular settings for special uses were determined while
identifying the most frequently used areas and the types of outdoor recreation they
supported within the Jocassee Gorges. The profiles (Objective 4) of Jocassee Gorges
users (on-site visitors and local residents) were determined through the data analysis from
the on-site survey and telephone survey of local residents. The profile was established
using characteristics such as education, individual residence, age, gender, group
composition, occupation, and past experience history in the Jocassee Gorges. Summaries
of on-site visitors and local resident users’ background characteristics, activities, and use
areas were provided. Use patterns of on-site users and local resident visitors (Objective
5) were identified through examining day versus overnight use, resident versus non-
resident users, lengths of stay in the Gorges, and experience use history. An estimate of
road traffic was produced through an analysis of two traffic counters which were

133
implemented during both periods of the year (Spring and Fall/Winter) when gates to the
Jocassee Gorges were opened.
Future Studies
Recommendations for future research include examining the perceptions of
visitors of the Jocassee Gorges concerning their recreation resource preferences and their
attitudes toward the management strategies of the SCDNR. Future research may need to
focus more on day hikers, anglers, and hunters because the three groups are frequent and
consistent users of the Gorges area. Research also needs to be focused on different
groups of hunters, such as bear hunters vs. deer hunters, or big-game hunters vs. small-
game hunters, in order to examine whether their beliefs, attitudes, and/or behaviors are
different or similar.
The number of researchers would have to be increased for future studies in order
to effectively cover the large size of the Gorges property. If researchers cannot be fielded
to conduct surveys, then placing fixed survey stations throughout the Gorges may be the
only feasible option. The response rate and accuracy of the survey may be affected, so
the survey station data will need to be monitored. Future research efforts need to be
coordinated with North Carolina’s Gorges State Park in order to examine the difference
in user groups as well as any similarities. It would also be beneficial to examine
Foothills Trail users in depth, perhaps through the assistance of the Foothills Trail
Conference. Certainly, informing the public on the possibilities of future research may
help in activating grassroots-type efforts for studying the area, and any volunteer
assistance would effectively reduce costs of research and allow funds to be channeled in
other research directions.

134
The effectiveness of future research would be improved with an annual or
biennial research budget. The large size of the Jocassee Gorges (>43,000 acres), its
relatively remote location, the need for more field researchers, and higher fuel prices are
all contributing factors for a need for increased research funds.
Cole (2001) indicated that more research needs to focus on day use because the
day visit differs more from the overnight visit than day users differ from overnight users.
The same could be said for visitors of the Jocassee Gorges because day users
outnumbered overnight users two to one among on-site visitors. A mail-in survey of
local residents may be more effective than a telephone survey and result in more
information regarding visitor use characteristics of the Gorges. On-site users who
volunteered their addresses as well as the mailing list for the Jocassee Journal could be a
sample of Gorges users; however, there is a possibility it would be a bias sample of the
most committed and purist users of the Jocassee Gorges.
The Jocassee Gorges Outdoor Recreation Use Survey could prove useful as
baseline visitor use data that can serve as the basis for future research. More research is
needed at the Jocassee Gorges to ensure it continues to be managed responsibly and
remains protected for future generations of outdoor recreationists.

135
APPENDICES

136
Appendix A
On-Site Visitor Survey
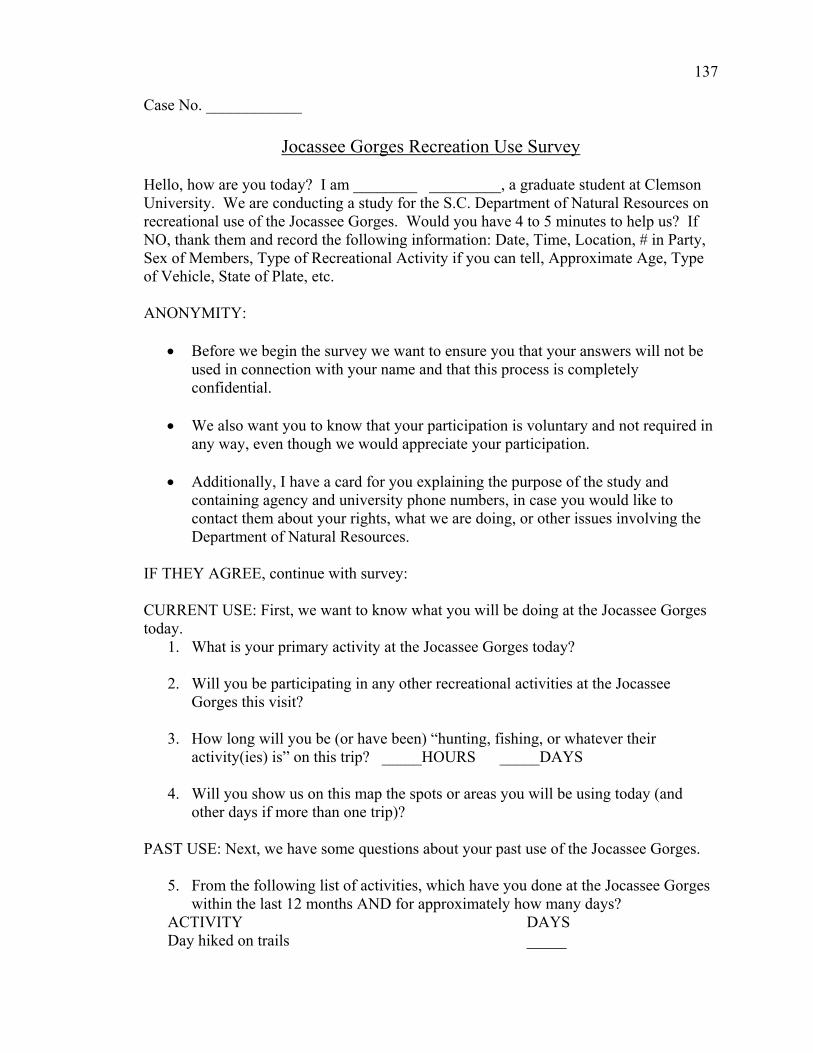
137
Case No. ____________
Jocassee Gorges Recreation Use Survey Hello, how are you today? I am ________ _________, a graduate student at Clemson University. We are conducting a study for the S.C. Department of Natural Resources on recreational use of the Jocassee Gorges. Would you have 4 to 5 minutes to help us? If NO, thank them and record the following information: Date, Time, Location, # in Party, Sex of Members, Type of Recreational Activity if you can tell, Approximate Age, Type of Vehicle, State of Plate, etc. ANONYMITY:
• Before we begin the survey we want to ensure you that your answers will not be used in connection with your name and that this process is completely confidential.
• We also want you to know that your participation is voluntary and not required in
any way, even though we would appreciate your participation.
• Additionally, I have a card for you explaining the purpose of the study and containing agency and university phone numbers, in case you would like to contact them about your rights, what we are doing, or other issues involving the Department of Natural Resources.
IF THEY AGREE, continue with survey: CURRENT USE: First, we want to know what you will be doing at the Jocassee Gorges today.
1. What is your primary activity at the Jocassee Gorges today?
2. Will you be participating in any other recreational activities at the Jocassee Gorges this visit?
3. How long will you be (or have been) “hunting, fishing, or whatever their
activity(ies) is” on this trip? _____HOURS _____DAYS
4. Will you show us on this map the spots or areas you will be using today (and other days if more than one trip)?
PAST USE: Next, we have some questions about your past use of the Jocassee Gorges.
5. From the following list of activities, which have you done at the Jocassee Gorges within the last 12 months AND for approximately how many days?
ACTIVITY DAYS Day hiked on trails _____

138
Mountain biked _____ Drove ATV _____ Drove area to sightsee _____ Backpacked overnight _____ Went hunting _____ Went fishing _____ Canoed or kayaked _____ Boated on Lake Jocassee _____ Watched wildlife _____ Looked for wildflowers _____ Photographed nature _____ Visited waterfalls _____ Visited historic sites _____ OTHER: Please Specify ____________________________
6. On this map, would you show us the most common spot or area AND second
most common spot/area where you do your most common activities?
7. How many YEARS have you been doing these activities in the Jocassee Gorges? _____YEARS
8. On average, about how many TIMES per year do you use the Jocassee Gorges for
these activities? _____TIMES
9. IF hunting and/or fishing have been your major activities in the Jocassee Gorges, what types of hunting and/or fishing were they?
ACTIVITY DAYS Hunting for bear _____ Hunting for deer _____ Hunting for other game (rabbits, squirrels, etc.) _____ Fishing in Lake Jocassee _____ Fishing in rivers and streams _____ What stream were you fishing on? _________________ If fishing in Eastatoee, was it: Upper Eastatoee (North of Twin Falls Rd) _____ Lower Eastatoee (South of Twin Falls Rd) _____
BACKGROUND CHARACTERISTICS: Finally, we would like to have some background information about you.
10. In what year were you born? _____ Gender: (just record) _____ Education: how many years of school do you have? _______________________ Occupation: What type of work do you do? (Include retirement.) ____________ How many total members, including yourself are in your household? _____ City: _________________

139
State: _________________ ASK THEM IF THEY WOULD BE WILLING TO PARTICIPATE IN A LONGER, MAIL SURVEY AT A LATER DATE REGARDING MANAGEMENT ISSUES IN THE JOCASSEE GORGES. IF THEY WOULD – RECORD THEIR NAME AND ADDRESS ON THE SEPARATE ROSTER AND ENSURE THEM THAT GIVING THEIR NAME WILL NOT BE ASSOCIATED WITH THE INFORMATION THEY JUST PROVIDED.

140
Appendix B Visitor Contact Card

141
Survey of Outdoor Recreation Use of the Jocassee Gorges The purpose of this Clemson University study is to determine the scope of different outdoor recreation activities, participation rates, and uses of the Jocassee Gorges area. Data from this research will be used to advise management decisions by SCDNR. If you have questions about this survey, please contact Dr. William Hammitt at Clemson University at (864)656-3400. If you have questions about your rights as a participant, you may contact the Clemson University Office of Research Compliance at (864) 656-6460. If you have any additional questions or comments about the Jocassee Gorges and its management, feel free to call the Department of Natural Resources at (864) 654-1671. Your participation in this study is strictly voluntary. You are under no obligation to participate. If you choose to participate, your responses will be held in the strictest confidence. All data will be reported as an aggregate and never associated with any individual.

142
Appendix C Field Researchers’ Script

143
Hello, how are you today? I am ________ _________, a graduate student at Clemson University. We are conducting a study for the S.C. Department of Natural Resources on recreational use of the Jocassee Gorges. Would you have 4 to 5 minutes to help us? If NO, thank them and record the following information: Date, Time, Location, # in Party, Sex of Members, Type of Recreational Activity if you can tell, Approximate Age, Type of Vehicle, State of Plate, etc. ANONYMITY:
• Before we begin the survey we want to ensure you that your answers will not be used in connection with your name and that this process is completely confidential.
• We also want you to know that your participation is voluntary and not required in
any way, even though we would appreciate your participation.
• Additionally, I have a card for you explaining the purpose of the study and containing agency and university phone numbers, in case you would like to contact them about your rights, what we are doing, or other issues involving the South Carolina Department of Natural Resources.

144
Appendix D List of On-Site Survey Refusals

145
April 2, 2005—Shooting Tree Ridge Road 11:47 a.m.: 2 males, mid 20’s, hunting, pickup truck with SC plates 11:53 a.m.: 1 male, 25-30 years old, hunting, mini van with SC plates 12:18 p.m.: 3 males, mid-50’s, hunting, pickup truck with SC plates 12:58 p.m.: 2 males, 30’s, hunting, pickup truck with NC plates 1:04 p.m.: 2 males and 1 female, early 20’s, hunting, pickup truck with SC plates and two ATVs on trailer 1:21 p.m.: 1 male, 50’s, hunting, jeep with SC plates 2:06 p.m.: 1 male, late 20’s, hunting, pickup with SC plates April 15, 2005—Bad Creek (Musterground Road) 10:30 a.m.: 3 males, 1 female, 55-65 years old, hikers, Asheville, NC, Toyota Sedan April 16, 2005—Horsepasture Road 3:50 p.m.: 1 male, 60’s, day hiking, walked by, no vehicle in parking lot May 27, 2005—Horsepasture Road 2:30 p.m.: Father with two daughters declined survey, truck with SC plates May 28, 2005—Dug Mountain Angler Access 9:32 a.m.: Older man with two younger adult males declined survey, truck with SC plates 10:05 a.m.: Two parties missed while surveying another; both were adult male parties, one truck and one jeep both with SC plates July 2, Dug Mountain Angler Access 8:45 a.m.: 1 male and 1 female approximately 30 years old, fishing, 4-door Chevrolet sedan with SC plates 9:37 a.m.: 1 adult male approximately 30 years old and 3 young boys approximately 10-12 years old, all fishing, Ford pickup with SC plates

146
11:10 a.m.: 1 male and 1 female, approximately 45 years old, day hiking, Subaru Baja with NC plates November 13, 2005—Horsepasture Road 11:48 a.m.: 1 adult male and 1 adult female, approximately 40-45years old, pickup truck, no license plate 11:57a.m.: 3 white males, approximately 35-45years old, SC plate, dirt biking

147
Appendix E Mail-In Survey Script

148
ASK THEM IF THEY WOULD BE WILLING TO PARTICIPATE IN A LONGER, MAIL SURVEY AT A LATER DATE REGARDING MANAGEMENT ISSUES IN THE JOCASSEE GORGES. IF THEY WOULD – RECORD THEIR NAME AND ADDRESS ON THE SEPARATE ROSTER AND ENSURE THEM THAT GIVING THEIR NAME WILL NOT BE ASSOCIATED WITH THE INFORMATION THEY JUST PROVIDED.

149
Appendix F Mail-In Survey Roster

150
Mail-In Survey Roster Jocassee Gorges Recreation Use Study
Name: Address:
Name: Address: Name: Address: Name: Address: Name: Address:
Name: Address: Name: Address: Name: Address: Name: Address:
Name: Address: Name: Address: Name: Address: Name: Address:
Name: Address:

151
Appendix G Road Counter Analysis
152
Analysis of Road Counter Data within the Jocassee Gorges Natural Area
Thomas C. Warren
Parks, Recreation, and Tourism Management Department Clemson University
December 2006
153
Introduction Two roadside traffic counters (MetroCount® Vehicle Classifier System,
Roadside Unit Model MC5600) were obtained by the South Carolina Department of
Natural Resources (SCDNR) under the Jocassee Gorges Outdoor Recreation User Survey
study, contracted to Clemson University’s Parks, Recreation, and Tourism Management
Department. The traffic counters were then placed on two entrance points to the Jocassee
Gorges, one at Shooting Tree Ridge Road and the other unit at Horsepasture Road.
The units were placed on entrance points at two different times of the year in
order to coincide with the opening of the roads and to monitor seasonal traffic. During
off-season times of the year, the units were removed and placed in storage for their own
protection and in order to retrieve data immediately after roads were closed to prevent
any data corruption.
The traffic counters were not calibrated to measure different numbers of axles on
vehicles, trailers, or the speed of the vehicle. The units were used solely as a measuring
tool of the number of ‘hits’ or vehicles that traveled across the entrance points each day
and the corresponding time of crossing. Since vehicles traveling into the Gorges have to
exit the area the same way they entered, the data may be slightly skewed. A more
accurate measure of total hits would be closer to half of the actual measurement, since
vehicles most likely traveled over the measuring strips twice, and the second figure is
indicated and shown within the parentheses in the tables further in this paper.
Altogether, the four sections of this paper analyze and discuss the two different
seasons the roads were opened to the Jocassee Gorges, and subdivided by each unit’s
measurements. The methods used to utilize the counters are also discussed and a brief
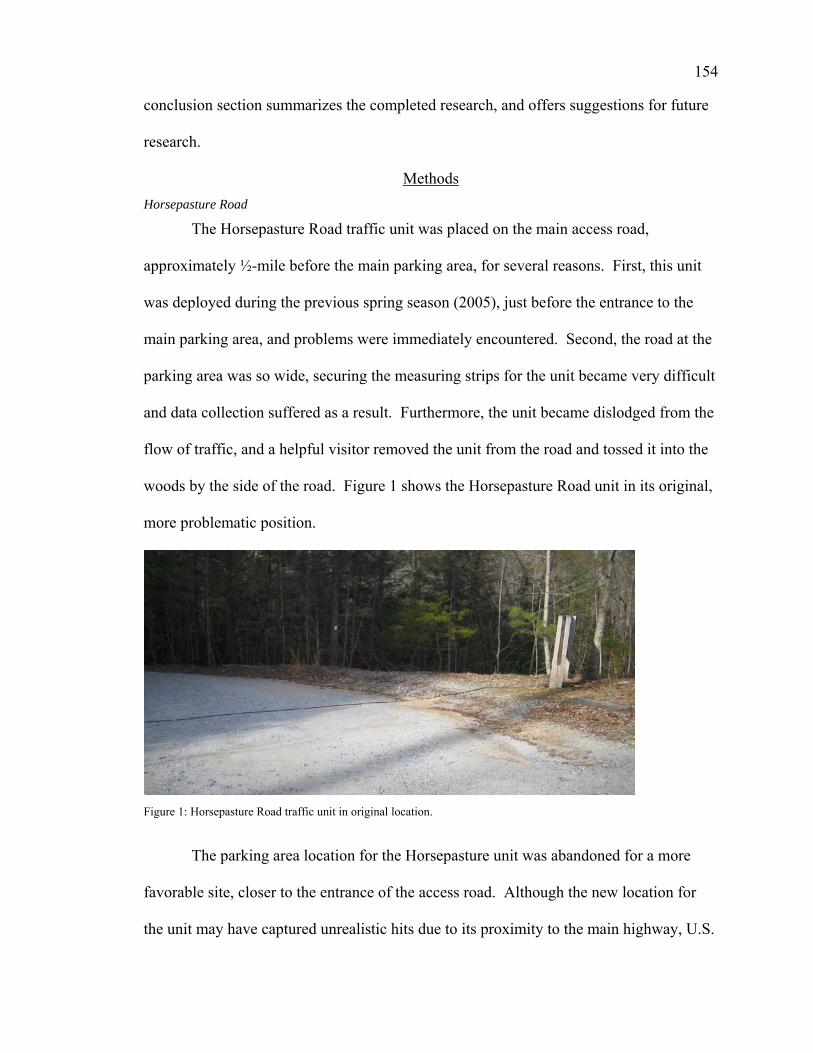
154
conclusion section summarizes the completed research, and offers suggestions for future
research.
Methods Horsepasture Road
The Horsepasture Road traffic unit was placed on the main access road,
approximately ½-mile before the main parking area, for several reasons. First, this unit
was deployed during the previous spring season (2005), just before the entrance to the
main parking area, and problems were immediately encountered. Second, the road at the
parking area was so wide, securing the measuring strips for the unit became very difficult
and data collection suffered as a result. Furthermore, the unit became dislodged from the
flow of traffic, and a helpful visitor removed the unit from the road and tossed it into the
woods by the side of the road. Figure 1 shows the Horsepasture Road unit in its original,
more problematic position.
Figure 1: Horsepasture Road traffic unit in original location.
The parking area location for the Horsepasture unit was abandoned for a more
favorable site, closer to the entrance of the access road. Although the new location for
the unit may have captured unrealistic hits due to its proximity to the main highway, U.S.

155
Highway 178, the unit was secure throughout the season, did not attract attention to users,
and effectively captured hits throughout the fall and winter seasons. Figure 2 shows the
Horsepasture roadside unit in its second, more improved location.
Also in Figure 2, the double tube technique of collecting hits was employed in an
attempt to capture the speed and number of axles of vehicles and possible trailers.
However, due to time restraints and lack of information from the MetroCount® Company
on exactly how to calibrate the units for different vehicles and/or trailers, the units served
as basic counting devices.
Figure 2: Horsepasture Road traffic unit in improved location.
Shooting Tree Ridge Road
The Shooting Tree Ridge Road traffic unit was deployed at the entrance gate of
the access road, and maintained a high level of successful data collection throughout the
fall and winter seasons. Shooting Tree’s access was more accommodating for the
roadside units to adapt to, in comparison to Horsepasture Road. The main reason for its
simplicity is because the entrance forms a bottleneck, through which all vehicles must
pass, unless they choose to park in the somewhat small parking area outside the gate.
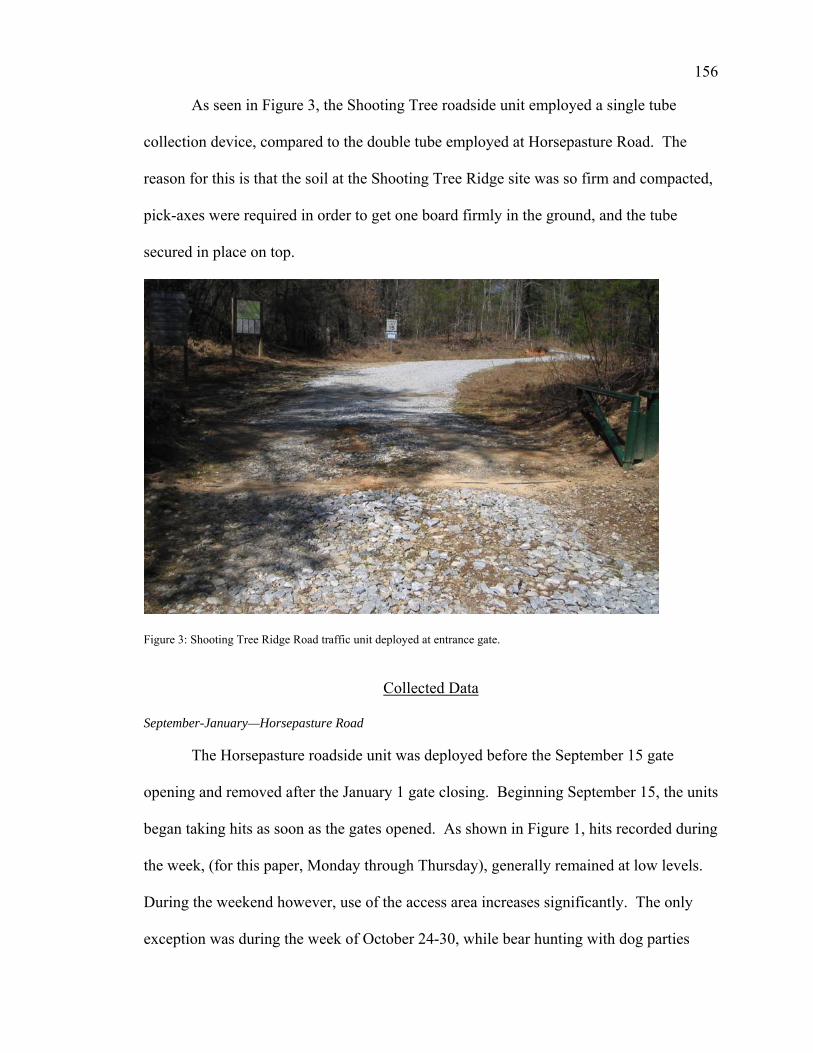
156
As seen in Figure 3, the Shooting Tree roadside unit employed a single tube
collection device, compared to the double tube employed at Horsepasture Road. The
reason for this is that the soil at the Shooting Tree Ridge site was so firm and compacted,
pick-axes were required in order to get one board firmly in the ground, and the tube
secured in place on top.
Figure 3: Shooting Tree Ridge Road traffic unit deployed at entrance gate.
Collected Data
September-January—Horsepasture Road
The Horsepasture roadside unit was deployed before the September 15 gate
opening and removed after the January 1 gate closing. Beginning September 15, the units
began taking hits as soon as the gates opened. As shown in Figure 1, hits recorded during
the week, (for this paper, Monday through Thursday), generally remained at low levels.
During the weekend however, use of the access area increases significantly. The only
exception was during the week of October 24-30, while bear hunting with dog parties

157
was open from the 23-28. This week was the most dramatic jump in use over the entire
fall and winter seasons, and in one week, totaled nearly more than all Saturdays within
the time frame combined. Furthermore, during the week bear season was open to still
hunting only, use was a mere fraction of the following week when hunters were able to
use their dogs to hunt bears.
During the opening of muzzleloader and archery seasons for deer, visitor use was
not very high except for the weekends when use appeared to pick back up, primarily on
Saturdays and Sundays. Once the normal firearm season for deer opened, use levels rose
only slightly during the week and only slighter on the weekend.
The last week the gates were open, deer season had been closed since December
22, yet use levels were interestingly the second highest week during the entire season the
roads were open.
Horsepasture Road—September through January
Week Monday Tuesday Wednesday Thursday Friday Saturday Sunday Total Rank September 15th-18th 11 36 68 61 176 11th September 19th-25th 14 4 9 15 35 37 44 158 14th September 26th-October 2nd
14 23 7 17 21 53 69 204
7th
October 3rd-9th 12 18 24 5 19 56 57 191 8th October 10th-16th 26 27 26 27 34 63 86 289 4th October 17th-23rd 23 31 31 33 39 50 72 279 5th October 24th-30th 193 132 128 83 117 90 55 798 1st October 31st-November 6th
14 24 15 11 19 49 54 186
10th
November 7th-13th 25 14 18 16 26 71 61 231 6th November 14th-20th 24 20 16 15 17 59 45 196 9th November 21st-27th 18 20 27 62 88 73 20 308 3rd November 28th-December 4th
11 21 15 14 15 52 27 155
15th
December 5th-11th 16 16 16 15 21 48 34 166 13th December 12th-18th 16 25 9 7 15 37 22 131 16th December 19th-25th 15 23 19 30 54 20 14 175 12th December 26th-January 1st
45 29 18 36 113 33 46 320
2nd
Total 466 427 378 397 669 859 767 3963 Table 1: Horsepasture Road traffic counter daily and weekly hit totals during September 15th through January 1st, 2006.

158
September-January—Shooting Tree Ridge Road
The Shooting Tree roadside unit was also deployed prior to the gate opening on
September 15 and removed after the gate’s closing on January 1. As seen in the previous
dataset, as well as in Figure 2, the week bear season was open and use of dog parties was
allowed, was by far the most heavily used time of the season, and again ranked nearly
more than all Saturdays combined in the time frame. The second highest week of visitor
use came at the first week of normal firearm season for deer, October 11-16, whereas
with the Horsepasture area, the same week was fourth in rank. In addition, it was also
interesting that the two weeks in which deer season was closed to gun hunts, were the
first and third most used weeks of the fall and winter season. Whether this means visitors
were hunting small game or bear, riding ATVs, or simply scouting for deer hunting
remains a question the roadside units could not solve.
Shooting Tree Ridge Road—September through January
Week Monday Tuesday Wednesday Thursday Friday Saturday Sunday Total Rank September 15th-18th 11 28 23 23 85 15th September 19th-25th 11 19 11 12 30 50 40 173 9th September 26th-October 2nd
22 26 20 13 30 64 39 214
4th
October 3rd-9th 19 15 21 7 12 83 51 208 5th October 10th-16th 28 48 20 21 29 62 43 251 2nd October 17th-23rd 25 15 22 44 29 46 56 237 3rd October 24th-30th 86 80 133 100 69 129 39 636 1st October 31st-November 6th
2 21 18 11 30 62 39 183
7th
November 7th-13th 19 13 14 14 28 65 29 182 8th November 14th-20th 12 16 17 23 35 52 29 184 6th November 21st-27th 17 19 34 47 60 42 32 251 2nd November 28th-December 4th
9 12 7 14 20 43 14 119
13th
December 5th-11th 16 17 10 12 20 69 9 153 10th December 12th-18th 10 10 11 12 20 23 13 99 14th December 19th-25th 20 21 20 22 12 17 11 123 12th December 26th-January 1st
24 23 15 22 17 19 18 138
11th
Total 320 355 373 385 469 849 485 3236 Table 2: Shooting Tree Ridge Road traffic counter daily and weekly hit totals during September 15th through January 1st, 2006.

159
March- May—Horsepasture Road
During the spring, the roadside unit at Horsepasture Road was deployed prior to
the gates opening on March 20 and then retrieved after the gates had been closed on May
10. As shown in Figure 3, the second and third week of April were the most heavily used
time period for the Laurel Valley area in the spring. Not surprisingly, the two weeks at
the beginning of wild turkey season, which began April 1 and ended May 1, followed in
second and third place accordingly.
However, also notable was the fact that once the season had ended, many users
were still returning to the area to pursue other forms of recreation. The SCDNR’s
decision to close the roads seasonally were one of the best possible safeguards in
ensuring the Jocassee Gorges are not overly exhausted from visitor use.
Horsepasture Road—March through May
Week Monday Tuesday Wednesday Thursday Friday Saturday Sunday Total Rank March 20th-26th 21 7 11 21 22 33 52 167 5th March 27th-April 2nd 15 32 25 12 36 71 45 236 2nd April 3rd-9th 18 41 20 40 31 32 37 219 3rd April 10th-16th 31 30 23 28 129 94 25 360 1st April 17th-23rd 20 19 17 15 26 53 59 209 4th April 24th-30th 23 2 9 21 21 42 21 139 6th May 1st-7th 13 6 10 11 13 49 15 117 7th May 8th-10th 11 21 15 47 8th Total 152 158 130 148 278 374 254 1494 Table 3: Horsepasture Road traffic counter daily and weekly hit totals during March 20th through May 10th, 2006.
March-May—Shooting Tree Ridge Road
For the spring season, the roadside unit at Shooting Tree was deployed prior to
the gate opening on March 20 and then retrieved after the gate closed on May 10. Right
away, the first thing that caught my attention, was that the total for the entire spring
season, which was 670 hits, is not even half of the total, 1494 hits, from the Laurel Valley
area. The main reason for this, I feel, is because the Shooting Tree Ridge area is
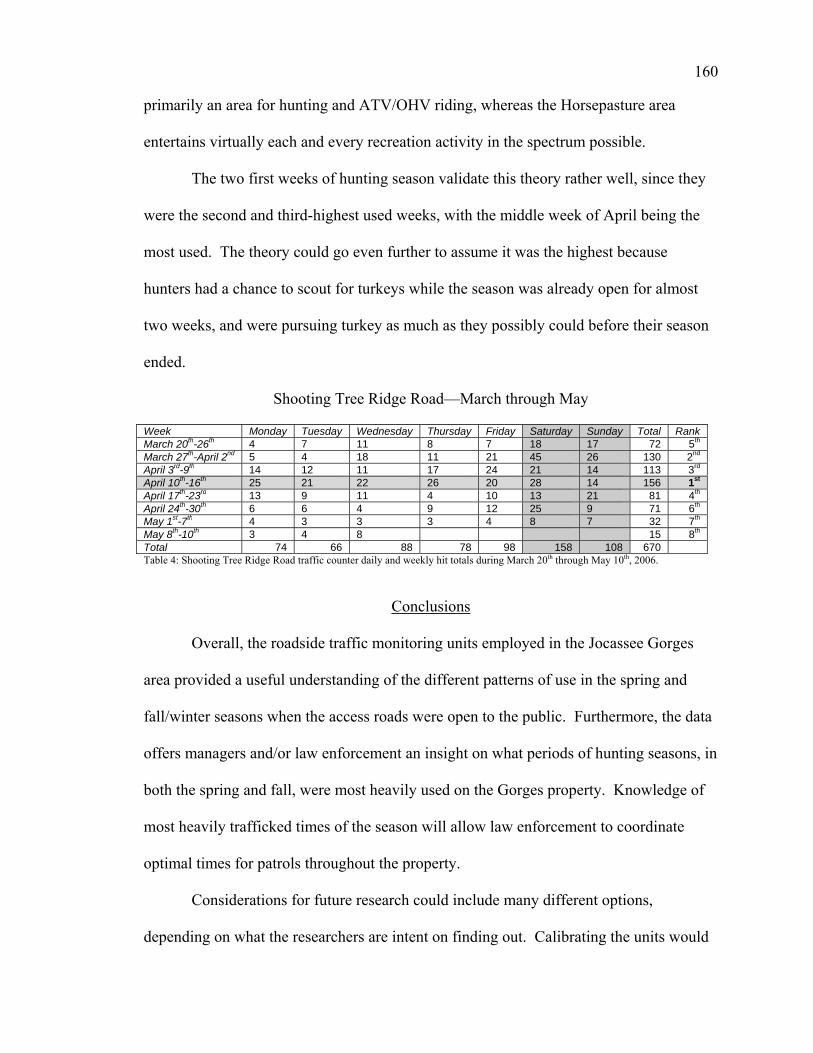
160
primarily an area for hunting and ATV/OHV riding, whereas the Horsepasture area
entertains virtually each and every recreation activity in the spectrum possible.
The two first weeks of hunting season validate this theory rather well, since they
were the second and third-highest used weeks, with the middle week of April being the
most used. The theory could go even further to assume it was the highest because
hunters had a chance to scout for turkeys while the season was already open for almost
two weeks, and were pursuing turkey as much as they possibly could before their season
ended.
Shooting Tree Ridge Road—March through May
Week Monday Tuesday Wednesday Thursday Friday Saturday Sunday Total Rank March 20th-26th 4 7 11 8 7 18 17 72 5th March 27th-April 2nd 5 4 18 11 21 45 26 130 2nd April 3rd-9th 14 12 11 17 24 21 14 113 3rd April 10th-16th 25 21 22 26 20 28 14 156 1st April 17th-23rd 13 9 11 4 10 13 21 81 4th April 24th-30th 6 6 4 9 12 25 9 71 6th May 1st-7th 4 3 3 3 4 8 7 32 7th May 8th-10th 3 4 8 15 8th Total 74 66 88 78 98 158 108 670 Table 4: Shooting Tree Ridge Road traffic counter daily and weekly hit totals during March 20th through May 10th, 2006.
Conclusions
Overall, the roadside traffic monitoring units employed in the Jocassee Gorges
area provided a useful understanding of the different patterns of use in the spring and
fall/winter seasons when the access roads were open to the public. Furthermore, the data
offers managers and/or law enforcement an insight on what periods of hunting seasons, in
both the spring and fall, were most heavily used on the Gorges property. Knowledge of
most heavily trafficked times of the season will allow law enforcement to coordinate
optimal times for patrols throughout the property.
Considerations for future research could include many different options,
depending on what the researchers are intent on finding out. Calibrating the units would

161
offer insight on exactly what type of vehicle and/or trailer may be entering the area, and
hence, uncover precisely what recreation activity is being sought. More units would
prove very useful at the Jocassee Gorges if the necessary funds could be made available
to the researchers since so many access points exist for the public’s use. South Carolina’s
excessively tight budget restraints for the SCDNR would most likely prevent their
procurement. The only alternatives would be to switch access roads covered with the
existing units or to consider alternative avenues of acquiring units, such as borrowing
from other state agencies, obtaining grants for more purchases, or imploring to the public
for financial assistance.
References
All photographs taken by Thomas C. Warren, 2005-2006.

162
Appendix H Telephone Survey

163
Jocassee Gorges Telephone Survey
1. We call the area north of SC 11 in Pickens and Oconee counties between Table Rock State Park and the Bad Creek Hydro Project and Lake Jocassee as the Jocassee Gorges Area, which is also known by such local names as the Horsepasture, Whitewater, Toxaway, Thompson, Laurel Fork, Camp Adger, Sassafras Mountain, Eastatoee Gorge, Franklin Gravely WMA and Musterground and other names. Are you familiar with this area? Yes/No 2. If YES, how did you find out about the Gorges? ________________________________________ 3. How well do you know the boundaries of the Jocassee Gorges? _____ Not at All _____ Somewhat _____ Fairly Well _____ Well 4. About how many miles do you live from the nearest boundary of the Jocassee Gorges? _____Miles 5. Have you used the Jocassee Gorges within the last 12 months? Yes/No If yes, proceed with survey, if no, skip to background characteristics.
Current Use 6. We would like to know how much you have used the South Carolina portion of the Jocassee Gorges within the last 12 months. Please estimate how many days within the last 12 months you have participated in any of the following activities within the boundaries of the Gorges: ACTIVITY DAYS
Day hiked on trails _____ 1-4, 5-8, 9-12, 13-16, 17-20, >20 Mountain biked _____ Drove ATV _____ Went Horseback Riding _____ Drove area to sightsee _____ Backpacked overnight _____ Went hunting _____ Went fishing _____ Canoed or kayaked _____ Motor-Boated on Lake Jocassee _____ Watched wildlife _____ Looked for wildflowers _____

164
Photographed nature _____ Visited waterfalls _____ Visited historic sites _____
OTHER: Please Specify _____________________________ 7. How many days do you think you might use the Jocassee Gorges within the next 12 months? _____ Days Past Use We now would like to know about your longer-term recreational use of the Jocassee Gorges. Please provide your best estimates. 8. How many years have you been using the Jocassee Gorges? _____ 1-4 _____ 5-8 _____ 9-12 _____ 13-16 _____ 17-20 ___________ >20 9. On average, about how many times per year have you been using the Jocassee Gorges for recreational use? _____ 1-4 _____ 5-8 _____ 9-12 _____ 13-16 _____ 17-20 ___________ >20 10. Can you remember the first year (date) you used the Jocassee Gorges? _____ Year 11. What were your primary and secondary activities for using the Gorges in the past? Primary: ___________________________ Secondary: _________________________ 12. If hunting and/or fishing were your main activities, what type of hunting and/or fishing (please list): ___________________ ___________________ ___________________ Use Patterns

165
13. What are the major areas or locations you visit within the Gorges? ___________________ ___________________ ___________________ 14. Could you tell us the months you use these areas the most? _______________________________________________________ (List months) 15. How many individuals, including yourself, are in a normal group visiting the Gorges? _____ Individuals 16. Do you normally visit Gorges with: _____ Friends _____ Family _____ Organized Group _____ By Yourself _____ With Dog 17. Would you say you use the Jocassee Gorges resource more, less, or about the same now that it is a DNR-managed area: _____ More _____ Less _____ About Same _____ Never Used Before DNR Managed Area 18. Has your recreation within the Jocassee Gorges changed over time? (If NO, skip to #21). _____ Yes _____ No 19. If so, in what way? _____ Frequency _____ Location _____ Type of activity _____ No. or members in party 20. What caused that change? ______________________________________________________________________ 21. Would you say you value your experience at the Jocassee Gorges more, less or about the same as other state-managed areas, such as state parks and Wildlife Management Areas (which are public hunting areas)? _____ More _____ Less _____ About Same _____ Does Not Apply

166
Background Characteristics 22. Birthdate (year born): In what year were you born: _____ Year 23. Sex: Are you male or female? _____ Male _____ Female 24. How many years of education do you have? _____ Less than high school _____ High school _____ Some college _____ Bachelor’s degree _____ Graduate degree _____ Doctoral degree 25. What type of work do you do? ___________ (specify) 26. What is the closest village or community to your home? _______________________ 27. How many total members, including yourself are in your household? _____ Number 28. How many of these individuals are under 18 years old? _____ Number 29. About what was your total household income, before taxes, for the 2004 tax year? _____< $20,000 _____ $21,000 - $40,000 _____ $41,000 - $60,000 _____ $61,000 - $80,000 _____ $81,000 - $100,000 _____ > $100,000 30. Are you a member of: a) a hunting or fishing organization ____________________________ (name) ____________________________ (name) b) a conservation organization ____________________________ (name) ____________________________ (name) c) other environmental organizations ____________________________ (name) ____________________________ (name)

167
31. What, if any, hunting, fishing, conservation, or environmental magazines do you commonly read? ____________________________ ____________________________ ____________________________ 32. What, if any, major things would you like to see changed about how the Jocassee Gorges is managed? ____________________________ ____________________________ 33. Any other comments you may have? _________________________________________________________________

168
Appendix I Occupations of On-Site Users

169
Occupation % of Jocassee Gorges Visitors
Agricultural Manager .4 Airport Services .4 Aquatic Biologist .4
Architect 1.2 Attorney 1.2
BMW Plant .4 Cardiologist .4
Chemical Worker .4 City Employee .8
Coach .4 Computer Science .8
Construction 10.2 Dentist 1.2
Disabled .4 Dockworker .4 Electrician .8
Electronics Technician .8 Endodontist .4
Engineer 4.1 Environmental Consultant .4
Finances .4 Framer .4
Glass Company .4 Golf Course Maintenance .4
Guidance Counselor .4 Hospital .8
Hotel Industry .4 Housewife 2.0
IBM .4 Industrial Maintenance 1.2 Industrial Supervisor 1.6
Investments .4 Journalist .4
Landscaping .4 Law Enforcement .8
Lifeguard .8 Logging/Sawmill .8
Machinist 2.9 Managerial 3.7
Manufacturing 2.0 Mechanic .4 Military .8
Natural Gas .4 None-Unemployed .4
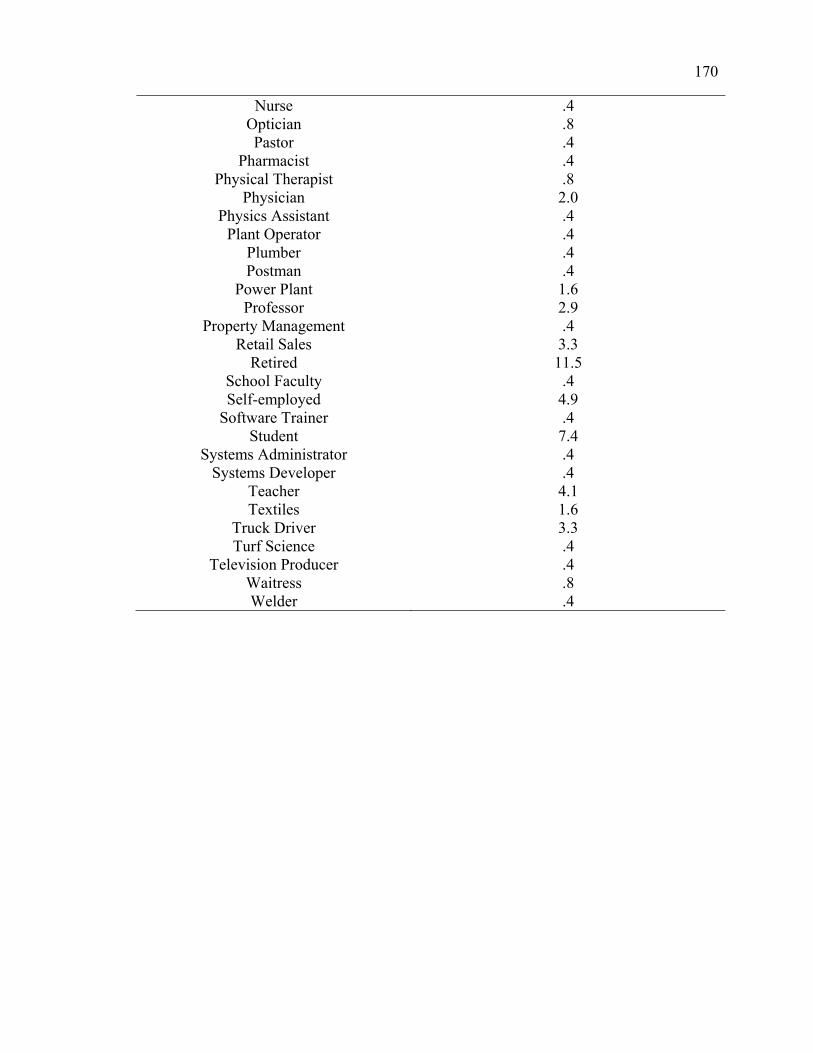
170
Nurse .4 Optician .8 Pastor .4
Pharmacist .4 Physical Therapist .8
Physician 2.0 Physics Assistant .4
Plant Operator .4 Plumber .4 Postman .4
Power Plant 1.6 Professor 2.9
Property Management .4 Retail Sales 3.3
Retired 11.5 School Faculty .4 Self-employed 4.9
Software Trainer .4 Student 7.4
Systems Administrator .4 Systems Developer .4
Teacher 4.1 Textiles 1.6
Truck Driver 3.3 Turf Science .4
Television Producer .4 Waitress .8 Welder .4

171
Appendix J SCDNR Map of the Jocassee Gorges
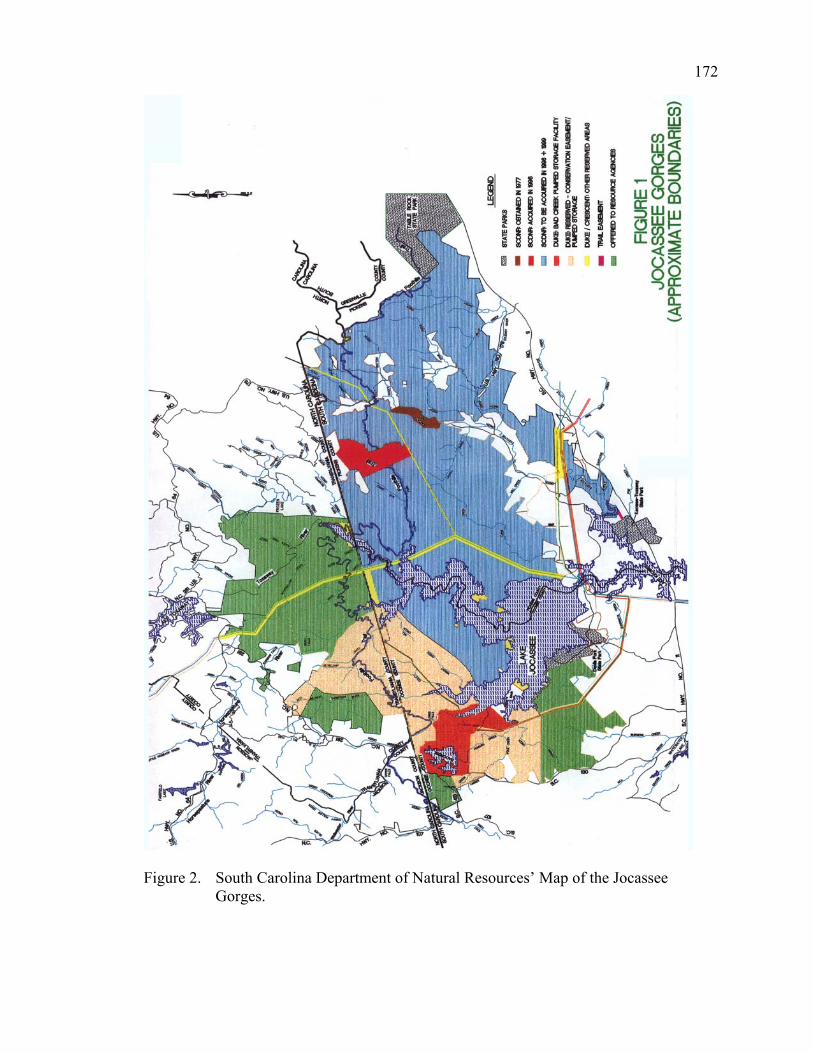
172
Figure 2. South Carolina Department of Natural Resources’ Map of the Jocassee Gorges.

173
Appendix K SCDNR Map of Access Points of Jocassee Gorges

174
Figure 3. South Carolina Department of Natural Resources’ Map of Access Points to the Jocassee Gorges.

175
Appendix L Zip Codes Used in Telephone Survey

176
Appendix L: Zip Codes Used in Telephone Survey. Rabun Cty. GA
Jackson Cty. NC
Transylvania Cty. NC
Greenville Cty. SC
Greenville Cty. SC
Oconee Cty. SC
Pickens Cty. SC
28717 28707 28704 28712 29654 28712 2871228741 28708 28708 28718 29656 28717 2874728763 28712 28712 28722 29657 28734 2877228904 28713 28715 28739 29661 28741 2877429658 28716 28716 28768 29662 28747 2961129664 28717 28717 28773 29667 28763 2961729676 28719 28718 28782 29669 28774 2962129686 28721 28723 28784 29670 29625 2962529691 28723 28729 28790 29671 29626 2962729693 28725 28732 29322 29673 29630 2963030523 28734 28736 29334 29677 29631 2963130525 28736 28739 29349 29680 29643 2963530537 28741 28742 29356 29681 29658 2964030545 28745 28747 29360 29682 29664 2964230546 28747 28766 29365 29683 29665 2965630552 28751 28768 29385 29685 29670 2965730562 28763 28772 29388 29687 29671 2966130568 28774 28774 29601 29688 29672 2966530571 28779 28783 29605 29690 29676 2966730576 28783 28786 29607 29692 29678 2966930581 28785 28790 29609 29697 29682 29670
28786 28791 29611 29685 29671 28789 29635 29615 29686 29672 29664 29661 29617 29689 29673 29676 29671 29621 29691 29676 29685 29676 29624 29693 29677 29686 29685 29625 29696 29678 30525 29626 30521 29682 30537 29627 30523 29683 29630 30525 29685 29631 30537 29689 29635 30538 29690 29638 30552 29697 29640 30553 29642 30557 29644 30568 29645 30576 29650 30577 29651 30598 30643
177
LITERATURE CITED
Andereck, K., Vogt, C., Larkin, K., & Freye, K. (2001). Differences Between Motorized and Nonmotorized Trail Users. Journal of Park and Recreation Administration, 19, 62-77. Boteler, F. (1986). Eastern/Western Wildernesses Use and Users. Wilderness and Natural Areas in the Eastern United States. 212-217.
Burch, W., Jr. (1964). Two Concepts for Guiding Recreation Decisions. Journal of Forestry, 62, 707-12. Burger, J. (2000). A Comparison of On-site Hunters, Sportsmen, and the General Public about Recreational Rates and Future Land Use Preferences for the Savannah River Site. Journal of Environmental Planning and Management, 43, 221-233. Cole, D. (2001). Visitor Use Density and Wilderness Experiences: A Historical Review of Research. U.S. Forest Service Proceedings RMRS-P-20. 11-20. Cole, D. (2001a.). Day Users in Wilderness: How Different Are They? U.S. Forest Service: Rocky Mountain Research Station. RMRS-RP-31. 29 p.
Cole, D. (1993). Wilderness Recreation Management. Journal of Forestry, 91, 22- 24.
Cole, D. (1994). The Wilderness Threats Matrix: A Framework for Assessing Impacts. U.S. Forest Service: Intermountain Research Station. INT-RP-475. 14 p.
Cole, D., Watson, A., & Roggenbuck, J. (1995). Trends in Wilderness Visitors and Visits: Boundary Waters Canoe Area, Shining Rock, and Desolation Wildernesses. U.S. Forest Service: Intermountain Research Station. INT-RP- 483. 38 p.
Cole, D., Watson, A., Hall, T., & Spildie, D. (1997). High Use Destinations in Wilderness: Social and Biophysical Impacts, Visitor Responses, and Management Options. U.S. Forest Service: Intermountain Research Station. INT-RP-496. 30 p.
Daigle, J., Watson, A., & Haas, G. (1993). National Forest Trail Users: Planning for Recreational Opportunities. U.S. Forest Service: Northeastern Forest Experiment Station.
178
Daigle, J., Hrubes, D., & Ajzen, I. (2002). A Comparative Study of Beliefs, Attitudes, and Values Among Hunters, Wildlife Viewers, and Other Outdoor Recreationists. Human Dimensions of Wildlife, 7, 1-19. Douglass, R. W. (2000). Forest Recreation. Ohio State University: Waveland Press, Inc. Gaddy, L.L. (1998). A Preliminary Investigation of the Natural Significance of the Jocassee Tract. Westminster, SC: South Carolina Forest Watch & Greenville, SC: Naturaland Trust. Hammitt, W., & Cole, D. (1998). Wildland Recreation: Ecology and Management. New York: John Wiley & Sons, Inc.
Hammitt, W., Backlund, E., & Bixler, R. (2004). Experience Use History, Place Bonding and Resource Substitution of Trout Anglers During Recreation Engagements. Journal of Leisure Research, 36, 356-378. Hammitt, W., & Rutlin, W. (1995). Wilderness Visitors, Use Patterns, and Wilderness Privacy in the Ellicott Rock Wilderness. Clemson University: Parks, Recreation, and Tourism Management Department. Heberlein, T., & Kuentzel, W. (2002). Too Many Hunters or Not Enough Deer? Human and Biological Determinants of Hunter Satisfaction and Quality. Human Dimensions of Wildlife, 7, 229-250. Hendee, J.C., Catton, W.R. Jr., Marlow, L.D., & Brockman, C.F. (1968). Wilderness Users in the Pacific Northwest—Their Characteristics, Values, and Management Preferences. U.S. Forest Service: Pacific Northwest Forest and Range Experiment Station, Portland, Oregon.
Hendee, J., & Dawson, C. (2002). Wilderness Management: Stewardship and Protection of Resources and Values. Colorado: Fulcrum Publishing. Hollenhorst, S., & Jones, C. (2001). Wilderness Solitude: Beyond the Social- Spatial Perspective. U.S. Forest Service Proceedings RMRS-P-20. 56-61. Hunt, L., Haider, W., & Armstrong, K. (2002). Understanding the Fish Harvesting Decisions by Anglers. Human Dimensions of Wildlife, 7, 75-89. Knopf. R, & Lime, D. (1984). A Recreation Manager’s Guide to Understanding River Use and Users. U.S. Forest Service General Technical Report WO- 38.
Leung, Y., & Marion, J. (1999). Spatial Strategies For Managing Visitor Impacts in National Parks. Journal of Park and Recreation Administration, 17:4, 20- 38.
179
Lewis, C. J. (2001). Small Mammal Communities in White Pine Plantations in the Jocassee Gorges of South Carolina. Clemson University: Department of Zoology.
Loomis, J. (2000). Counting on Recreation Use Data: A Call for Long-Term Monitoring. Journal of Leisure Research, 32, 93-96. Manning, R. (1999). Studies in Outdoor Recreation: Search and Research for Satisfaction. Corvallis: Oregon State University Press.
Manning, R. (2001). Visitor Experience and Resource Protection: A Framework for Managing the Carrying Capacity of National Parks. Journal of Parks and Recreation Administration, 19, 93-108. Manning, R., Lime, D., Freimund, W., & Pitt, D. (1996). Crowding Norms at Frontcountry Sites: A Visual Approach to Setting Standards of Quality. Leisure Sciences, 18, 39-59.
Marion, J., & Leung. Y. (2001). Trail Resource Impacts and An Examination of Alternative Assessment Techniques. Journal of Park and Recreation Administration, 19, 17-37. Plumley, H.J., Peet, H.T., & Leonard, R.E. (1978). Records of Backcountry Use Can Assist Trail Managers. U.S. Forest Service Research Paper: Northeastern Forest Experiment Station.
Rankin, D. M. (1998). Resource Management Plan for Jocassee Gorges Property, Oconee and Pickens Counties, South Carolina. South Carolina Department of Natural Resources-Wildlife and Freshwater Fisheries Division. Roggenbuck, J., & Watson, A. (1988). Wilderness Recreation Use: The Current Situation. U.S. Forest Service: Research Social Scientist Intermountain Research Station, Missoula, MT. INT 4901 Publication #191. 346-356. Shelby, B., Vaske, J., & Donnelly, M. (1996). Norms, Standards, and Natural Resources. Leisure Sciences, 18, 103-23.
Stewart, W., & Cole, D. (2003). On the Prescriptive Utility of Visitor Survey Research: A Rejoinder to Manning. Journal of Leisure Research, 35, 119-127.
The Countryside Commission for Scotland. (1983). Recreation Site Survey Manual. New York: E. & F. N. Spon Ltd.
Watson, A., Williams, D., Roggenbuck, J., & Daigle, J. (1992). Visitor Characteristics and Preferences for Three National Forest Wildernesses in the South. U.S. Forest Service: Intermountain Research Station. RP-INT-455.

180
Watson, A., Hendee, J. & Zaglauer, H. (1996). Human Values and Codes of Behavior: Changes in Oregon’s Eagle Cap Wilderness Visitors and Their Attitudes. Natural Areas Journal, 16, 89-93. Watson, A., & Niccolucci, M. (1995). Conflicting Goals of Wilderness Management: Natural Conditions vs. Natural Experiences. U.S. Forest Service General Technical Report PSW-156. Winter, P., Palucki, L., & Burkhardt, R. (1999). Anticipated Responses to a Fee Program: The Key is Trust. Journal of Leisure Research, 31, 207-226. Zinn, H., Manfredo, M., & Barro, S. (2002). Patterns of Wildlife Value Orientations in Hunters’ Families. Human Dimensions of Wildlife, 7, 147-162.